Abstract
Detecting neurological abnormalities such as brain tumors and Alzheimer’s disease (AD) using magnetic resonance imaging (MRI) images is an important research topic in the literature. Numerous machine learning models have been used to detect brain abnormalities accurately. This study addresses the problem of detecting neurological abnormalities in MRI. The motivation behind this problem lies in the need for accurate and efficient methods to assist neurologists in the diagnosis of these disorders. In addition, many deep learning techniques have been applied to MRI to develop accurate brain abnormality detection models, but these networks have high time complexity. Hence, a novel hand-modeled feature-based learning network is presented to reduce the time complexity and obtain high classification performance. The model proposed in this work uses a new feature generation architecture named pyramid and fixed-size patch (PFP). The main aim of the proposed PFP structure is to attain high classification performance using essential feature extractors with both multilevel and local features. Furthermore, the PFP feature extractor generates low- and high-level features using a handcrafted extractor. To obtain the high discriminative feature extraction ability of the PFP, we have used histogram-oriented gradients (HOG); hence, it is named PFP-HOG. Furthermore, the iterative Chi2 (IChi2) is utilized to choose the clinically significant features. Finally, the k-nearest neighbors (kNN) with tenfold cross-validation is used for automated classification. Four MRI neurological databases (AD dataset, brain tumor dataset 1, brain tumor dataset 2, and merged dataset) have been utilized to develop our model. PFP-HOG and IChi2-based models attained 100%, 94.98%, 98.19%, and 97.80% using the AD dataset, brain tumor dataset1, brain tumor dataset 2, and merged brain MRI dataset, respectively. These findings not only provide an accurate and robust classification of various neurological disorders using MRI but also hold the potential to assist neurologists in validating manual MRI brain abnormality screening.
Keywords: Brain MRI, Pyramid and fixed-size patch feature extraction, HOG, Biomedical image processing, Computer vision
Introduction
Using computerized imaging techniques for assisted medical diagnosis or as an automated second reader is becoming more crucial in medical image analysis [1]. Various imaging modalities such as ultrasound scan (US), magnetic resonance imaging (MRI), computed tomography (CT), or nuclear medicine are widely used by medical professionals [2, 3]. These methods are non-invasive and are usually the preferred investigation, coupled with a blood test, in many diseases [4]. However, these imaging methods produce a large amount of data [5]. Traditionally, these data are assessed qualitatively by radiologists or clinicians by looking at semantic features. Nowadays, computer-assisted automatic or semi-automatic diagnosis is made possible due to the development of advanced imaging and artificial intelligence techniques [6]. This enabled the development of a more efficient and accurate diagnosis system. Many computer-aided diagnosis systems have been proposed for classifying neurological disorders using MRI [7–9]. MRI are widely used to diagnose various neurological diseases such as brain tumors, Alzheimer’s, and brain trauma [10, 11]. Brain-related diseases can be diagnosed using medical images by specialist radiologists or clinicians [12].
Artificial intelligence-based systems are frequently utilized in the classification of MRI [13, 14]. In the literature, two main approaches are commonly employed: (i) feature-based classification and (ii) deep learning-based classification [15, 16]. Feature-based classification involves image pre-processing, feature extraction, feature selection, and classification methods applied to MRI. While feature-based approaches have low computational complexity, they often yield lower accuracy rates. In contrast, deep learning-based methods, despite being computationally complex and time-consuming, have gained significant attention due to their ability to achieve high classification performance [15]. Neurological imaging is a hot research area, with deep learning models achieving high classification accuracies. However, these models require large datasets and have high time complexities. In contrast, hand-modeled learning models have lower complexities but struggle to generate high-level features and achieve high classification performance. To address this, we propose an effective hand-modeled computer vision method inspired by the vision transformer (ViT) [17] architecture. Our approach combines fixed-sized patches and compression, leveraging both convolutional neural networks (CNN) and ViT architectures. The primary goal of our proposed pyramid and fixed-size patch (PFP) architecture is to achieve high classification accuracy with a reduced time burden.
We present the details of our PFP-based model, demonstrating its high classification ability using a merged dataset. Notably, recent models like ViT and multi-layer perceptron (MLP)-mixer [18] have shown strong image classification performance using fixed-sized patches, which we incorporated into our architecture. Additionally, we leveraged decomposition techniques to create high-level features inspired by CNN. The histogram of oriented gradient (HOG) feature creation function is employed to illustrate the effectiveness of our PFP architecture, extracting distinctive information from brain images. To select clinically appropriate features efficiently, we employed the IChi2 feature selector, an iterative version of the fast Chi2 function. Lastly, we employ the k-nearest neighbor (kNN) algorithm as a distance-based shallow classifier to enhance classification ability in our proposed PFP-HOG brain image classification method. This work introduced significant novelties and contributions. A large-scale merged dataset was constructed, consisting of 16,566 brain images across eight classes, enabling the classification of diverse neurological disorders using MRI. To the best of our knowledge, we are the first to use such a comprehensive brain dataset with eight classes. We compiled the dataset by merging three publicly available datasets. The proposed PFP hand-modeled feature engineering architecture demonstrated promising results. The combination of HOG directional feature extraction, IChi2 feature selection, and the kNN classifier achieved over 94% accuracy for all datasets. Notably, the PFP-HOG model achieved an impressive 97.80% accuracy rate on the merged dataset, demonstrating its efficiency and accuracy in classifying neurological disorders using MRI.
Literature Review
Biomedical image classification propelled by artificial intelligence has emerged as a prominent domain of investigation within the scientific literature. Particularly, the study of MRI classification, an instrumental technique employed in the diagnosis of neurological disorders, has garnered substantial attention. Several studies have made significant progress in detecting and segmenting brain tumors. Bahadure et al. [19] employed image pre-processing techniques, including enhancement and segmentation of white matter, gray matter, and cerebrospinal fluid. They used feature extraction and SVM classification on a dataset of 201 samples with 96.51% accuracy. However, the limitation was the small dataset size. In another study, Lahmiri [20] focused on glioma detection using image segmentation with fractional-order particle swarm optimization and directional spectral distribution. Support vector machine (SVM) classification achieved an impressive accuracy of 99.18% using a dataset of 50 samples. Again, the study highlighted the limitation of a small dataset. Gudigar et al. [21] aimed to detect various brain pathologies using image decomposition and higher-order spectral analysis for feature extraction. SVM classification on a dataset of 612 samples achieved an accuracy of 90.68%. The study also acknowledged the limitation of a small dataset. Ahmed et al. [22] developed a method for detecting Alzheimer’s disease using the hippocampus region. They used axial, coronal, and sagittal views to create patches and employed a custom-designed CNN for classification. Dataset 1 had 352 samples (2 classes used) with an accuracy of 85.55%. Dataset 2 used 326 samples (2 classes used) and reported an accuracy of 90.05%. However, the study faced limitations due to small dataset sizes, high complexity, and relatively lower accuracy. In addition, although dataset 1 contained 3 classes and dataset 2 comprised of 4 classes, only 2 classes were used for testing. Nayak et al. [23] conducted a study on the classification of brain abnormalities, including degenerative disease, brain tumor, brain stroke, infectious disease, and normal brain. The study employed image decomposition using the fast curvelet transform, feature extraction using Tsallis entropy, and classification using the random vector functional link. The study utilized two datasets. Dataset 1 consisted of 75 samples with 5 classes, representing different types of brain abnormalities. Dataset 2 had 200 samples with 2 classes, focusing on abnormal versus normal brain classification. They achieved an accuracy of 97.33% for dataset 1 and 94/0% for dataset 2. Talo et al. [24] developed a method for detecting the presence or absence of various brain pathologies using data augmentation and a ResNet34-based CNN. The study achieved a perfect accuracy of 100.0% on a dataset of 613 samples. The most important limitation of this study is the need for big data. Therefore, data augmentation was performed. Gudigar et al. [25] conducted a study on the detection of the presence or absence of various pathologies in the brain, including fatal stroke, sarcoma, Alzheimer’s disease, and multiple sclerosis. The study utilized a dataset consisting of 612 samples with 2 classes representing the presence or absence of pathology. The achieved accuracy was 97.38%. Although the dataset contains multiple pathologies, they were grouped into a single class, and binary classification was performed in this study. In their study, Acharya et al. [26] proposed a comprehensive approach to Alzheimer’s disease detection. Their method involved applied image pre-processing techniques, such as the median filter, to enhance the images. Various transforms, including contourlet, curvelet, complex wavelet, dual-tree complex wavelet, discrete wavelet, empirical wavelet, and shearlet transform, were utilized for feature extraction. They employed Student’s t-test for feature selection and utilized the k-nearest neighbor (kNN) algorithm for classification. Their method achieved a high accuracy of 98.48% in distinguishing the two classes. The study used a single dataset and its size is small. Koh et al. [27] proposed an approach for Alzheimer’s disease detection, involving image pre-processing, image decomposition, feature extraction, feature selection, and classification using SVM and random forest algorithms. The study achieved an accuracy of 93.90% on a dataset of 165 samples. In this work, relatively lower classification performance was achieved compared to other studies using the same dataset. Mehmood et al. [28] developed a method for the classification of Alzheimer’s disease based on different stages using image pre-processing, data augmentation, and a custom-designed CNN. Their study achieved an impressive accuracy of 99.02% on a dataset of 382 samples. However, the study has limitations related to the small dataset size and the high complexity involved in the classification task. In addition, a data augmentation technique was used to train the CNN with sufficient data. Ghassemi et al. [29] conducted a study on the classification of brain tumor types, including meningioma, glioma, and pituitary tumors. The study comprised image pre-processing with normalization followed by data augmentation techniques. A generative adversarial network (GAN) and a custom-designed CNN were deployed for the classification task. The authors obtained a classification accuracy of 95.60%. However, the computational complexity of the proposed method is high. Afshar et al. [30] employed a Bayesian capsule network (BayesCap) for the classification of brain tumor types. The study achieved an accuracy of 73.6% on a dataset of 3064 samples. The method proposed in this study demonstrated low classification success. Moreover, the method has high computational complexity. Poyraz et al. [31] developed a method for the classification of brain disorders using segmented and resized brain images, exemplar division, deep feature extraction with MobileNetV2, iterative neighborhood component analysis (NCA) for feature selection, and SVM for classification. Their study achieved an impressive accuracy of 99.10% on a dataset of 444 samples. El-Latif et al. [32] proposed an approach for Alzheimer’s disease classification utilizing data augmentation and a custom-designed CNN. Their method achieved an impressive accuracy of 95.93% on a dataset comprising 2240 images. Deep networks have high computational complexity, and these methods require a lot of data. Muezzinoglu et al. [33] developed a comprehensive method for brain tumor classification. Their approach involved patch division, deep feature extraction using ResNet50, feature selection using NCA, Chi2, and ReliefF, classification with kNN, and an iterative majority voting scheme. They achieved a high accuracy of 95.93% on a dataset of 3264 MRI. However, the study faced challenges due to the complexity of the proposed method, which involved multiple steps and algorithms. Gupta et al. [34] proposed a study on the classification of brain tumor types, including glioblastoma multiforme (GBM), meningioma, pituitary tumor, and healthy control. The study consisted of data augmentation with GAN, feature extraction with InceptionResNetV2, and random forest tree steps. They achieved a classification accuracy of 98%. In this study, both data augmentation and computational complexity of the methods used are the notable limitations.
Most of the studies in the literature have used deep learning methods with many datasets. Although deep learning approaches have obtained the highest classification performances in classifying neurological disorders, they have high computational complexity. Furthermore, the models proposed in the literature are restricted to a specific disease. In other words, no unified approach can automatically classify different conditions. The literature gap of this work is given below.
Most of the datasets used are small. Therefore, the results obtained using these models cannot be generalized on these small datasets. Furthermore, the used dataset contains two or three classes. To overcome this gap, the datasets can be merged.
The previously used feature engineering methods were tested on small datasets. They used a limited number of features since the presented feature engineering models cannot reach high classification performance on big image datasets.
Deep learning models (especially well-known CNNs or customized CNNs) were used to get high classification performance on the medical image datasets. However, the complexities of the CNNs (in the training phase) are very high.
The results were given for a limited number of classes. Therefore, the classification accuracies of these models cannot be generalized. Studies in the literature often focus on binary classification (disease/healthy). But much more is needed to aid the neurologists in their diagnosis. In this work, a model that can automatically interpret up to 8 classes has been developed to provide a general solution.
This study proposes an accurate robust model to detect various neurological disorders using MRI. The proposed method is validated using four public datasets. In addition, we have created a merged dataset by deploying the used datasets. In this work, we have reported the results of our model for single datasets and the merged dataset. We have proposed a feature engineering architecture to propose an option for deep learning models. This model uses both pyramidal and patch-based feature extraction models to get both local and global features at high and low levels.
Proposed Model
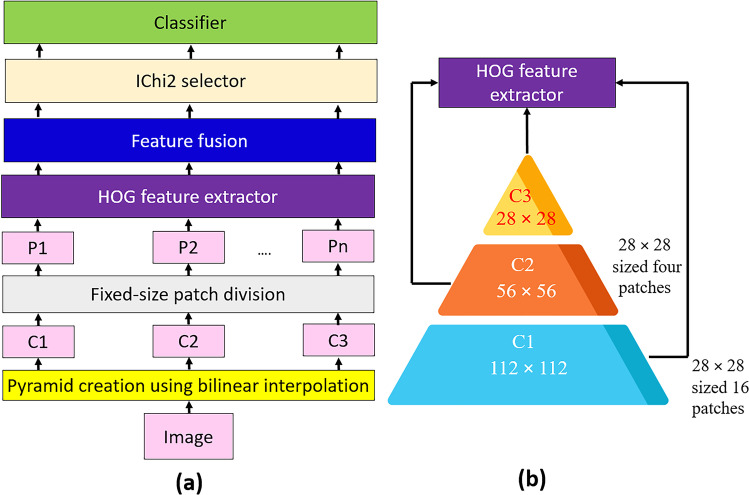
A novel feature extraction architecture, PFP involving a widely known feature extractor (HOG), is used. Also, a new hand-modeled learning method is suggested using the presented PFP-HOG feature extractor. The proposed hand-modeled learning method has three fundamental steps: feature creation using PFP-HOG, feature selection using IChi2, and classification. The graphical explanation of this method is illustrated in Fig. 1.
Fig. 1.
Graphical illustration of the proposed PFP-HOG-based learning model: a model overview and b PFP-HOG feature generator
Figure 1 illustrates a graphical explanation of the proposed PFP-HOG-based learning model. In the first step, the image is loaded and resized to 112 × 112 to create C1 (the first compressed image). Then, the image is resized to 56 × 56- and 28 × 28-sized images to develop levels of the pyramid (C2 and C3). The created C1, C2, and C3 images are divided into 28 × 28 patches; hence, 21 patches (P1, P2, …, P21) are obtained. By deploying the HOG extractor, 21 feature vectors are created with a length of 144. In the feature fusion phase, the generated 21 feature vectors are concatenated, and a feature vector with a length of 3024 is calculated. IChi2 is applied to this feature vector, and the most clinically informative features are selected for this work. Finally, the chosen features are fed to the kNN classifier. More details about the proposed PFP-HOG and IChi2-based learning model are given below.
Feature Extraction
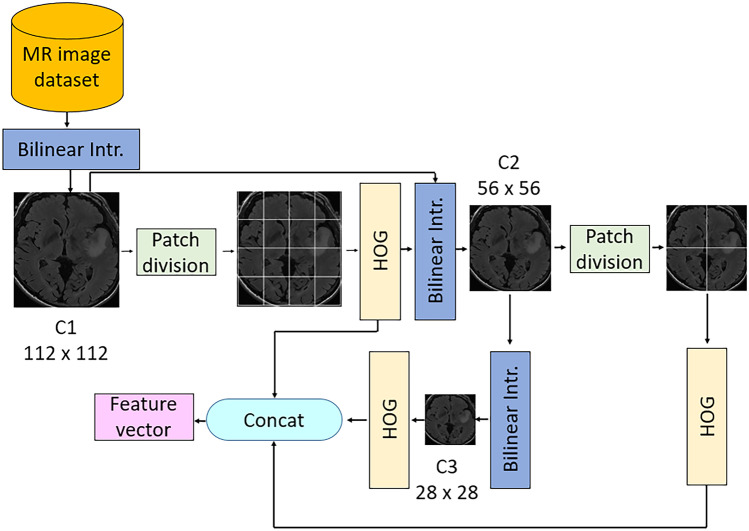
The main contribution of this work is the proposed PFP feature generation model, as shown in Fig. 1. This phase uses the HOG feature extractor as the main feature generator. The primary purpose of the proposed PFP architecture is to create more informative features using handcrafted feature generators. The overview of our feature extraction phase is given in Fig. 2.
Fig. 2.
Outline of our PFP-HOG feature extraction model. Herein, Bilinear Intr. defines bilinear interpolation
The steps of this feature generation architecture are given below.
Step 1
Create levels of the pyramid using bilinear interpolation. Herein, the input image is resized to 112 × 112-, 56 × 56-, and 28 × 28-sized images to obtain the first, second, and third levels of the pyramid. This step is parametric, and users can choose variable sizes and the number of levels.
| 1 |
Herein, is a bilinear interpolation function, is the original image, and defines compressed images.
Step 2
Divide the image into fixed-sized patches of 28 × 28. Herein, 16 patches are obtained from 112 × 112-sized images, four patches are created from 56 × 56-sized images, and one patch is obtained from 28 × 28-sized images. Twenty-one patches are obtained in this step for this work. The proposed architecture is parametric, and variable sizes of images and patches can be used. The patch creation process is depicted below.
| 2 |
| 3 |
| 4 |
Step 3
The HOG feature extractor is applied to each patch to create histogram-based features [35]. HOG is a shape detector and uses local gradients to detect the shape of an object. To extract features, vertical and horizontal gradients are calculated. The directions and magnitude of each gradient are calculated as follows.
| 5 |
| 6 |
Herein, is the magnitude, is the direction, is horizontal gradient, and defines vertical gradients. Herein, 28 × 28-sized images are utilized as input of the HOG extractor.
| 7 |
where is the extracted ith feature vector, is the HOG feature extraction function, represents the ith patch with a size of 28 × 28. HOG extracts 144 features from a patch with a size of 28 × 28.
Step 4
Merge the extracted feature vectors to obtain the final feature vector.
| 8 |
Herein, defines the merged/fused features with a length of 3024 (= 144 × 21), and Eq. (8) defines the feature merging process.
These four steps (see Step 1, Step 2, Step 3 and Step 4) are defined by the proposed PPF-HOG feature generation.
Feature Selection
In the feature selection phase, the most discriminative/informative features are selected using an iterative feature selector. In this phase, the Chi2 selector is used, one of the fastest feature selectors in the literature. However, the Chi2 selector cannot automatically select the optimal number of features. Therefore, iterative Chi2 (IChi2) [36] is used to solve this problem. IChi2 selector is a parametric method, and the parameters used are as follows. The used parameters are the range of iteration and loss value calculator. In this work, the iterative feature selection process is initialized from 50 to 1000. Therefore, 951 feature vectors are selected in this process, and 951 error rates are calculated. Herein, a kNN classifier is selected as the error rate generator [37]. Then, the optimal feature vector is selected using the calculated loss values. This phase selects the minimum loss-valued feature vector as the optimal feature vector.
Step 5
Choose the optimal feature vector by applying the IChi2 feature selector. In this work, kNN is used as a loss value generator. Herein, k is selected as one, a distance metric is Manhattan, and tenfold cross-validation is employed.
Classification
The last phase of our proposed PFP-HOG-based model is classification. Again, a shallow classifier has been used to denote our proposed method’s high and general classification ability. In this work, we have used kNN and attributes of the used kNN classifier are given in the “Feature Selection” section since it has used both the error value generator of IChi2 and the classifier. The results are obtained using the tenfold cross-validation technique. Moreover, the last step of the proposed PFP-HOG model is given in below.
Step 6
Obtain results using the kNN classifier with tenfold cross-validation.
Dataset
Brain disorders have been diagnosed using MRIs by radiologists. The commonly seen brain disorders are brain tumors and Alzheimer’s disorders (AD). To automatically detect these ailments, datasets have been collected and published publicly for developing ML models. In this section, details of the used AD and brain tumor datasets have been explained. These datasets are named AD and brain tumor dataset 1, brain tumor dataset 2, and merged dataset. These datasets are open-source datasets and can be downloaded from Kaggle and Wiki archive websites. They are briefly explained below.
Alzheimer’s Disease (AD) Dataset
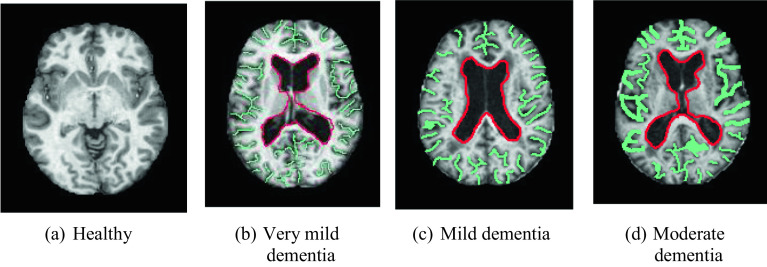
AD dataset is a widely used brain MR image dataset. It consists of four classes, and they are moderate dementia (64 images), mild dementia (896 images), very mild dementia (2240 images), and healthy (3200 images). This dataset has 6400 brain MR images [38]. AD disease was detected using axial sequences T1 weighted (W) from brain MRI (see Fig. 3).
Fig. 3.
Sample images of the AD dataset
MR images of healthy, very mild, mild, and moderate dementia diseases are shown in Fig. 3. The green lines indicate the brain convolutions and the red lines show the ventricular region. When dementia develops, the brain volume decreases, and the spacing between the brain gyrus widens (the areas outlined in green are widening). It also enlarges in the ventricular system (the area in red enlarges). For this dataset, the used iterative feature selector selected 103 features. Thus, we obtained a 6400 × 103-sized feature matrix.
Brain Tumor Dataset 1
This is the brain tumor MRI dataset. It contains four classes: glioma (926), meningioma (937), healthy (500), and pituitary lesions (901). In total, there are 3264 images present in this dataset [39, 40]. Meningioma detection was done using T1W images with axial and sagittal contrast. Pituitary gland tumors were detected in contrast-enhanced T1W images from pituitary MRI in sagittal, axial, and coronal planes. Axial and sagittal plane T2W and T2 FLAIR MRI were used in the healthy group (Fig. 4).
Fig. 4.
Sample of brain MR images in each class of dataset 1
As can be seen from Fig. 4, there are four classes in the dataset. Areas drawn in green on brain MR images indicate diseased areas. In this dataset, we used IChi2 to select the most informative 571 features from each image. Therefore, we obtained a 3264 × 571-sized feature matrix.
Brain Tumor Dataset 2
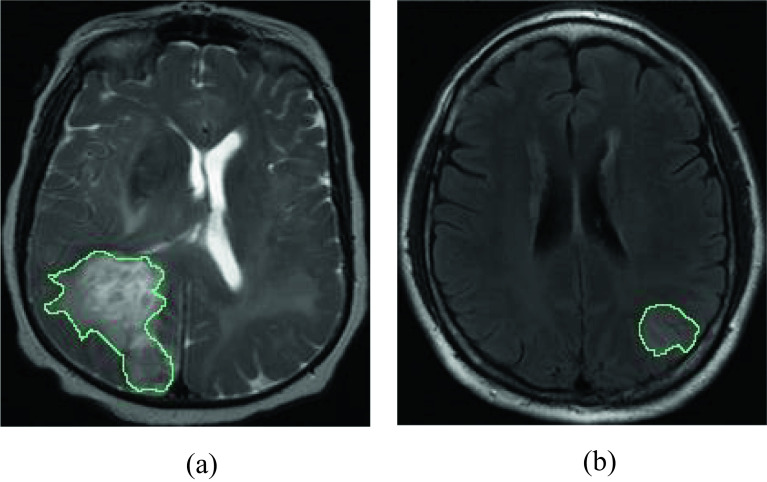
This is the third dataset used in this work which consists of subtypes of brain glioma: Glioblastoma (GBM) [41, 42] and Low-grade gliomas (LGGs) [43]. This dataset is public and can be downloaded using https://wiki.cancerimagingarchive.net/. We have used T2-weighted MR images in this work. This dataset contains 8328 images (GBM = 4286 and LGG = 4042). Low-grade gliomas were detected using T2 FLAIR sequences in the axial and sagittal planes. GBM was obtained using T2-weighted (W) sequences in the axial plane. The sample images of this dataset are denoted in Fig. 5.
Fig. 5.
Sample of images in dataset 3: a GBM and b LGG
The third dataset used in the study includes GBM and LGG brain tumor types. IChi2 is used to select 496 features from each image, generating an 8328 × 496-sized feature matrix.
Merged Dataset
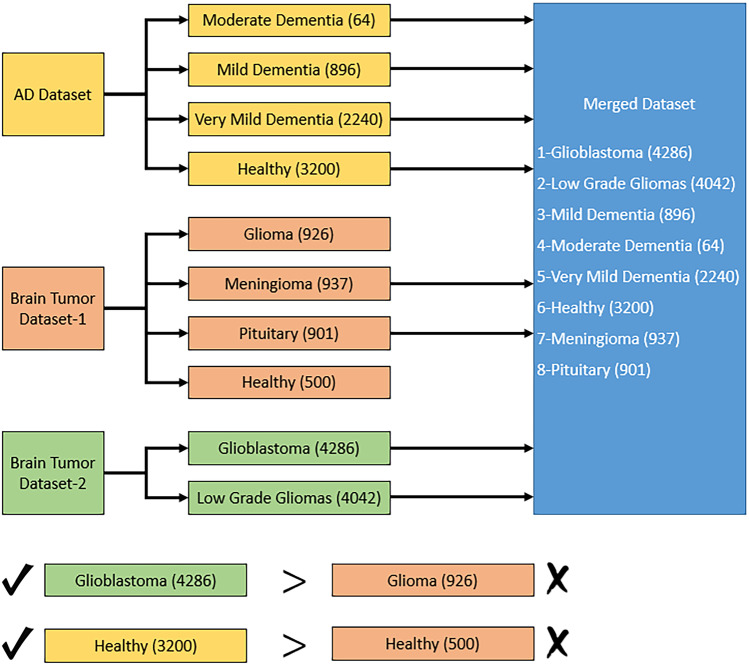
This dataset consists of a combination of AD, brain tumor, and brain glioma MR image datasets. This dataset has eight categories, and it is named the merged dataset. It consists of glioblastoma (4286), low-grade gliomas (4042), mild dementia (896 images), moderate dementia (64 images), very mild dementia (2240 images), and healthy (3200 images), meningioma (937), and pituitary (901) images. In total, this dataset has 16,566 MR images belonging to eight classes. The only criterion applied in the merged dataset creation phase is that the dataset has different classes. Therefore, different classes in each dataset were considered and the samples were combined to obtain 8 classes. A block diagram summarizing this process is given in Fig. 6.
Fig. 6.
Overview of the merged dataset creation phase
As shown in Fig. 6, different classes in each dataset were used directly. However, “glioma” class in brain tumor dataset 1 and “glioblastoma” in brain tumor dataset 2 are examples of the same brain disease. Therefore, the images from the dataset with the highest number of samples (brain tumor dataset 2) were considered. The similar situation is also valid for the healthy class. Images from the AD dataset were used for this class. This procedure resulted in a total of 16,566 images and 8 classes. After that, we used IChi2 to choose 972 features for this dataset and obtained a 16,566 × 972-sized feature matrix for classification.
Results
Experimental Setup
MATLAB (2020b) programming environment was used to implement the proposed PFP-HOG and IChi2-based computer vision model using a simple configured computer. This computer has 32-GB RAM, 4.3-GHz CPU, 8-core, and Windows 11 OS. The proposed PFP-HOG and IChi2-based learning model is a parametrical model, and the parameters used for this work are given in Table 1.
Table 1.
Parameters used for our proposed work
| Phase | Parameter | Value |
|---|---|---|
| Feature extraction | The sizes of the images for the pyramid |
Level 1: 112 × 112 Level 2: 56 × 56 Level 3: 28 × 28 |
| Size of the exemplar | 28 × 28 | |
| Number of the exemplar | 21 | |
| Feature extraction function | HOG | |
| Feature selection | Feature selection function | Chi2 |
| Range of iteration | [50–1000] | |
| Error value generator | kNN with tenfold CV | |
| Classification | Classifier | kNN |
| K | 1 | |
| Distance | City block | |
| Voting | Equal | |
| Validation | tenfold cross-validation |
The proposed PFP-HOG model is validated using four datasets to obtain the results. These datasets are Alzheimer’s disease (AD), brain tumor datasets (two brain tumor datasets), and merged MRI datasets. Four datasets have been used to illustrate the general classification ability of our proposed method. The datasets used are discussed in the “Feature Extraction” section.
Results
The proposed PFP-HOG model is a hand-modeled computer vision model. Thus, there is no need to use expensive hardware, and we used a simple configured computer. Four MRI datasets have been used to obtain the performance rates of the proposed PPF-HOG and IChi2-based learning model. The performance parameters, namely accuracy, precision, recall, and F1-score, have been used [44, 45]. The mathematical denotations of the used performance evaluation metrics are given below.
| 5 |
| 6 |
| 7 |
| 8 |
where , , and are the number of true positives, true negatives, false positives, and false negatives consecutively.
In the validation, we used a tenfold CV. The summary of overall results obtained using the kNN classifier with ten-fold cross-validation is shown in Table 2.
Table 2.
Summary of overall results obtained using kNN classifier with tenfold cross-validation
| Metric | AD | Brain tumor 1 | Brain tumor 2 | Merged dataset |
|---|---|---|---|---|
| Accuracy (%) | 100 | 94.67 | 98.19 | 97.80 |
| Precision (%) | 100 | 94.41 | 98.18 | 98.20 |
| Recall (%) | 100 | 93.84 | 98.19 | 98.15 |
| F1-score (%) | 100 | 94.10 | 98.19 | 98.16 |
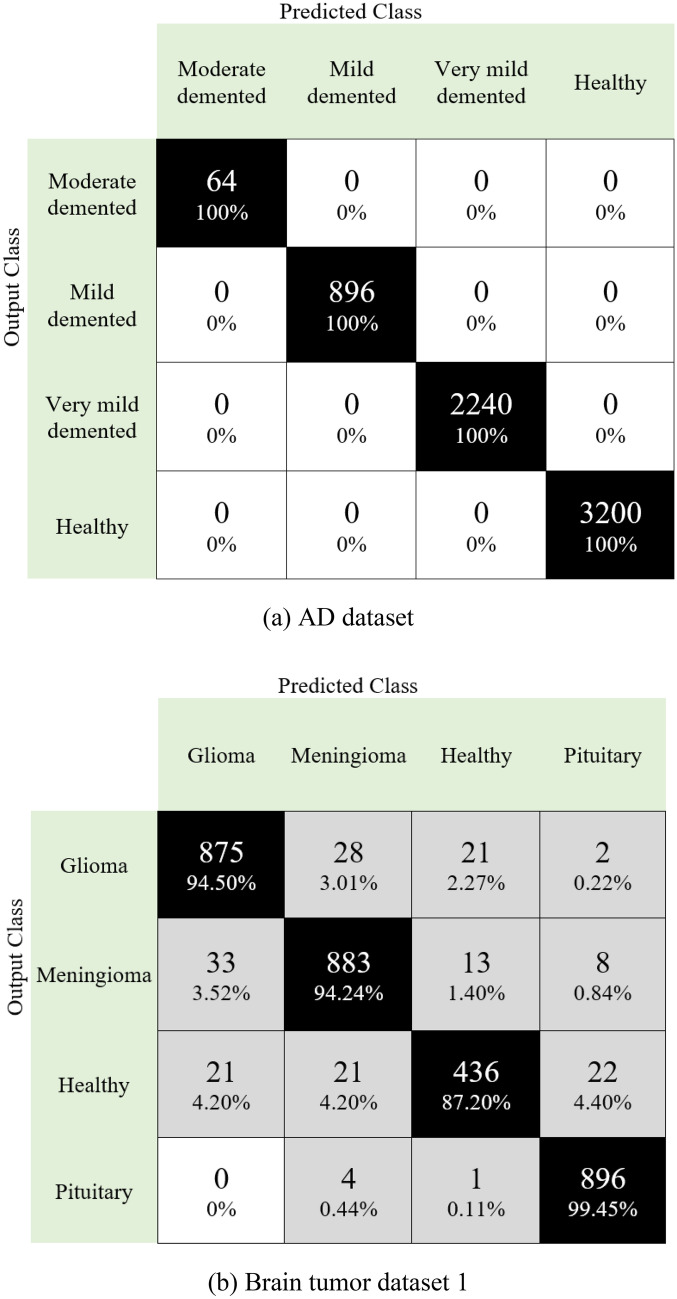
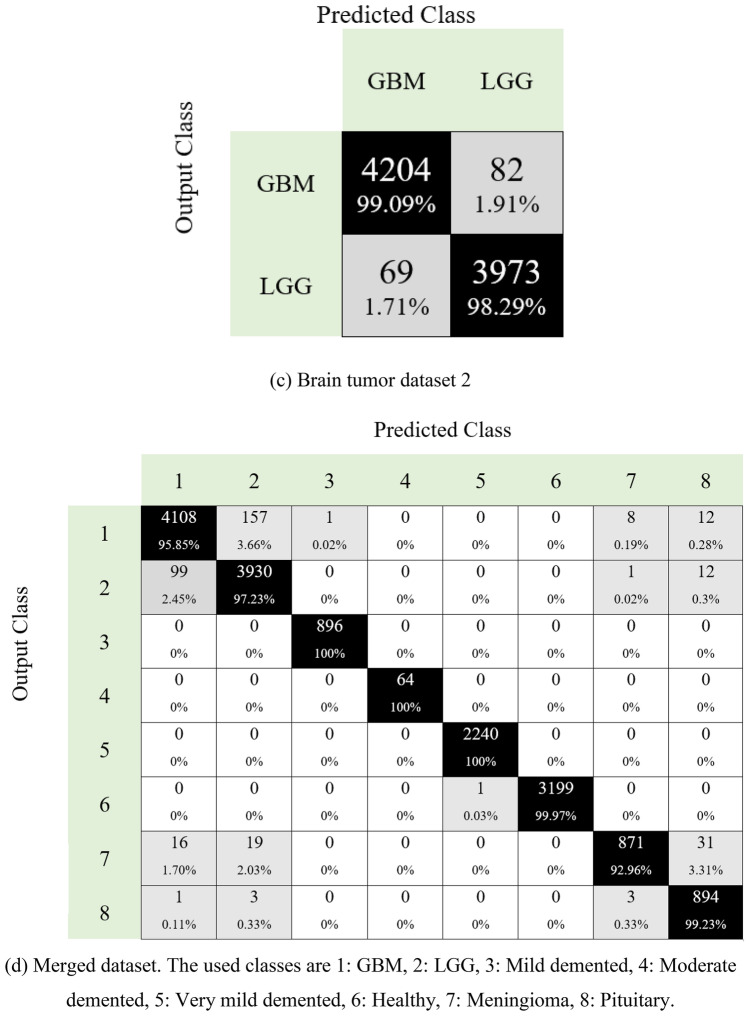
Moreover, the obtained confusion matrices for four datasets are given in Fig. 7
Confusion matrices for four different datasets are given in Fig. 7. The first of these datasets is for the detection of Alzheimer’s disease. As can be seen in Fig. 7a, the developed model predicted all classes correctly. Additionally, this dataset is unbalanced, and 100% classification accuracy has been achieved. The second dataset in the study is for brain tumor detection. This dataset contains four classes (Fig. 7b). Herein, over 94% accuracy is provided for disease classes. The developed model has also been tested to classify brain tumor types: glioblastoma and low-grade gliomas. Our proposal for brain tumor dataset 2 attained 98.19% classification accuracy (see Fig. 7c). Neurological disease datasets were combined to demonstrate the superiority of the model. A dataset with eight classes was created in this phase. This dataset contained images of Alzheimer’s disease and brain tumors. The model developed on this unbalanced dataset reached an average accuracy of 97.80% (Fig. 7d). Moreover, we have calculated the area under the curve (AUC), and these results are listed in Table 3.
Fig. 7.
Confusion matrices obtained for four different datasets
Table 3.
AUC values obtained for the proposed model for each dataset used
| Dataset | Class | AUC |
|---|---|---|
| Brain tumor dataset 1 | Glioma | 0.96 |
| Meningioma | 0.95 | |
| Healthy | 0.93 | |
| Pituitary | 0.99 | |
| General (average ± standard deviation) | 0.9575 ± 0.0250 | |
| Brain tumor dataset 2 | GBM | 0.97 |
| LGG | 0.99 | |
| General | 0.98 ± 0.0141 | |
| AD dataset | Moderate demented | 1 |
| Mild demented | 1 | |
| Very mild demented | 1 | |
| Healthy | 1 | |
| General | 1 ± 0 | |
| Merged dataset | GBM | 0.97 |
| LGG | 0.99 | |
| Moderate demented | 1 | |
| Mild demented | 1 | |
| Very mild demented | 1 | |
| Healthy | 1 | |
| Meningioma | 0.96 | |
| Pituitary | 1 | |
| General | 0.99 ± 0.016 |
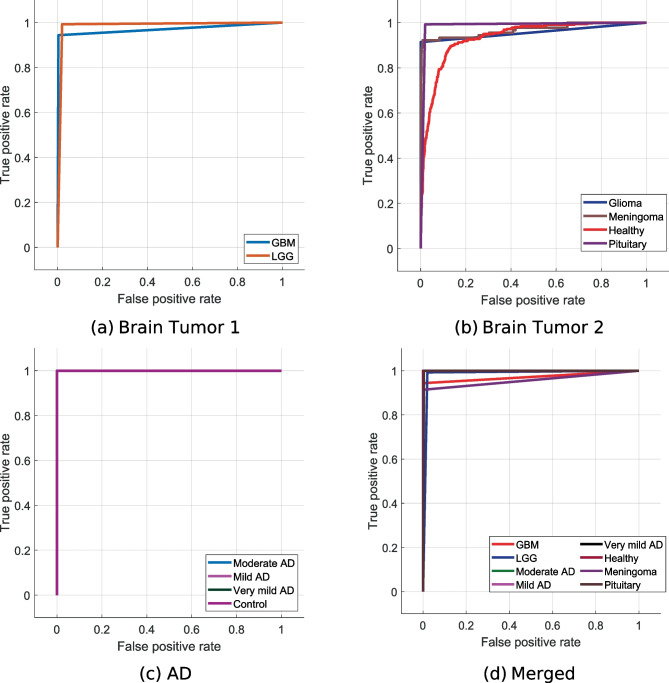
Table 3 presents class-wise AUC values and general AUC values for each dataset used. It can be noted from our table that our proposed method attained over 95% AUC values for all datasets. Furthermore, AUC values of 100% have been obtained on the AD dataset and achieved an average AUC of 99% for the merged dataset. We have also depicted the receiver operating characteristic (ROC) curves obtained for the proposed model with the datasets used in Fig. 8.
Fig. 8.
ROC curves obtained for the proposed model using different datasets
Furthermore, the time complexity of the proposed PFP feature extraction architecture is equal to because the proposed feature generator has quadratic complexity.
Discussion
Neurological image classification is an important research area in biomedical and computer engineering. Implementing such ML models in clinical practice can provide a breakthrough in medicine. The best way to develop a smart medical system is to use ML. Thus, various ML models have been proposed in the literature [46]. Herein, the proposed results of the PFP-HOG model and the clinical advantages of this model have been discussed.
Discussion of Results
A new fixed-size patch and bilinear decomposition-based feature extraction architecture named PFP is proposed. The HOG feature extractor has been used in this architecture to generate features. The fixed-patch-sized HOG features extracted from two sample images are denoted in Fig. 9.
Fig. 9.
Sample HOG features extracted from the sample images. In this work, 112 × 112-sized images and 21 fixed-size patches with a size of 28 × 28 have been used
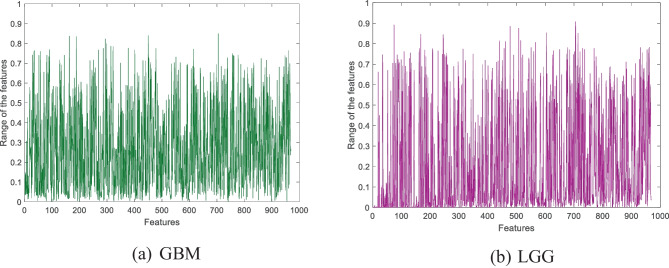
Moreover, we have used the IChi2 feature selector to obtain the optimal number of features. This work used four datasets to develop the proposed PFP-HOG and IChi2 image classification model. IChi2 selected the most meaningful 323, 913, 969, and 972 features for AD, brain tumor 1, brain tumor 2, and merged datasets, respectively. The selected sample features obtained using the IChi2 selector are depicted in Fig. 10.
Fig. 10.
Selected sample features obtained by using the IChi2 selector
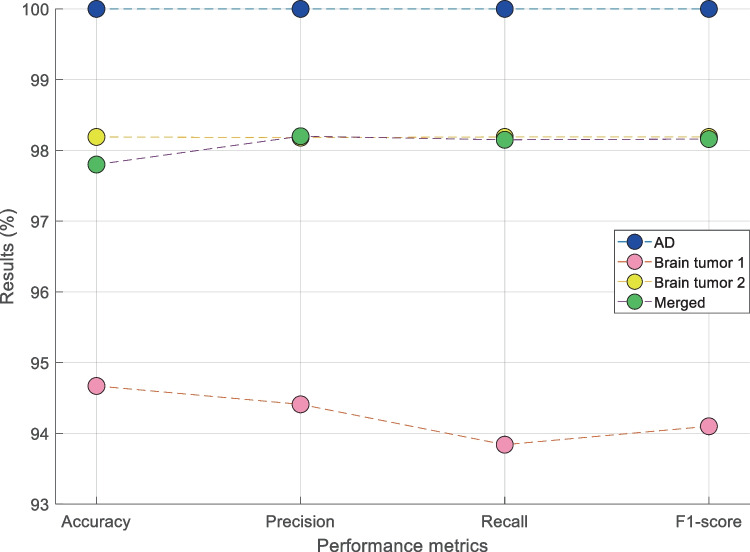
In the classification phase, kNN (i is selected as the classifier. The proposed model (PPF-HOG) yielded 100%, 94.67%, 98.19%, and 97.80% classification accuracies on the used AD, brain tumor dataset 1, brain tumor dataset 2, and merged datasets, respectively. Results of the PPF-HOG model obtained for various datasets are shown in Fig. 11.
Fig. 11.
Results of the PPF-HOG model obtained for various datasets
The model developed in this study can be used to classify neurological diseases automatically. However, prior state-of-art methods have focused only on specific neurological disorders. Hence, the results were compared based on neurological disease (based on datasets used). A comparison of the results (%) with previous state-of-art methods for detecting Alzheimer’s is given in Table 4.
Table 4.
Comparison of results (%) obtained with the prior state-of-art methods developed for automated Alzheimer’s using MRI datasets
| Author(s) | Number of images | Method | Validation | Results (%) |
|---|---|---|---|---|
| Puspaningrum et al. [47] | 6400 | Oversampling data, custom-designed CNN | Unspecified | Acc. = 55.27 |
| Acharya et al. [48] | 6400 | Deep learning (VGG16, ResNet-50, and AlexNet) |
Hold-out 75:25 |
Acc. = 95.70 Pre. = 91.90 Rec. = 92.30 F1 = 94.70 |
| Fu’adah et al. [49] | 6400 | Deep learning (AlexNet) |
Hold-out 75:25 |
Acc. = 94.58 Pre. = 92.0 Rec. = 90.20 F1 = 91.0 |
| Subramoniam [50] | 6400 | Data augmentation, deep learning (ResNet101) |
Hold-out 80:20 |
Acc. = 99.71 Pre. = 99.5 Rec. = 99.25 F1 = 99.5 |
| Liang and Gu [51] | 6400 | Weakly supervised learning-based deep learning (ADGNET) | 5-fold cross-validation |
Acc. = 99.61 Pre. = 99.53 Spe. = 99.53 Rec. = 99.69 |
| Alshammari and Mezher [52] | 6400 | Custom-designed CNN |
Hold-out 80:20 |
Acc. = 97.0 |
| Murugan et al. [53] | 6400 | Custom-designed CNN (DEMNET) |
Hold-out 80:10:10 |
Acc. = 95.23 Auc. = 97.0 Coh.Ka. = 93.0 |
| Our method | 6400 | PFP-HOG, IChi2, kNN | 10-fold cross-validation |
Acc. = 100 Pre. = 100 Rec. = 100 F1 = 100 |
Acc. Accuracy, Pre. Precision, Rec. recall, F1 F1-score, Spe. Specificity, Coh.Ka. Cohen’s kappa, Auc. area under curve
It can be seen from Table 4 that the proposed model attained high classification results for the AD dataset. In addition, almost all of the studies carried out have used deep learning models for this dataset. Data augmentation and oversampling were applied to create a balanced dataset in the studies performed by Subramoniam [50] and Puspaningrum et al. [47]. Our study used the original AD dataset and obtained 100% accuracy with our proposed model. A similar situation is valid for the brain tumor dataset. A comparison of the brain tumor dataset is given in Table 5.
Table 5.
Comparison of results (%) obtained with the prior state-of-art methods developed for brain tumors using MRI datasets
| Author(s) | Number of images | Method | Validation | Results (%) |
|---|---|---|---|---|
| Saleh et al. [54] | 4480 | Data augmentation and CNN (Xception) |
Hold-out 60:20:20 |
Acc. = 98.75 |
| Kang et al. [55] | 3000 | Ensemble deep learning features (DenseNet169, ShuffleNet, and MnasNet), SVM |
Hold-out 80:20 |
Acc. = 93.72 |
| Shoaib et al. [56] | 6517 | Custom-designed CNN (BrainTumorNet) |
Hold-out 75:25 |
Acc. = 93.15 Rec. = 93.14 Spe. = 97.72 Pre. = 93.14 Coh.Ka. = 81.74 F1 = 93.11 |
| Khan et al. [57] | 8298 | Dataset (3 datasets combined), feature extraction (standard dev., entropy, energy, etc.), CNN |
Hold-out 70:15:15 |
Acc. = 97.92 F1 = 98.0 |
| Our method | 3264 | PFP-HOG, IChi2, kNN | 10-fold cross-validation |
Acc. = 94.67 Pre. = 94.41 Rec. = 93.84 F1 = 94.10 |
Acc. Accuracy, Pre precision, Rec. recall, F1 F1-score, Spe. Specificity, Coh.Ka. Cohen’s kappa
The second dataset used to validate the proposed method in this paper is the Kaggle brain tumor dataset [40]. This dataset has four classes: glioma, meningioma, healthy, and pituitary. The presented model has obtained 94.67% accuracy using this dataset. Saleh et al. [54] obtained 98.75% using the deep learning model by performing data augmentation. Khan et al. [57] obtained 97.92% accuracy on the same dataset in their study. In their study, three different datasets were combined to create a large dataset. In addition, two classes were used in this study, and images were labeled as tumor and non-tumor. In our work, four classes were used. The final comparison of results is about the brain cancer dataset. A comparison of the results (%) with previous state-of-art methods for classifying brain cancer is given in Table 6.
Table 6.
Comparison of results (%) obtained with the prior state-of-art methods developed for brain gliomas using MRI datasets
| Author(s) | Number of images | Method | Validation | Results (%) |
|---|---|---|---|---|
| Raghavendra et al. [58] | 800 |
Method 1: elongated quinary patterns and entropy analysis (EQPE), kNN Method 2: deep learning (VGG16), kNN |
10 fold cross-validation |
Method 1: Acc. = 92.5 Sen. = 90.66 Spe. = 93.6 Method 2: Acc. = 94.25 Sen. = 94.33 Spe. = 94.20 |
| Hsieh et al. [59] | 107 | Histogram moments, local statistics (correlation, entropy, energy, etc.), logistic regression | Leave-one-out cross-validation |
Acc. = 88.0 Sen. = 82.0 Spe. = 90.0 |
| Anaraki et al. [60] | 9035 | Data augmentation, dataset (4 datasets combined), genetic algorithm, and CNN |
Hold-out 80:20 |
Acc. = 90.9 |
| Sert et al. [61] | 200 | Single image super-resolution, deep learning (ResNet), and SVM | 5-fold cross validation |
Acc. = 95.0 Auc. = 0.98 |
| Banerjee et al. [62] | 2043 | CNN (PatchNet, SliceNet, and VolumeNet) | Leave one patient out | Acc. = 97.19 |
| Our method | 8328 | PFP-HOG, IChi2, kNN | 10-fold cross-validation |
Acc. = 98.19 Pre. = 98.18 Rec. = 98.19 F1 = 98.19 |
Acc. Accuracy, Sen. Sensitivity, Spe. Specificity, Rec. recall, Pre. Precision, F1 F1-score, Auc. area under curve
The brain glioma dataset is the third dataset used to validate the proposed method [41, 43]. In addition, many deep learning-based studies have been carried out using this dataset [61, 62]. However, our study provided higher accuracy than all studies using this dataset.
In the used datasets, GBM disease is a common disorder and is included in 2 datasets (brain tumor 1 and brain tumor 2). To evaluate the classification ability of our model for this disorder using multiple datasets, we defined a new case containing two classes: GBM and LGG. In the GBM class, we used 5212 (= 4286 + 926) images, with 4042 images in the LGG class. The obtained confusion matrix for this case is demonstrated in Fig. 12.
Fig. 12.

Confusion matrix obtained demonstrates the GBM classification capability of our proposed PFP-HOG model (1, GBM; 2, LGG)
Figure 12 demonstrates that our proposed method attained 98.04% overall classification accuracy in this case, and class-wise recall and precision for GBM disorder are 97.95% and 98.57%, respectively.
The main advantages of our proposed model are given below:
An efficient feature extraction PFP-HOG architecture is proposed.
Able to capture minute variations in the pixels accurately.
To choose the best features automatically and accurately IChi2 selector is used.
Robust results were obtained using tenfold cross-validation.
High-performance rates have been obtained using the kNN classifier.
To illustrate the general high classification performance of the proposed PFP-HOG model, four commonly used image datasets are used.
To show the high classification ability of the generated features, we have used a shallow classifier without fine-tuning or hyperparameter optimization technique. We applied Bayesian optimizer to kNN for parameter optimization, and our model reached about 98.50% classification accuracy (the optimized parameters are: k is 10, distance: city block, voting: squared inverse, standardize: false) for the merged dataset.
Our feature engineering architecture performed better than the reported deep learning models.
The clinical advantages of our model are given below.
Clinical Advantages of Our Proposal
Contrast-enhanced imaging with T1-weighted, T2-weighted, T2 FLAIR, diffusion-weighted imaging, and susceptibility-weighted imaging are standard sequences used to diagnose the tumor and ascertain the aggressiveness of a brain tumor. These aid in identifying a benign versus malignant lesion by assessing the presence of features such as bleeding, necrosis, and extent of cerebral edema [63]. These standard sequences are usually time-consuming compared to conventional computed tomography (CT) and prone to MRI-related and motion artifacts (especially in a severely neurologically impaired patient with the inability to lie still for a prolonged period). In addition, advanced sequences such as perfusion MR imaging, which investigates blood flow and blood volume to the tumor, and MR spectroscopy, which determines the tumor grade according to the ratio of biochemical markers within the tumor, are commonly used to differentiate low-grade glioma and GBM [64, 65]. These advanced sequences will further contribute to the scan time and can only be performed in higher Tesla MRI machines. However, it can be noted from our results that low-grade glioma and GBM are classified with high accuracy using conventional T2W and FLAIR sequences. Providing the best prediction of a certain tumor, especially when it involves a surgically challenging brain area, can provide a more precise surgical management and prognosis for the patient.
AD is a neurodegenerative disease caused by atrophy with the deposition of tau and amyloid in the brain’s and hippocampus’s cortical areas. There are many types of neurodegenerative diseases, each with specific MRI findings. In AD, positron emission tomography (PET) can be used to investigate changes in cerebral glucose metabolism, various neurotransmitter systems, and neuroinflammation, and the protein aggregates characteristic of the disease, notably the amyloid deposits. MRI is useful to evaluate the degree of atrophy and regions involved [66–68]. However, early diagnosis of the neurodegenerative disorder is challenging in imaging. Clinically, early diagnosis includes recognition of pre-dementia conditions, such as mild cognitive impairment (MCI). Mild cognitive impairment, mild dementia, moderate dementia, and severe dementia are AD types, and each type of patient’s clinic and treatment protocols varies [69]. In this study, not only the presence of AD disease but also the detection of the dementia type of the patient is made with high accuracy by using only the T1-weighted sequence in MRI with ML methods. In other words, ML can guide physicians in accurately diagnosing AD and detecting the disease’s cognitive, functional, and behavioral features with MRI without much clinical knowledge.
Conclusions
This work presented a novel feature extraction architecture to attain high classification performance in classifying various neurological disorders using our proposed model with MRI. The proposed PFP architecture has used both fixed-patch division and compression together. The HOG feature extractor extracts these features using PFP architecture. Hence, the model PFP-HOG extracts salient features from the images. The presented model is validated using four MRI neurological datasets. It has obtained an accuracy of 100%, 94.67%, 98.19%, and 97.80% using AD, brain tumor 1, brain tumor 2, and merged datasets, respectively. Our developed model has yielded high classification accuracy for various dataset combinations, which justifies the proposed model’s performance. The developed model was evaluated using a tenfold cross-validation methodology. Leave-one-subject-out (LOSO) cross-validation methodology can be used to calculate more generalized results. However, subject information is not shared in publicly available databases in the literature. Therefore, LOSO results could not be reported.
In the future, other handcrafted feature extractors can be embedded into our proposed PFP architecture, and new computer vision models can be proposed. Our developed model can be installed in the cloud. The radiologists or clinicians can obtain a second opinion or rapid diagnosis using our cloud-based model to obtain an accurate diagnosis. The cloud-based model can be used to provide second visions, allowing neurologists to access and analyze MRI remotely. MRI from the patient can be sent to the model running on the remote server and interpreted. This solution will be liked an artificial assistant that can assist neurologists to make accurate diagnosis immediately. Moreover, these MRI can be shared and analyzed by other neurologists thanks to the cloud-based structure. In addition, the cloud-based model will enable rapid diagnosis in emergencies. This approach will provide a quick solution, especially where radiologists and clinicians are not available. Thus, it will allow the patient to receive treatment earlier and reduce the risk of mortality.
Author Contribution
Conceptualization, EK, WYC, HBA, MB, PDB, SC, SD, TT, URA; formal analysis, EK, WYC, HBA, MB, PDB; investigation, EK, WYC, HBA, MB, PDB, SC, SD, TT, URA; methodology, EK, WYC, HBA, MB, PDB; software, SD, TT; project administration, URA; resources, EK, WYC, HBA; supervision, URA; validation, EK, WYC, HBA, MB, PDB, SC, SD, TT, URA; visualization, EK, WYC, HBA, MB, PDB, SC, SD, TT, URA; writing—original draft, EK, WYC, HBA, MB, PDB, SC, SD, TT, URA; writing—review and editing, EK, WYC, HBA, MB, PDB, SC, SD, TT, URA. All authors have read and agreed to the published version of the manuscript.
Data Availability
The data used in this study were downloaded from https://www.kaggle.com/tourist55/alzheimers-dataset-4-class-of-images, https://www.kaggle.com/sartajbhuvaji/brain-tumor-classification-mri, and https://wiki.cancerimagingarchive.net/.
Declarations
Ethical Approved
Not applicable.
Competing Interests
The authors declare no competing interests.
Footnotes
Publisher's Note
Springer Nature remains neutral with regard to jurisdictional claims in published maps and institutional affiliations.
References
- 1.Mesin L: Biomedical Image Processing and Classification. Electronics 10(1):66, 2021. 10.3390/electronics10010066
- 2.Smith-Bindman R, et al. Trends in use of medical imaging in US health care systems and in Ontario, Canada, 2000–2016. Jama. 2019;322:843–856. doi: 10.1001/jama.2019.11456. [DOI] [PMC free article] [PubMed] [Google Scholar]
- 3.Malik M, Jaffar MA, Naqvi MR: Comparison of Brain Tumor Detection in MRI Images Using Straightforward Image Processing Techniques and Deep Learning Techniques. Proc. 2021 3rd International Congress on Human-Computer Interaction, Optimization and Robotic Applications (HORA): City
- 4.Schobert IT, Savic LJ. Current Trends in Non-Invasive Imaging of Interactions in the Liver Tumor Microenvironment Mediated by Tumor Metabolism. Cancers. 2021;13:3645. doi: 10.3390/cancers13153645. [DOI] [PMC free article] [PubMed] [Google Scholar]
- 5.Sternberg SR. Biomedical image processing. Computer. 1983;16:22–34. [Google Scholar]
- 6.Jin D, et al.: Artificial Intelligence in Medicine Technical Basis and Clinical Applications, Chapter 14 - Artificial intelligence in radiology, p 265–289, 2021. 10.1016/B978-0-12-821259-2.00014-4
- 7.Razmjooy N, et al. Computer-aided diagnosis of skin cancer: A review. Current medical imaging. 2020;16:781–793. doi: 10.2174/1573405616666200129095242. [DOI] [PubMed] [Google Scholar]
- 8.Talo M, Yildirim O, Baloglu UB, Aydin G, Acharya UR. Convolutional neural networks for multi-class brain disease detection using MRI images. Computerized Medical Imaging and Graphics. 2019;78:101673. doi: 10.1016/j.compmedimag.2019.101673. [DOI] [PubMed] [Google Scholar]
- 9.Gudigar A, Raghavendra U, Hegde A, Kalyani M, Ciaccio EJ, Acharya UR. Brain pathology identification using computer aided diagnostic tool: A systematic review. Computer methods and programs in biomedicine. 2020;187:105205. doi: 10.1016/j.cmpb.2019.105205. [DOI] [PubMed] [Google Scholar]
- 10.Haq EU, Huang J, Kang L, Haq HU, Zhan T: Image-based state-of-the-art techniques for the identification and classification of brain diseases: a review. Medical & Biological Engineering & Computing:1–18, 2020 [DOI] [PubMed]
- 11.Lin W, et al. Bidirectional Mapping of Brain MRI and PET With 3D Reversible GAN for the Diagnosis of Alzheimer’s Disease. Frontiers in Neuroscience. 2021;15:357. doi: 10.3389/fnins.2021.646013. [DOI] [PMC free article] [PubMed] [Google Scholar]
- 12.Fernandes SL, Tanik UJ, Rajinikanth V, Karthik KA. A reliable framework for accurate brain image examination and treatment planning based on early diagnosis support for clinicians. Neural Computing and Applications. 2020;32:15897–15908. [Google Scholar]
- 13.Tandel GS, Balestrieri A, Jujaray T, Khanna NN, Saba L, Suri JS. Multiclass magnetic resonance imaging brain tumor classification using artificial intelligence paradigm. Computers in Biology and Medicine. 2020;122:103804. doi: 10.1016/j.compbiomed.2020.103804. [DOI] [PubMed] [Google Scholar]
- 14.Zhao X, Ang CKE, Acharya UR, Cheong KH: Application of Artificial Intelligence techniques for the detection of Alzheimer’s disease using structural MRI images. Biocybernetics and Biomedical Engineering, 2021
- 15.Saba T, Mohamed AS, El-Affendi M, Amin J, Sharif M. Brain tumor detection using fusion of hand crafted and deep learning features. Cognitive Systems Research. 2020;59:221–230. [Google Scholar]
- 16.Rauschecker AM, et al. Artificial intelligence system approaching neuroradiologist-level differential diagnosis accuracy at brain MRI. Radiology. 2020;295:626–637. doi: 10.1148/radiol.2020190283. [DOI] [PMC free article] [PubMed] [Google Scholar]
- 17.Dosovitskiy A, et al.: An image is worth 16x16 words: Transformers for image recognition at scale. arXiv preprint arXiv:201011929, 2020
- 18.Tolstikhin I, et al.: MLP-Mixer: An all-MLP Architecture for Vision. arXiv preprint arXiv:210501601, 2021
- 19.Bahadure NB, Ray AK, Thethi HP: Image analysis for MRI based brain tumor detection and feature extraction using biologically inspired BWT and SVM. International journal of biomedical imaging 2017, 2017 [DOI] [PMC free article] [PubMed]
- 20.Lahmiri S. Glioma detection based on multi-fractal features of segmented brain MRI by particle swarm optimization techniques. Biomedical Signal Processing and Control. 2017;31:148–155. [Google Scholar]
- 21.Gudigar A, Raghavendra U, Ciaccio EJ, Arunkumar N, Abdulhay E, Acharya UR. Automated categorization of multi-class brain abnormalities using decomposition techniques with MRI images: a comparative study. IEEE Access. 2019;7:28498–28509. [Google Scholar]
- 22.Ahmed S, et al. Ensembles of patch-based classifiers for diagnosis of Alzheimer diseases. IEEE Access. 2019;7:73373–73383. [Google Scholar]
- 23.Nayak DR, Dash R, Majhi B, Acharya UR. Application of fast curvelet Tsallis entropy and kernel random vector functional link network for automated detection of multiclass brain abnormalities. Computerized Medical Imaging and Graphics. 2019;77:101656. doi: 10.1016/j.compmedimag.2019.101656. [DOI] [PubMed] [Google Scholar]
- 24.Talo M, Baloglu UB, Yıldırım Ö, Acharya UR. Application of deep transfer learning for automated brain abnormality classification using MR images. Cognitive Systems Research. 2019;54:176–188. [Google Scholar]
- 25.Gudigar A, Raghavendra U, San TR, Ciaccio EJ, Acharya UR. Application of multiresolution analysis for automated detection of brain abnormality using MR images: A comparative study. Future Generation Computer Systems. 2019;90:359–367. [Google Scholar]
- 26.Acharya UR, et al. Automated detection of Alzheimer’s disease using brain MRI images–a study with various feature extraction techniques. Journal of Medical Systems. 2019;43:1–14. doi: 10.1007/s10916-019-1428-9. [DOI] [PubMed] [Google Scholar]
- 27.Koh JEW, et al. Automated detection of Alzheimer's disease using bi-directional empirical model decomposition. Pattern Recognition Letters. 2020;135:106–113. [Google Scholar]
- 28.Mehmood A, Maqsood M, Bashir M, Shuyuan Y. A deep siamese convolution neural network for multi-class classification of alzheimer disease. Brain sciences. 2020;10:84. doi: 10.3390/brainsci10020084. [DOI] [PMC free article] [PubMed] [Google Scholar]
- 29.Ghassemi N, Shoeibi A, Rouhani M. Deep neural network with generative adversarial networks pre-training for brain tumor classification based on MR images. Biomedical Signal Processing and Control. 2020;57:101678. [Google Scholar]
- 30.Afshar P, Mohammadi A, Plataniotis KN. BayesCap: A Bayesian Approach to Brain Tumor Classification Using Capsule Networks. IEEE Signal Processing Letters. 2020;27:2024–2028. [Google Scholar]
- 31.Poyraz AK, Dogan S, Akbal E, Tuncer T. Automated brain disease classification using exemplar deep features. Biomedical Signal Processing and Control. 2022;73:103448. [Google Scholar]
- 32.El-Latif AAA, Chelloug SA, Alabdulhafith M, Hammad M. Accurate Detection of Alzheimer’s Disease Using Lightweight Deep Learning Model on MRI Data. Diagnostics. 2023;13:1216. doi: 10.3390/diagnostics13071216. [DOI] [PMC free article] [PubMed] [Google Scholar]
- 33.Muezzinoglu T, et al.: PatchResNet: Multiple Patch Division–Based Deep Feature Fusion Framework for Brain Tumor Classification Using MRI Images. Journal of Digital Imaging:1–15, 2023 [DOI] [PMC free article] [PubMed]
- 34.Gupta RK, Bharti S, Kunhare N, Sahu Y, Pathik N. Brain tumor detection and classification using cycle generative adversarial networks. Interdisciplinary Sciences: Computational Life Sciences. 2022;14:485–502. doi: 10.1007/s12539-022-00502-6. [DOI] [PubMed] [Google Scholar]
- 35.Dalal N, Triggs B: Histograms of oriented gradients for human detection. Proc. 2005 IEEE computer society conference on computer vision and pattern recognition (CVPR'05): City
- 36.Tuncer T, Dogan S, Subasi A. A new fractal pattern feature generation function based emotion recognition method using EEG. Chaos, Solitons & Fractals. 2021;144:110671. [Google Scholar]
- 37.Silva DJ, Amaral JS, Amaral VS. Broad multi-parameter dimensioning of magnetocaloric systems using statistical learning classifiers. Frontiers in Energy Research. 2020;8:121. [Google Scholar]
- 38.Dubey S: Alzheimer’s Dataset (4 Class of Images). Kaggle, Dec, 2019. https://www.kaggle.com/datasets/tourist55/alzheimers-dataset-4-class-of-images
- 39.Kang J, Gwak J. Deep Learning-Based Brain Tumor Classification in MRI images using Ensemble of Deep Features. Journal of the Korea Society of Computer and Information. 2021;26:37–44. [Google Scholar]
- 40.Brain Tumor Classification (MRI). Available at https://www.kaggle.com/sartajbhuvaji/brain-tumor-classification-mri/discussion.
- 41.Scarpace L, et al. Radiology data from the cancer genome atlas glioblastoma multiforme [TCGA-GBM] collection. The Cancer Imaging Archive. 2016;11:1. [Google Scholar]
- 42.Clark K, et al. The Cancer Imaging Archive (TCIA): maintaining and operating a public information repository. Journal of digital imaging. 2013;26:1045–1057. doi: 10.1007/s10278-013-9622-7. [DOI] [PMC free article] [PubMed] [Google Scholar]
- 43.Pedano N, et al.: Radiology data from the cancer genome atlas low grade glioma [TCGA-LGG] collection. The Cancer Imaging Archive 2, 2016
- 44.Nagabushanam P, Thomas George S, Radha S. EEG signal classification using LSTM and improved neural network algorithms. Soft Computing. 2020;24:9981–10003. [Google Scholar]
- 45.Goutte C, Gaussier E: A probabilistic interpretation of precision, recall and F-score, with implication for evaluation. Proc. European conference on information retrieval: City
- 46.Khodatars M, et al. Deep learning for neuroimaging-based diagnosis and rehabilitation of autism spectrum disorder: a review. Computers in Biology and Medicine. 2021;139:104949. doi: 10.1016/j.compbiomed.2021.104949. [DOI] [PubMed] [Google Scholar]
- 47.Puspaningrum EY, Wahid RR, Amaliyah RP: Alzheimer’s Disease Stage Classification using Deep Convolutional Neural Networks on Oversampled Imbalance Data. Proc. 2020 6th Information Technology International Seminar (ITIS): City
- 48.Acharya H, Mehta R, Singh DK: Alzheimer Disease Classification Using Transfer Learning. Proc. 2021 5th International Conference on Computing Methodologies and Communication (ICCMC): City
- 49.Fu’adah Y, Wijayanto I, Pratiwi N, Taliningsih F, Rizal S, Pramudito M: Automated Classification of Alzheimer’s Disease Based on MRI Image Processing using Convolutional Neural Network (CNN) with AlexNet Architecture. Proc. Journal of Physics: Conference Series: City
- 50.Subramoniam M: Deep learning based prediction of Alzheimer's disease from magnetic resonance images. arXiv preprint arXiv:210104961, 2021
- 51.Liang S, Gu Y. Computer-Aided Diagnosis of Alzheimer’s Disease through Weak Supervision Deep Learning Framework with Attention Mechanism. Sensors. 2021;21:220. doi: 10.3390/s21010220. [DOI] [PMC free article] [PubMed] [Google Scholar]
- 52.Alshammari M, Mezher M: A Modified Convolutional Neural Networks For MRI-based Images For Detection and Stage Classification Of Alzheimer Disease. Proc. 2021 National Computing Colleges Conference (NCCC): City
- 53.Murugan S, et al. DEMNET: a deep learning model for early diagnosis of Alzheimer diseases and dementia from MR images. IEEE Access. 2021;9:90319–90329. [Google Scholar]
- 54.Saleh A, Sukaik R, Abu-Naser SS: Brain Tumor Classification Using Deep Learning. Proc. 2020 International Conference on Assistive and Rehabilitation Technologies (iCareTech): City
- 55.Kang J, Ullah Z, Gwak J. Mri-based brain tumor classification using ensemble of deep features and machine learning classifiers. Sensors. 2021;21:2222. doi: 10.3390/s21062222. [DOI] [PMC free article] [PubMed] [Google Scholar]
- 56.Shoaib M, Elshamy M, Taha T, El-Fishawy A, Abd El-Samie F: Practical Implementation for Brain Tumor Classification with Convolutional Neural Network: EasyChair, 2021
- 57.Khan I, Ahsan K, Hasan MA, Sattar A: Brain Tumor Analysis Using Deep Neural Network. Proc. 2021 5th International Conference on Intelligent Computing and Control Systems (ICICCS): City
- 58.Raghavendra U, et al.: Feature‐versus deep learning‐based approaches for the automated detection of brain tumor with magnetic resonance images: A comparative study. International Journal of Imaging Systems and Technology, 2021
- 59.Hsieh KL-C, Lo C-M, Hsiao C-J: Computer-aided grading of gliomas based on local and global MRI features. Computer methods and programs in biomedicine 139:31–38, 2017 [DOI] [PubMed]
- 60.Anaraki AK, Ayati M, Kazemi F: Magnetic resonance imaging-based brain tumor grades classification and grading via convolutional neural networks and genetic algorithms. biocybernetics and biomedical engineering 39:63–74, 2019
- 61.Sert E, Özyurt F, Doğantekin A. A new approach for brain tumor diagnosis system: Single image super resolution based maximum fuzzy entropy segmentation and convolutional neural network. Medical hypotheses. 2019;133:109413. doi: 10.1016/j.mehy.2019.109413. [DOI] [PubMed] [Google Scholar]
- 62.Banerjee S, Mitra S, Masulli F, Rovetta S: Brain tumor detection and classification from multi-sequence MRI: Study using convnets. Proc. International MICCAI brainlesion workshop: City
- 63.Cha S. Update on brain tumor imaging: from anatomy to physiology. American Journal of Neuroradiology. 2006;27:475–487. [PMC free article] [PubMed] [Google Scholar]
- 64.Kim R, et al. Prognosis prediction of non-enhancing T2 high signal intensity lesions in glioblastoma patients after standard treatment: application of dynamic contrast-enhanced MR imaging. European radiology. 2017;27:1176–1185. doi: 10.1007/s00330-016-4464-6. [DOI] [PubMed] [Google Scholar]
- 65.Gharzeddine K, Hatzoglou V, Holodny AI, Young RJ. MR perfusion and MR spectroscopy of brain neoplasms. Radiologic Clinics. 2019;57:1177–1188. doi: 10.1016/j.rcl.2019.07.008. [DOI] [PubMed] [Google Scholar]
- 66.Frisoni GB, Fox NC, Jack CR, Scheltens P, Thompson PM. The clinical use of structural MRI in Alzheimer disease. Nature Reviews Neurology. 2010;6:67–77. doi: 10.1038/nrneurol.2009.215. [DOI] [PMC free article] [PubMed] [Google Scholar]
- 67.Jack CR, Jr, Holtzman DM. Biomarker modeling of Alzheimer’s disease. Neuron. 2013;80:1347–1358. doi: 10.1016/j.neuron.2013.12.003. [DOI] [PMC free article] [PubMed] [Google Scholar]
- 68.Arbabshirani MR, Plis S, Sui J, Calhoun VD. Single subject prediction of brain disorders in neuroimaging: Promises and pitfalls. Neuroimage. 2017;145:137–165. doi: 10.1016/j.neuroimage.2016.02.079. [DOI] [PMC free article] [PubMed] [Google Scholar]
- 69.Patterson C: The state of the art of dementia research: New frontiers. World Alzheimer Report 2018, p. 148. 2018, Available online: https://apo.org.au/node/260056
Associated Data
This section collects any data citations, data availability statements, or supplementary materials included in this article.
Data Availability Statement
The data used in this study were downloaded from https://www.kaggle.com/tourist55/alzheimers-dataset-4-class-of-images, https://www.kaggle.com/sartajbhuvaji/brain-tumor-classification-mri, and https://wiki.cancerimagingarchive.net/.


