Abstract
Background
SH2 domain containing 1A (SH2D1A) expression has been linked to cancer progression. However, the functions of SH2D1A in hepatocellular carcinoma (HCC) have not been reported.
Methods
The effects of SH2D1A on the proliferation, migration, and invasion of HCC cells and the related pathways were re-explored in cell models with SH2D1A overexpression using the CCK-8, migration and invasion assays and western blotting. The functions and mechanisms of genes co-expressed with SH2D1A were analyzed using gene ontology (GO) and Kyoto Encyclopedia of Genes and Genomes (KEGG) analysis. The relationship between SH2D1A expression and immune microenvironment features in HCC was explored.
Results
Elevated SH2D1A expression promoted cell proliferation, migration, and invasion, which was related to the overexpression of p-Nf-κB and BCL2A1 protein levels in HCC. SH2D1A expression was related to the immune, stromal, and ESTIMATE scores, and the abundance of immune cells, such as B cells, CD8+ T cells, and T cells. SH2D1A expression was significantly related to the expression of immune cell markers, such as PDCD1, CD8A, and CTLA4 in HCC.
Conclusion
SH2D1A overexpression was found to promote cell growth and metastasis via the Nf-κB signaling pathway and may be related to the immune microenvironment in HCC. The findings indicate that SH2D1A can function as a biomarker in HCC.
Supplementary Information
The online version contains supplementary material available at 10.1186/s12885-023-11315-1.
Keywords: SH2 domain containing 1A, Hepatocellular carcinoma, Immune microenvironment, Prognosis, The Cancer Genome Atlas
Introduction
In recent years, hepatocellular carcinoma (HCC) has been identified as one of the most common digestive tract tumors. At present, the prognosis of patients with HCC remains nonideal. Some biomarkers can predict the prognosis of HCC patients and have been shown to promote or inhibit the growth and migration of HCC cells [1–4]. For example, transmembrane protein 166 (TMEM166) is downregulated and is related to the TNM stage and dismal prognosis in HCC. TMEM166 overexpression suppresses cancer cell growth and metastasis potential by upregulating the anticancer gene TP53. TP53 downregulation can alleviate the antitumor effects of TMEM166 on HCC cells [1]. HMGA1 is overexpressed, and its expression is related to the Edmondson grade and overall survival (OS) in HCC. Downregulation of high-mobility group protein A1 (HMGA1) significantly reduces the cell growth and metastasis potential of HCC cells. The downregulation of miR-195-5p abrogates the effects of HMGA1 on HCC cells [4]. Therefore, it is crucial to identify novel biomarkers to predict the survival time of patients with HCC, and inhibit or promote the expression of biomarkers to delay HCC progression.
The Cancer Genome Atlas (TCGA) database is often used to identify new cancer biomarkers [2, 5–7]. For example, patients with HCC with mitochondrial fission regulator 2 (MTFR2) overexpression have poorer OS, which is associated with cancer stage, age, T stage, and grade. MTFR2 overexpression can independently predict a dismal prognosis in HCC [2]. Findings from research confirm that SH2 domain containing 1A (SH2D1A) encodes a protein that plays a critical role in the bidirectional stimulation of immune cells. The SH2D1A-encoded protein binds to lymphocyte-activating signaling molecules to inhibit the expression of transmembrane proteins and surface molecules on activated B, T, and NK cells, thus altering signal transduction in the cells. Thus far, the relationship between SH2D1A and HCC has not been reported in the literature. Therefore, the roles of SH2D1A and the involved pathways were explored via CCK-8 assay, Transwell assay, Kyoto Encyclopedia of Genes and Genomes (KEGG) enrichment analysis, and western blotting, and the relationship between the immune microenvironment and SH2D1A expression was explored to evaluate the value of SH2D1A as a biomarker for HCC.
Materials and methods
Cell culture and models
Human normal liver cells (LO2) and HCC cells (LM3, Hep3B, PLC, HepG2, and Huh7) were purchased from The Cell Bank of the Typical Culture Preservation Committee of the Chinese Academy of Sciences, placed in an incubator at 37 °C and 5% CO2 and cultured in 10% fetal bovine serum (FBS) culture and 1% penicillin‒streptomycin DMEM. The SH2D1A overexpression vector (SH2D1A-OV) and negative control (Control) were synthesized by Shanghai Gemma Gene Pharmaceutical Co., Ltd. (China). LM3 and HepG2 cells were inoculated in 6-well plates and transfected after the cell confluence reached 50%. Transfection was performed according to the manufacturer's instructions using Lipofectamine 2000 transfection reagent. The solution was replaced at 6 h after transfection, and HCC cells were collected at 48 h after transfection.
Identification of HCC cell models using RT‒PCR and Western blotting
After cell transfection, the total RNA and protein from normal liver cells and HCC cells were extracted using TRIzol and lysis buffer. After total RNA quantification, SH2D1A mRNA expression in normal and HCC cells was determined using reverse transcription and PCR amplification. The following primers were used: SH2D1A forward: 5'-CATGGCAAAATCAGCAGGAAACC-3'; reverse: 5'- AACCGTGATACAGCACACATAGGC-3'; GAPDH forward: 5′- GGAGTCCACTG GCGTCTTCA-3′; reverse: 5′-GTCATGAGTCCTTCCACGATACC-3′. Total protein was quantified using the BCA method. Twenty micrograms of the extracted protein were subjected to protein gel electrophoresis, and the membranes were treated with SH2D1A, p-Nf-κB, Nf-κB, BCL2A1, and GAPDH antibodies at the 1:1000 dilution after the membranes of western blotting were cut. Then the membranes were incubated with a secondary antibody at the 1:10,000 dilution, washed and exposed to detect SH2D1A protein expression in normal liver and HCC cells.
Cell proliferation assay
LM3 and HepG2 cell suspensions were prepared and inoculated into 96-well plates at 2 × 10³ cells/well. Ten microliters of CCK-8 solution was added to 96-well plates, and the absorbance value of the cells after incubation for 2 h was measured to generate a cell proliferation curve.
Cell migration and invasion assays
HCC cells were resuspended in serum-free medium, 1 × 10⁵ HCC cells were inoculated in the upper chamber with or without Matrigel, and 600 µL of 20% FBS medium was added to the lower chamber. Noninvasive cells remaining in the upper chamber were removed after 24 h of incubation. The HCC cells attached to the polycarbonate membrane were fixed with 4% paraformaldehyde, stained with 0.5% crystal violet solution, and photographed using a 10 × microscope. ImageJ was used to count the cells and perform statistical analysis.
The biological functions and signaling pathways of genes co-expressed with SH2D1A
The genes co-expressed with SH2D1A were obtained using correlation analysis and were defined as genes whose expression was strongly correlated with that of SH2D1A (a correlation coefficient of 0.4 and P < 0.001) [2, 8]. The gene ontology annotations include biological processes, molecular functions, and cellular components [9]. The functions and pathways associated with the 567 co-expressed genes of SH2D1A were identified through gene ontology (GO) and KEGG analysis, and the filtering standard was set to adjusted P < 0.05.
Analysis of the immune microenvironment
The expression of the components of the immune microenvironment in HCC tissues was scored through the ssGSEA and ESTIMATE methods. The relationships between the SH2D1A level and the ESTIMATE score, immune score, stromal score, and proportions of immune cells in HCC were determined through relevant analyses. SH2D1A gene expression data were entered into the gene module of the TIMER database to assess the relationships among SH2D1A expression, tumor purity, and the proportions of immune-infiltrating cells.
Analysis of the expression of SH2D1A and cell markers
In the relevant research module of the TIMER database, the relationship between SH2D1A levels and immune cell markers was explored by relevant methods under non-tumor purity and tumor purity conditions. The data of cell markers in HCC tissues were extracted from the TCGA database, and relevant methods were used to explore the relationship between the SH2D1A level and the levels of cell markers in HCC.
Statistical analysis
A t test was used to explore the potential significance of differences between the levels of cell markers and the proliferation, migration and invasion rates in SH2D1A expression groups (control group and SH2D1A overexpression groups). Pearson correlation analysis was used to elucidate the relationship of SH2D1A expression with the immune microenvironment components and immune markers. P < 0.05 was considered to indicate a significant difference.
Results
Elevation of SH2D1A expression promotes cell growth and migration in HCC
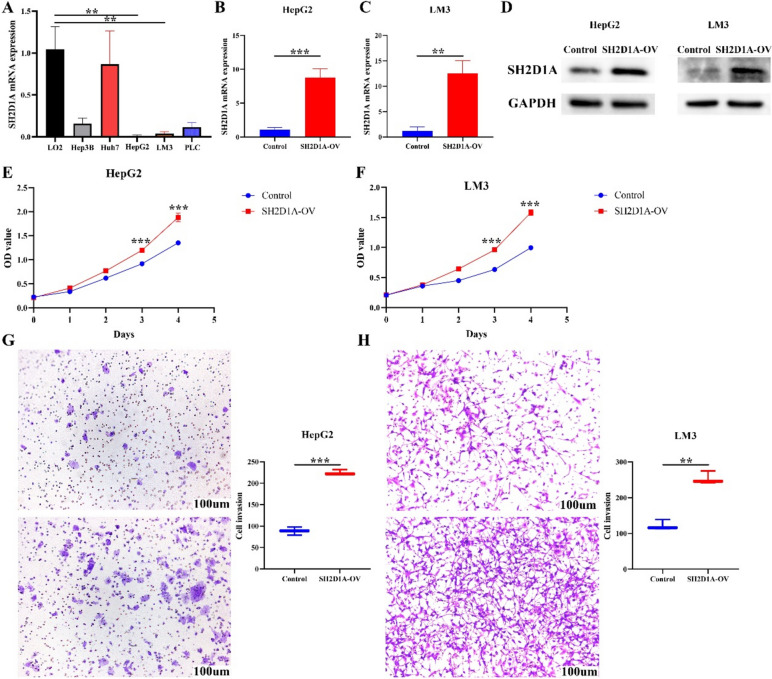
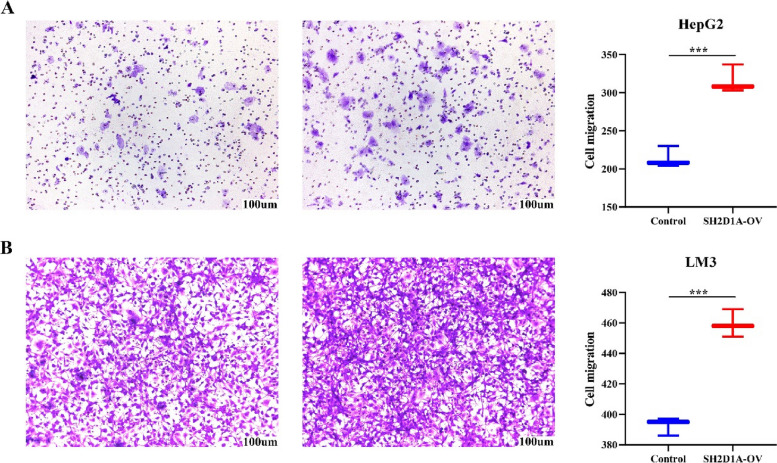
Compared with that in normal LO2 hepatocytes, the expression of SH2D1A in HCC cells was significantly decreased (Fig. 1A). We successfully constructed the SH2D1A-overexpressing HCC cell model using PCR and western blotting (Fig. 1B-D). In the cell models, the elevation of SH2D1A expression was significantly positively associated with HCC cell proliferation at 72 and 96 h (Fig. 1E and F). The enhancement of SH2D1A expression significantly promoted HCC cell invasion and migration (Figs. 1G-H and 2).
Fig. 1.
Increased expression of SH2D1A promotes the proliferation and invasion of HCC cells. A The expression levels of SH2D1A in normal liver and HCC cells; B-D Verification of cell models using PCR and western blotting; E–F cell growth analysis using CCK-8 assay; G-H cell invasion. Note: HCC, hepatocellular carcinoma; **, P < 0.01; ***, P < 0.001
Fig. 2.
Increased expression of SH2D1A promotes the cell migration of HCC. A HepG2 cells; B LM3 cells. Note: HCC, hepatocellular carcinoma; ***, P < 0.001
Functions and pathways of SH2D1A co-expressed genes
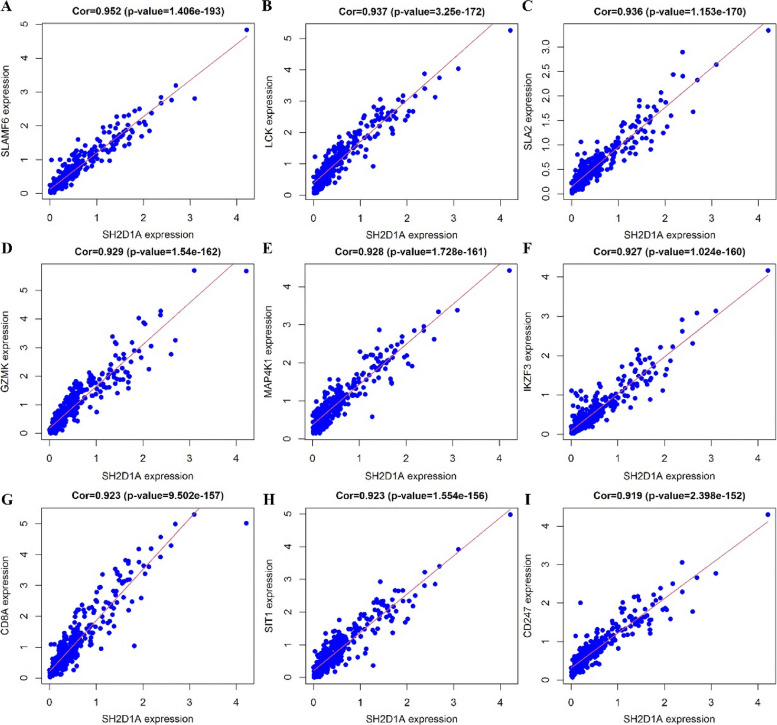
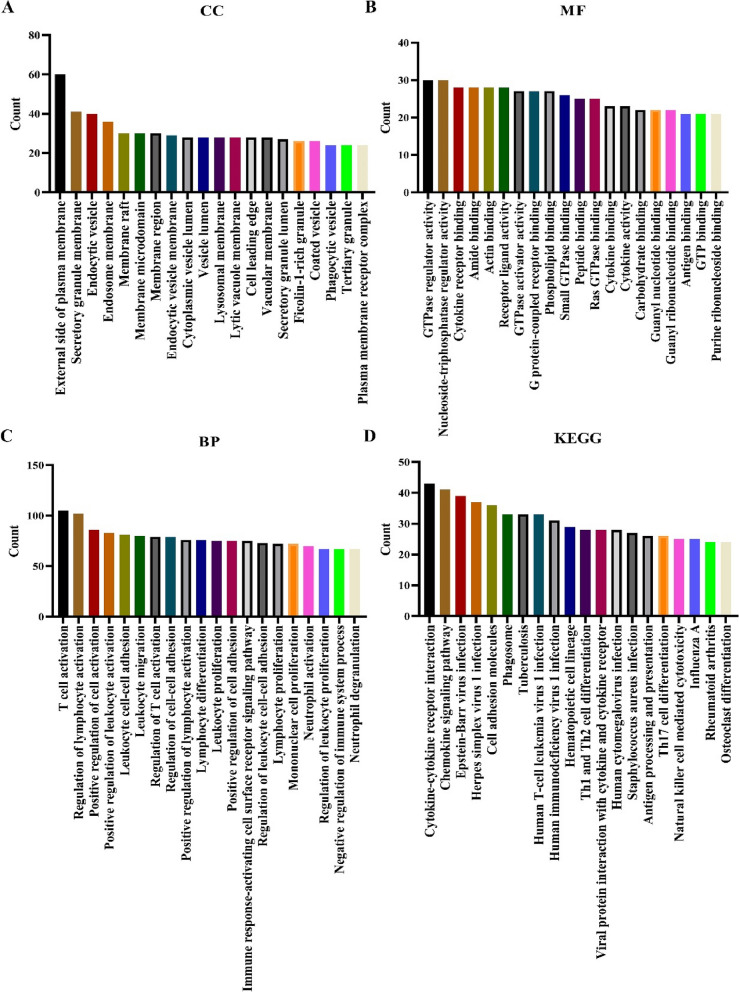
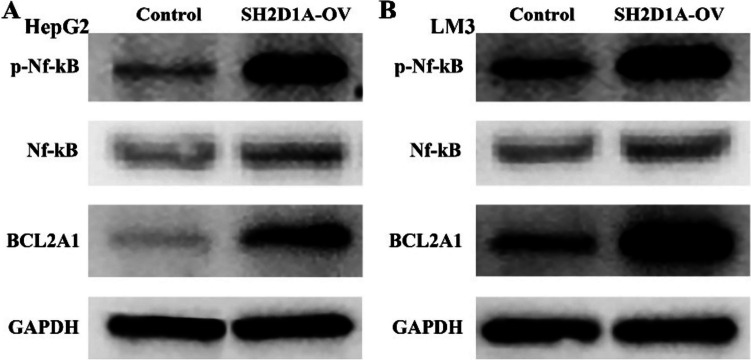
Five hundred and sixty-seven genes co-expressed with SH2D1A were identified based on data obtained from experiments performed using HCC tissues (Fig. 3 and Table S1). The genes co-expressed with SH2D1A were associated with leukocyte cell‒cell adhesion, cell proliferation, migration, T-cell differentiation, granulocyte migration, B-cell activation, cell death, and others (Fig. 4A-C and Table S2) and were involved in pathways involving chemokines, B-cell receptors, NF-κB, T-cell receptors, PD-L1, PD-1, and other factors (Fig. 4D and Table 1). In addition, we found via western blotting that SH2D1A overexpression significantly increased p-Nf-κB and BCL2A1 protein levels but had no the significant effect on Nf-κB protein in HCC cells (Fig. 5).
Fig. 3.
Nine genes co-expressed with SH2D1A in HCC tissues are shown. A SLAMF6; B LCK; C SLA2; D GZMK; E MAP4K1; F IKZF3; G CD8A; H SIT1; G CD247. Note: HCC, hepatocellular carcinoma
Fig. 4.
Functions and mechanisms of genes co-expressed with SH2D1A. A CC; B MF; C BP; D KEGG. Note: CC, cellular component; BP, biological process; MF, molecular function; KEGG, Kyoto Encyclopedia of Genes and Genomes
Table 1.
Pathways of SH2D1A co-expressed genes
| ID | Description | P | Adjust P |
|---|---|---|---|
| hsa04062 | Chemokine signaling pathway | 7.00E-20 | 1.69E-17 |
| hsa04514 | Cell adhesion molecules | 1.93E-19 | 2.32E-17 |
| hsa04640 | Hematopoietic cell lineage | 2.45E-18 | 1.87E-16 |
| hsa04658 | Th1 and Th2 cell differentiation | 3.10E-18 | 1.87E-16 |
| hsa04612 | Antigen processing and presentation | 4.00E-18 | 1.93E-16 |
| hsa05330 | Allograft rejection | 1.60E-17 | 6.41E-16 |
| hsa05169 | Epstein-Barr virus infection | 2.48E-17 | 8.53E-16 |
| hsa04061 | Viral protein interaction with cytokine and cytokine receptor | 3.64E-17 | 1.10E-15 |
| hsa05150 | Staphylococcus aureus infection | 1.21E-16 | 3.23E-15 |
| hsa05416 | Viral myocarditis | 1.58E-16 | 3.80E-15 |
| hsa05332 | Graft-versus-host disease | 1.75E-16 | 3.84E-15 |
| hsa04145 | Phagosome | 2.15E-16 | 4.31E-15 |
| hsa04940 | Type I diabetes mellitus | 3.03E-16 | 5.61E-15 |
| hsa05320 | Autoimmune thyroid disease | 2.03E-15 | 3.50E-14 |
| hsa05140 | Leishmaniasis | 5.59E-15 | 8.98E-14 |
| hsa04659 | Th17 cell differentiation | 2.18E-14 | 3.20E-13 |
| hsa04060 | Cytokine-cytokine receptor interaction | 2.26E-14 | 3.20E-13 |
| hsa05152 | Tuberculosis | 4.01E-14 | 5.36E-13 |
| hsa05323 | Rheumatoid arthritis | 5.33E-14 | 6.76E-13 |
| hsa05340 | Primary immunodeficiency | 1.82E-13 | 2.20E-12 |
| hsa05321 | Inflammatory bowel disease | 2.14E-12 | 2.46E-11 |
| hsa05166 | Human T-cell leukemia virus 1 infection | 1.20E-11 | 1.31E-10 |
| hsa04650 | Natural killer cell mediated cytotoxicity | 2.28E-11 | 2.39E-10 |
| hsa05310 | Asthma | 3.83E-11 | 3.84E-10 |
| hsa04380 | Osteoclast differentiation | 8.60E-11 | 8.29E-10 |
| hsa05170 | Human immunodeficiency virus 1 infection | 1.15E-10 | 1.06E-09 |
| hsa04672 | Intestinal immune network for IgA production | 2.29E-10 | 2.04E-09 |
| hsa05145 | Toxoplasmosis | 1.35E-09 | 1.16E-08 |
| hsa04662 | B cell receptor signaling pathway | 1.47E-09 | 1.22E-08 |
| hsa04064 | NF-kappa B signaling pathway | 2.12E-09 | 1.70E-08 |
| hsa05164 | Influenza A | 7.97E-09 | 6.20E-08 |
| hsa05135 | Yersinia infection | 1.12E-08 | 8.46E-08 |
| hsa04660 | T cell receptor signaling pathway | 1.32E-08 | 9.63E-08 |
| hsa05163 | Human cytomegalovirus infection | 3.73E-08 | 2.65E-07 |
| hsa05235 | PD-L1 expression and PD-1 checkpoint pathway in cancer | 3.92E-08 | 2.70E-07 |
| hsa05322 | Systemic lupus erythematosus | 1.07E-06 | 7.19E-06 |
| hsa04621 | NOD-like receptor signaling pathway | 1.71E-06 | 1.11E-05 |
| hsa05167 | Kaposi sarcoma-associated herpesvirus infection | 5.00E-06 | 3.17E-05 |
| hsa04625 | C-type lectin receptor signaling pathway | 1.00E-05 | 6.19E-05 |
| hsa05142 | Chagas disease | 3.51E-05 | 0.000211572 |
| hsa04630 | JAK-STAT signaling pathway | 5.18E-05 | 0.000302854 |
| hsa04664 | Fc epsilon RI signaling pathway | 5.28E-05 | 0.000302854 |
| hsa04666 | Fc gamma R-mediated phagocytosis | 8.59E-05 | 0.000481381 |
| hsa05162 | Measles | 8.85E-05 | 0.000484625 |
| hsa05168 | Herpes simplex virus 1 infection | 9.06E-05 | 0.000485131 |
| hsa04620 | Toll-like receptor signaling pathway | 0.000176672 | 0.000925606 |
| hsa04610 | Complement and coagulation cascades | 0.000408532 | 0.002094811 |
| hsa05202 | Transcriptional misregulation in cancer | 0.000449467 | 0.002256701 |
| hsa05144 | Malaria | 0.000602872 | 0.002965145 |
| hsa04611 | Platelet activation | 0.000989296 | 0.004768407 |
| hsa04670 | Leukocyte transendothelial migration | 0.001482486 | 0.007005474 |
| hsa05133 | Pertussis | 0.002547957 | 0.011808801 |
| hsa04623 | Cytosolic DNA-sensing pathway | 0.00281258 | 0.01278928 |
| hsa04668 | TNF signaling pathway | 0.003979552 | 0.017410689 |
| hsa05161 | Hepatitis B | 0.004034692 | 0.017410689 |
| hsa05130 | Pathogenic Escherichia coli infection | 0.004045637 | 0.017410689 |
| hsa05221 | Acute myeloid leukemia | 0.004144591 | 0.017523621 |
| hsa04217 | Necroptosis | 0.008674073 | 0.036042268 |
| hsa04072 | Phospholipase D signaling pathway | 0.012189773 | 0.049792125 |
Fig. 5.
Increased expression of SH2D1A is related to the abnormal pathway of Nf-κB in HCC. Note: HCC, hepatocellular carcinoma
SH2D1A is associated with the HCC immune microenvironment
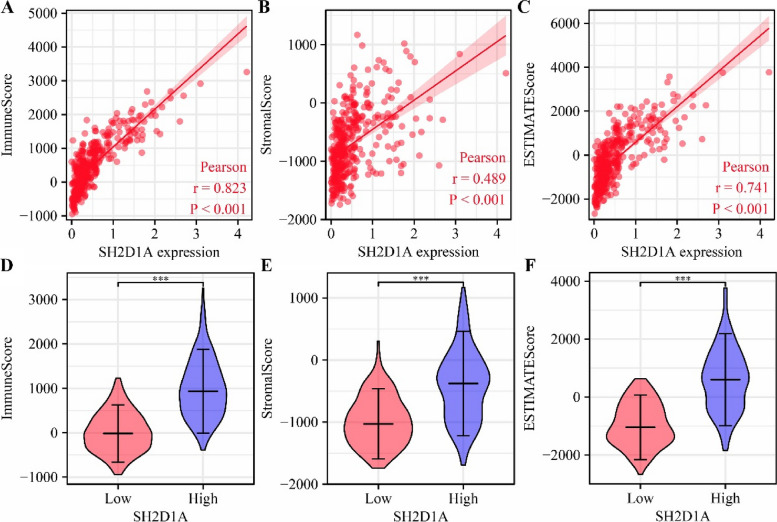
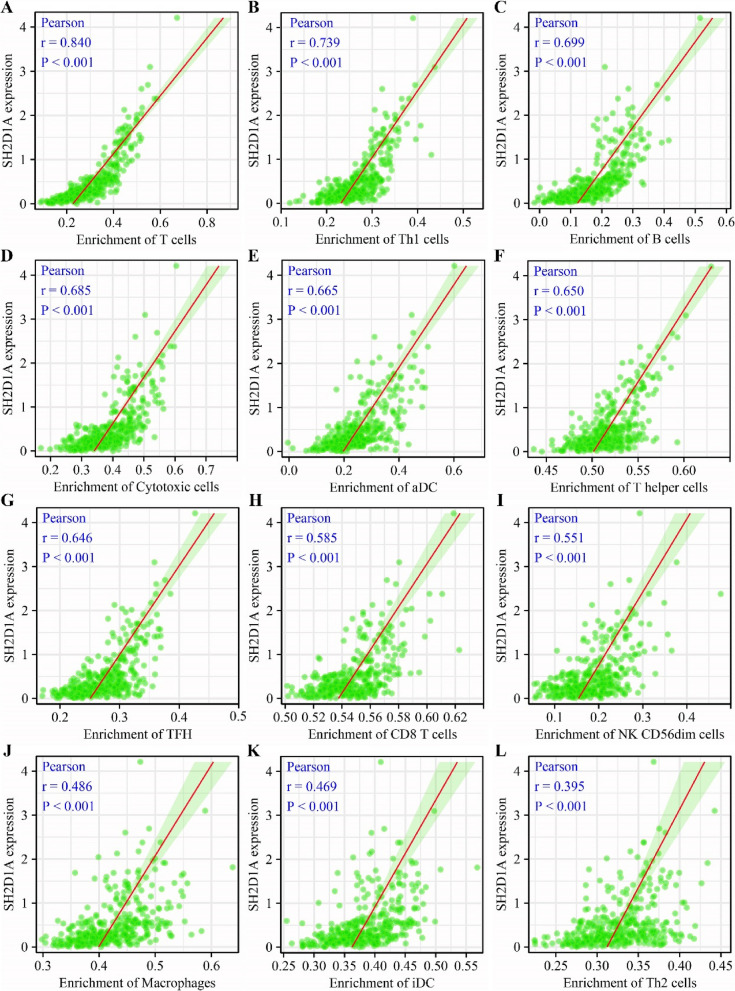
Correlation analysis revealed that SH2D1A expression was significantly correlated with the immune score (r = 0.823), stromal score (r = 0.489), and ESTIMATE score (r = 0.741) (Fig. 6A-C). In the high- and low-SH2D1A expression groups, the immune score, stromal score, and ESTIMATE score were significantly different (Fig. 6D-F). The SH2D1A expression level was significantly correlated with aDC (r = 0.665), B-cell (r = 0.699), CD8+ T-cell (r = 0.585), cytotoxic cell (r = 0.685), DC (r = 0.312), eosinophil (r = 0.202), iDC (r = 0.469), macrophage (r = 0.486), mast cell (r = 0.194), neutrophil (r = 0.278), NK CD56 bright cell (r = 0.205), NK CD56 dim cell (r = 0.551), NK cell (r = 0.203), pDC (r = 0.148), T-cell (r = 0.840), T helper cell (r = 0.650), Tcm (r = 0.167), Tem (r = 0.373), TFH (r = 0.646), Tgd (r = 0.285), Th1 cell (r = 0.739), Th2 cell (r = 0.395), and Treg (r = 0.292) levels (Fig. 7 and S1).
Fig. 6.
SH2D1A expression is significantly correlated with the immune, stromal, and ESTIMATE scores in TCGA database. A-C SH2D1A expression is correlated with the immune score, stromal score, and ESTIMATE score. D-F The immune score, stromal score, and ESTIMATE score are different in the high- and low-SH2D1A expression groups
Fig. 7.
SH2D1A expression is significantly correlated with immune cell abundance, according to data from the TCGA database. A T cells; B Th1 cells; C B cells; D cytotoxic cells; E aDCs; F T helper cells; G TFHs; H CD8+ T cells; I NK CD56 dim cells; J macrophages; K iDCs; L Th2 cells
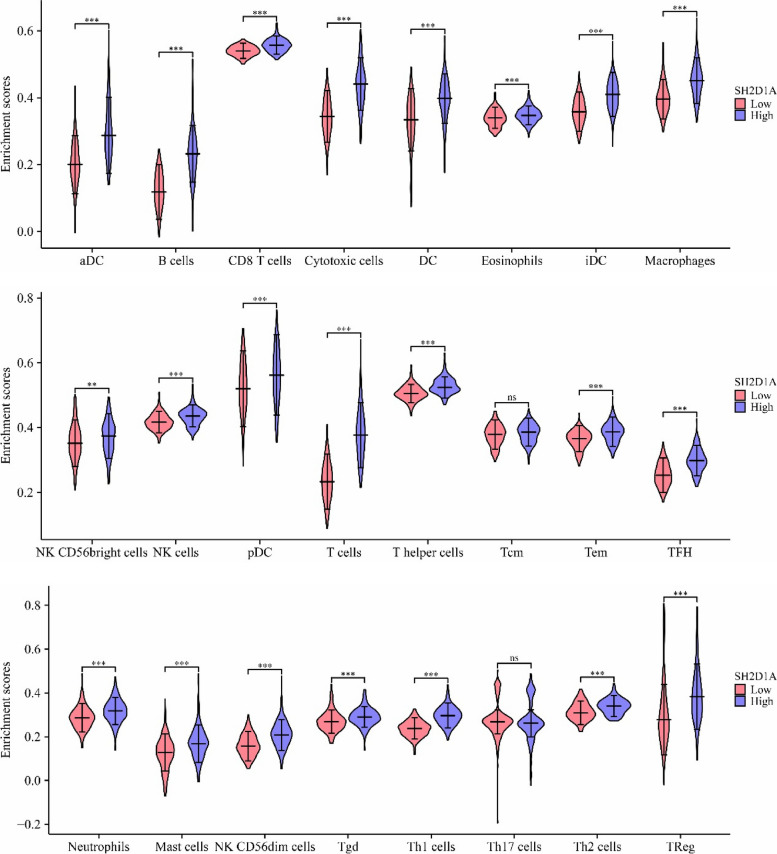
In the TIMER database, SH2D1A expression was found to be significantly correlated with HCC purity and the levels of B cells, CD8+ T cells, CD4+ T cells, macrophages, neutrophils, and dendritic cells (Fig. 8). In the high- and low- SH2D1A expression groups, the levels of aDCs, B cells, CD8+ T cells, cytotoxic cells, DCs, eosinophils, iDCs, macrophages, NK CD56 bright cells, NK cells, pDCs, T cells, T helper cells, Tems, TFHs, neutrophils, mast cells, NK CD56 dim cells, Tgds, Th1 cells, Th2 cells, and Treg were significantly different (Fig. 9).
Fig. 8.
SH2D1A expression is significantly correlated with immune cell abundance, according to data from the TIMER database
Fig. 9.
Immune cells in the high- and low-SH2D1A expression groups. Note: **, P < 0.01; ***, P < 0.001; ns, no statistical significance
SH2D1A expression correlates with the expression of immune cell markers based on tumor purity
In the TIMER database, in the absence of tumor purity, the expression level of SH2D1A was significantly correlated with the expression of the immune cell markers PDCD1, MS4A4A, HLA-DRA, KIR2DL4, CD8A, CD3E, CD79A, CD86, STAT6, CSF1R, CCL2, CD68, IL10, IRF5, PTGS2, IL17A, CD163, VSIG4, CD8B, CCR7, HLA-DQB1, KIR2DL1, KIR2DL3, KIR3DL2, KIR3DL1, HLA-DPA1, CD19, CD1C, NRP1, CD3D, ITGAX, TBX21, HLA-DPB1, STAT4, STAT1, IFNG, TNF, KIR3DL3, GATA3, STAT5A, IL13, CD2, IL21, STAT3, FOXP3, ITGAM, CCR8, TGFB1, CTLA4, LAG3, KIR2DS4, HAVCR2, and GZMB (Table 2). In addition, SH2D1A expression in tumor purity was found to be significantly correlated with the expression of the immune cell markers VSIG4, CD3E, CD2, TBX21, KIR2DS4, CD3D, CD79A, PDCD1, STAT5B, CTLA4, CCR7, HLA-DPA1, CD163, IFNG, CD86, KIR3DL1, HLA-DRA, LAG3, ITGAX, GZMB, CCR8, STAT4, IL13, HAVCR2, CD19, CD1C, CD8A, TNF, MS4A4A, STAT1, KIR2DL4, IL10, HLA-DQB1, FOXP3, STAT5A, CD8B, KIR3DL2, CD68, CCL2, TGFB1, KIR2DL3, ITGAM, HLA-DPB1, PTGS2, IL21, NRP1, CSF1R, IL17A, STAT6, GATA3, KIR3DL3, STAT3, IRF5, and BCL6 (Table 3).
Table 2.
The expression level of SH2D1A was significantly correlated with the expression of the immune cell markers in HCC in the absence of tumor purity
| Gene | Coefficient | P | Gene | Coefficient | P |
|---|---|---|---|---|---|
| CD8A | 0.887016405 | 0 | HLA-DQB1 | 0.672194662 | 0 |
| CD8B | 0.79381506 | 1.05E-81 | HLA-DRA | 0.7109175 | 0 |
| CD3D | 0.784088575 | 0 | HLA-DPA1 | 0.73305306 | 0 |
| CD3E | 0.919849508 | 0 | CD1C | 0.592266849 | 1.70E-36 |
| CD2 | 0.896876887 | 0 | NRP1 | 0.232362638 | 6.49E-06 |
| CD19 | 0.620480458 | 7.44E-41 | ITGAX | 0.60879195 | 0 |
| CD79A | 0.77372608 | 3.79E-75 | TBX21 | 0.833910496 | 2.77E-97 |
| CD86 | 0.72178471 | 0 | STAT4 | 0.593114347 | 0 |
| CSF1R | 0.64226918 | 0 | STAT1 | 0.567067494 | 0 |
| CCL2 | 0.502753697 | 0 | IFNG | 0.680123851 | 1.07E-51 |
| CD68 | 0.492583724 | 0 | TNF | 0.615371131 | 4.94E-40 |
| IL10 | 0.593359255 | 1.17E-36 | GATA3 | 0.75729304 | 2.88E-70 |
| NOS2 | 0.053431612 | 0.304690837 | STAT6 | 0.127106478 | 0.014288533 |
| IRF5 | 0.177298342 | 0.000602022 | STAT5A | 0.474038948 | 3.50E-22 |
| PTGS2 | 0.457054407 | 1.51E-20 | IL13 | 0.168795537 | 0.00109964 |
| CD163 | 0.61504048 | 5.57E-40 | BCL6 | 0.089150885 | 0.086382304 |
| VSIG4 | 0.524494932 | 0 | IL21 | 0.26668931 | 1.85E-07 |
| MS4A4A | 0.636753326 | 0 | STAT3 | 0.24223252 | 2.53E-06 |
| CEACAM8 | 0.086160103 | 0.09751073 | IL17A | 0.16280217 | 0.001653927 |
| ITGAM | 0.394698933 | 1.72E-15 | FOXP3 | 0.466619616 | 1.86E-21 |
| CCR7 | 0.749726507 | 3.78E-68 | CCR8 | 0.628091839 | 4.15E-42 |
| KIR2DL1 | 0.139414926 | 0.007157941 | STAT5B | 0.093033743 | 0.07349801 |
| KIR2DL3 | 0.338216741 | 2.22E-11 | TGFB1 | 0.441941359 | 0 |
| KIR2DL4 | 0.518825565 | 5.93E-27 | PDCD1 | 0.746149813 | 3.57E-67 |
| KIR3DL1 | 0.295178969 | 6.79E-09 | CTLA4 | 0.748133559 | 1.03E-67 |
| KIR3DL2 | 0.442756938 | 3.05E-19 | LAG3 | 0.626631057 | 0 |
| KIR3DL3 | 0.174882461 | 0.000716424 | HAVCR2 | 0.67277581 | 0 |
| KIR2DS4 | 0.28554748 | 2.16E-08 | GZMB | 0.636271347 | 0 |
| HLA-DPB1 | 0.726406634 | 0 |
Note: HCC Hepatocellular carcinoma
Table 3.
The expression level of SH2D1A was significantly correlated with the expression of immune cell markers in HCC with tumor purity
| Gene | Coefficient | P | Gene | Coefficient | P |
|---|---|---|---|---|---|
| CD8A | 0.85456309 | 1.27E-99 | HLA-DQB1 | 0.583105318 | 8.25E-33 |
| CD8B | 0.743393609 | 7.09E-62 | HLA-DRA | 0.621319185 | 3.20E-38 |
| CD3D | 0.731080308 | 6.62E-59 | HLA-DPA1 | 0.655690032 | 9.07E-44 |
| CD3E | 0.894548317 | 5.35E-122 | CD1C | 0.519231383 | 3.28E-25 |
| CD2 | 0.86471045 | 1.31E-104 | NRP1 | 0.184854906 | 0.000558818 |
| CD19 | 0.547172959 | 2.46E-28 | ITGAX | 0.493683486 | 1.35E-22 |
| CD79A | 0.701937989 | 1.73E-52 | TBX21 | 0.794043823 | 3.79E-76 |
| CD86 | 0.62316122 | 1.68E-38 | STAT4 | 0.558224737 | 1.18E-29 |
| CSF1R | 0.524678418 | 8.50E-26 | STAT1 | 0.543002049 | 7.52E-28 |
| CCL2 | 0.340264645 | 8.47E-11 | IFNG | 0.642013885 | 1.78E-41 |
| CD68 | 0.354422898 | 1.20E-11 | TNF | 0.512228684 | 1.80E-24 |
| IL10 | 0.462535122 | 1.08E-19 | GATA3 | 0.680882767 | 2.55E-48 |
| NOS2 | 0.012074031 | 0.823177975 | STAT6 | 0.152140349 | 0.004623899 |
| IRF5 | 0.197750673 | 0.000218772 | STAT5A | 0.417545542 | 5.48E-16 |
| PTGS2 | 0.286609443 | 6.02E-08 | IL13 | 0.179179251 | 0.00082841 |
| CD163 | 0.498529481 | 4.48E-23 | BCL6 | 0.123503491 | 0.021765188 |
| VSIG4 | 0.374536414 | 6.24E-13 | IL21 | 0.243626764 | 4.70E-06 |
| MS4A4A | 0.509326765 | 3.59E-24 | STAT3 | 0.14196436 | 0.008273776 |
| CEACAM8 | 0.051908934 | 0.336393954 | IL17A | 0.167942121 | 0.001746115 |
| ITGAM | 0.295974154 | 2.10E-08 | FOXP3 | 0.443137012 | 5.01E-18 |
| CCR7 | 0.677354884 | 1.18E-47 | CCR8 | 0.565261309 | 1.61E-30 |
| KIR2DL1 | 0.099904974 | 0.063802467 | STAT5B | 0.224855069 | 2.49E-05 |
| KIR2DL3 | 0.306235488 | 6.34E-09 | TGFB1 | 0.310151688 | 3.96E-09 |
| KIR2DL4 | 0.487657097 | 5.20E-22 | PDCD1 | 0.694787235 | 4.94E-51 |
| KIR3DL1 | 0.269862725 | 3.60E-07 | CTLA4 | 0.690286203 | 3.88E-50 |
| KIR3DL2 | 0.388988451 | 6.57E-14 | LAG3 | 0.60025003 | 3.79E-35 |
| KIR3DL3 | 0.142759694 | 0.007915913 | HAVCR2 | 0.556233637 | 2.06E-29 |
| KIR2DS4 | 0.327847865 | 4.36E-10 | GZMB | 0.570231739 | 3.83E-31 |
| HLA-DPB1 | 0.64683208 | 2.85E-42 |
HCC Hepatocellular carcinoma
Verification of the relationship between SH2D1A and immune cell markers
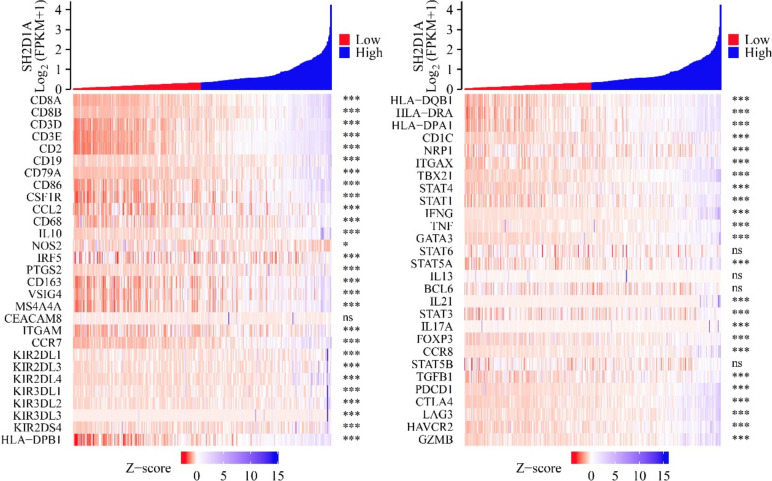
In the TCGA database, the expression level of SH2D1A was significantly correlated with the expression of the immune cell markers ITGAM, HLA-DPB1, CD3D, KIR3DL3, PTGS2, KIR3DL2, VSIG4, KIR3DL1, KIR2DL4, KIR3DL1, KIR2DL3, CCR7, KIR2DL1, CEACAM8, CD163, IRF5, CD79A, NOS2, IL10, CD68, MS4A4A, CCL2, CSF1R, CD86, CD19, KIR2DS4, CD2, CD3E, CD8B, CD8A, and PDCD1 (Fig. 10).
Fig. 10.
SH2D1A expression was significantly correlated with the expression of immune cell markers in HCC. Note: HCC, hepatocellular carcinoma; *, P < 0.05; ***, P < 0.001; ns, no statistical significance
Discussion
Evidence from studies has shown that the inhibition of oncogene expression can delay the progression of HCC, which can improve the prognosis of patients with HCC [10–12]. For example, ATG14 expression is significantly elevated in HCC tissues and cells and indicates a poor prognosis in patients with HCC. Inhibition of ATG14 expression attenuates HCC cell proliferation and migration. XIST can promote autophagy by promoting the expression of ATG14 [10]. In addition, SH2D1A mutations are associated with disease progression [13–16], while the roles of SH2D1A in HCC and other cancers have not been identified. We found that genes co-expressed with SH2D1A are associated with leukocyte cell‒cell adhesion, cell proliferation, migration, T-cell differentiation, granulocyte migration, B-cell activation, and cell death. In addition, increased expression of SH2D1A can promote cell proliferation, cell invasion and migration in HCC cell models according to CCK-8 and Transwell assays.
Recent studies have indicated that abnormal gene expression and Nf-κB signaling mechanisms may be involved in the progression of cancer [17–21]. For example, the expression levels of CD13 are higher in metastatic HCC tissues than in primary HCC tissues. Overexpression of CD13 predicts a poor prognosis in HCC patients. CD13 can promote the proliferation, invasion, cell cycle progression and sorafenib resistance of HCC cells, which is consistent with the finding that HDAC5-LSD1-Nf-κB is related to the activation of carcinogenic signaling [19]. The increased expression of ZNF545 can inhibit the proliferation, migration and invasion of HCC cells, induce the G1/S phase arrest and apoptosis of SNU449 and Huh7 cells, and inhibit the tumor growth of SNU449 cell-xenografted mice, which is related to the inactivation of the Nf-κB signaling pathway [21]. In our study, SH2D1A was associated with the Nf-κB signaling pathway according to KEGG analysis, and SH2D1A overexpression significantly increased p-Nf-κB and BCL2A1 protein levels in HCC cell models. In addition, BCL2A1 is a member of the Nf-κB signaling pathway. Therefore, preliminary evidence suggests that SH2D1A may promote HCC progression through the Nf-κB signaling pathway.
The immune microenvironment contributes to HCC progression [22–25]. PD-1 inhibitor therapy is well tolerated and has potential clinical benefits as a first-line therapy. The median OS of patients with HCC was 6.6 months, the PFS was 5.3 months, and the overall response rate (ORR) was 30.8%. Moreover, one patient achieved a complete response [24]. SH2D1A expression was found to be associated with the HCC immune microenvironment in our study. SH2D1A expression was found to be correlated with the immune score, stromal score, ESTIMATE score, and levels of B cells, CD8+ T cells, T cells, T helper cells, Tfh cells, Th1 cells, Th2 cells, Tregs, and other cells and was associated with the progression of the disease. The expression levels of SH2D1A were significantly correlated with the levels of the immune cell markers CD3E, CD2, CD8A, CD8B, CD3D, CD79A, PDCD1, CTLA4, and others.
Based on our research, we first reported the role of SH2D1A in the progression of HCC and its potential signaling mechanism, providing a new theoretical basis for the treatment of HCC patients. However, this study still has some limitations. In the future, we need to explore the expression levels of SH2D1A in HCC tissues and the relationship between SH2D1A overexpression and poor prognosis and clinicopathological features of HCC patients. In addition, we should identify the targets of SH2D1A through bioinformatics analysis and RNA sequencing to further understand the signaling mechanisms of SH2D1A in HCC cell models.
Conclusion
SH2D1A overexpression promotes cancer cell growth and metastasis via the Nf-κB signaling pathway and is significantly related to the immune microenvironment in HCC. These results show that SH2D1A is a therapeutic target for HCC patients.
Supplementary Information
Additional file 1: Figure S1. SH2D1A expression is significantly correlated with immune cell abundance according to data from the TCGA database. Table S1. Five hundred and sixty-seven SH2D1A co-expressed genes. Table S2. The functions of SH2D1A co-expressed genes.
Acknowledgements
Not applicable.
Authors’ contributions
Qian-Ming Xiang, Kai Li, Qiang Guo, Ni Jiang, and Wei Zhang designed the study and formulated the implementation method. Qian-Ming Xiang, Ni Jiang, and Yue-Feng Liu drafted the manuscript. Yuan-Biao Wang, Rong Liu, Qiang Guo and Wei Zhang processed the research data. Kai Li, De-An Mu and Lu-Yun Sun edited and revised the manuscript. All authors have read and approved the manuscript.
Funding
No funding.
Availability of data and materials
The data are available in the TCGA (https://portal.gdc.cancer.gov/) database and can be downloaded directly.
Declarations
Ethics approval and consent to participate
This study does not involve animal and human ethics.
Consent for publication
Not applicable.
Competing interests
The authors declare no competing interests.
Footnotes
Publisher’s Note
Springer Nature remains neutral with regard to jurisdictional claims in published maps and institutional affiliations.
Qian-Ming Xiang, Ni Jiang and Yue-Feng Liu are co-frist author.
Contributor Information
Wei Zhang, Email: zw68229@sina.com.
Qiang Guo, Email: guoqianglidan@163.com.
Kai Li, Email: likaisurgeon@163.com.
References
- 1.Yang J, Wang B, Xu Q, Yang Y, Hou L, Yin K, Guo Q, Hua Y, Zhang L, Li Y, et al. TMEM166 inhibits cell proliferation, migration and invasion in hepatocellular carcinoma via upregulating TP53. Mol Cell Biochem. 2021;476(2):1151–1163. doi: 10.1007/s11010-020-03979-1. [DOI] [PubMed] [Google Scholar]
- 2.Li D, Ji YM, Guo JL, Guo Q. Upregulated expression of MTFR2 as a novel biomarker predicts poor prognosis in hepatocellular carcinoma by bioinformatics analysis. Future Oncol. 2021;17:3187–3201. doi: 10.2217/fon-2020-1160. [DOI] [PubMed] [Google Scholar]
- 3.Liang Y, Luo H, Zhang H, Dong Y, Bao Y. Oncogene Delta/Notch-Like EGF-Related Receptor Promotes Cell Proliferation, Invasion, and Migration in Hepatocellular Carcinoma and Predicts a Poor Prognosis. Cancer Biother Radiopharm. 2018;33(9):380–386. doi: 10.1089/cbr.2018.2460. [DOI] [PMC free article] [PubMed] [Google Scholar]
- 4.Shi M, Lv X, Zhu M, Dong Y, Hu L, Qian Y, Fan C, Tian N. HMGA1 promotes hepatocellular carcinoma proliferation, migration, and regulates cell cycle via miR-195-5p. Anticancer Drugs. 2022;33(1):e273–e285. doi: 10.1097/CAD.0000000000001201. [DOI] [PubMed] [Google Scholar]
- 5.Xu Z, Peng B, Liang Q, Chen X, Cai Y, Zeng S, Gao K, Wang X, Yi Q, Gong Z, et al. Construction of a Ferroptosis-Related Nine-lncRNA Signature for Predicting Prognosis and Immune Response in Hepatocellular Carcinoma. Front Immunol. 2021;12:719175. doi: 10.3389/fimmu.2021.719175. [DOI] [PMC free article] [PubMed] [Google Scholar]
- 6.Liu R, Wang G, Zhang C, Bai D. A prognostic model for hepatocellular carcinoma based on apoptosis-related genes. World J Surg Oncol. 2021;19(1):70. doi: 10.1186/s12957-021-02175-9. [DOI] [PMC free article] [PubMed] [Google Scholar]
- 7.Li F, Li K, Li D, Zhang W, Yang KW, Ke D, Guo Q, Shi RS. ATG10 overexpression is related to the dismal prognosis and promotes the growth and migration of hepatocellular carcinoma cells via cyclin B1/CDK1 and CDK2. Am J Cancer Res. 2023;13(4):1188–1208. [PMC free article] [PubMed] [Google Scholar]
- 8.Tang X, Huang X, Wang D, Yan R, Lu F, Cheng C, Li Y, Xu J. Identifying gene modules of thyroid cancer associated with pathological stage by weighted gene co-expression network analysis. Gene. 2019;704:142–148. doi: 10.1016/j.gene.2019.04.017. [DOI] [PubMed] [Google Scholar]
- 9.Zhang Z, Luo A, Zeng Z, Zhou Y, Wu W. Identification of hub genes and functional modules in colon adenocarcinoma based on public databases by bioinformatics analysis. J Gastrointest Oncol. 2021;12(4):1613–1624. doi: 10.21037/jgo-21-415. [DOI] [PMC free article] [PubMed] [Google Scholar]
- 10.Zhu XJ, Jin X, Dai L, Liu X, Liu Z. ATG4 promotes cell proliferation, migration and invasion in HCC and predicts a poor prognosis. Eur Rev Med Pharmacol Sci. 2020;24(24):12686–12693. doi: 10.26355/eurrev_202012_24166. [DOI] [PubMed] [Google Scholar]
- 11.Huang K, Xie W, Wang S, Li Q, Wei X, Chen B, Hua Y, Li S, Peng B, Shen S. High SPINK1 Expression Predicts Poor Prognosis and Promotes Cell Proliferation and Metastasis of Hepatocellular Carcinoma. J Invest Surg. 2021;34(9):1011–1020. doi: 10.1080/08941939.2020.1728443. [DOI] [PubMed] [Google Scholar]
- 12.Wang G, Zhou H, Gu Z, Gao Q, Shen G. Oct4 promotes cancer cell proliferation and migration and leads to poor prognosis associated with the survivin/STAT3 pathway in hepatocellular carcinoma. Oncol Rep. 2018;40(2):979–987. doi: 10.3892/or.2018.6491. [DOI] [PubMed] [Google Scholar]
- 13.Sumazaki R, Kanegane H, Osaki M, Fukushima T, Tsuchida M, Matsukura H, Shinozaki K, Kimura H, Matsui A, Miyawaki T. SH2D1A mutations in Japanese males with severe Epstein-Barr virus–associated illnesses. Blood. 2001;98(4):1268–1270. doi: 10.1182/blood.V98.4.1268. [DOI] [PubMed] [Google Scholar]
- 14.Torralba-Raga L, Tesi B, Chiang SCC, Schlums H, Nordenskjöld M, Horne A, Henter JI, Meeths M, Abdelhaleem M, Weitzman S, et al. Diagnostic challenges for a novel SH2D1A mutation associated with X-linked lymphoproliferative disease. Pediatr Blood Cancer. 2020;67(4):e28184. doi: 10.1002/pbc.28184. [DOI] [PubMed] [Google Scholar]
- 15.Koochakzadeh L, Hosseinverdi S, Hedayat M, Farahani F, Tofighi A, Eghbali M, Bidoki AZ, Izadyar M, Rahiminejad MS, Ramyar A, et al. Study of SH2D1A gene mutation in paediatric patients with B-cell lymphoma. Allergol Immunopathol (Madr) 2015;43(6):568–570. doi: 10.1016/j.aller.2015.01.007. [DOI] [PubMed] [Google Scholar]
- 16.Liang JH, Zhu HY, Xu DM, Wang L, Wang Y, Qiao C, Wu YJ, Wang R, Li JY, Xu W. A new SH2D1A mutation in a female adult XLP disease with hemophagocytic lymphohistiocytosis and NK-cell leukemia. Ann Hematol. 2019;98(12):2829–2831. doi: 10.1007/s00277-019-03810-y. [DOI] [PubMed] [Google Scholar]
- 17.Zhou X, Chen D, Yan Y, Li Q, Xing W, Liu Y, Chen Y, Wang D, Yuan Y, Xie J, Zeng W, Pan J. The nociceptin receptor promotes autophagy through Nf-κB signaling and is transcriptionally regulated by E2F1 in HCC. Cell Death Discov. 2022;8(1):165. doi: 10.1038/s41420-022-00978-7. [DOI] [PMC free article] [PubMed] [Google Scholar]
- 18.Chen L, Lin X, Lei Y, Xu X, Zhou Q, Chen Y, Liu H, Jiang J, Yang Y, Zheng F, Wu B. Aerobic glycolysis enhances HBx-initiated hepatocellular carcinogenesis via NF-κBp65/HK2 signalling. J Exp Clin Cancer Res. 2022;41(1):329. doi: 10.1186/s13046-022-02531-x. [DOI] [PMC free article] [PubMed] [Google Scholar]
- 19.Hu B, Xu Y, Li YC, Huang JF, Cheng JW, Guo W, Yin Y, Gao Y, Wang PX, Wu SY, Zhou J, Fan J, Yang XR. CD13 promotes hepatocellular carcinogenesis and sorafenib resistance by activating HDAC5-LSD1-NF-κB oncogenic signaling. Clin Transl Med. 2020;10(8):e233. doi: 10.1002/ctm2.233. [DOI] [PMC free article] [PubMed] [Google Scholar]
- 20.Yang Q, Zhang J, Xu S, Jia C, Meng W, Tang H, Zhang X, Zhang Y, Fu B. Knockdown of PHF5A Inhibits Migration and Invasion of HCC Cells via Downregulating NF-κB Signaling. Biomed Res Int. 2019;2019:1621854. doi: 10.1155/2019/1621854. [DOI] [PMC free article] [PubMed] [Google Scholar]
- 21.Yang W, Yang S, Zhang M, Gao D, He T, Guo M. ZNF545 suppresses human hepatocellular carcinoma growth by inhibiting Nf-κB signaling. Genes Cancer. 2017;8(3–4):528–535. doi: 10.18632/genesandcancer.137. [DOI] [PMC free article] [PubMed] [Google Scholar]
- 22.Wang D, Hu X, Xiao L, Long G, Yao L, Wang Z, Zhou L. Prognostic Nutritional Index and Systemic Immune-Inflammation Index Predict the Prognosis of Patients with HCC. J Gastrointest Surg. 2021;25(2):421–427. doi: 10.1007/s11605-019-04492-7. [DOI] [PMC free article] [PubMed] [Google Scholar]
- 23.Shi J, Liu J, Tu X, Li B, Tong Z, Wang T, Zheng Y, Shi H, Zeng X, Chen W, et al. Single-cell immune signature for detecting early-stage HCC and early assessing anti-PD-1 immunotherapy efficacy. J Immunother Cancer. 2022;10(1):e003133. doi: 10.1136/jitc-2021-003133. [DOI] [PMC free article] [PubMed] [Google Scholar]
- 24.Mahn R, Vogt A, Kupczyk P, Sadeghlar F, van Beekum K, Hüneburg R, Meyer C, Toma M, Ahmadzadehfar H, Essler M, et al. Programmed cell death protein 1 (PD-1)-inhibition in hepatocellular carcinoma (HCC): a single center experience. Scand J Gastroenterol. 2020;55(9):1057–1062. doi: 10.1080/00365521.2020.1794539. [DOI] [PubMed] [Google Scholar]
- 25.Liu X, Li M, Wang X, Dang Z, Jiang Y, Wang X, Kong Y, Yang Z. PD-1+ TIGIT+ CD8+ T cells are associated with pathogenesis and progression of patients with hepatitis B virus-related hepatocellular carcinoma. Cancer Immunol Immunother. 2019;68(12):2041–2054. doi: 10.1007/s00262-019-02426-5. [DOI] [PMC free article] [PubMed] [Google Scholar]
Associated Data
This section collects any data citations, data availability statements, or supplementary materials included in this article.
Supplementary Materials
Additional file 1: Figure S1. SH2D1A expression is significantly correlated with immune cell abundance according to data from the TCGA database. Table S1. Five hundred and sixty-seven SH2D1A co-expressed genes. Table S2. The functions of SH2D1A co-expressed genes.
Data Availability Statement
The data are available in the TCGA (https://portal.gdc.cancer.gov/) database and can be downloaded directly.


