

Abstract
EBT-XD model of Gafchromic™ films has a broader optimal dynamic dose range, up to 40 Gy, compared to its predecessor models. This characteristic has made EBT-XD films suitable for high-dose applications such as stereotactic body radiotherapy and stereotactic radiosurgery, as well as ultra-high dose rate FLASH radiotherapy. The purpose of the current study was to characterize the dependence of EBT-XD film response on linear energy transfer (LET) and dose rate of therapeutic protons from a synchrotron. A clinical spot-scanning proton beam was used to study LET dependence at three dose-averaged LET (LETd) values of 1.0 keV/µm, 3.6 keV/µm, and 7.6 keV/µm. A research proton beamline was used to study dose rate dependence at 150 Gy/second in the FLASH mode and 0.3 Gy/second in the non-FLASH mode. Film response data from LETd values of 0.9 keV/µm and 9.0 keV/µm of the proton FLASH beam were also compared. Film response data from a clinical 6 MV photon beam were used as a reference. Both gray value method and optical density (OD) method were used in film calibration. Calibration results using a specific OD calculation method and a generic OD calculation method were compared. The four-parameter NIH Rodbard function and three-parameter rational function were compared in fitting the calibration curves. Experimental results showed that the response of EBT-XD film is proton LET dependent but independent of dose rate. Goodness-of-fit analysis showed that using the NIH Rodbard function is superior for both protons and photons. Using the “specific OD + NIH Rodbard function” method for EBT-XD film calibration is recommended.
Keywords: EBT-XD film, proton therapy, FLASH dose rate, linear energy transfer (LET)
Graphical Abstract
The results of dose-rate independence of EBT-XD film to protons are shown in Figure G1. The FLASH dose rate is 150 Gy/s and the non-FLASH dose rate is 0.3 Gy/s. The linear energy transfer (LET) dependence of EBT-XD film to proton beams are shown in Figure G2. Film calibration curves from three different dose-averaged LET (LETd) values (1.0 keV/µm, 3.6 keV/µm, and 7.6 keV/µm) using clinical 87.2 MeV protons are compared in Figure G2(A). Film calibration curves from two LETd values (0.9 keV/µm and 9.0 keV/µm) using FLASH 87.2 MeV protons are compared in Figure G2(B).
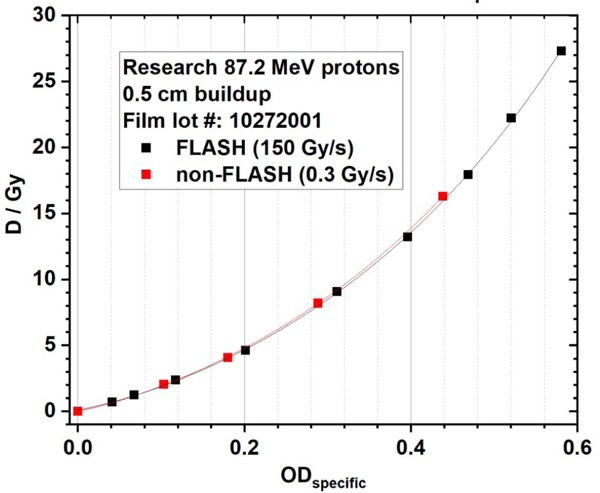
Figure G1. Dose rate independence of EBT-XD film to proton beams. The FLASH dose rate is 150 Gy/s and the non-FLASH dose rate is 0.3 Gy/s.
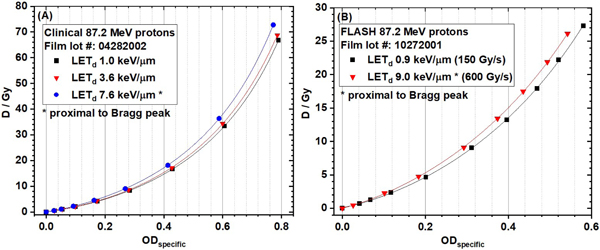
Figure G2. Linear energy transfer (LET) dependence of EBT-XD film to proton beams. (A) Film calibration curves from three different dose-averaged LET (LETd) values using clinical 87.2 MeV protons. (B) Film calibration curves from two LETd values using FLASH 87.2 MeV protons.
1. Introduction
Gafchromic™ films have been broadly applied in radiotherapy to measure the absorbed dose of ionizing radiation1. The most commonly used Gafchromic™ films for quantitative dosimetry are the series of EBT films. Although the name EBT stands for external beam therapy, EBT films can also be applied in brachytherapy dosimetry. There have been four generations of EBT films: the inaugural EBT, EBT-2, EBT-3, and the high-dose extended model, EBT-XD. All models have laminated structures with inner active (sensitive to radiation) layer(s) and outer protective layers. EBT type films have many inherent advantages in dosimetry such as their submillimeter thickness and near water or tissue equivalency. They are also ideal for dosimetry in the high dose gradient region owing to their high (submillimeter) spatial resolution. The early EBT and EBT-2 films were discontinued because of deficits such as response dependence on radiation beam energy2, and lateral response artifacts. The successor EBT-3 and EBT-XD models have greatly improved performance in dose response because the cross-lamination technique is applied in the film coating. For example, the film lateral response artifact is minimal if the film is placed at the center of the flatbed scanner during scanning. In addition, response dependence on photon energy is low, with a difference of <5% between 100 keV and 18 MeV (http://www.gafchromic.com). At the completion of the current report, a new EBT-4 model was released into market. According to the product description of EBT-4, its dosimetry performance is superior to EBT-3 with reduced noise. The characterization of EBT-4 model by users was not conducted yet. The discussion on EBT-4 model is out of the scope of the current report.
Both EBT-3 and EBT-XD models have a three-layer symmetric structure, including two outer protective layers (125-µm matte surface clear polyester) and a central active layer (28 µm for EBT-3 and 25 µm for EBT-XD). The proportion of the yellow marker dye in the active layer is different between the two models, which is why EBT-3 appears yellow and EBT-XD is greener. The dynamic dose range of EBT-3 film is 0.2 Gy to 10 Gy for best performance, making it suitable for conventional external beam therapy and brachytherapy. At higher doses, the response of EBT-3 films tends to saturate. In contrast, the best performance dose range of EBT-XD film is 0.4 Gy to 40 Gy, extending its applications to stereotactic radiosurgery and stereotactic body radiotherapy.
Besides photon and electron dosimetry, the series of EBT films can be extended to ion therapy, such as protons and heavier ions. However, ion beams have unique physics characteristics in terms of spatial dose distribution. Along the beam direction, after a steady dose buildup region, the dose increases rapidly until it reaches a peak, namely the Bragg peak, and then the dose falls sharply3. The unique shape of the depth dose curve of an ion beam is mainly caused by variation of the linear energy transfer (LET) of primary ions and attenuation of ion fluence4. In general, LET increases as charged particle energy decreases5. Therefore, LET of the primary ion beam increases along the ion beam path and reaches its maximum at the end of the range6–8. Studies have reported LET dependence in EBT-2 and EBT-3 films9, 10, but quantitative analyses of LET dependence in EBT-XD films are scarce. Therefore, the first aim of the current study was to characterize the proton LET dependence of EBT-XD films. Response of the films to photon irradiations was used as a reference.
Regarding the impact of dose rate on response in films, the change of the chemical structure of the active ingredients was found to be related to only the accumulated dose regardless of the dose rate11–13. The property of dose-rate independence has made EBT-3 and EBT-XD films very useful in studies of ultra-high dose rate (average >40 Gy/second) radiotherapy, namely FLASH14. Researchers used EBT-3 or EBT-XD films, calibrated at the clinical dose rate (e.g., average 2 Gy/min), as reference dosimeters to quantify the ion collection efficiency of ion chambers at FLASH dose rate by assuming dose-rate independence in these films15, 16. However, a recent study reported the average dose-rate dependence of response of EBT-3 and EBT-XD films when the dose was higher than 10 Gy17 with an isochronous cyclotron-based proton FLASH. These findings motivated us to investigate dose-rate dependence of the response of films for a synchrotron-based proton FLASH beam, which was the second aim of the current study. We hypothesized that different pulse-time structures between cyclotrons and synchrotrons could cause different dose-rate responses in films. EBT-3 films have been used in many previous FLASH experiments with doses higher than 10 Gy15, 16, 18. Although their doses were out of the optimal dose response range of EBT-3 films, the authors reported no issues in dosimetry. Nevertheless, only EBT-XD films were selected in our study to take advantage of the higher optimal dose response range (up to 40 Gy).
Lastly, different methods for film analysis were compared in the current study, i.e., gray value or optical density to dose conversion. Fitting results from the three-parameter rational function and the four-parameter NIH Rodbard function for film calibration were also compared. The third aim of the current study was to seek an optimal film analysis and calibration method for research and clinical applications.
2. Materials and Methods
EBT-XD films (Ashland Specialty Ingredients, G.P., Wilmington, DE) were used in the current study to investigate their dependence on proton LET and dose rate, with photon irradiation as a reference. Three different batches of films were used for three different irradiators: a clinical proton machine, a research proton-FLASH machine, and a clinical linear accelerator (LINAC). The lot number of each film batch is provided when the related results are presented (also available in Table S1 in the Supplementary Materials).
2.1. Proton irradiations using a clinical spot-scanning beamline
Proton LET dependence of EBT-XD films was studied using the clinical spot-scanning proton machine at The University of Texas MD Anderson Cancer Center Proton Therapy Center. The Hitachi synchrotron (Hitachi, Ltd., Tokyo, Japan) was designed to deliver 94 discrete proton energies from 72.5 MeV to 221.8 MeV to cover a nominal range from 4.0 cm to 30.6 cm in water19. The 87.2 MeV proton beam (nominal range of 5.7 cm in water) was selected for the current study. A spot-scanning pattern was designed to deliver a 5 cm × 5 cm uniform field in the isocenter plane with an average dose rate of approximately 2 Gy/minute therein.
Three different buildup thicknesses were used to study proton LET dependence. The water-equivalent thicknesses of the buildup (plastic water phantom) were 1.0, 5.4, and 5.6 cm. The gantry was rotated to 180° to facilitate the experimental setup. A custom rigid hollow supporter (made of Lucite, with a 20 cm × 20 cm open area) was mounted on the snout of the nozzle. The top surface of the hollow supporter was in the isocenter plane. The buildup phantom and other devices were then placed on top of the supporter. In the experiment using clinical protons, the film and the ion chamber were irradiated separately. Experimental setups with ion chamber measurements and film irradiations are illustrated in Figure 1, and the actual experimental setups are shown in Figure S1 in the Supplementary Materials.
Figure 1.
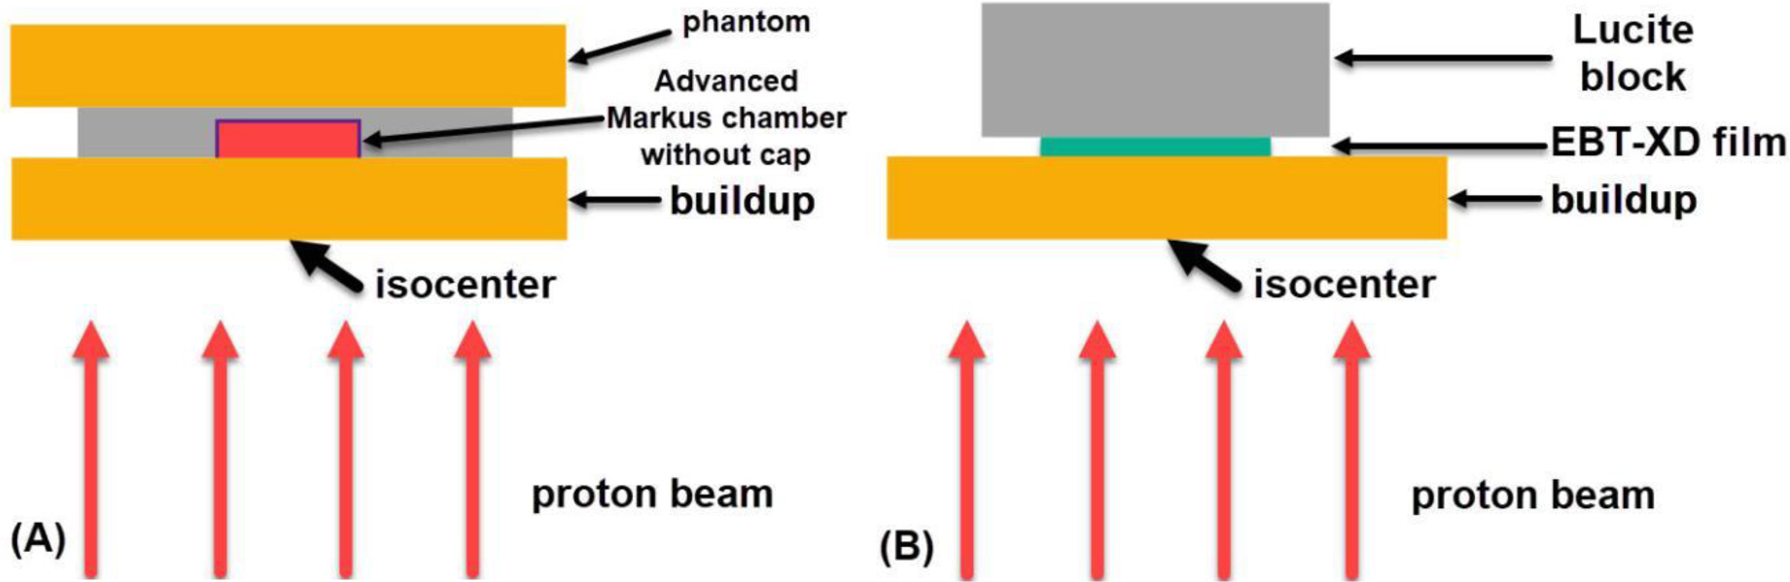
(A) Illustration of experimental setup for proton dose measurement using the Advanced Markus chamber without the protection cap in place. (B) Illustration of experimental setup for EBT-XD film irradiation. The clinical spot-scanning protons of 87.2 MeV were used to generate a 5 cm × 5 cm uniform dose field in the isocenter plane. The gantry was rotated to 180°.
Prior to film irradiation, a plane-parallel Advanced Markus chamber (model 34045, SN 0294) from PTW (Freiburg, Germany), embedded in a custom holder, was placed downstream of the buildup phantom to measure the dose in the field center at different depths, as shown in Figure 1A. A plastic water slab was placed on the ion chamber holder to make the experimental setup stable. The waterproof protection cap was removed during measurement. The effective point of dose measurement of the Advanced Markus chamber is under the entrance foil (0.03 mm polyethylene) of the sensitive volume. The quality conversion factor, kQ, of protons with different residual ranges listed in Table 10. III of the International Atomic Energy Agency TRS-398 report20 was applied corresponding to each measurement depth. Other correction factors including air pressure and temperature, ion collection efficiency, and polarization were also applied in the dose measurement. At least three repeating measurements were performed for each phantom thickness, and the dose fluctuation (standard deviation/mean) was found to be <0.5% for all setups. The dose conversion factor (Gy per monitor unit [MU]) for each phantom thickness was derived from the ion chamber measurement and was used in film irradiations.
A whole piece of EBT-XD film was cut into strips, and each film strip (2.54 cm × 5.08 cm) was marked with its original orientation on the whole film. A piece of film strip was placed and taped at the center of the field atop the plastic water buildup, and then a thick Lucite block was used to hold down the film strip, as shown in Figure 1B. The transparent Lucite block can help visualize any film strip misalignment.
The water-equivalent thickness of the EBT-XD film is approximately 0.3 mm; therefore, with the same phantom thickness, the film center (effective location of dose measurement) is 0.15 mm deeper than the effective depth of the ion chamber measurement. Neglecting this 0.15-mm thickness could result in errors in dose and LET in the Bragg peak region9. Therefore, Monte Carlo simulations were used to more accurately calculate dose to the film center and proton LET therein. On the Monte Carlo calculated dose curve, at the 0.15-mm deeper location (the film center), the dose ratios were 1.00, 1.02, and 1.04, corresponding to the 1.0, 5.4 and 5.6 cm depths (ion chamber location) in water. Monte Carlo calculated proton dose-averaged LET (LETd) values at the film center are 1.0, 3.6, and 7.6 keV/µm, respectively. Experimental parameters of film irradiations using the clinical spot-scanning proton nozzle are summarized in Table S2 in the Supplementary Materials.
Eight dose levels ranging from approximately 0.5 Gy to 70 Gy were delivered for each of the three different phantom thicknesses. The monitor units needed for each beam delivery were pre-calculated based on the ion chamber measured dose conversion factor (Gy/MU) for each phantom thickness. Only one piece of film strip was irradiated in each beam delivery. The film strips after irradiation with different doses at the three depths are shown in Figure S2 in the Supplementary Materials.
2.2. Proton irradiations using a research FLASH beamline
A horizontal proton beamline (87.2 MeV) at the MD Anderson Proton Therapy Center was commissioned to deliver dose with different dose rates in either FLASH (> 40 Gy/s) or non-FLASH mode21, 22. Different beam-shaping or modulation devices have been designed to meet the needs of different preclinical research22, 23. In the current study, only the first scatterer (a 0.3 mm-thick tungsten foil) was used to broaden the beamlet. Therefore, a single beamlet, rather than a large uniform field, was used in this section.
In the experiment using the research horizontal beamline, the film and the Advanced Markus chamber were irradiated simultaneously with the ion chamber downstream next to the film. In the FLASH mode, the ion collection efficiency of the Advanced Markus chamber was 99.5% (at 300 V)21, making it suitable for accurate dose measurement in both FLASH and non-FLASH modes of the proton synchrotron. The output dose fluctuation (standard deviation/mean) of Gy/MU measured using the Advanced Markus chamber was 1.1% in the FLASH mode and 0.5% in the non-FLASH mode21. More details can be found in the commissioning report of the proton FLASH beamline21. The experimental setup is illustrated in Figure 2, and the actual experimental setup can be found in Figure S3 in the Supplementary Materials. The order of components in the setup along the beam direction was as follows: plastic water phantom buildup, film, and Advanced Markus chamber without the protection cap.
Figure 2.
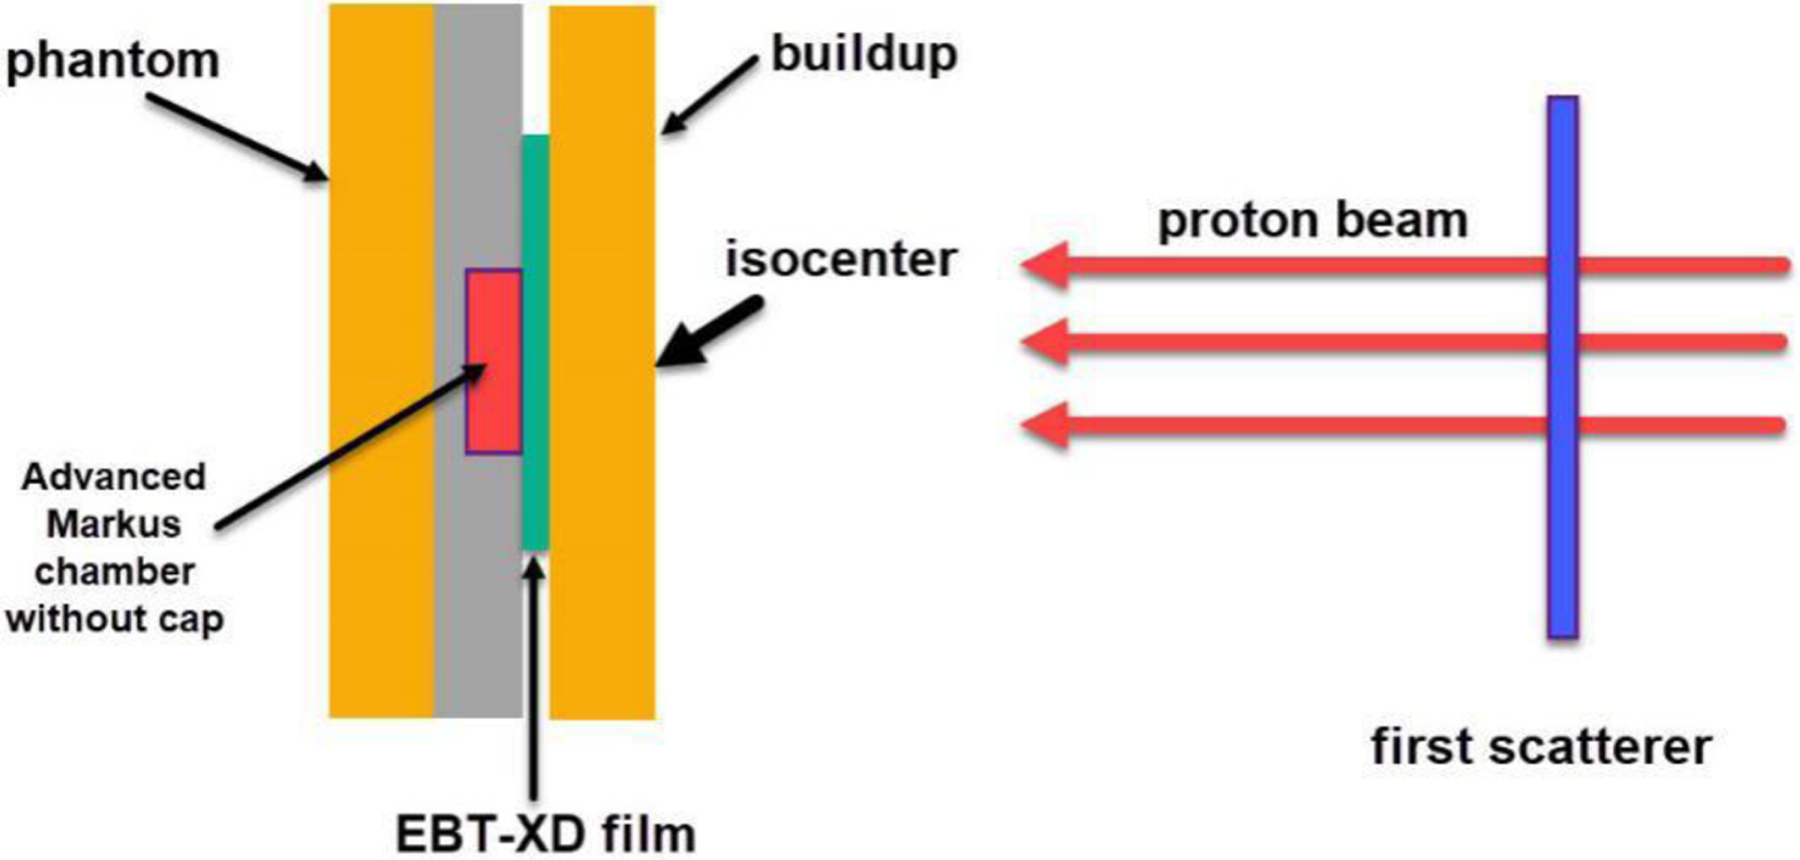
Illustration of experimental setup using the horizontal proton beamline. The first scatterer was used to broaden the beamlet laterally. The EBT-XD film was placed between the plastic water phantom buildup and the Advanced Markus chamber.
A quasi-Gaussian proton spot can be visualized on the irradiated film (Figure S4 in the Supplementary Materials). The radius of the sensitive volume of the Advanced Markus chamber was 2.5 mm. To make the dose measurement region consistent between the ion chamber and the film, we used the central circle region (r = 2.5 mm) of the spot on the film as the region of interest (ROI) for film analysis. The dose to the film ROI was determined from the Monte Carlo-calculated depth dose curve (dose scorer r = 2.5 mm) and the ion chamber measurement by considering the 0.15 mm difference in depth. From our Monte Carlo calculations, the ratios of dose to spot center ROI on the film to dose to ion chamber were 1.00 and 0.98, corresponding to the 0.5 cm and 5.5 cm plastic water phantom buildup. The film center was 0.15 mm deeper than the buildup phantom thickness, and the entrance window location of the ion chamber was 0.3 mm deeper than the buildup phantom thickness (Table S3 in the Supplementary Materials).
The pulse structure, including the beam-on time, of each FLASH spill was recorded by an oscilloscope (Tektronix, TDS 3014B) connected to the beam monitoring circuit. The average FLASH dose rate was then determined by the delivered dose and the beam delivery time recorded by the oscilloscope. In the non-FLASH mode, the number of beam delivery spills (pulses) was recorded. The synchrotron operation cycle is 2 seconds including a 0.5 second beam-on time (a full spill length in the non-FLASH mode) and a 1.5 second beam-off time. The total beam delivery time was estimated as the product of 2 seconds and the number of spills. The non-FLASH dose rate to the film was calculated as the ratio of the delivered dose (ion chamber measurement with Monte Carlo correction) to the beam delivery time.
In the current study, at the entrance region (0.5 cm plastic water buildup), the FLASH dose rate (average) was 150 Gy/s, and the non-FLASH dose rate (average) was 0.3 Gy/s (higher than the current clinical dose rate of approximately 0.03 Gy/s). In the setup with films located proximal to the Bragg peak (5.5 cm plastic water buildup), the FLASH dose rate (average) was 600 Gy/s. Monte Carlo calculated proton LETd values are 0.9 keV/µm and 9.0 keV/µm at 0.515 cm and 5.515 cm depths, respectively (phantom thickness + 0.15 mm film center location). To produce smooth film response curves, we delivered multiple doses ranging from approximately 0.5 Gy to 27 Gy.
2.3. Monte Carlo simulations of proton irradiations
Both the clinical spot-scanning nozzle and the research horizontal beamline (FLASH and non-FLASH mode) were modeled using the Geant424 Monte Carlo toolkit. The Monte Carlo calculated dose distributions were validated using the ion chamber measurements. Proton LETd values were also calculated from Monte Carlo simulations. Details about the Monte Carlo modeling and calculations can be found in our previous studies21, 25–27.
2.4. Photon irradiations using a medical LINAC
The reference photon irradiations to EBT-XD films were carried out using a Varian TrueBeam LINAC (Varian Medical Systems, Palo Alto, CA) at Yale New Haven Hospital. The gantry was rotated to 0°. The source-to-surface distance was set to 100 cm. The uniform field size was set to 10 cm × 10 cm in the isocenter plane. The film strip (2.54 cm × 20.32 cm) was positioned at the 1.5-cm water equivalent depth (solid water phantom) followed by a thick phantom for backscattering compensation. 6 MV photon beams were used, and the dose rate was set to 600 MU/min (0.1 Gy/s to film). The experimental setup using photons is illustrated in Figure 3, and the actual setup can be found in Figure S5 in the Supplementary Materials. Eight film strips were irradiated at doses ranging from 0.5 to 32 Gy, and one unirradiated film strip was used as a control. The film strips after irradiation are shown in Figure S6 in the Supplementary Materials.
Figure 3.
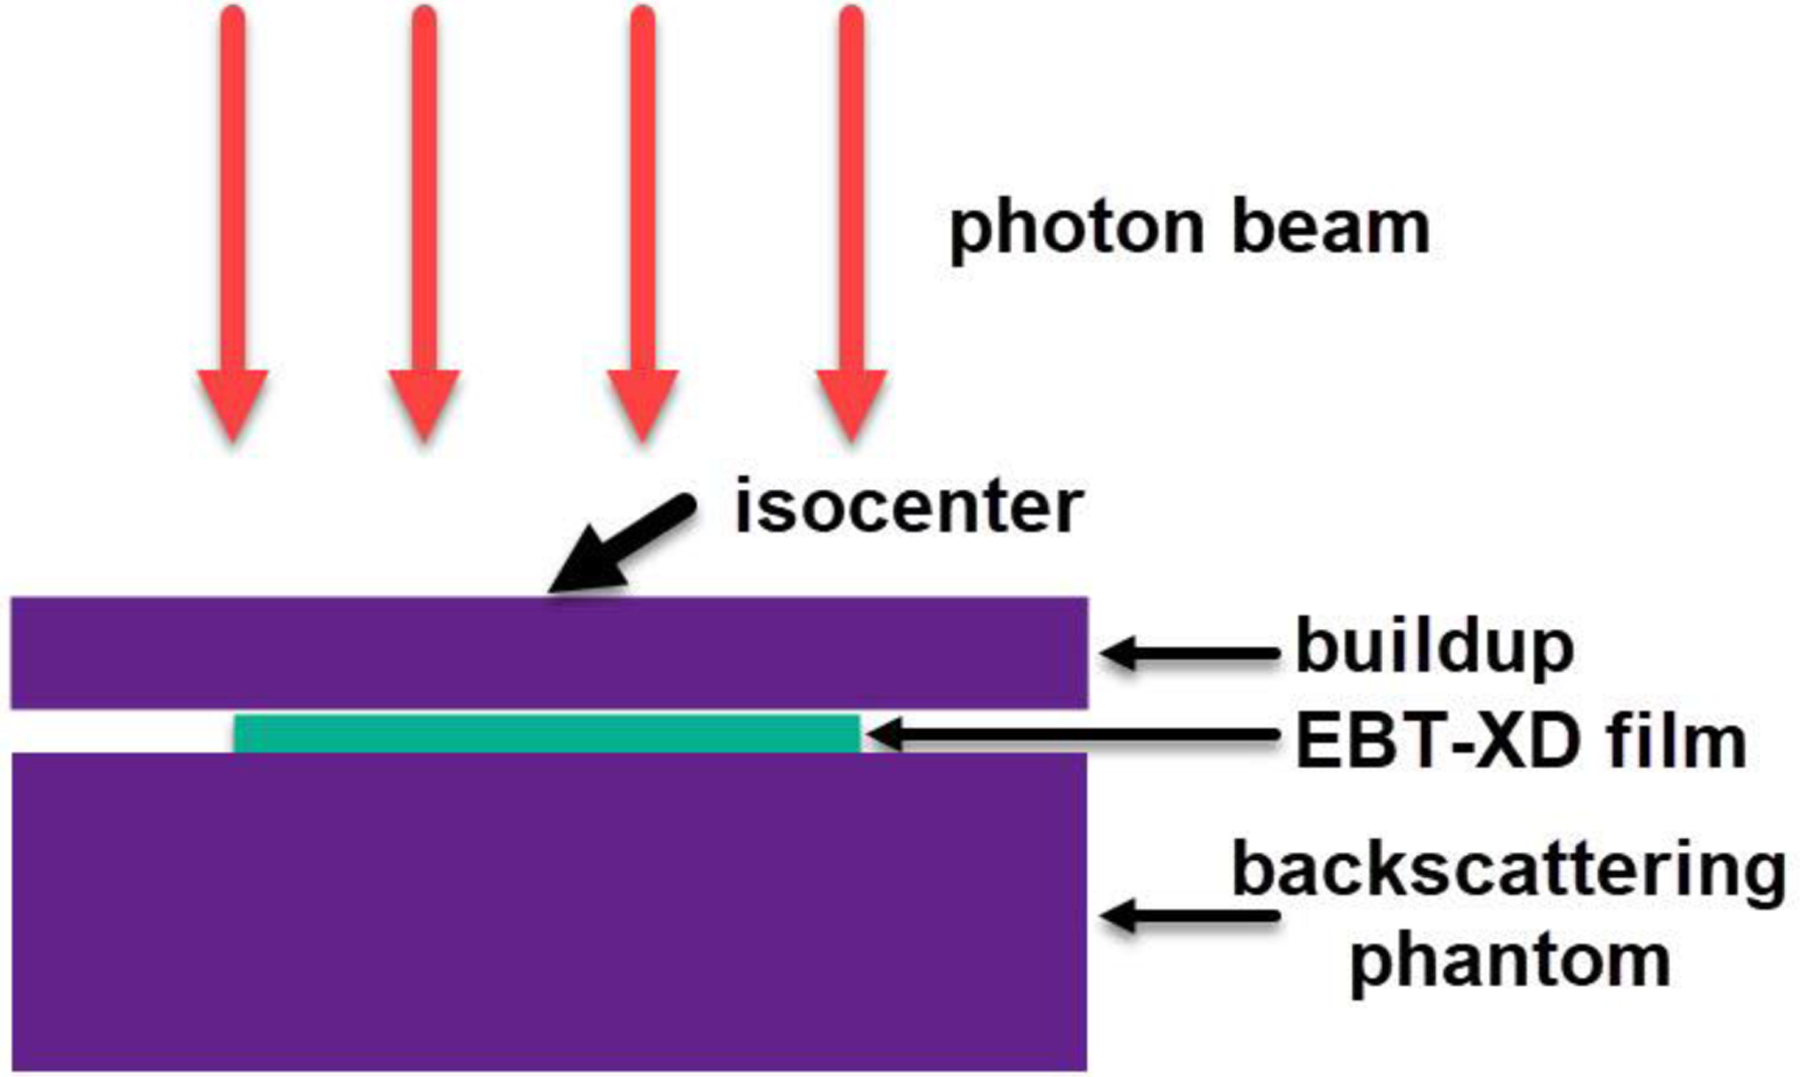
Illustration of experimental setup using a 6 MV photon beam. The gantry was rotated to 0°. The film was placed at the field center between the buildup phantom and the backscattering phantom.
The absolute doses from the LINAC were calibrated according to the TG-51 protocol by the American Association of Physicists in Medicine28. A Farmer-type ion chamber (TN30013, SN 0212) from PTW (Freiburg, Germany) was used in the absolute dosimetry. The film irradiations were performed soon after the TG-51 reference dose calibration of the LINAC (with an output deviation < 1%). By considering experimental setup errors and machine output fluctuations, we were able to estimate the dose uncertainties to films within ±2%.
2.5. Film scanning
The proton-irradiated films were scanned using an EPSON Expression 10000XL flat-bed scanner, and the photon-irradiated films were scanned using an EPSON Expression 11000XL flat-bed scanner (Epson America, Inc., Los Alamitos, CA). All films were scanned 24 to 48 hours after irradiation. The standard size of a whole piece of EBT-XD film is 8 inches × 10 inches (20.32 cm × 25.4 cm). Prior to the irradiation, each film strip was marked with the orientation to indicate the long (x) and short side (y) of its original whole film. The x side of the film strip was aligned along the long side of the flatbed scanner during the film scanning. The film was placed at the center of the scanner to minimize the lateral response artifact. A clear plexiglass plate was placed to press the film flat during scanning to minimize the possible inhomogeneity artifact by a curved film. The films were scanned at a resolution of 254 dpi (0.1 mm × 0.1 mm per pixel) in the RGB mode with 16-bit color depth per channel. The film images were saved in the tagged image file format (.TIFF).
2.6. Film image analysis
ImageJ software29 (version 1.53c) was used for film color channel splitting and data analysis by exporting data in each ROI. The direct reading on a film image in a color (red, green, or blue) channel is the grayscale value, and the gray value can be converted to optical density (OD). There are two types of OD commonly used for Gafchromic™ films. A net OD (named ODspecific in the current study) is defined in Equation (1), where I0 and Iexp are the mean gray values in the ROI of the unexposed (0 Gy) and exposed film image in a color channel (red, green, or blue).
| Eq (1) |
In a 16-bit image, the gray value ranges from 0 to 216–1 (=65,535). Therefore, 65,535 was selected by FilmQA Pro™ software (version 2016; Ashland Specialty Ingredients, G.P., Wilmington, DE) in the OD calculation as I0. To distinguish the specific net OD, the calculated OD with a generic value I0 = 65,535 is called ODgeneric hereafter, defined in Equation (2). Both OD values were calculated in the current study. According to our experience, I0 of an unexposed film is always lower than 65,535, and its value varies in different batches of films.
| Eq (2) |
The difference between these two OD values is a constant for films in the same batch because ODgeneric – ODspecific = log10(65,535/I0).
The curve of gray value or OD as a function of dose is called a film response curve, and the curve of dose as a function of gray value or OD is called a film calibration curve. The relationship between the film response (gray value or OD) and dose is not simply linear. Different mathematical functions have been used to fit the film response or calibration curves. Here, two different fitting functions were used, and the fitting results were compared. The three-parameter rational function, defined in Equation (3), is used in the FilmQA Pro™ software (version 2016), where x is the gray value or OD, y is dose, and a, b, and c are fitting coefficients.
| (3) |
The Rodbard (NIH Image) function, available in ImageJ software, with four fitting coefficients, is defined in Equation (4), where x is the gray value or OD, y is dose, and a, b, c and d are fitting coefficients30.
| (4) |
After exporting the mean gray value and the standard deviation in each ROI using ImageJ, we used Origin software (version 2021b) for fitting the film dose response curve and calibration curve. Goodness-of-fitting results from the rational and NIH Rodbard functions were compared.
2.7. Uncertainty analysis
Dose, gray value, and OD were the variables used in the data analysis of the current study. The dose to the active layer of a film in proton studies was based on the ion chamber measurement and Monte Carlo calculation. The output dose fluctuation of Gy/MU (standard deviation/mean) was lower than 0.5% for the clinical spot-scanning proton beam. For the research proton beamline, the output dose fluctuation of Gy/MU was 1.1% in the FLASH mode and 0.5% in the non-FLASH mode21. For the photon irradiation, the output dose fluctuation was lower than 1%. Considering both experimental setup errors and machine output fluctuations, the estimated overall dose uncertainty to films was within ±2% in both proton and photon irradiations. For each data point in the reported plots below, the dose value was from a single delivery to a piece of film; therefore, no statistical error bar was provided.
Several sources of uncertainty could impact film readings of gray value and the converted OD, such as the film scanning time after exposure, film orientation, film position, film flatness on the flatbed scanner, deficit or inhomogeneity in the film structure, and even fingerprint dirt on the film. To minimize these uncertainties, we scanned the films at least 24 hours after irradiation, aligned the film in a consistent orientation on the scanner bed, placed the film on the center of the scanner bed, put a plexiglass plate on the film during scanning, and cleaned the film with an alcohol pad if necessary. The standard deviation of both gray value and OD in an ROI was lower than 1% in all films. Considering possible uncertainties in scanning the film and statistical variation in the ROI, the estimated overall uncertainty of the gray value or OD was within ±2%. To avoid mess on the plots, we did not provide error bars of the gray value or OD in the Results.
3. Results
3.1. Film response curves in different color channels (clinical protons and photons)
The film response curves (gray value vs. dose) of clinical spot-scanning 87.2 MeV protons (1 cm buildup) and 6 MV photons are shown in Figure 4. The photon dose ranged from 0 to 32 Gy, and the proton dose ranged from 0 to 66.8 Gy. The response curves from red, green, and blue channels were all plotted. The red channel curve had the steepest gradient in the low-dose region, i.e., from 0 to 5 Gy, indicating the highest sensitivity in response (gray value) when dose varies. In the high-dose region, i.e., approaching 70 Gy, response curves from all color channels showed a trend of saturation in response to dose variation. Because of the superior dose response, only the red channel data were used in later film response analysis and calibration.
Figure 4.
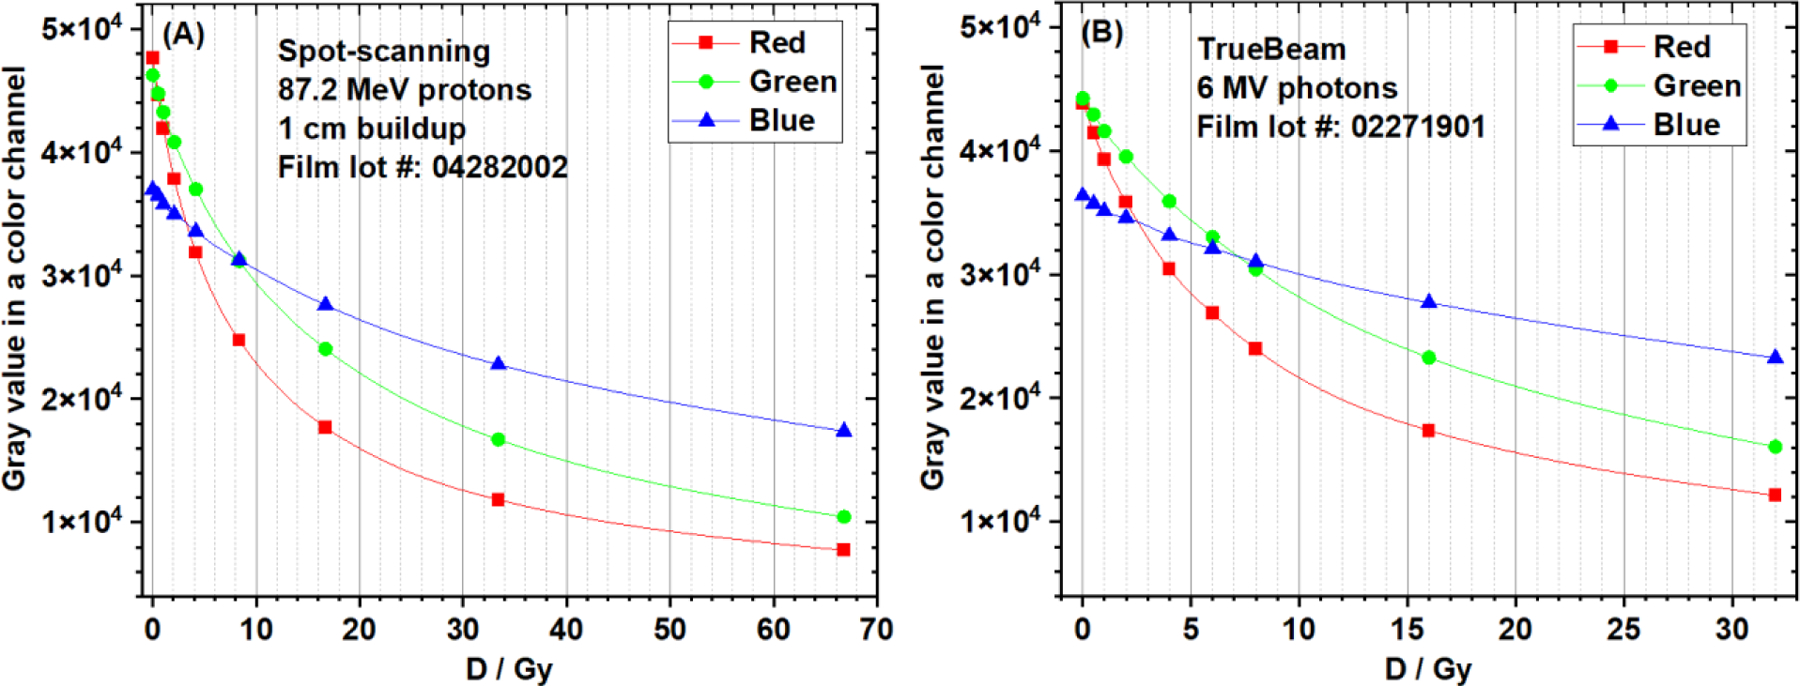
EBT-XD film response curves of (A) clinical 87.2 MeV protons (1cm buildup) and (B) 6 MV photons. The data from three color channels (red, green, and blue) were compared.
3.2. Film calibration curves (dose vs gray value) with different fitting methods (clinical protons and photons)
Both NIH Rodbard function (4 fitting coefficients) and rational function (3 fitting coefficients) were used to fit the calibration curves of clinical 87.2 MeV protons (1-cm buildup) and 6 MV photons. The fitting curves and the dose residual (= delivered dose – dose predicted by the fitting function) distributions of different data points are compared in Figure 5. Goodness-of-fit statistics are compared in Table 1. For protons, using the NIH Rodbard function were superior, as indicated by fitting results showing a greater adjusted R2 (coefficient of determination), a lower dose residual sum of squares, and a lower reduced χ2. However, for photons, no difference in goodness-of-fit statistics was observed between these two fitting functions.
Figure 5.
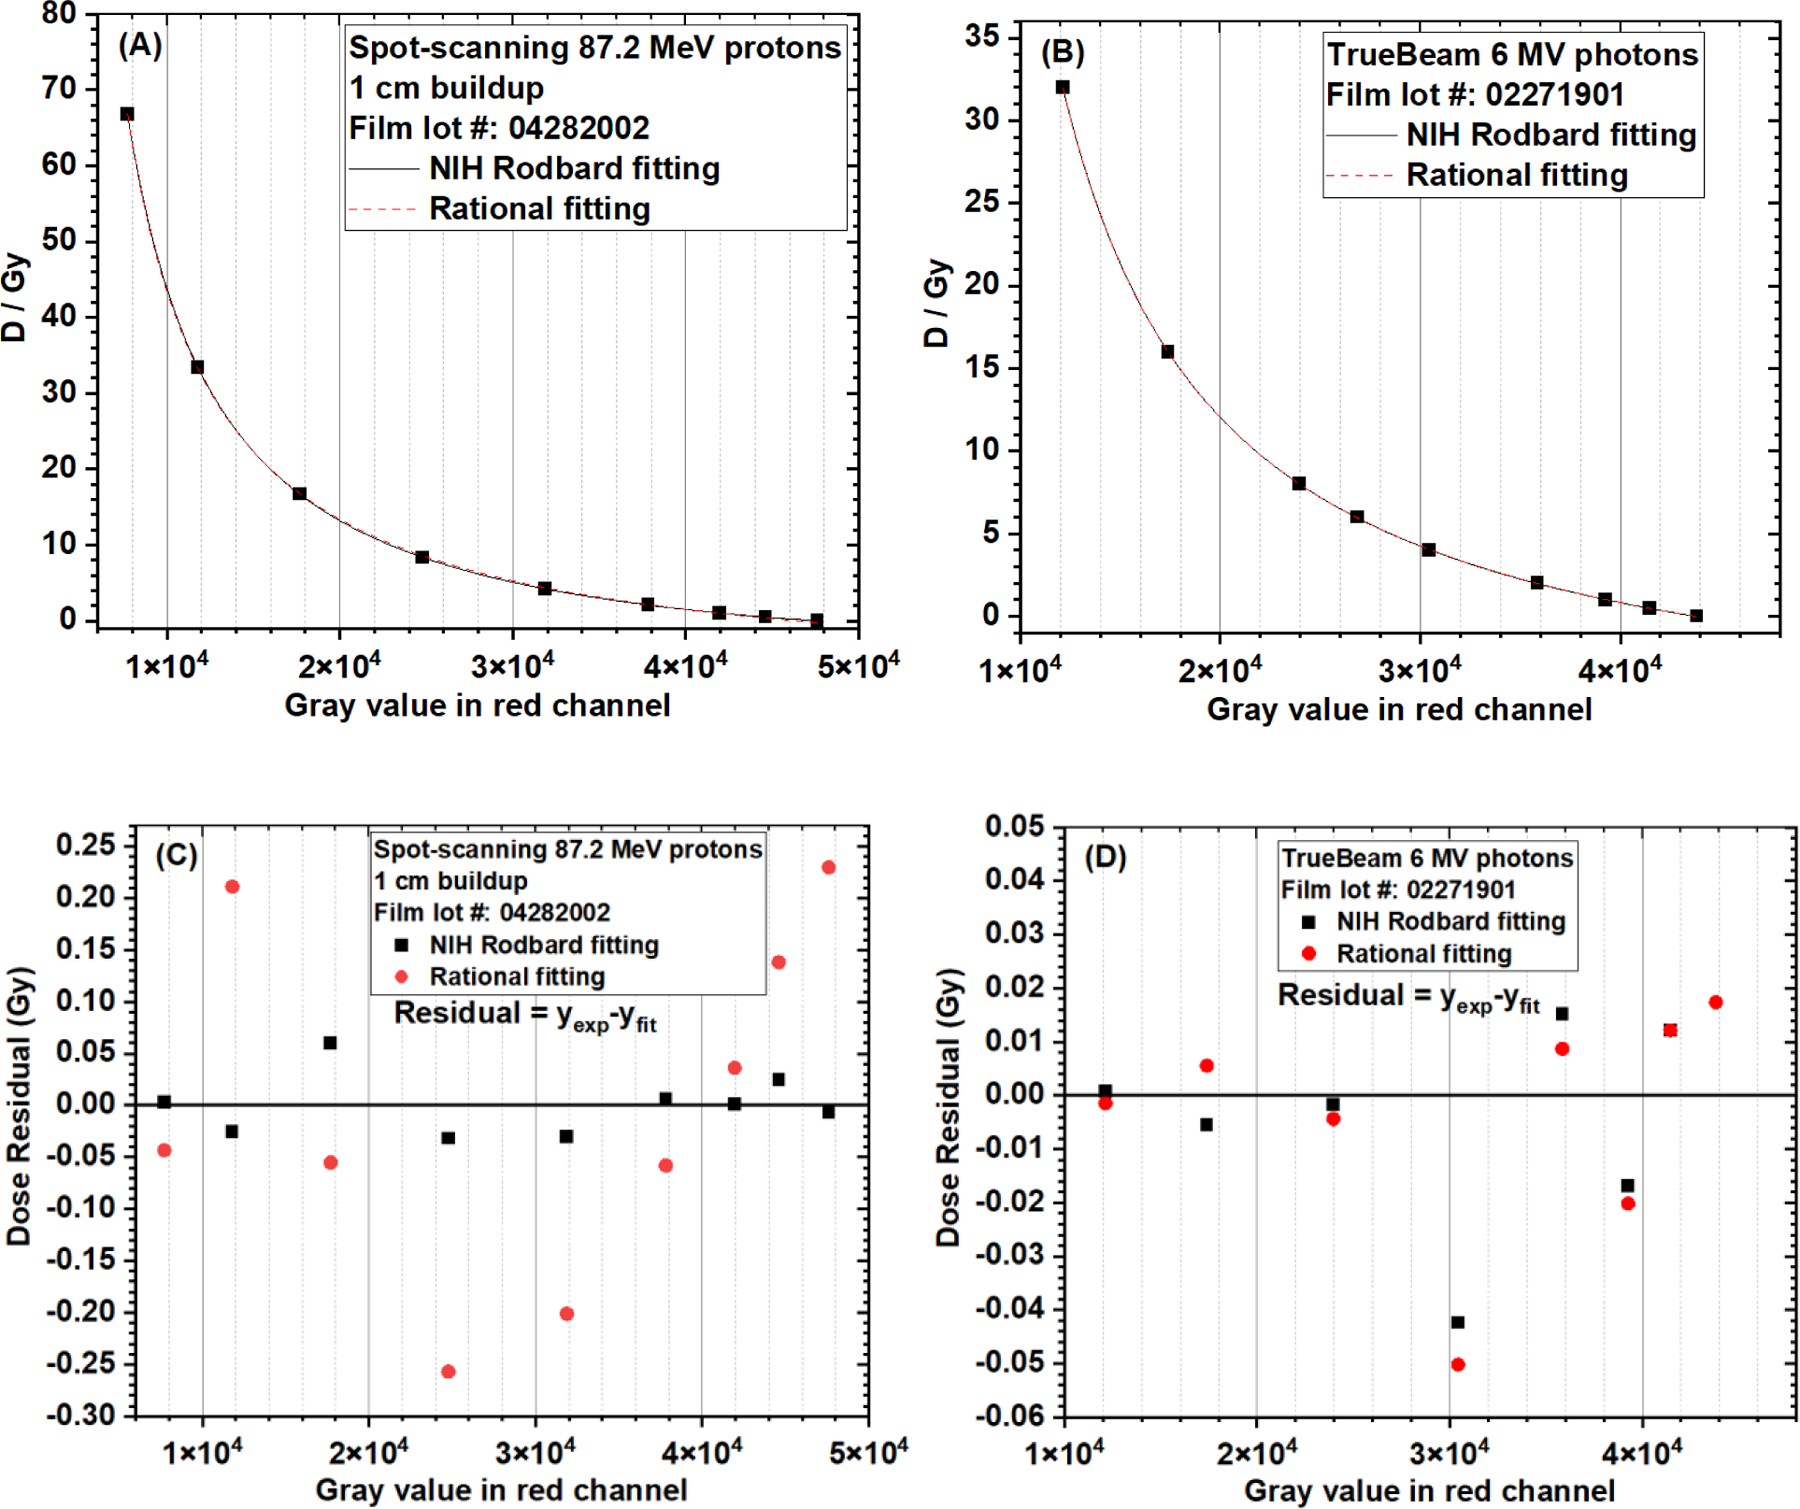
Comparison of EBT-XD film calibration curves (dose vs. gray value in red channel) using the NIH Rodbard function and the rational function. (A) Fitting curves of clinical spot-scanning 87.2 MeV protons (1 cm buildup). (B) Fitting curves of clinical 6 MV photons. (C) Dose residual of clinical spot-scanning 87.2 MeV protons (1 cm buildup). (D) Dose residual of clinical 6 MV photons. Dose residual = delivered dose (yexp) – dose predicted by the fitting function (yfit)
Table 1.
Comparison of goodness-of-fit statistics between NIH Rodbard and rational functions in calibrating EBT-XD films (dose vs gray value in red channel)
| Adjusted R2 | Dose residual† sum of squares (Gy2) | Reduced χ2 | ||||
|---|---|---|---|---|---|---|
|
| ||||||
| NIH Rodbard | Rational | NIH Rodbard | Rational | NIH Rodbard | Rational | |
| Clinical 87.2 MeV protons | 1.0 | 0.99992 | 0.00691 | 0.23247 | 0.00138 | 0.03874 |
| 6 MV photons | 0.99999 | 0.99999 | 0.00397 | 0.00455 | 7.93106E-4 | 7.58787E-4 |
Dose residual = delivered dose – dose predicted by the fitting function
3.3. Film calibration curves with different optical density calculation methods and fitting functions (clinical protons and photons)
In this section, experimental data from clinical 87.2 MeV protons (1 cm buildup) and clinical 6 MV photons were analyzed. Both ODspecific and ODgeneric of red channel data were calculated using Equations (1) and (2), respectively, and both NIH Rodbard and rational functions were used in data fitting. Therefore, four types of film calibration curves were generated for each experimental setup: (A) ODgeneric + rational, (B) ODspecific + rational, (C) ODgeneric + NIH Rodbard, and (D) ODspecific + NIH Rodbard.
The calibration curves for both clinical 87.2 MeV protons (1 cm buildup) and clinical 6 MV photons are compared in Figure 6. The proton and photon calibration curves using ODspecific were close to each other when the dose was lower than 10 Gy, although these data were from two different batches of films (Figure 6B and 6D).
Figure 6.
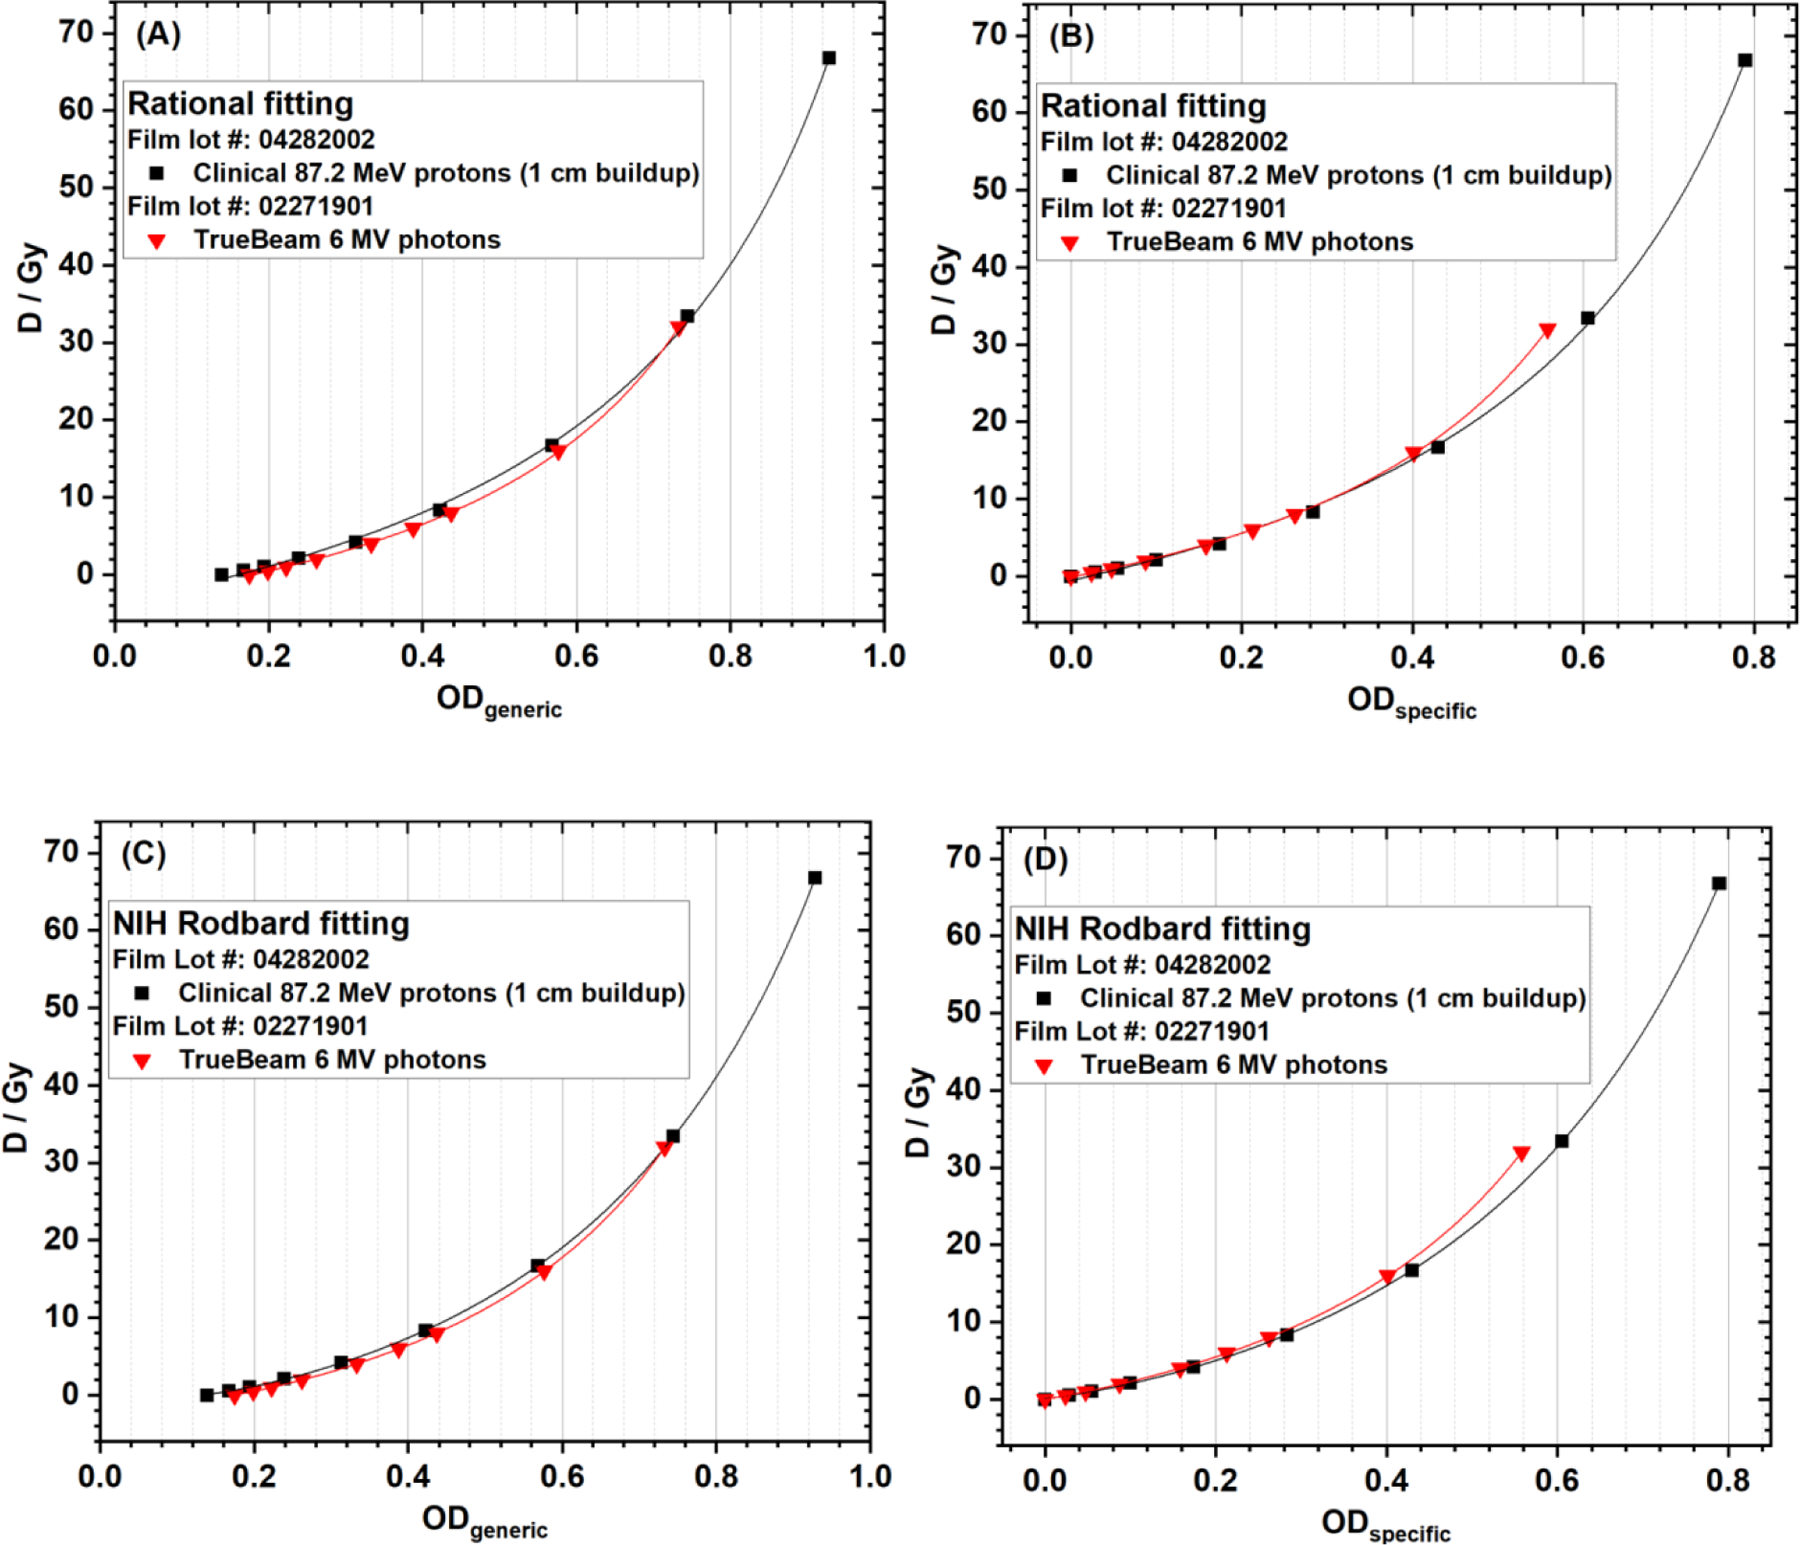
EBT-XD film calibration curves of clinical 87.2 MeV protons (1-cm buildup) and clinical 6 MV photons using (A) ODgeneric + rational, (B) ODspecific + rational, (C) ODgeneric + NIH Rodbard, and (D) ODspecific + NIH Rodbard.
As shown in Figure 6A and 6C, ODgeneric was not 0 at dose = 0, and was different for different batches of films. A constant I0 of 65,535 was always used in the ODgeneric calculation, but the actual I0 (Iexp at dose 0 Gy) was 47,605.289 ± 239.916 (mean ± standard deviation) in the film batch for clinical 87.2 MeV protons, and I0 was 43,824.2 ± 271.1 (mean ± standard deviation) in the film batch for 6 MV photons, used in the ODspecific calculations for data in Figure 6B and 6D. According to Equation (1), at dose = 0 Gy, I0 = Iexp, so ODspecific is 0 for any batch of film, as shown in Figure 6B and 6D. In contrast, using ODgeneric calculation method does not take into account the initial light transmission of each batch of films, which made the comparison of calibration curves between different batches of films meaningless, as shown in Figure 6A and 6C.
The fitting coefficients using rational function for clinical protons and 6 MV photons are listed in Tables S4 and S5 in the Supplementary Materials, and the corresponding results using NIH Rodbard function can be found in Tables S6 and S7. When rational function was used, the fitting coefficients a and b were almost identical for ODgeneric and ODspecific, but c values were different. When NIH Rodbard function was used, the fitting coefficients b and c were almost identical for ODgeneric and ODspecific, but a and d were different. These observations can be explained using the difference between these two OD values. For films in the same batch, ODgeneric – ODspecific = log10(65,535/I0), which is a constant. In data fitting, (x – c) was used in rational function, and (x – c)/(d – x) was used in NIH Rodbard function, where x can be ODgeneric or ODspecific. The difference between ODgeneric or ODspecific caused the difference of c in rational fitting and difference of c and d in NIH Rodbard fitting.
The goodness-of-fit statistics including adjusted R2, dose residual sum of squares, and reduced χ2 are listed in Tables S8, S9 and S10, which showed that the goodness-of-fit statistics only depend on the fitting function but independent of optical density method. The goodness-of-fit statistics between NIH Rodbard function and rational function are compared in Table 2. It showed that using NIH Rodbard function was superior for both protons and photons indicated by a greater adjusted R2, a lower dose residual sum of squares, and a lower reduced χ2.
Table 2.
Comparison of goodness-of-fit statistics between the NIH Rodbard function and rational function in calibrating EBT-XD films (red channel)
| Adjusted R2 | Dose residual†sum of squares (Gy2) | Reduced χ2 | ||||
|---|---|---|---|---|---|---|
|
| ||||||
| NIH Rodbard | Rational | NIH Rodbard | Rational | NIH Rodbard | Rational | |
| Clinical 87.2 MeV protons | 0.99999 | 0.9994 | 0.0191 | 1.78106 | 0.00382 | 0.29684 |
| 6 MV photons | 0.99999 | 0.9999 | 0.00547 | 0.06654 | 0.00109 | 0.01109 |
Dose residual = delivered dose – dose predicted by the fitting function
3.4. Dose-rate dependence test results (research FLASH and non-FLASH protons)
The red channel gray value-based EBT-XD film calibration curves of the research FLASH (150 Gy/s) and non-FLASH (0.3 Gy/s) protons are compared in Figure 7. The NIH Rodbard function was used in data fitting. In Figure 7A, these two curves are very close to each other. In Figure 7B, between approximately 1 and 21 Gy, the absolute dose difference is between −0.4 and 0.1 Gy and the relative dose difference is within ±3% between FLASH and non-FLASH calibration curves. Similar to gray-value based results, ODspecific-based calibration curves, shown in Figure 8A, are also close to each other for FLASH and non-FLASH protons. In Figure 8B, between approximately 1 and 21 Gy, the absolute dose difference is between −0.6 and 0.1 Gy and the relative dose difference is within ±3% between FLASH and non-FLASH calibration curves. The data in Figures 7 and 8 show that EBT-XD film was independent of dose rate for our synchrotron-based protons.
Figure 7.
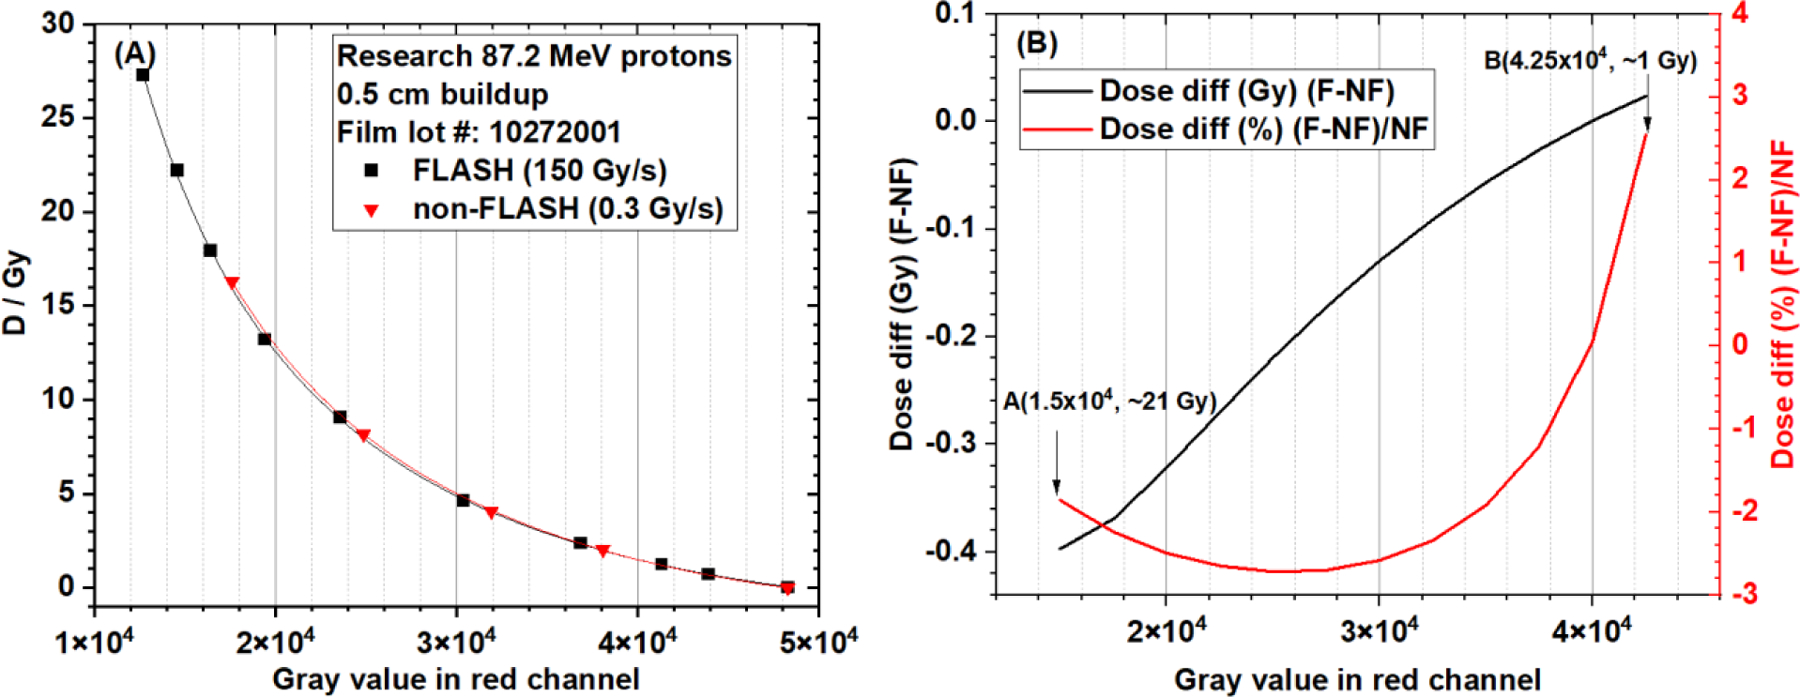
(A) EBT-XD film calibration curves (dose vs. gray value in red channel, NIH Rodbard function) from research FLASH and non-FLASH protons (87.2 MeV single beamlet, 5 mm buildup). (B) Absolute and relative dose differences between FLASH and non-FLASH calibration curves. The dose range is approximately 1 Gy to 21 Gy.
Figure 8.
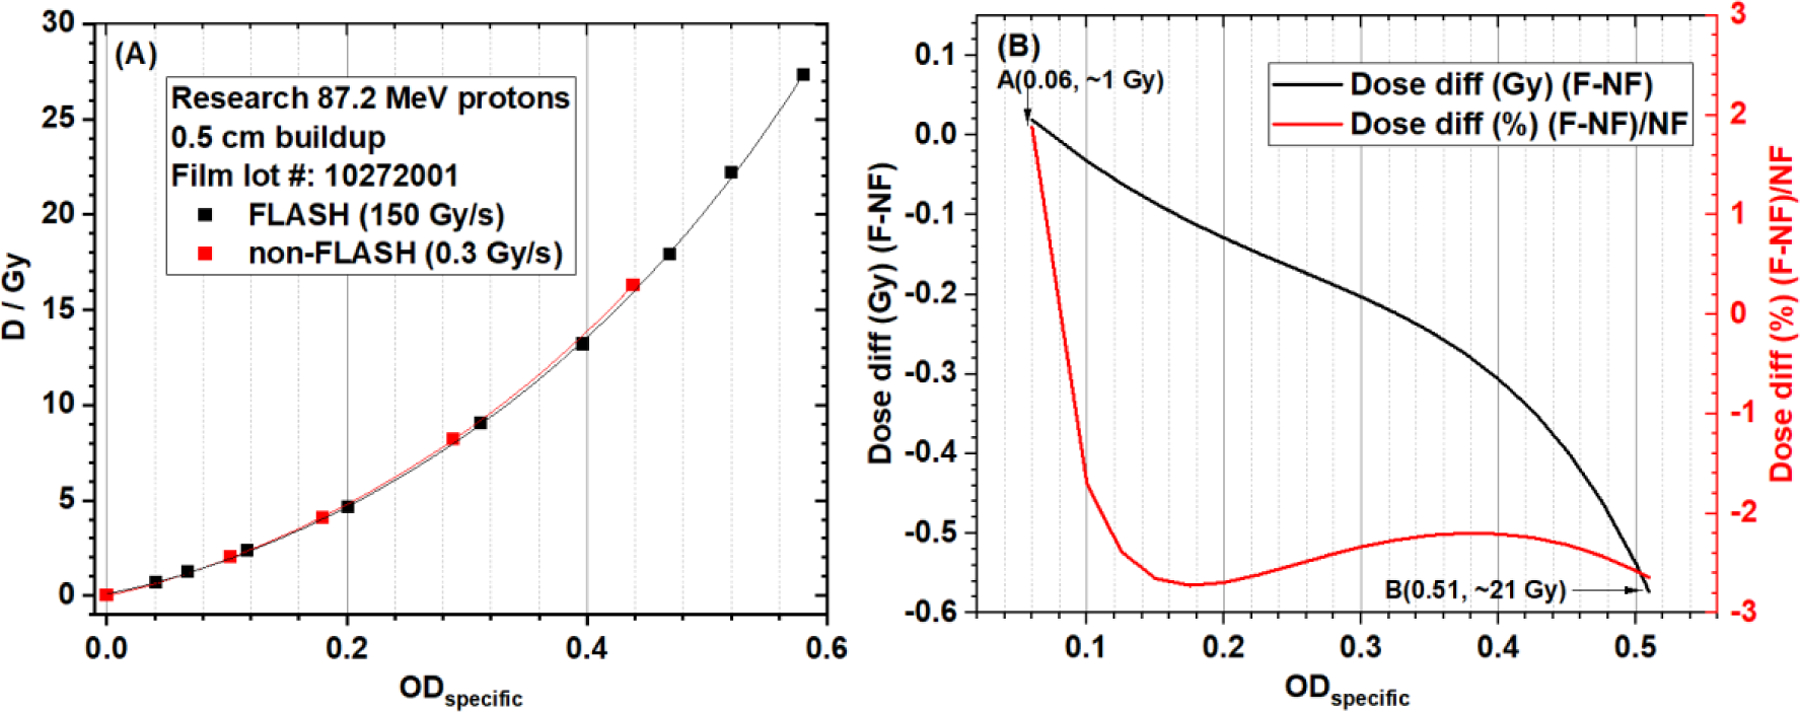
(A) EBT-XD film calibration curves (dose vs ODspecific in red channel, NIH Rodbard function) from research FLASH and non-FLASH protons (87.2 MeV single beamlet, 5-mm buildup). (B) Absolute and relative dose differences between FLASH and non-FLASH calibration curves. The dose range is approximately 1 Gy to 21 Gy.
3.5. LET dependence test results (clinical protons and research FLASH protons)
The red channel gray value-based EBT-XD film calibration curves from three different LETd values (1.0, 3.6, and 7.6 keV/µm) of the clinical 87.2 MeV protons are compared in Figure 9A, and the calibration curves from two different LETd values (0.9 and 9.0 keV/µm) of research FLASH protons (87.2 MeV) are compared in Figure 9B. The NIH Rodbard function was used in data fitting. The dose ratios of calibration curves of LET 3.6 keV/µm and 7.6 keV/µm to 1.0 keV/µm from clinical 87.2 MeV protons are shown in Figure 9C. The dose range was 0.4 Gy to 63.1 Gy at LET 1.0 keV/µm. The dose ratio varied from 1.16 to 1.22 for LET 7.6 keV/µm. The dose ratio varied from 1.05 to 1.16 for LET 3.6 keV/µm. The dose ratio of calibration curves of LET 9.0 keV/µm to 0.9 keV/µm from research FLASH protons (87.2 MeV) is shown in Figure 9D. The dose range was 0.5 Gy to 23.4 Gy at LET 0.9 keV/µm. The dose ratio varied from 1.08 to 1.15. These results showed that the dose ratio between the high-LET and low-LET calibration curves was not a constant, although the variation was not large. The corresponding ODspecific-based calibration curves and dose ratios of the calibration curves from different LET values are shown in Figure 10. The results in Figures 9 and 10 clearly show LET dependence of EBT-XD films.
Figure 9.
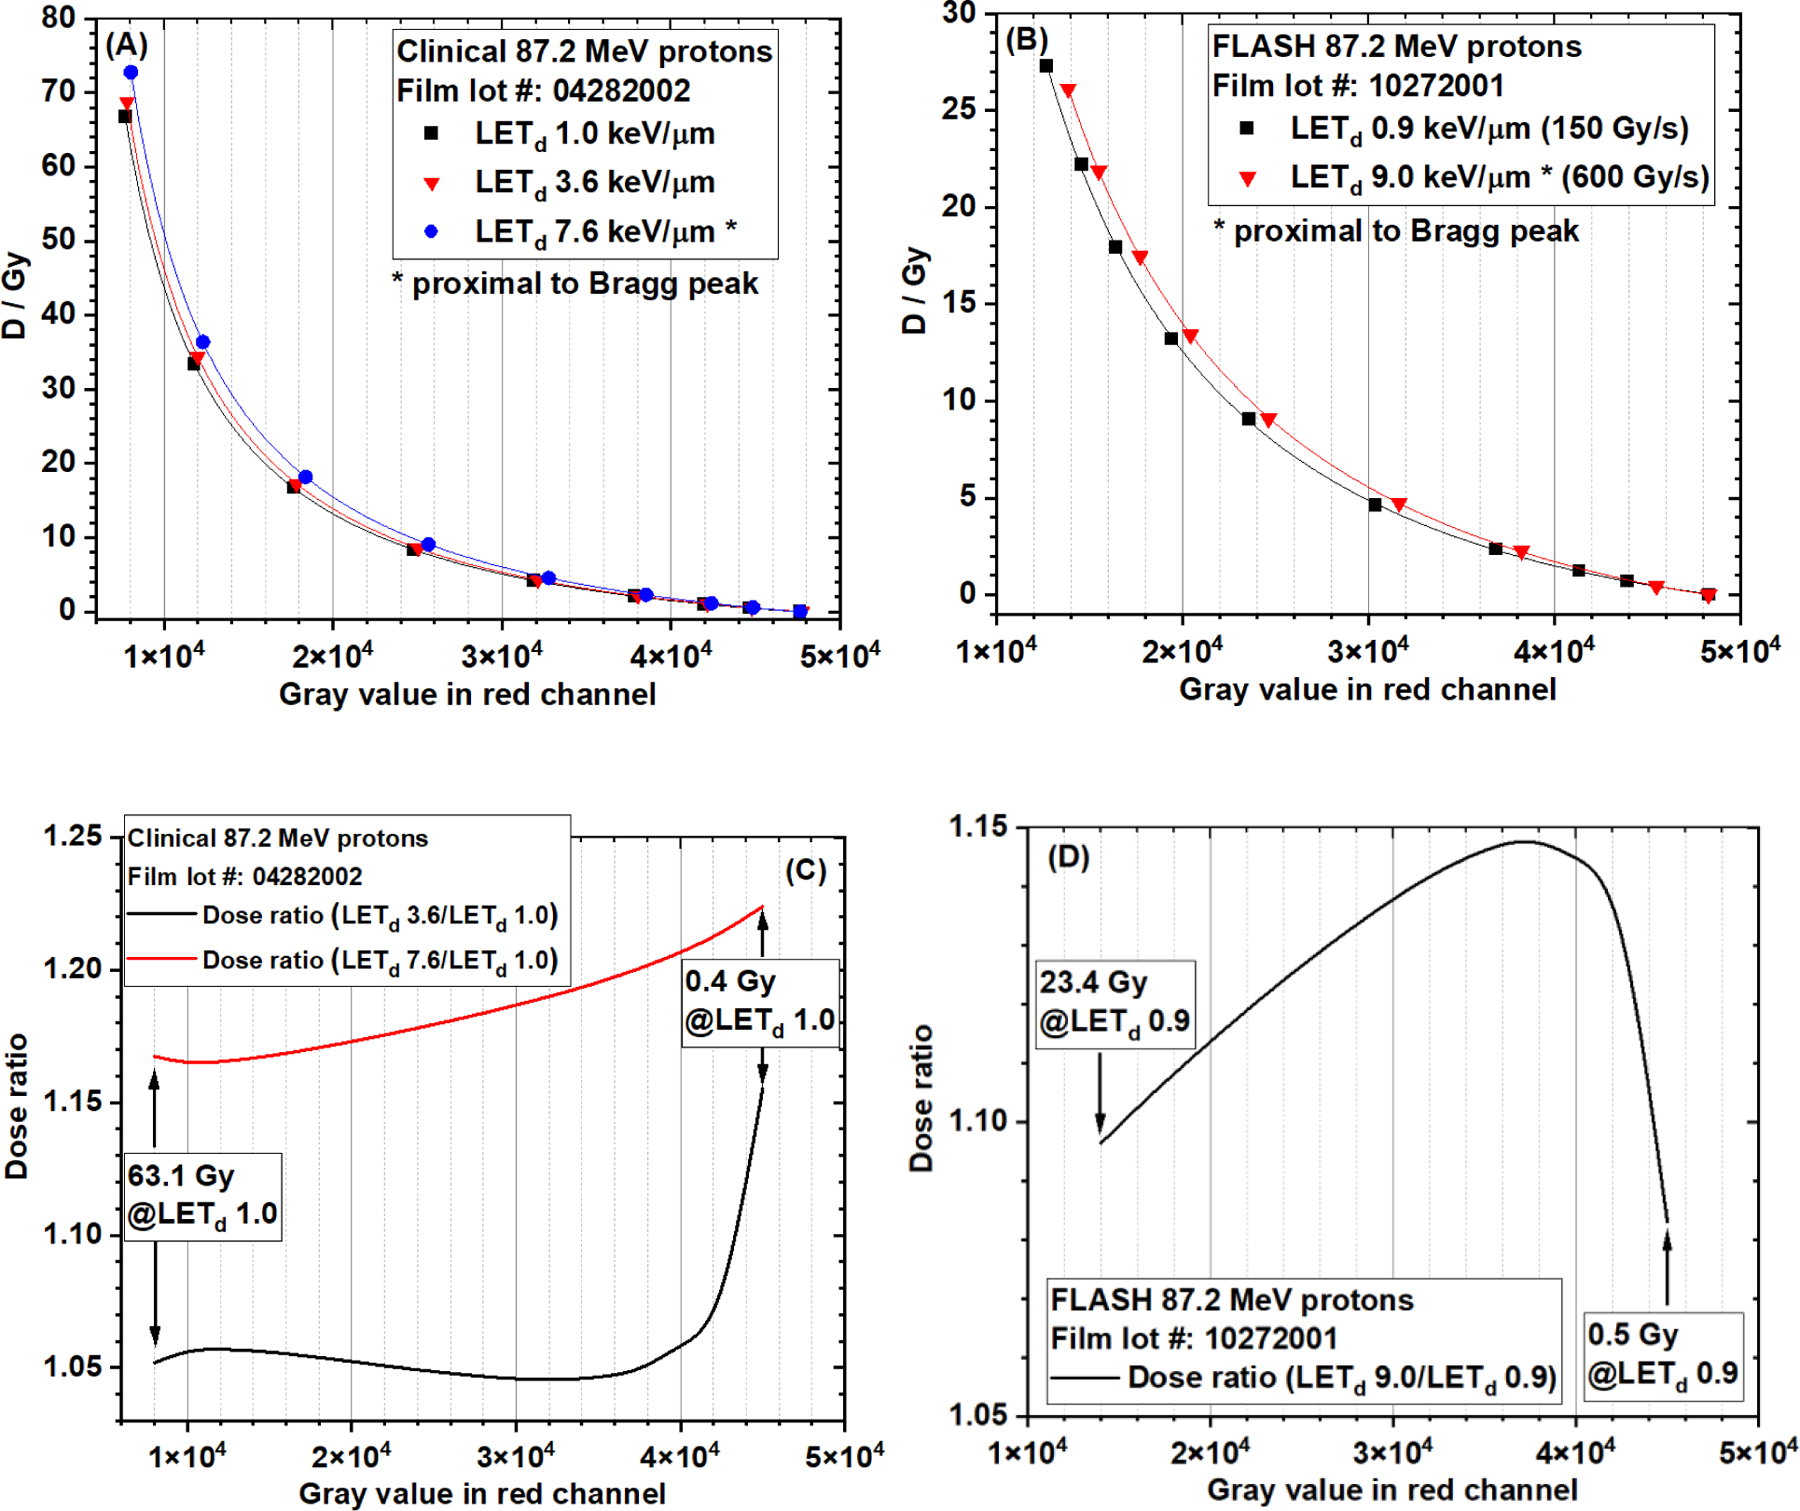
EBT-XD film calibration curves (OD vs gray value in red channel, NIH Rodbard function) from (A) three different LETd (1.0 , 3.6 , and 7.6 keV/µm) of the clinical 87.2 MeV protons, and (B) two different LETd (0.9 keV/µm and 9.0 keV/µm) of research FLASH protons (87.2 MeV). (C) Dose ratios of LET 3.6 keV/µm and 7.6 keV/µm to 1.0 keV/µm from the clinical 87.2 MeV protons. The dose range is 0.4 Gy to 63.1 Gy at LET 1.0 keV/µm. (D) Dose ratio of LET 9.0 keV/µm to 0.9 keV/µm from research FLASH protons (87.2 MeV). The dose range was 0.5 Gy to 23.4 Gy at LET 0.9 keV/µm.
Figure 10.
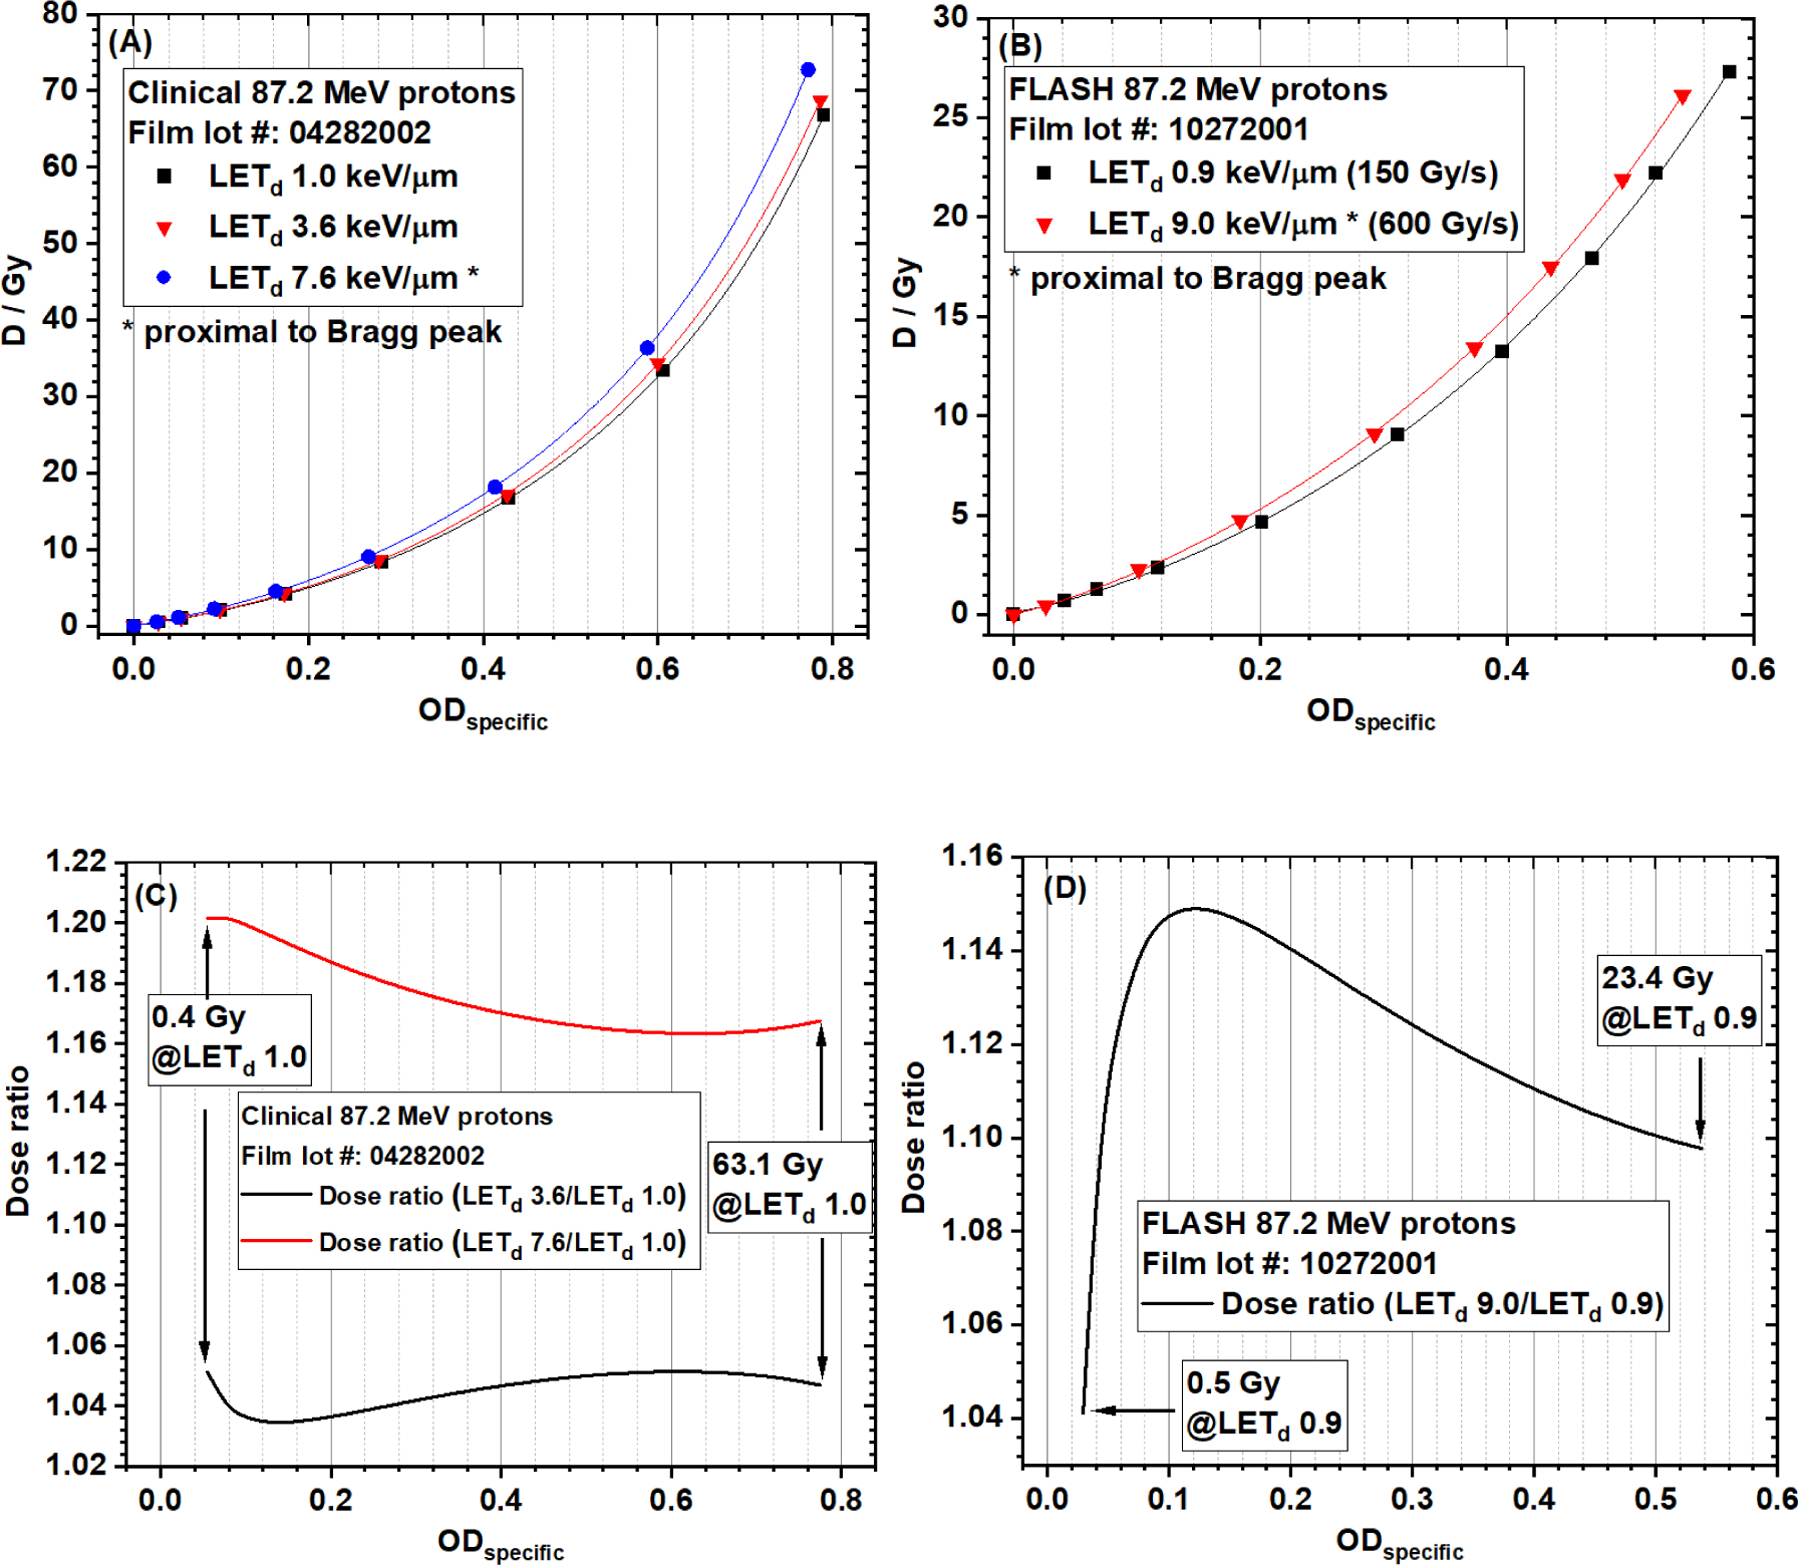
EBT-XD film calibration curves (dose vs ODspecific in red channel, NIH Rodbard function) from (A) three different LETd (1.0, 3.6, and 7.6 keV/µm) of the clinical 87.2 MeV protons, and (B) two different LETd (0.9 and 9.0 keV/µm) of research FLASH protons (87.2 MeV). (C) Dose ratios of LET 3.6 keV/µm and 7.6 keV/µm to 1.0 keV/µm from the clinical 87.2 MeV protons. The dose range was 0.4 Gy to 63.1 Gy at LET 1.0 keV/µm. (D) Dose ratio of LET 9.0 keV/µm to 0.9 keV/µm from research FLASH protons (87.2 MeV). The dose range was 0.5 Gy to 23.4 Gy at LET 0.9 keV/µm.
4. Discussion
4.1. Recommended film calibration method and fitting function
In the current study, we calibrated the EBT-XD films in two types of curves: dose vs gray value and dose vs OD. Our results show that both gray value and OD methods are suitable for EBT-XD film calibration. In this regard, directly using the gray value in calibration can save time to convert gray value to OD.
Regarding the OD calculation, we compared the fitting results from ODspecific and ODgeneric. The mean gray value from exposed (Iexp) and unexposed (I0) films were used to calculate ODspecific, but a constant 65,535 was used as I0 to calculate ODgeneric. Therefore, using ODgeneric neglects the variation of I0 among different batches of films, making it impossible to compare calibration curves from different batches of films. In addition, using ODgeneric neglects the variation of I0 of the same batch of films over time. A large error in dose determination could be resulted in when using an earlier ODgeneric based calibration curve for a later irradiated film. In contrast, using the ODspecific method may eliminate the inherent differences in light transmission characteristics among different batches of films because ODspecific defines the relative light transmission, as indicated in Equation (1). As shown in Figure 6B and 6D, below 10 Gy, the proton and photon calibration curves using ODspecific were close to each other even though they were from two different batches of films. Nevertheless, these results were derived only from photons and low-LET (1.0 keV/µm) protons. Moreover, the characteristics of these two batches of films could have been similar by chance. Therefore, it is recommended that each new batch of films should be calibrated prior to use for any specific radiation type and beam quality.
We also compared two different fitting functions: the NIH Rodbard function (4 coefficients) and the rational function (3 coefficients). The values of adjusted R2, dose residual sum of squares, and reduced χ2 were used as indicators of goodness of fit to evaluate the quality of the fitting results. When gray value was used in film calibration, the NIH Rodbard function was superior in calibrating proton data, but there was no difference between NIH Rodbard and rational functions in calibrating photon data. When OD was used in film calibration, using the NIH Rodbard function was superior for both protons and photons.
Taken together, these results indicate that the NIH Rodbard fitting function is better for film calibration and either gray value or ODspecific is suitable. Nevertheless, using both NIH Rodbard fitting function and Rational function can generate clinically acceptable accuracy in film dosimetry.
4.2. Dose rate independence and LET dependence in EBT-XD films
Villoing et al. reported the dose rate dependence in EBT-XD films when the dose was higher than 10 Gy17. That study was conducted using a cyclotron-based proton machine with a highest average dose rate of 7500 Gy/s. However, dose rate dependence was not observed in our experiments using a synchrotron-based proton machine. The proton FLASH average dose rate in our study was only 150 Gy/s, much lower than that reported by Villoing et al. More studies with different dose rates and different time-pulse structures are needed to give updated conclusions on the dose rate dependence in EBT-XD films.
In line with earlier EBT film models, we observed proton LET dependence in EBT-XD films in the current study. Heterogeneity in dose response of protons with different LET or energy values may limit the clinical applications of EBT-XD films for patient-specific quality assurance (PSQA). In a proton treatment plan of PSQA, to convert the gray value or OD map to an accurate dose map, a bivariate calibration function: dose = function(gray value or OD, LETd), is needed. Perles et al. developed a LET-based dose correction model for EBT-2 films9, the principle of which may be indicative for EBT-XD films.
4.3. Limitations of the current work
In the current work, we used three different batches of EBT-XD films for different irradiators. This made it difficult to explain the difference in film response between low-LET protons and photons when the dose was higher than 10 Gy. Nevertheless, other results in the current study are convincing because each conclusion was based on the results from the same batch of films.
The current study also did not have sufficient LETd values to assess proton LET dependence. This was caused by the long irradiation time to obtain data at very high doses. More film response data with different LETd values are needed to build a LET-based dose correction model for proton PSQA applications.
Lastly, the current study lacked film response data at much higher dose rates, in the magnitude of 1000 Gy/s. Although our research proton FLASH machine can deliver beam at a dose rate up to approximately 5000 Gy/s, the pulse time of a full spill is only 2 milliseconds, resulting in a dose of only 10 Gy per full spill. This is an intrinsic disadvantage of a synchrotron-based proton FLASH machine.
5. Conclusion
Through comprehensive analysis of the experimental data collected in the current study, we can conclude with the following observed features of Gafchromic™ EBT-XD film dosimetry. First, both red channel gray value and optical density methods are suitable for accurate film calibration for protons and photons. Second, using the net optical density (ODspecific) method takes into account the initial light transmission of film without radiation dose whereas using the generic optical density (ODgeneric) method does not. Third, using the four-parameter NIH Rodbard function could generate superior fitting results to using the three-parameter rational function. Nevertheless, both methods can generate clinically acceptable accuracy in film dosimetry. Fourth, the response of EBT-XD film is proton LET-dependent but independent of dose rate for synchrotron-based protons.
Supplementary Material
Figure S1. Experimental setups using the clinical spot-scanning protons (87.2 MeV). (A) Dose measurement using the Advanced Markus chamber without the protection cap in place. A plastic water slab was put on the ion chamber holder to make the experimental setup stable, but it was not shown here for better visualization. (B) EBT-XD film irradiation. The gantry was rotated to 180. A custom rigid hollow supporter (made of Lucite, with a 20 cm 20 cm open area) was mounted on the snout of the nozzle to hold the buildup phantom and other experimental components. A 5 cm 5 cm uniform dose field was generated in the isocenter plane.
Figure S2. EBT-XD films exposed by clinical spot-scanning protons (87.2 MeV). The dose increases from right to left in all the panels. The numerical value on each strip is not the dose in Gy; it is the multiple of monitor units in the proton beamlet scan pattern. The dose to each film strip was determined from the measurement of an Advanced Markus chamber and Monte Carlo calculation. The plastic water buildup thicknesses were 1 cm, 5.4 cm, and 5.6 cm for panels (A), (B) and (C). Each strip is 2.54 cm 5.08 cm. The uniform dose field size is 5 cm 5 cm in the isocenter plane. The region of interest of each film strip for data analysis is the central area of 2 cm 2 cm, as illustrated in the panel (D), which only showed red channel images (5.6 cm buildup).
Figure S3. Experimental setup using the horizontal proton beamline for FLASH and non-FLASH experiments. The EBT-XD film was placed between the buildup phantom and the Advanced Markus chamber. A 0.5 cm plastic water buildup phantom was used in (A), and a 5.5 cm plastic water buildup phantom was used in (B).
Figure S4. EBT-XD films exposed by research FLASH and non-FLASH protons (horizontal beamline, 87.2 MeV). The film irradiation setup parameters are as follows: (A) FLASH, 5 mm plastic water buildup, 2500 monitor units (MU); (B) non-FLASH, 5 mm plastic water buildup, 1600 MU; (C) FLASH, 5.5 cm plastic water buildup, 600 MU. The size of each film is 10.16 cm 10.16 cm, irradiated by a single proton spot. The region of interest of each spot for data analysis was the central disc area with a radius of 2.5 mm, as indicated in the panel (D), which was the same as the radius of the sensitive volume of an Advanced Markus chamber for dose measurement. The dose to each film was determined from the ion chamber measurement and Monte Carlo calculation.
Figure S5. Experimental setup using a 6 MV photon beam for film irradiation. The gantry was rotated to 0. The film strip was aligned at the field center between the 1.5 cm buildup phantom (solid water) and the backscattering phantom (solid water). Before and after placing the buildup phantom on the top of the film strip was illustrated in (A) and (B). In panel (B), the source-to-surface distance was set to 100 cm, and the radiation field size was 10 cm 10 cm in the isocenter plane.
Figure S6. EBT-XD films exposed to 6 MV photons with different doses (Varian TrueBeam). Each strip is 2.54 cm 20.32 cm. In panel (A), from right to left, dose increases from 0 to 3200 cGy. The region of interest of each film strip for data analysis is the central area of 2 cm 2 cm, as indicated in panel (B).
Acknowledgments
We thank Mr. Resat Aydin from Ashland for providing the technical support of EBT-XD film dosimetry. We thank Mr. Shane Lovell and Mr. Mark Szczepanski from PTW North America for providing the technical support of Advanced Markus chamber for proton FLASH dosimetry. We thank Mr. Paul Wisdom for fabricating the supporting holder of the clinical proton nozzle. We thank Ms. Erica Goodoff for editorial assistance on this report.
Funding
The proton irradiation research was supported in part by a Radiation Oncology Strategic Initiatives Boot Walk Award, an Institutional Research Grant from The University of Texas MD Anderson Cancer Center, and the Cancer Center support (Core) Grant CA016672 from the National Cancer Institute, National Institutes of Health, to The University of Texas MD Anderson Cancer Center.
Footnotes
Institutional Review Board Statement
Not applicable.
Informed Consent Statement
Not applicable.
Conflicts of Interest
Kiminori Iga is currently employed by Hitachi Ltd. Other authors declare no conflicts of interest.
Data Availability Statement
The experimental setups, configuration parameters, and data fitting results in the current study are available in the Supplementary Materials. The experimental data generated in the current study are available from the first author upon reasonable request.
References
- 1.Niroomand-Rad A, Chiu-Tsao ST, Grams MP, et al. Report of AAPM Task Group 235 Radiochromic Film Dosimetry: An Update to TG-55. Med Phys 2020;47(12):5986–6025. [DOI] [PubMed] [Google Scholar]
- 2.Brown TA, Hogstrom KR, Alvarez D, Matthews KL 2nd, Ham K, Dugas JP. Dose-response curve of EBT, EBT2, and EBT3 radiochromic films to synchrotron-produced monochromatic x-ray beams. Med Phys 2012;39(12):7412–7417. [DOI] [PubMed] [Google Scholar]
- 3.Mohan R A Review of Proton Therapy - Current Status and Future Directions. Precis Radiat Oncol 2022;6(2):164–176. [DOI] [PMC free article] [PubMed] [Google Scholar]
- 4.Mohan R, Titt U, Guan F. Particle therapy in the third millennium: current status and future outlook. Particle Radiotherapy 2016;7–19.
- 5.International Commission on Radiation Units and Measurements. Report 85: Fundamental quantities and units for ionizing radiation. J ICRU 2011;11(1):1–31. [DOI] [PubMed] [Google Scholar]
- 6.Mairani A, Mein S, Blakely E, et al. Roadmap: helium ion therapy. Phys Med Biol 2022;67(15): 10.1088/1361-6560/ac65d3. [DOI] [PubMed] [Google Scholar]
- 7.Guan F, Geng C, Carlson DJ, et al. A mechanistic relative biological effectiveness model-based biological dose optimization for charged particle radiobiology studies. Phys Med Biol 2018;64(1):015008. [DOI] [PubMed] [Google Scholar]
- 8.Newhauser WD, Zhang R. The physics of proton therapy. Phys Med Biol 2015;60(8):R155–R209. [DOI] [PMC free article] [PubMed] [Google Scholar]
- 9.Perles LA, Mirkovic D, Anand A, Titt U, Mohan R. LET dependence of the response of EBT2 films in proton dosimetry modeled as a bimolecular chemical reaction. Phys Med Biol 2013;58(23):8477–8491. [DOI] [PubMed] [Google Scholar]
- 10.Reinhardt S, Würl M, Greubel C, et al. Investigation of EBT2 and EBT3 films for proton dosimetry in the 4–20 MeV energy range. Radiat Environ Biophys 2015;54(1):71–79. [DOI] [PubMed] [Google Scholar]
- 11.Niroomand-Rad A, Blackwell CR, Coursey BM, et al. Radiochromic film dosimetry: recommendations of AAPM Radiation Therapy Committee Task Group 55. American Association of Physicists in Medicine. Med Phys 1998;25(11):2093–2115. [DOI] [PubMed] [Google Scholar]
- 12.Soares CG. Radiochromic film dosimetry. Radiat Meas. 2006;41; S100–S116. [DOI] [PubMed] [Google Scholar]
- 13.Karsch L, Beyreuther E, Burris-Mog T, et al. Dose rate dependence for different dosimeters and detectors: TLD, OSL, EBT films, and diamond detectors. Med Phys 2012;39(5):2447–2455. [DOI] [PubMed] [Google Scholar]
- 14.Favaudon V, Caplier L, Monceau V, et al. Ultrahigh dose-rate FLASH irradiation increases the differential response between normal and tumor tissue in mice [published correction appears in Sci Transl Med. 2019 Dec 18;11(523):]. Sci Transl Med 2014;6(245):245ra93. [DOI] [PubMed] [Google Scholar]
- 15.Cavallone M, Gonçalves Jorge P, Moeckli R, et al. Determination of the ion collection efficiency of the Razor Nano Chamber for ultra-high dose-rate electron beams. Med Phys 2022;49(7):4731–4742. [DOI] [PMC free article] [PubMed] [Google Scholar]
- 16.Petersson K, Jaccard M, Germond JF, et al. High dose-per-pulse electron beam dosimetry - A model to correct for the ion recombination in the Advanced Markus ionization chamber. Med Phys 2017;44(3):1157–1167. [DOI] [PubMed] [Google Scholar]
- 17.Villoing D, Koumeir C, Bongrand A, et al. Technical note: Proton beam dosimetry at ultra-high dose rates (FLASH): Evaluation of GAFchromic™ (EBT3, EBT-XD) and OrthoChromic (OC-1) film performances. Med Phys 2022;49(4):2732–2745. [DOI] [PubMed] [Google Scholar]
- 18.Diffenderfer ES, Verginadis II, Kim MM, et al. Design, Implementation, and in Vivo Validation of a Novel Proton FLASH Radiation Therapy System. Int J Radiat Oncol Biol Phys 2020;106(2):440–448. [DOI] [PMC free article] [PubMed] [Google Scholar]
- 19.Gillin MT, Sahoo N, Bues M, et al. Commissioning of the discrete spot scanning proton beam delivery system at the University of Texas M.D. Anderson Cancer Center, Proton Therapy Center, Houston. Med Phys 2010;37(1):154–163. [DOI] [PMC free article] [PubMed] [Google Scholar]
- 20.Andreo Pedro, Burns DT, Hohlfeld K, et al. Absorbed dose determination in external beam radiotherapy: an international code of practice for dosimetry based on standards of absorbed dose to water; Technical Reports Series No.398. Health physics 2001;81; 592–593 [Google Scholar]
- 21.Yang M, Wang X, Guan F, et al. Adaptation and dosimetric commissioning of a synchrotron-based proton beamline for FLASH experiments. Phys Med Biol 2022;67(16): 10.1088/1361-6560/ac8269. [DOI] [PMC free article] [PubMed]
- 22.Titt U, Yang M, Wang X, et al. Design and validation of a synchrotron proton beam line for FLASH radiotherapy preclinical research experiments. Med Phys 2022;49(1):497–509. [DOI] [PubMed] [Google Scholar]
- 23.Wang Q, Titt U, Mohan R, et al. Optimization of FLASH proton beams using a track-repeating algorithm. Med Phys 2022;49(10):6684–6698. [DOI] [PubMed] [Google Scholar]
- 24.Allison J, Amako K, Apostolakis J, et al. Recent developments in Geant4. Nucl Instrum Methods Phys Res A 2016; 835;186–225. [Google Scholar]
- 25.Guan F, Peeler C, Bronk L, et al. Analysis of the track- and dose-averaged LET and LET spectra in proton therapy using the geant4 Monte Carlo code [published correction appears in Med Phys. 2018 Mar;45(3):1302]. Med Phys 2015;42(11):6234–6247. [DOI] [PMC free article] [PubMed] [Google Scholar]
- 26.Guan F, Bronk L, Titt U, et al. Spatial mapping of the biologic effectiveness of scanned particle beams: towards biologically optimized particle therapy. Sci Rep 2015;5:9850. [DOI] [PMC free article] [PubMed] [Google Scholar]
- 27.Guan F, Geng C, Ma D, et al. RBE Model-Based Biological Dose Optimization for Proton Radiobiology Studies. Int J Part Ther 2018;5(1):160–171. [DOI] [PMC free article] [PubMed] [Google Scholar]
- 28.Almond PR, Biggs PJ, Coursey BM, et al. AAPM’s TG-51 protocol for clinical reference dosimetry of high-energy photon and electron beams. Med Phys 1999;26(9):1847–1870. [DOI] [PubMed] [Google Scholar]
- 29.Schneider CA, Rasband WS, Eliceiri KW. NIH Image to ImageJ: 25 years of image analysis. Nat Methods 2012;9(7):671–675. [DOI] [PMC free article] [PubMed] [Google Scholar]
- 30.Howard ME, Herman MG, Grams MP. Methodology for radiochromic film analysis using FilmQA Pro and ImageJ. PLoS One 2020;15(5):e0233562. [DOI] [PMC free article] [PubMed] [Google Scholar]
Associated Data
This section collects any data citations, data availability statements, or supplementary materials included in this article.
Supplementary Materials
Figure S1. Experimental setups using the clinical spot-scanning protons (87.2 MeV). (A) Dose measurement using the Advanced Markus chamber without the protection cap in place. A plastic water slab was put on the ion chamber holder to make the experimental setup stable, but it was not shown here for better visualization. (B) EBT-XD film irradiation. The gantry was rotated to 180. A custom rigid hollow supporter (made of Lucite, with a 20 cm 20 cm open area) was mounted on the snout of the nozzle to hold the buildup phantom and other experimental components. A 5 cm 5 cm uniform dose field was generated in the isocenter plane.
Figure S2. EBT-XD films exposed by clinical spot-scanning protons (87.2 MeV). The dose increases from right to left in all the panels. The numerical value on each strip is not the dose in Gy; it is the multiple of monitor units in the proton beamlet scan pattern. The dose to each film strip was determined from the measurement of an Advanced Markus chamber and Monte Carlo calculation. The plastic water buildup thicknesses were 1 cm, 5.4 cm, and 5.6 cm for panels (A), (B) and (C). Each strip is 2.54 cm 5.08 cm. The uniform dose field size is 5 cm 5 cm in the isocenter plane. The region of interest of each film strip for data analysis is the central area of 2 cm 2 cm, as illustrated in the panel (D), which only showed red channel images (5.6 cm buildup).
Figure S3. Experimental setup using the horizontal proton beamline for FLASH and non-FLASH experiments. The EBT-XD film was placed between the buildup phantom and the Advanced Markus chamber. A 0.5 cm plastic water buildup phantom was used in (A), and a 5.5 cm plastic water buildup phantom was used in (B).
Figure S4. EBT-XD films exposed by research FLASH and non-FLASH protons (horizontal beamline, 87.2 MeV). The film irradiation setup parameters are as follows: (A) FLASH, 5 mm plastic water buildup, 2500 monitor units (MU); (B) non-FLASH, 5 mm plastic water buildup, 1600 MU; (C) FLASH, 5.5 cm plastic water buildup, 600 MU. The size of each film is 10.16 cm 10.16 cm, irradiated by a single proton spot. The region of interest of each spot for data analysis was the central disc area with a radius of 2.5 mm, as indicated in the panel (D), which was the same as the radius of the sensitive volume of an Advanced Markus chamber for dose measurement. The dose to each film was determined from the ion chamber measurement and Monte Carlo calculation.
Figure S5. Experimental setup using a 6 MV photon beam for film irradiation. The gantry was rotated to 0. The film strip was aligned at the field center between the 1.5 cm buildup phantom (solid water) and the backscattering phantom (solid water). Before and after placing the buildup phantom on the top of the film strip was illustrated in (A) and (B). In panel (B), the source-to-surface distance was set to 100 cm, and the radiation field size was 10 cm 10 cm in the isocenter plane.
Figure S6. EBT-XD films exposed to 6 MV photons with different doses (Varian TrueBeam). Each strip is 2.54 cm 20.32 cm. In panel (A), from right to left, dose increases from 0 to 3200 cGy. The region of interest of each film strip for data analysis is the central area of 2 cm 2 cm, as indicated in panel (B).
Data Availability Statement
The experimental setups, configuration parameters, and data fitting results in the current study are available in the Supplementary Materials. The experimental data generated in the current study are available from the first author upon reasonable request.