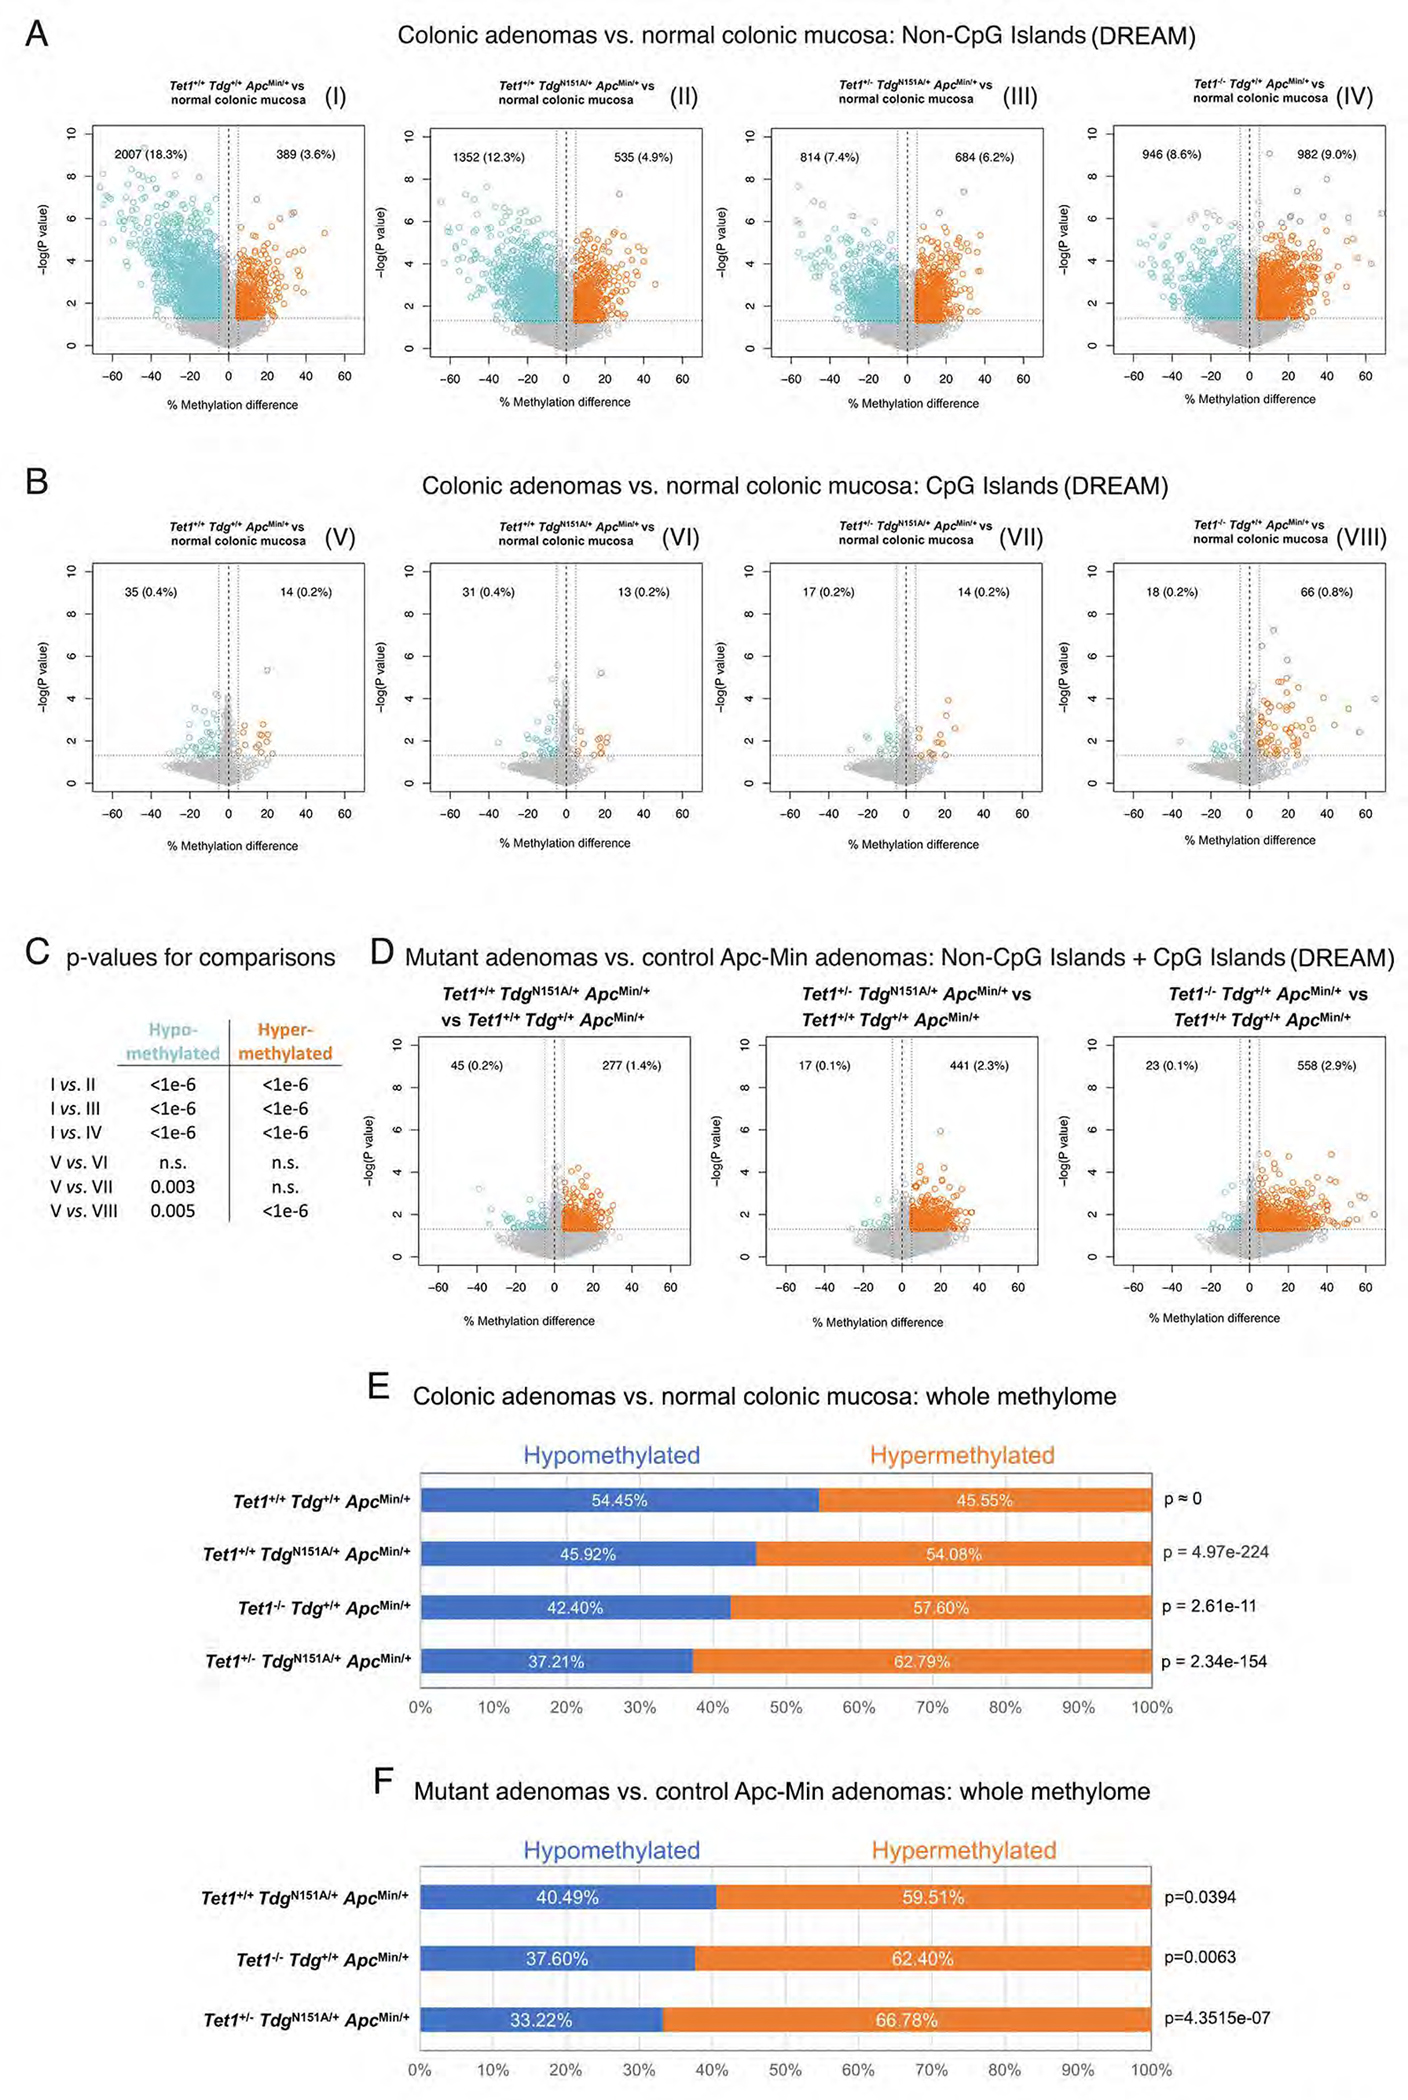
Figure 3 -. Loss of global DNA hypomethylation in Tet1- and Tdg-mutant ApcMin adenomas.

Volcano plots showing differences in DNA methylation at (A) non-CpG island (NCGI) and (B) CpG island sites (CGI) in each comparison of Tet1−/−Tdg+/+ApcMin/+ adenomas, Tet1+/−TdgN151A/+ApcMin/+ adenomas, Tet1+/+TdgN151A/+ApcMin/+ adenomas and control Tet1+/+Tdg+/+ApcMin/+ adenomas vs. normal colonic mucosa. CpG sites showing average methylation changes ≥5% and p-value<0.05 are highlighted in blue (hypomethylated sites) and orange (hypermethylated sites); number and percent of hypo-/hypermethylated CpG sites over total number of CpG sites analyzed is shown in each Volcano plot. Volcano plots are labeled I through VIII. (C) Summary of p-values for differences in hypo- and hypermethylated CpG sites between the indicated volcano plots in A and B, labeled I through VIII; n.s.=non-significant. (D) Volcano plots showing the global (NCGI + CGI) difference in average DNA methylation in each comparison between Tet1−/−Tdg+/+ApcMin/+ adenomas, Tet1+/−TdgN151A/+ApcMin/+ adenomas, Tet1+/+TdgN151A/+ApcMin/+ adenomas vs. control Tet1+/+Tdg+/+ApcMin/+ adenomas. CpG sites showing average DNA methylation changes ≥5% and p-value<0.05 are highlighted in blue (hypomethylated sites) and orange (hypermethylated sites). (E) Percent hypo- and hyper-methylation in comparisons between normal murine colonic mucosa methylome (GSE57527)44 and methylome of Tet1−/−Tdg+/+ApcMin/+ adenomas, Tet1+/−TdgN151A/+ApcMin/+ adenomas, Tet1+/+TdgN151A/+ApcMin/+ adenomas and control Tet1+/+Tdg+/+ApcMin/+ adenomas. (F) Percent hypo- and hyper-methylation in each comparison between Tet1−/−Tdg+/+ApcMin/+ adenomas, Tet1+/−TdgN151A/+ApcMin/+ adenomas, Tet1+/+TdgN151A/+ApcMin/+ adenomas vs. control Tet1+/+Tdg+/+ApcMin/+ adenomas. Percent hypo-/hypermethylation is computed by identifying CpGs in the intersection between each methylome comparison; p-value was computed with Wilcoxon rank-sum test.
