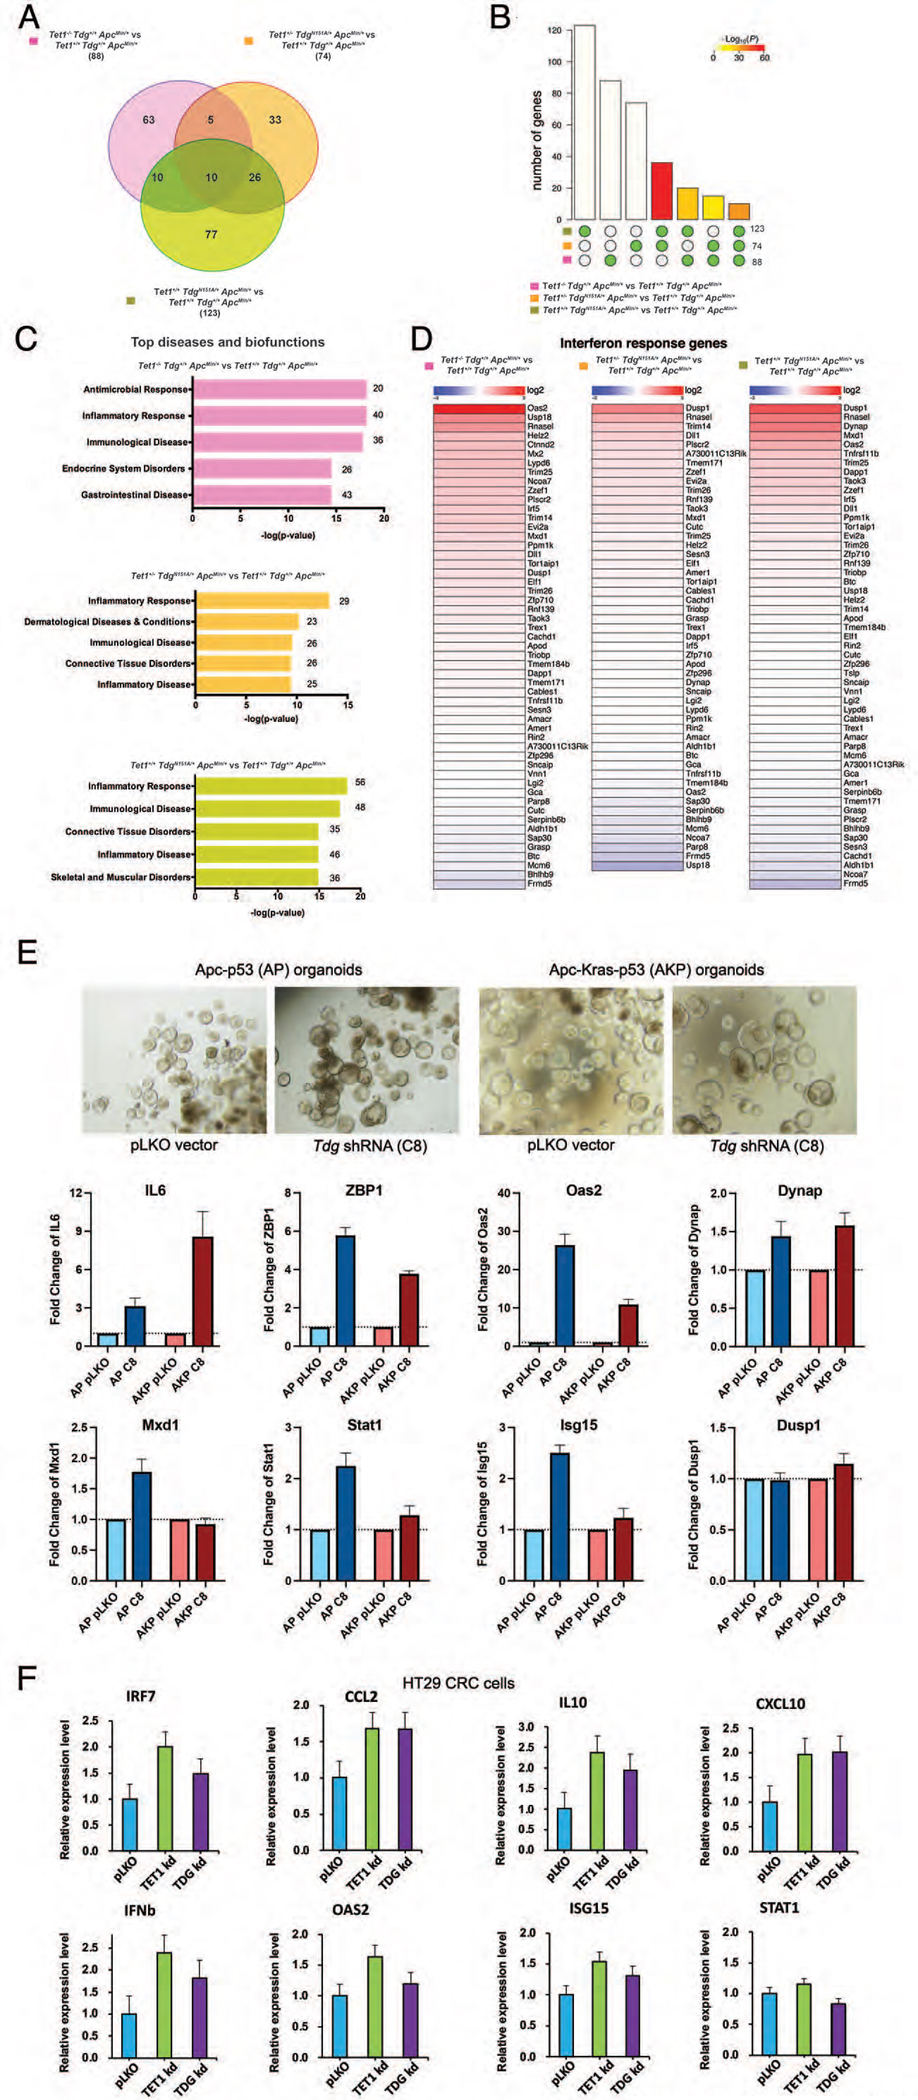
Figure 4 -. Tet1- and/or Tdg-mutant ApcMin adenomas exhibit upregulation of inflammatory, interferon and immune response pathways.

(A) Venn diagrams showing the number of common and differentially expressed genes between Tet1−/−Tdg+/+ApcMin/+ adenomas, Tet1+/−TdgN151A/+ApcMin/+ adenomas, Tet1+/+TdgN151A/+ApcMin/+ adenomas vs. control Tet1+/+Tdg+/+ApcMin/+ adenomas. (B) Bar chart illustrating all possible intersections, by SuperExactTest, among genes differentially expressed (y-axis) in Tet1−/−Tdg+/+ApcMin/+ adenomas, Tet1+/−TdgN151A/+ApcMin/+ adenomas, Tet1+/+TdgN151A/+ApcMin/+ adenomas vs. control Tet1+/+Tdg+/+ApcMin/+ adenomas confirms statistically significant involvement of the same genes in Tet1 and Tdg mutant adenomas. The matrix of solid and empty circles at the bottom illustrates “presence” (solid green) or “absence” (empty) of data sets in each intersection; numbers to the right of the matrix are set sizes; colored bars represent intersection sizes with color intensity showing p-value significance. (C) Ingenuity pathway analysis of differentially expressed genes in Tet1−/−Tdg+/+ApcMin/+ adenomas, Tet1+/−TdgN151A/+ApcMin/+ adenomas, Tet1+/+TdgN151A/+ApcMin/+ adenomas vs. control Tet1+/+Tdg+/+ApcMin/+ adenomas. The most highly enriched gene ontology categories (top diseases and biofunctions) are shown. (D) Differentially expressed genes between Tet1−/−Tdg+/+ApcMin/+ adenomas, Tet1+/−TdgN151A/+ApcMin/+ adenomas, Tet1+/+TdgN151A/+ApcMin/+ adenomas vs. control Tet1+/+Tdg+/+ApcMin/+ adenomas are compared with a list of genes induced by interferon-beta45. (E) qRT-PCR showing induction of interferon and inflammatory response genes following Tdg knockdown (C8) versus lentivirus control (pLKO) infection of colonic organoids bearing Apc/p53 mutation (AP) or Apc/Kras/p53 mutation (AKP). Morphology of organoids (phase-contrast) is shown. (F) qRT-PCR showing induction of interferon and inflammatory response genes in HT29 CRC cells following TET1 or TDG knockdown versus lentivirus control (pLKO) infection.
