

Award ID: 1
Potential Key Genes for Predicting Risk of Stroke Occurrence: A Computational Approach
Pradeep Kumar, Deepti Vibha, Achal Kumar Srivastava, Kameshwar Prasad, Manabesh Nath, Shubham Misra, Achal K. Srivastava, Kameshwar Prasad, Achal Kumar Srivastava, Kameshwar Prasad, Gourab Das
Neurology, All India Institute of Medical Sciences, New Delhi, India
E-mail: pradeepguptaneuro@gmail.com
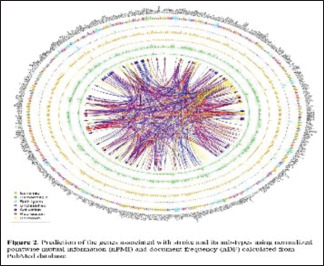
Background and Aim: Stroke is a complex heterogeneous disorder that occurs due to the interaction between environmental and genetic risk factors.[1, 2] It is one of the main important causes of mortality and long-term disability worldwide.[3] About 85% of stroke cases are ischemic stroke (IS), whereas 15% are hemorrhagic stroke (HS).[4] According to the Trial of Org 10172 in Acute Stroke Treatment (TOAST) classification; IS has been categorized according to the presumed etiological mechanism into five groups: large artery atherosclerosis (LAA), small vessel disease (SVD), cardio-embolic disease (CE), other determined etiology (ODE), and undetermined etiology (UDE).[5] Furthermore, HS is categorized into intracerebral hemorrhage (ICH) and Subarachnoid hemorrhage (SAH). Despite recent advancements in treatment modality, very few are known regarding the essential pathophysiology of stroke, and further research is still warranted to elucidate mechanisms in order to identify stroke occurrences. Several established risk factors including diabetes, hypertension, dyslipidemia, smoking, atrial fibrillation, and obesity have been a link to the happening of stroke.[6] The fraction of strokes of undermined or rare causes is greater for young adults as compared to elders, and in many cases, underlying causes are genetic related. More than hundreds of genes have been described to be linked with the risk of stroke.[7, 8] Unravelling the genetic causes that play an important role in IS and HS is very challenging, as the genetic part of it is multifaceted.[9] In most cases, numerous genes are likely involved in the pathogenesis of stroke performing on a broad variety of candidate pathways, such as inflammatory, haemostatic, renin-angiotensin-aldosterone, and homocysteine metabolisms.[10, 11] The genetic constituent is more predominant in LAA subtypes of IS than in SVD or cryptogenic IS and in patients younger than 70 years of age.[12] Previously published multicentric genetic studies using genome-wide data estimated that 40% for LAA, 33% for CE, 16% for SVD, and 38% for combined (Determined plus undetermined) etiology comprises the heritability of IS.[7, 13, 14] with the illustration that some genetic variants may serve as causal markers for stroke. To recognize the role of particular risk elements in regulating the pathophysiology of stroke, the hereditary basis of every risk factor is desirable to be examined and integrated, in context to their biological role and pathway interactions. To date, there are no well-established genetic markers that may discriminate the stroke types as well as their subtypes. Identifying novel diagnostic and prognostic genetic markers has become an urgent demand. But its experimental determination remains a costly and time-consuming process. Hence, novel computational methods are needed to fulfil this requirement. But, very few in silico methods were developed in this regard including gene expression-based models [18], machine learning-based classifiers,[19] genetic algorithm-based models [20], and a relational database named SigCS base (http://sysbio.kribb.re.kr/sigcs) [21] which documented genes, variants, and pathways related to cerebral stroke. Unfortunately, this rich resource was discontinued as of February 2021. So, there was a huge scope for the development of a computational algorithm for the prediction of genes associated with stroke types and their sub-types. Our computational approach was aimed to recognize possible important genes and the pathways linked with the pathogenesis and prediction of stroke types along with their subtypes. Methodology: Methods Advanced query building and searching PubMedWe fetched Human genes using genome assembly build 38 patch release 13 with known (status “Active”) gene symbols through the NCBI gene database (https://www.ncbi.nlm.nih.gov/gene). PubMed advanced queries were constructed using stroke-related keywords and associations were calculated using Normalized pointwise mutual information (nPMI) between each gene symbol and queries.[22] To reduce the false hits, only titles and abstracts were searched from the articles published till 31st August 2020.[23, 24] A list of sample queries used for searching has been provided in Table 1 with the number of hits observed. Complete workflow of the method developed for stroke associated gene identification using PubMed titles and abstracts are illustrated in the Figure 1. Model developmentDocument frequency (DF) related to a query is defined as the number of hits fetched by searching the database. DF can be easily normalized by the total no. of entries in the database. Similarly, pointwise mutual information (PMI) is another important metric often employed to find the association between two random variables (RV). A normalized form of PMI (nPMI) was derived by Bouma et al.[22] In several published works, nPMI were employed to estimate the association between entities like genomic repeats, stress, virulence, computational tools, drug-discovery related keywords, etc.[25, 26] Following a similar approach of association mining, individual and co-occurrences of each gene symbol (RV1) and stroke-related keywords (RV2) in PubMed titles and abstracts was calculated using normalized DF (nDF) which was further utilized to compute nPMI. This nPMI value represents the strength of association between the gene (genotype) and stroke (phenotype). Performance evaluationPerformance of the model was assessed using receiver operating characteristic (ROC) and precision-recall (PR) curve analysis on a cumulative dataset of human housekeeping (negative) [27, 28] and already published stroke-related genes (positive). A positive gene set was constructed by compiling gene lists provided in the stroke-related research articles published during the last decade. [7, 18, 29-32] nPMI based model was developed for stroke-associated gene identification and compared with the existing gene expression-based method. Among many developed techniques for disease related gene identification, gene expression analysis is widely used for stroke (mainly IS) gene detection. The method follows the well-established protocol to select differentially expressed genes (DEGs). We have compared our algorithm with this existing method. Selected human microarray datasets (platform GPL570) have been listed from selected recent articles [33-35] and downloaded from the Gene Expression Omnibus (GEO) database (https://www.ncbi.nlm.nih.gov/geo/) using GEOQuery. The authors of these publications have used different R bioconductor packages and online tool including GEO2R (http:// www. ncbi. nlm. nih. gov/ geo/ geo2r) [36], and most commonly used The Linear Model for Microarray (LIMMA) to find the DEGs from microarray expression data. The GEO2R web tool hosted by NCBI has also used LIMMA for DEG detection. Hence, we used LIMMA R package in the present analysis after pre-processing all the raw CEL files using Robust Multi-Array Average expression measure (RMA) which includes background correction followed by quantile normalization and expression measurement. Pathway analysisTo achieve insight into the biological roles and pathological mechanisms of stroke and its etiologies, we examined the biological ways that significantly overlapped with the curated stroke and etiology gene sets. For this, we calculated common genes related to stroke etiology gene sets and the genes wiki-pathways [37] and executed statistical testing to measure the significance of the overlaps. To achieve insight into the biological functions and pathological mechanisms of stroke and its etiologies, we recognized the biological pathways that significantly enriched with the curated stroke and etiology gene sets. Using cluster Profiler R package,[38] enrichment analysis was performed on three major pathway databases namely KEGG (https://www.genome.jp/kegg/) (release 96.0), [39] WikiPathways (https://www.wikipathways.org/) (release September 2020) [37] and Reactome (https://reactome.org/) (version 75) [40] which are curated, comprehensive and rich data sources on human metabolic pathways. To initiate the analysis, probable stoke associated (PSA) gene symbols were first converted to ENTREZ ids and then pathway enrichment was done with a p-value cutoff of 0.05 and was adjusted by the Bonferroni method.[41] Result: Genes associated with stroke and its typesPubMed advanced searched using stroke-related keywords as mentioned in the Table 1 and associations were calculated using nPMI between each gene symbol and queries. To reduce the false hits, only titles and abstracts were searched from the articles published till 31st August 2020. A total of 2,785 (9.4%) genes were found to be linked to stroke risk. Based on stroke types, 1,287 (46.2%) and 376 (13.5%) genes were found to be associated with the risk of IS and HS respectively. Further stratification of IS based on TOAST classification, it was found that 86 (6.6%) genes were confined to Large artery atherosclerosis (LAA); 131 (10.1%) and 130 (10%) genes were related to the risk of small vessel disease (SVD) and Cardioembolism (CE) subtypes of IS. Circos diagram for the identified genes associated with stroke types and subtypes are represented in Figure 2. Total 28,281 human gene symbols were extracted from the NCBI gene database with the status tag “Active” and used for calculation of nPMI with query no. 2 from Table 1. 2,785 (9.8%) symbols were found to be associated (having positive or negative nPMI values) with stroke (set A). To determine the stroke subtypes, nPMI was computed with query no. 3 and query no. 4 [Table 1] for these 2,785 gene symbols resulting 1,294 (46.5%) and 376 (13.5%) genes in association with IS and HS respectively. The rest of the symbols were marked as “Unclassified”. Further filtering using DF values (>5) and removing symbols (#11) like CAT, IMPACT, SET, etc. which are common English words, were listed 441 PSA genes along with their types [Figure 2]. Gene symbols that were found to be in association with both types (HS and IS) of strokes were tagged as “Both Types” [Figure 2]. Mining manually curated TRRUST database v2 (transcriptional regulatory relationships unraveled by sentence-based text-mining) (https://www.grnpedia.org/trrust/) [42] catalogued all the transcription factors and their target genes along with existing interaction types (activation, repression, or unknown) [Figure 2]. Evidences reported through published meta-analysis and GWAS studies suggested for the association of nine highly associated genes and therefore, we concluded a prognostic panel of nine genes comprising of CYP4A11,[35] ALOX5P,[36, 37] NOTCH,[38, 39] NINJ2,[40, 41] FGB,[42, 43] MTHFR,[44–46] PDE4D,[47, 48] HDAC9,[17, 49, 50] and ZHFX3 [7, 17, 51] can be treated as a diagnostic marker to predict individuals who are at the risk of developing stroke. Validation of these nine prognostic markers are further required by conducting case-control studies embedded with large sample size. Genes associated with stroke sub-typesQueries no. 5-9 from Table 1 have been used in nPMI model for stratification of genes associated with IS subtypes as per TOAST classification. 131 (10.1%) genes were confined to Small Vessel Disease (SVD) followed by 130 (10%) Cardioembolism (CE), 86 (6.6%) Large artery atherosclerosis (LAA), 30 (2.3%) Undetermined etiology (UDE) and 7 (0.5%) Other determined etiology (ODE). While classifying HS sub-types using queries no. 10-11, 292 (77.8%), and 132 (35.2%) were predicted as Intracerebral hemorrhage (ICH) and Subarachnoid hemorrhage (SAH) respectively. A subset of PSA (#140) genes associated with different stroke subtypes was represented in Figure 3. Evaluation of nPMI modelFor performance evaluation of the developed nPMI model, a list of already published 14,347 genes consisting of 2,180 (15%) stroke-related (positive set) and 12,167 (85%) human housekeeping genes (negative set) were constructed after eliminating 1454 common entries from the negative set. An intersection of 10,811 genes was found between set A and published gene sets (positive: 1967, negative: 8844) which was used for evaluation. To avoid the class imbalance problem, 1967 (i.e. equal no. to positive) entries were randomly sampled from negative set to calculate the evaluation metrics (accuracy, precision, sensitivity and specificity). The sampling process was repeated 25 times and average values of area under curve (AUC) values Receiver Operating Characteristic (ROC) and Precision-Recall (PR) plots were reported as final evaluation measures (Supplementary Table T11). ROC and PR plots along with other evaluation metrics were plotted using Precrec R package [43]. nPMI based model is performing better than gene expression based method as reflected from the comparisons of the evaluation metrics [Figure 4]. Statistically significant DEGs were hardly found from the analysis of GSE66724 and GSE22255 GEO datasets. GEO2R with default settings also produced the similar results. Stroke can influence many pathwaysTo reduce false-positive hits, pathway enrichment analysis was done using 190 genes, a subset of PSA gene symbols that were manually curated and already known to be associated with stroke. Analysis with Reactome, WikiPathways, and KEGG resulting 53, 32, and 35 unique pathways enriched with aforementioned stroke-associated genes. However manual curation of these lists of pathways showed promising results with WikiPathways and Reactome which were presented in Figure 4. Findings for the genes associated with biological Network pathways including Kegg and Reactome are reported in Figure 5. Conclusion: A prognostic panel of nine genes comprising of CYP4A11, ALOX5P, NOTCH, NINJ2, FGB, MTHFR, PDE4D, HDAC9, and ZHFX3 can be treated as a diagnostic marker to predict individuals who are at the risk of developing stroke. Validation of these nine prognostic markers is further required by conducting case-control studies embedded with large sample size.


Award ID: 2
Study of Post-Stroke Cognitive Impairments (PSCI) in Patients with Recent Ischemic Stroke and Effect of Yoga on PSCI
Manshi Kashyap, Nirendra Kumar Rai, Ruchi Singh, Ankur Joshi, Abhijit Rozatkar
Neurology, AIIMS, Bhopal, Madhya Pradesh, India
E-mail: kashyapmansi58@gmail.com
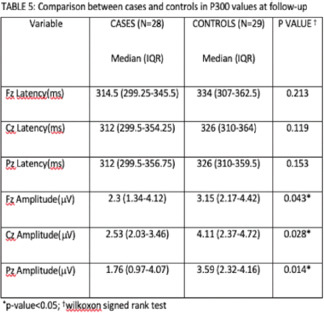
Background and Aim: Traditionally, research and interventions have been primarily focused on physical disabilities and cognitive disabilities have often been neglected1. Post-Stroke Cognitive Impairment (PSCI) is a clinical entity that encompasses all types of cognitive impairment following an index stroke. It may affect up to one third of stroke survivors. Important structures of brain are connected by various association fibres. Involvement of these fibres is an important determinant of cognitive decline. Brain has an enormous capacity for new synaptogenesis, neurogenesis, neuronal circuit rewiring as well as new circuit formation (neuroplasticity). Neuroplasticity is maximum during the initial phase of recovery post-stroke and if intervened early, better outcomes may be obtained. Yoga has been reported to have beneficial effect on traditional risk factors of stroke as well as cognitive functions. Stress of any cause is associated with high levels of cortisol in our body, which has a toxic effect on hippocampus- a critical structure for memory and cognition2. Thus, a regular practice of yoga and meditation among the patients with stroke may help in improving the cognitive functions. Considering these facts, present study aimed to study the spectrum of PSCI in patients with recent ischemic stroke (onset < 1 month), and to evaluate the effect of yoga on PSCI. Secondary objectives include to assess the compliance with yoga and to evaluate whether there is any change in caregiver burden with the yoga intervention. Methodology: It was a hospital based open-label, randomized, control study. As we could not find any previous study which had evaluated the effects of Yoga on post stroke cognitive impairment, a convenient sample size of 30 patients in each arm (Yoga Arm and Control Arm) was included. After considering a drop-out rate of 25%, we had planned to include 40 patients in each arm. All participants were recruited after obtaining approval from the Institutional Human Ethics Committee. Participants were recruited from out-patient, in-patient, and emergency services of Department of Neurology, AIIMS Bhopal. Inclusion Criteria were (1) Age more than 18 years with recent ischemic stroke (onset <1 month onset), (2) Patient should be able to sit without support and be able to walk with a maximum of single person support (Modified Rankin Scale ≤3). Exclusion criteria included: (1) Pre-existing dementia or Minimal Cognitive Impairment (MCI), (2) Patients who were already practicing yoga prior to randomization, (3) Severe aphasia or severe dysarthria, (4) Cardiopulmonary contraindication for physical exercise as per the American College of Sports Medicine, (5) Chronic disease with less than 2 years of life expectancy, (6) Magnitude Resonance Imaging (MRI) is contraindicated, (7) Yoga/Breathing exercise is contraindicated (major artery stenosis/dissection etc), (8) Residing > 50 km from the research site or unavailable to attend the intervention at one of the scheduled times, (9) Pregnant lady or those planning for pregnancy during study period, (10) Any patient who did not give consent. Study period was between April 2020 and April 2022. Using Block randomisation method, with the help of Statistics Package for Social Sciences (SPSS) software, patients were randomized in two groups (Yoga arm, N = 40; and Control arm, N = 40). All patients (in both arms) were assessed and treated as per standard of care, which included a consultation with physiotherapist. Baseline cognitive functions were assessed. Investigations and Brain MRI were done as per the standard of care. Event-related potential (P300) was measured in the Neurology Laboratory, as an objective neurophysiological method to assess cognition, at baseline, and then repeated after 6 months. The intervention period was of 6 months. In the first week of intervention, the patient was expected to attend yoga sessions for at least 5 days, to enable them to learn the asanas/breathing techniques. Thereafter, for the next 11 weeks, the intervention was supervised via tele-yoga sessions with the help of recorded video telecast on Google-Meet platform, at least 1-2 days a week. This tele-yoga session was conducted at a specified time on Wednesday and Saturday. It was conducted in compliance with the Advisory on Tele-Yoga Services, Version 1.0. July 2020, by the Central Council for Research in Yoga & Naturopathy (CCRYN), New Delhi (An Autonomous Body under the Ministry of AYUSH, Government of India)3. All patients were encouraged to do their respective activity at least 4-5 days/week at home. In the next 3 months, patients were encouraged to continue the intervention for at least 4-5 days/week at home. Once-weekly reminders were provided to them with the help of text messages. Patients replied with a missed call or text message; and failure to do either of them was considered as non-compliance. Follow-up data as per outcome criteria was collected at the end of 6 months. Standard of care was given to all enrolled patients as per international guidelines. Yoga protocol: Each Yoga session was of about 60 minutes, supervised by trained yoga teacher. This consisted of 5 minutes of breathing exercises, 10 minutes of strengthening exercises, 30 minutes of simple yoga asanas, and 10 minutes of pranayama, and 5 minutes of meditation. In the first class, single 10-minute lecture on yoga concepts and possible benefits was described to new enrolled group. Standard rehabilitation as per stroke disability was offered to these patients along with Yoga. They were encouraged to continue similar practice at home. Control arm protocol: This arm received the standard of care which included a physiotherapy consultation. Patients were advised to continue with physical activity at home as per standard stroke rehabilitation guideline. Questionnaires /Scales: All questionnaires/scales evaluated initially were re-evaluated after 6 months (Annexure III), which included a Semi-structured questionnaire for clinic-epidemiological data collection, Montreal cognitive assessment scale (MoCA)4, Frontal Assessment Battery (FAB)5, Modified Rankin scale (MRS)6, Clinician-Rated Dimensions of Psychosis Symptom Severity (CDPSS)7, and Caregiver Burden Scale (CBS)8. Follow-up data as per outcome criteria was collected at the end of 6 months. Standard of care was given to all enrolled patients as per international guidelines. Outcome Measures: Primary Outcome was defined as change in MoCA by 2 points in either direction, or FAB scale by 2 points. While Secondary Outcomes were MRS, CDPSS, CBS and P300 values. Statistical Analysis: Data analysis was done using Statistics Package for Social Sciences (SPSS) version 16. It was categorised according to nature of variables. Microsoft word and Excel were used to generate tables and figures. Tests of normality was done using Shapiro-Wilk Test. Mean and standard deviation was used for parametric data, while median with interquartile range was used for non-parametric data. Unpaired T test, Mann-Whitney U Test, Wilcoxon signed rank test were used as applicable, to compare the baseline variables between the cases and controls, as well as at follow-up. Comparisons were done between the scores within the individual groups, as well as in between the two groups (Yoga arm and control arm). A value of p < 0.05 was considered statistically significant for all tests. Result: Mean age of cases was 52.85 ± 13.70 years, and of controls was 55.18 ± 13.24 years. Males constituted 70% of the cases, and 66% of controls. Baseline characteristics are mentioned in Tables 1 and 2. Baseline characteristics between the two groups were comparable in our study, except for visuospatial, naming, mental flexibility and programming domains. Spectrum of PSCI includes deficits in multiple domains, including visuospatial, language, naming, programming, conceptualisation, mental flexibility, sensitivity to interference and inhibitory control. In the Yoga Arm, median MOCA score increased by 5 points (p < 0.05), while median FAB score increased by 3.5 points (p < 0.05). Median MRS Score and CDPSS Score improved by 1 point (p < 0.05) while median CBS Score also improved 11 points (p < 0.05). With regard to individual domains of MOCA, significant improvements were seen in visuospatial, attention, abstraction, recall and orientation. While in FAB, all, except environmental autonomy, showed significant improvement [Table 3]. Median P300 latencies also improved at Fz, Cz and Pz at follow up. However, median P300 amplitudes did not show significant improvement. In Control Arm, median scores in MOCA, FAB, MRS, CDPSS and CGB showed significant improvement in the Control Arm as well. Median MOCA and FAB scores improved by 5 points (p < 0.05) and 3 points respectively (p < 0.05). While median MRS Score improved by 1 point (p < 0.05), median CBS score improved by 11 points (p < 0.05). Median CDPSS score also improved by 2 points (p < 0.05). Among the domains in MOCA, significant improvement in median scores were seen in all domains, except naming and language. While all domains in FAB showed significant improvement [Table 3]. Significant improvement was also seen in P300 latencies at Fz, Cz and Pz as well as in Fz amplitude, but not in Cz and Pz amplitudes. In between the two groups, median MOCA score was significantly higher in Cases (25.5, IQR 22-27) than in Control group (24, IQR 20-25.75) (p < 0.05). Median FAB score was also higher in the Cases (15.5, IQR 14-17) than in Control group (14, IQR 12-15.75) (p < 0.05). Improvement in median CDPSS score was significantly better in the Yoga Arm than the Control Arm (p < 0.05). However, improvement in the MRS score and CBS score was not statistically significant [Table 4]. No significant difference between both the groups was seen in the p300 latencies, although the difference in the median amplitudes at Fz, Cz and Pz were significant [Table 5]. 30 out of 40 patients (75%) were compliant and completed the intervention. 2 patients withdrew consent after the first 2 weeks of the intervention period as they complained of generalised body-ache. 6 of the remaining 8 patients were noncompliant and did not do the intervention in the prescribed manner. They cited fatigue/generalised weakness and low motivation as the reason for non-compliance, while another 2 patients were lost to follow-up. There was no death in the Yoga Arm, and 1 death in the Control arm during the study period due to myocardial infarction. Conclusion: The spectrum of Post Stroke Cognitive Impairment includes deficits in multiple domains, including visuospatial, language, naming, programming, conceptualisation, mental flexibility, sensitivity to interference and inhibitory control. Primary outcome (i.e. change in MOCA and/or FAB score by at least 2 points) was achieved in both the Yoga arm and the Control arm [Figure 1]. Between the groups, Median MOCA score was significantly higher in Yoga arm (25.5, IQR 22-27) than in Control arm (24, IQR 20-25.75) (p < 0.05), and the domains which showed significant improvement are visuospatial, naming and recall. Median FAB score was also higher in the Cases (15.5, IQR 14-17) than in Control group (14, IQR 12-15.75) (p < 0.05). Among the FAB domains, significantly better median scores were obtained in motor programming, sensitivity to interference and inhibitory control (p < 0.05). However, as the median scores in visuospatial, naming and motor programming were not comparable at baseline between the two groups, effect of yoga on these domains is uncertain. It is noteworthy that for MOCA, we had already added correction factor (1 point) for subjects with total duration of formal education 12 years or less, as is recommended [58]. Hence, education is not a confounding factor in our study. Secondary outcomes were also achieved in both groups with regard to CDPSS score, CBS scores, and MRS scores. In between the groups, improvement in median CDPSS score was significantly better in the Yoga Arm than the Control Arm (p < 0.05). However, improvement in MRS score was not significantly different between the two groups. This is probably because MRS score is based on functional status and there is plenty of existing evidence that any kind of physical activity, be it yoga or physical therapy, reduces post-stroke disability and improves function. Also, reduction in caregiver burden in the Yoga arm was not significant greater as compared to the Control group. This could be because the caregivers mostly focussed on the burden due to physical impairment, whereas, our study only included patients with mild to moderate disability. Hence, the burden was probably not as significant as it would have been with severe physical disability. Compliance to the intervention was 75%, while fatigue/generalised weakness and low motivation were the main reasons for non-compliance. In a randomised controlled trial by Immink et al., patients with chronic post stroke hemiparesis were randomly assigned to either a 10-week yoga intervention (n = 11) or no treatment (n = 11). They used the Stroke Impact Scale was used to measure quality of Life across six domains, at baseline and post-intervention. The effect of yoga on five domains (physical, emotion, communication, social participation, stroke recovery) was not significant; however, the effect of yoga on the memory domain was significant in their study (mean difference (MD) 15.30, 95% confidence interval (CI) 1.29 to 29.31, P = 0.03), although the evidence for this finding was very low grade9. Another study was conducted among 58 stroke patients from a general hospital in Guangzhou10, where patients were equally divided into experimental group and conventional rehabilitation group. In this study also, only patients with moderate stroke symptoms were included. For the patients in the experimental group, regular rehabilitation therapy was used together with regular yoga training, while the control group only was treated with conventional rehabilitation therapy. They found that after 12 weeks of yoga training, the cerebral blood oxygen content of stroke patients had significantly increased, and blood oxygen contents gradually approached that of normal people. On weekly monitoring, it was found that the significant increase in blood oxygen content in the brain of the patient started in the third week of the experiment. Furthermore, in this study, the recovery of cognitive function was inspected by monitoring the brain wave of patients when faced with a problem. All patients received the same problem during a particular experimental week, and each experimental week had a different problem. They reported that, for the same problem, yoga-trained patients showed greater brain activity than those who underwent conventional rehabilitation therapy. Moreover, the significant difference of the brain waves between the experimental group and the control group basically appeared in the fourth and fifth week of the experiment, all lagging behind the time when the significant increase in blood oxygen content in the brain of the patient. This result, therefore, showed that the increase in blood oxygen content probably enhances the brain activity and improves cognitive ability10. Our study is the first randomised controlled study which has explored this aspect. The yoga exercises prescribed in our study were not dramatic, and were suitable for stroke patients with moderate disability (MRS 3 or below) to practice in rehabilitation. Our study is also unique as it focusses on early yoga intervention. As already mentioned earlier, a diagnosis of PSD should be reserved until 6 months post stroke. Hence, our study shows that early yoga intervention in stroke survivors will significantly improve their cognitive abilities. Our study used Tele-Yoga, which had many advantages. It provided easy access to patients, especially during the pandemic when movement was restricted across the country. It also saved transport-costs for patients, and increased compliance. In our study, the compliance was 75%. Most common reason for nonadherence was feeling of fatigue and generalised weakness and low motivation. There were no deaths in the Yoga Arm during the period of study, while 1 death was reported in the Control Arm due to myocardial infarction. The limitation of our study was its small sample size. To conclude, the spectrum of Post Stroke Cognitive Impairment includes deficits in multiple domains, including visuospatial, language, naming, programming, conceptualisation, mental flexibility, sensitivity to interference and inhibitory control. Our study provides evidence that Yoga, in addition to routine standard of care, has beneficial effects on Post Stroke Cognitive Impairment in patients with acute stroke (<1 month). The effects are particularly significant in recall, sensitivity to interference and inhibitory control. The intervention did not have any significant adverse effect and compliance to Yoga was also satisfactory in our study.


Award ID: 3
Does High Resolution Ultrasound Guided Femoral Nerve Conduction Study Makes a Difference When Compared to Conventional Technique?
Abhinay, Muralidhar Reddy Yerasu, Shyam Jaiswal, Lalitha Pidaparthi, Kiran Eranki, Ravi Nulaka, Anusha Penneru, J. M. K. Murthy
Neurology, CARE Hospitals, Hyderabad, India
E-mail: abhinay.gattu@gmail.com
Background and Aim: Femoral nerve motor conduction study is very useful electrophysiological test in the evaluation of femoral mononeuropathy, L3-L4 radiculopathies and lumbar plexopathies [1]. Various conventional methods of femoral nerve motor conduction techniques are described which include Rigshospitalet method, Uludag’s method, Stohr’s method and Johnson’s method. These conventional methods of involving surface or invasive stimulation of the femoral nerve at the inguinal ligament can yield erroneous results due to inaccurate placement of stimulator mainly because of the proximal location of the nerve, subcutaneous fat in obese habitus, and anatomical variations [2-8]. High-resolution ultrasound (HRUS) is increasingly being used in the evaluation of various neuromuscular disorders. It provides the static and dynamic details of the nerves and surrounding structures with precision [9]. Now-a-days, the HRUS technique is also being used in neurophysiology laboratories during nerve conduction studies to localize the stimulation or recording site in a better way especially in individuals with altered anatomy, body habitus, and unclear landmarks [10, 11]. Ultrasound-guided nerve conduction techniques have been described to allow more accurate and reliable evaluation of lateral femoral cutaneous, saphenous, sural nerves and superficial peroneal sensory nerves [12-15]. High-resolution ultrasound can easily locate the femoral nerve at the inguinal ligament and can improvise the stimulator placement. The present study hypothesises that compound muscle action potential (CMAP) recorded from rectus femoris could improve after accurate stimulator placement guided by ultrasound. This study aimed to compare the CMAP amplitude obtained from the rectus femoris muscle with the conventional technique and HRUS-assisted femoral nerve motor conduction technique in a cohort of normal healthy controls. Methodology: This was a pilot prospective observational study conducted in the outpatient clinic of Department of Neurology, CARE Hospitals, Hyderabad, between September 1, 2019 and August 31, 2020. The healthy attendants of the patients of either sex, aged above 18 years attending the outpatient clinic were included. Exclusion criteria were volunteers with subjective or objective evidence of any neuromuscular or neurological disease, any trauma or surgery to the proximal part of the lower limb, contracture, and who were not in a position to give informed consent. The study was conducted in accordance with the principles of Declaration of Helsinki. The study protocol was approved by institutional ethics committee and written informed consent was obtained from all the healthy controls before enrolment. Anthropometric measurements including height, weight, waist and hip circumference of the participating volunteers were recorded. Body mass index (BMI) was calculated as weight (in kilograms) over squared height (in meters). Waist circumference was measured in the horizontal plane at the level of superior border of iliac crest and the hip circumference was measured at the level of widest part of the buttocks. Waist to hip ratio was calculated. Healthy controls were grouped into BMI categories as per WHO and Asia Pacific population [16], waist circumference categories as per WHO and IDF (International Diabetic Federation) for males and females and waist to hip ratio category as per WHO [17]. Electrodiagnostic studies were done on Synergy EDX machine at skin temperature of 320 C. High resolution ultrasound was performed on Philips HD 15 machine with 12-3 MHz linear array transducer. All enrolled healthy controls underwent femoral nerve motor conduction study for both lower limbs by both conventional and HRUS-assisted methods. Conventional Techniques Recordings were obtained with following settings: sensitivity of 5 mV per division; sweep speed was kept at 5 ms per division and band width of 3 Hz to 10,000 Hz. A bar electrode was used for stimulation and it consisted of two flat disk electrodes with a diameter of 9 mm each and inter electrode separation of 30 mm. Femoral nerve was stimulated at the midpoint of the inguinal ligament lateral to the femoral artery. The electric current was delivered in increments slowly till a supramaximal stimulus is reached where there is no further increase in the CMAP amplitude. The active recording surface electrode was placed over the bulk of the rectus femoris muscle and reference electrode was placed 3 cm away from the active electrode. Motor latency (ms) and maximum achievable CMAP (mV) was recorded with minimum possible current (mAmp). HRUS-assisted Techniques After the initial recording of CMAP amplitude, the femoral nerve was identified using high resolution ultrasound with Philips HD 15 machine with a 12-3 Hz linear transducer. The transducer was first placed over the proximal part of thigh at mid-point of inguinal ligament. The femoral artery was identified first with the help of colour doppler and the nerve was identified as a honeycombed fascicular structure located just lateral to the femoral artery [Figure 1a]. The exact location of the nerve was marked. Femoral nerve motor conduction study was repeated with stimulation at the marked site keeping the recording electrodes at the same site as was for conventional technique. Motor latency and maximum achievable CMAP were recorded with minimum possible current. Mean CMAP amplitude and its 5th percentile value of CMAP, obtained by conventional technique was compared to CMAP amplitude by HRUS-assisted technique in various age groups (< 40 years vs ≥ 40 years), gender, BMI by WHO and Asia pacific (Asian population), waist circumference categories by WHO and IDF (South Asian population), waist to hip ratio categories based on WHO guideline. Age groups were divided as per the normative data of Storh’s technique [4]. Mean CMAP amplitude was compared because it is the most useful parameter clinically of femoral nerve conduction. Fifth percentile value of CMAP was chosen for comparison as was done in few similar studies [18]. Data was analysed using R studio software. Continuous variables were represented as mean and standard deviation (SD) and a p-value of <0.05 was considered significant. To compare the mean CMAP amplitude recorded by both techniques, ‘t’ test was used. Fifth percentile value of CMAP, obtained by both techniques were compared for difference and conventional technique was compared to HRUS for difference and change of the value was noted. Result: Total of 168 healthy controls (336 femoral nerves) were included in this study. The mean age of the study population was 45.5 years ranged 19-76 years. Majority of healthy controls were men (69.9%). Forty-three controls (25.6%) had high BMI as per the WHO criteria, and 78 controls (46.4%) had high BMI as per the Asia pacific criteria. In men, waist circumference was more than 102 cm in 39 controls (23.2%) by the WHO criteria and it was more than 90 cm in 88 controls (52.4%) by the IDF criteria. In women, waist circumference was more than 88 cm in 47 controls (27.9%) by the WHO criteria and it was more than 80 cm in 50 controls (29.7%) by the IDF criteria. The waist to hip ratio by WHO criteria was more than 0.90 in 102 male controls (60.7%) and >0.85 in 43 female controls (25.6%) [Table 1]. The increase in CMAP amplitude (mV) by HRUS-assisted technique was significantly higher when compared to conventional technique in both the age groups and both the gender (P < 0.01) [Table 2]. The CMAP amplitude (mv) was significantly high when compared to conventional techniques in all the BMI categories by WHO criteria (BMI <25 kg/m2: 10.29 vs. 8.65, P < 0.01; BMI 25-29.9 kg/m2: 9.68 vs. 8.45, P < 0.01; BMI 30-34.9 kg/m2: 9.51 vs. 8.13, P = 0.011; BMI ≥35 kg/m2: 7.58 vs. 6.42, P < 0.01). According to Asia-Pacific criteria of BMI, except one category, in all other categories CMAP amplitude (mV) with HRUS assisted technique was significantly high when compared to conventional technique (BMI 23-24.9 kg/m2: 11.06 vs. 9.04, P < 0.01; BMI 25-29.9 kg/m2: 9.68 vs. 8.45, P < 0.01; BMI 30 kg/m2: 8.44 vs. 7.18, P < 0.01). A significant change in the CMAP amplitude was observed by HRUS technique in individuals with high waist circumference (WHO- waist circumference ≥102 cm in males, Conventional vs. HRUS-assisted technique; 7.29 vs. 8.90, P < 0.01) and high waist to hip ratio (WHO- waist to hip ratio >0.90 males, Conventional vs. HRUS-assisted technique; 8.46 vs. 10.03, P < 0.01). The CMAP amplitude was significantly high in HRUS-assisted technique when compared to conventional technique in all the waist circumference categories in either gender by WHO criteria except in females with waist circumference <88 cm [Table 2]. A significantly higher CMAP amplitude (5th percentile) was observed with HRUS-assisted technique than conventional technique in both age groups (Conventional vs. HRUS-assisted technique: <40 years, 5.10 vs. 6.94 mV; ≥40 years, 2.43 vs. 4.24 mV). The increase in CMAP amplitude by HRUS-assisted technique (5th percentile) was significant when compared with conventional technique in both the age groups and both the gender. The CMAP amplitude (5th percentile) by HRUS-assisted technique was significantly higher when compared to conventional technique in all the BMI categories by WHO Criteria. The CMAP amplitude (5th percentile) by HRUS-assisted technique was significantly higher when compared to conventional technique in all the BMI categories by Asia pacific criteria for Asian population. CMAP amplitude (5th percentile) by HRUS-assisted technique was significantly higher when compared to conventional technique in all the waist circumference categories in either gender by WHO criteria and IDF criteria [Table 3]. The improvement in CMAP amplitude (5th percentile) by HRUS-assisted technique was significantly more when compared to conventional technique in male subjects with WHR ≥0.9, whereas it was significant in female subjects by WHO- WHR categories [Table 3]. Conclusion: High-Resolution ultrasound assisted technique yields larger CMAP and therefore superior to conventional technique of femoral nerve motor conduction study irrespective of age, gender, BMI, waist circumference and waist to hip ratio in normal healthy population. This is well noted in obese individuals, especially.


Award ID: 4
Changing Risk Factor Profile among Young Ischemic Strokes- A Comparative Data of 967 Patients
Murali, Subhash Kaul
Neurology, KIMS Hospital, Hyderabad, India
E-mail: drkmk3@gmail.com
Background and Aim: Introduction More than 11 million ischemic strokes occur worldwide each year, of which more than half occur in low-and middle-income countries.1 Although ischemic stroke more often affects older adults, about 10% to 20% of these occur in young adults aged 18 to 50 years.2 Compared with stroke in older adults, stroke in the young adults has a disproportionately large economic impact by leaving victims disabled before their most productive years and create a long term burden on them, their families and the community. The impact of ischemic stroke among young adults is becoming more important, as in contrast to older adults, the incidence of ischemic stroke among young adults is rising globally due since 1980s.3-6 Most of the major studies focussed on stroke in young adults in India were carried out almost a decade ago.7-9 In view of rapid westernization of diet and sedentary life style, the risk factor profile of young adults in India has been undergoing a rapid change in the last few years. This study was planned to have a relook of risk factor profile of ischemic stroke in young adults in India. Aim of the study. This study aimed to investigate the risk factors and subtypes of ischemic strokes in young adults between 15 and 45 years of age and their comparision with older adults in the South Indian city of Hyderabad. Methodology: The study was conducted on consecutively and prospectively enrolled ischemic stroke patients admited in Krishna Institute of Medical Sciences (KIMS), a tertiary care referral hospital situated in Hyderabad, the capital of South Indian state of Telengana. The study period was from June 2018 to February 2020. Out of total of 967 patients, 164 (16.91%) patients were in the age group of 15-45 years. Stroke was diagnosed as per the WHO definition of rapidly developing clinical signs of focal (or global) disturbance of cerebral function, lasting more than 24 hours or leading to death, with no apparent cause other than that of vascular origin.10 Patients were uniformly investigated to determine the underlying mechanism of stroke with magnetic resonance imaging and angiogram (MRI/MRA) of brain, carotid duplex examination, electrocardiography, two-dimensional (2D)-transthoracic echocardiography (TTE), and basic laboratory investigations like complete blood picture, fasting and postprandial blood sugar, lipid profile, blood urea and creatinine. Among patients with non identifiable mechanism, one or more of additional investigations including 24 h electrocardiography (Holter) monitoring, trans- esophageal echocardiography (TEE), digital subtraction cerebral angiography (DSA), and hematological investigations for systemic disorders including serum homocysteine, APLA antibodies, anti cardiolipin antibodies, anti thrombin- 3, protein- C, Protein- S, factor V leiden mutation, and, lupus anticoagulant were done. Stroke subtypes All patients with ischemic stroke were subtyped according to the Trial of ORG 10172 in acute stroke treatment (TOAST) classification system into Large artery atherosclerosis (LAA) (intracranial or extracranial), cardioembolism (CE), small vessel occlusion (SVO) or lacunar stroke, stroke of other determined etiology, and stroke of undetermined etiology.11 Stroke of undetermined etiology was diagnosed in participants with more than one underlying mechanism, in patients without identifiable cause despite extensive evaluation, and in those with incomplete evaluation. Patients were classified into stroke subtypes based on the review of investigations and clinical assessment by neurologists trained in stroke diagnosis of subtypes. At least two neurologists reviewed data of an individual patient to arrive at the mechanism of stroke subtype. The study was approved by the Institutional Ethics Committee of Krishna Institute of Medical Sciences. Statistical analysis Descriptive analysis was carried out by mean and standard deviation for quantitative variables, frequency and proportion for categorical variables. Non normally distributed quantitative variables were summarized by median and interquartile range (IQR). All Quantitative variables were checked for normal distribution within each category of explanatory variable by using visual inspection of histograms and normality Q-Q plots. Shapiro- wilk test was also conducted to assess normal distribution. Shapiro wilk test p value of >0.05 was considered as normal distribution. Categorical outcomes were compared between study groups using Chi square test /Fisher’s Exact test (If the overall sample size was < 20 or if the expected number in any one of the cells is < 5, Fisher’s exact test was used.) P value < 0.05 was considered statistically significant. IBM SPSS version 22 was used for statistical analysis.12 Result: During the study period, 967 consecutive patients of ischemic stroke were enrolled in the registry, and among them, 164 (16.8%) were young strokes The incidence of young ischaemic stroke differs considerably worldwide and is generally higher in developing countries than in industrialized countries. Published incidence of young stroke varies from 5 to 15 per 100000 person-years in many European studies to 20 per 100000 person-years in most Northern-American, Australian and Asian studies and up to 40 per 100000 person-years in some African countries and Iran.13 In India, the population based studies in north india, south India and north eastern India show 3 to 11% of strokes in those less than 40 years of age as seen in western countries.8, 14-16 However, nearly one-fifth of patients with first-ever strokes admitted to hospitals are aged <40 years.17 The reason for relatively less prevalence of young stroke in population based studies could be due to the lower cut-off of young stroke at 40 years, as the stroke incidence rises sharply after this age, as shown in this study and also demonstrated in a previous study from south India.19 Another reason could be the inclusion of all strokes below 40 including pediatric strokes in the population based studies, which could potentially dilute the prevalence of stroke in young adults. The reason for relatively high prevalence of young strokes in hospital-based studies could also be partly due to referral bias of hospitalization.20 However, the exact incidence and prevalence of stroke in young adults remains a knowledge gap as data on incidence are lacking from many parts of India. Further, methodological differences hindering proper comparisons of published incidences of acute ischemic stroke, include the heterogeneity in the definition of young stroke, the used age limits and the inclusion of other stroke subtypes. Based on our studies we made the following observations Gender The male to female ratio in our study is 7:3 [Table 2], which is higher than reported in western studies.21-23 Previous north Indian study from Delhi has shown even higher male predominance.24 The male predominance may be due to higher exposure of males to alcohol and smoking and also may be in part attributable to a socio-cultural bias in India, which manifests as males being more likely to seek treatment at referral centres. Hypertension The current study identified a relatively high frequency of hypertension (32.32%) in our young stroke patients with one-third of the hypertensive patients having documented LVH on 2D-Echo, but was less than observed in a previous study from north India.24 In Helsinki Young Stroke Registry hypertension was prevalent in 51.7% of patients in 45-49 year age group.25 Similarly, while hypertension was an important overall risk factor for ischemic stroke in (OR 3.14) INTERSTROKE study, a substantial risk augmentation was observed for those ≤45 years (OR, 8.53), for all strokes including ischemic and hemorrhagic strokes.26 Although the prevalence of hypertension was lower in young adults with ischemic stroke compared to older ischemic stroke patients of our study and also compared to other studies on stroke in young adults, yet hypertension was a significant risk factor for stroke in the young adult group. In the Global Burden Study, the population attributable risk (PAR) for hypertension was highest in Southeast Asia (54.8%) and lowest in Eastern and Central Europe and the Middle East (40.7%).27 Diabetes Mellitus One-fourth (25.61%) of the young stroke patients in the present study were diabetics. This is the highest prevalence of diabetes in young strokes reported so far even when compared to previous young stroke study from India (13.9%) or other countries (10%).24,25 This is due to the higher prevalence of diabetes in South India compared to the rest of India. It has been found that the population attributable risk (PAR) for diabetes mellitus in young adults is 4.8% (95% CI 2.9 to 6.7) and diabetes mellitus is associated with a higher risk of stroke (OR = 1.9; 95%CI 1.5 to 2.3).28 Findings[sk1] from our studies support the observation that modifiable risk factors previously established in older populations also account for a large part of stroke in younger adults, with 4 risk factors explaining almost 80% of stroke risk.29 Hyperlipidemia In our study, the value of total cholesterol, LDL cholesterol and triglycerides was comparable between young and elderly adults of ischemic strokes, showing that abnormal lipids has a strongest association with stroke in young adults. In fact low HDL was more common in young adults with ischemic strokes. Similar association with young strokes and hyperlipidemia was observed in the north Indian study of stroke in young adults.24 Smoking In the present study, 45 patients (27.44%) of young strokes were active smokers. In a study from northern India only 9.5% of young strokes were smokers, suggesting the increasing trend of smoking in the young, particularly, in this region. In our country smoking unfiltered tobacco in the form of bidi and tobacco chewing poses the greatest risk, especially in the low-income populations. The relation between stroke and smoking as the most important modifiable risk factor for stroke is firmly established. Cerebral infarction is 1.6 times more common in young smokers (15–45 years old) than non-smokers (30). Several studies with participants from multiple ethnicities have shown the association between smoking and early-onset ischemic stroke, with OR ranging from 1.6 to 7.7. A cumulative dose effect for smoking has been demonstrated with no significant heterogeneity between etiologic subtypes. Alcohol Abuse Almost 40% of the young strokes in the present study are habitual alcoholics consuming 200 ml of alcohol on a daily basis. In the young stroke study from North India, the prevalence of alcohol was only 9.5% in young strokes.24 The associations of long-term (31) and recent heavy drinking (32) and ischemic stroke have been demonstrated in young adults. The association of heavy drinking may also be stronger for young adults. The high prevalence of alcohol use in in our study is suggestive of increasing trend of alcohol use in young Indians in general and south India in particular. Past and family history of Stroke Almost 10% of the young strokes in the present study had a past history of stroke and 2.44% had a prior history of TIA. However, 65% of these patients were not on any treatment emphasizing the importance of education of the patients regarding secondary prevention. Almost one-fourth (23.78%) of the present study young strokes had a family history of stroke Other risk factors In our study, 7% of young strokes were having Coronary Artery Disease (CAD) and 6.7% of patients were having Chronic kidney disease (CKD) suggesting premature atherosclerosis of other target organs due to hypertension, diabetes, smoking, and alcohol abuse. Other risk factors included oral contraceptive pill (OCP) in 1, pregnancy in 1, and post partum state in 4 patients. Among 146 homocysteine tests, 38 pts are having elevated homocysteine levels. Serum homocysteine was elevated in 23.17% of the young strokes which is an important individual risk factor for cardiovascular events suggests the testing of serum homocysteine in all the stroke patients and appropriate treatment with vitamins is advocated. Stroke subtypes in younger adults In our study, significant large artery atherosclerosis (LAA) was the most prevalent stroke subtype present in 43 (26.22%) patients of which 25 patients had extracranial LAA and 18 had intracranial atherosclerotic disease (ICAD). Previous study from north Indian study from Delhi showed 14.7% of LAA, partly because intracranial large artery disease was not investigated. Stroke due to lacunes/small vessel disease (SVD) was found in 26 patients (15.24%) of all young strokes in comparison to 6.8% from north Indian study from Delhi. In our study 26 patients (15.85% of strokes) had a cardioembolic source of which Chronic Rheumatic Heart Disease was found to be the most prevalent cause with or without atrial fibrillation in 5 and 3 patients respectively. One patient with mitral stenosis without AF was detected to have large LA appendage clot while 1 patient was having clot over the mitral prosthetic valves. Other cardiac sources of embolism included left atrial myxoma in 2, severe LV dysfunction in 4, recent MI in 3, congenital heart diseases including MVP with severe MR in 2, PFO and ASD- Ostium Secundum variant in 1 each, suggesting cardiac diseases as an important risk factor for stroke in young adults. In the north Indian study from Delhi also cardioembolic strokes accounted for 14% of all ischemic strokes. In a nutshell, all young adults with ischemic strokes should undergo Cardiac evaluation, for rheumatic and congenital heart diseases. Stroke of other determined etiology This category includes some causes which are unique at this age. Out of 164 patients, 31 (18.90%) had strokes of other determined etiology. The most common of these was cerebral autosomal dominant arteriopathy with subcortical infarcts and leukoencephalopathy (CADASIL) found in 6 patients. It occurs because of a mutation in the NOTCH3 gene and is a common cause of hereditary cerebral small vessel disease in younger adults. The stroke risk in CADASIL patients begins around age 40 to 50. It may present as ischemic stroke, transient ischemic attack, or migraine with aura. The NOTCH3 gene is important for the survival of vascular smooth muscle cells (33,34,). Moya Moya disease was found in 4 patients of our young strokes. All of them had mild strokes and were referred for revascularization surgery. It can be genetic or acquired, can present in childhood, but often presents in the third and fourth decades of life. It is progressive, more common among Asians, and has been associated with Down syndrome and neurofibromatosis. Cerebral pathology develops after a cerebral blood vessel is occluded, typically at the base of the brain. Multiple tiny blood vessels develop to try to replace the blood supply, but the blood vessels are typically fragile (35). There were 4 patients of Reversible Cerebral Vasoconstriction Syndrome (RCVS) spectrum disorder patients among which 3 women were in postpartum state and 1 on immunomodulation. RCVS typically presents with a thunderclap headache and may or may not present with focal neurological findings. Peak occurrence is around 42 years of age and is more common among women. A patient may present with recurrent episodes that eventually subside, often over a period of 1 to 3 months. Triggers may include a rapid rise in blood pressure, vasoconstrictive drugs, migraines, and the postpartum state. Neurovascular imaging may show typical vasoconstriction abnormalities with multiple segmental narrowings but may appear normal in the acute phase. It can cause ischemic stroke and intracerebral hemorrhage, occurs predominantly among women, and patients may present with a combination of ischemic stroke and intracerebral hemorrhage (36). Ten patients of CNS vasculitis included primary CNS vasculitis in 3, secondary to Rheumatoid arthritis in 1, tuberculous vasculitis in 2, fungal vasculitis in 1, HIV vasculitis in 2, and APLA syndrome in 1 patient. Arterial dissections of internal carotid artery was found in 3 young stroke patients (37), all of which were spontaneous without any prior history of trauma. Other causes included Oral Contraceptive, hemiplegic migraine, Behcet’s, AML- M3 (Promyelocytic leukemia) and cocaine abuse in 1 one patient. Despite the good number of prothrombotic workups (N = 146) we are unable to diagnose a single case of protein C, protein S, anti-thrombin-III, factor V Leiden mutations. Strokes due to other determined etiology constituted 17.3% from north Indian study from Delhi.24 Stroke of Undetermined Etiology Despite extensive workup, almost one-fourth (23.78%) of the patient’s stroke etiology could not be determined. However, this figure is less than 42.5% from the previous study from North Indian study from Delhi, possibly because of extensive investigations carried out in present study. Treatment and Outcome All patients received the standard treatment of acute ischemic stroke including intravenous thrombolysis in 16 (10%) and mechanical thrombectomy in 1 patient. In our study, 58% of the males and 47% of the females in young strokes are independent during the time of discharge. The death rate is almost 10% in males and 4% in females. The above results suggest that the disability rate is very high in females and death rate is high in males and the stroke severity is less in males when compared to the females. Overall mortality in young strokes is 8.54% which is almost double of elder strokes (4.36%). Our study has shown significant disability and death inspite of the young age and the state of art treatment received by them. emphasizing the importance of education, knowing the accurate etiology, and mechanisms of stroke for further prevention as most of these patients are prime earners of the family. [sk1] Conclusion: In this observational study from a leading tertiary referral centre of southern India, young adults, 15 to 45 years of age, constituted about one fifth of hospital admissions of all ischemic strokes. Almost one third or more of patients had traditional risk factors like hypertension, diabetes, hyperlipidemia, smoking and habitual alcohol consumption as cause of stroke. Large artery atherosclerosis both intra and extracranial was the most frequent mechanism but stroke due to small artery disease and cardio-embolism due to rheumatic heart disease was seen in significant proportion. Stroke due to other etiologies unique to young adults constituted about one fifth of all strokes. The study highlights the need for community education about the stroke risk factors towards primary prevention of stroke from a young age.


Award ID: 5
Does Thrombus Imaging Characteristics Predict the Degree of Recanalisation after Endovascular Thrombectomy in Acute Ischaemic Stroke?
Harikrishnan Ramachandran, Sachin Girdhar, Sapna Erat Sreedharan, Jayadevan E R, K Santhosh Kumar, Jissa V T, Sajith Sukumaran, Sylaja P N
Neurology, Sree Chitra Tirunal Institute for Medical Sciences and Technology, Thiruvananthapuram, Kerala
E-mail: hkrmnr@sctimst.ac.in
Background and Aim: There is an emergent need of potential imaging biomarkers predicting successful recanalization following Endovascular thrombectomy (EVT), which is the mainstay of treatment in acute ischaemic stroke (AIS) with large vessel occlusion (LVO). Thrombus is the ultimate target of any reperfusion therapy in large vessel occlusion and delineation of appropriate thrombus imaging characteristics could guide a better selection of patients for EVT. Thrombus imaging features like hyperdense artery sign and thrombus length less than 8 mm are associated with a favourable recanalisation after intravenous thrombolysis (1) (2). Previous studies have shown that a shorter thrombus length, lower Clot Burden Score (CBS) and a permeable thrombus were associated with better functional outcome and a faster recanalization after mechanical thrombectomy (3) (4). EVT procedural factors like duration of the procedure, number of passes and combined aspiration for retrieval correlate with the rate of recanalization and functional outcome (5) (6). Recent data have shown contradicting evidence showing no superiority of the combined use of stent retriever and aspiration compared to stent retriever alone (7). Hence the aim of our study is to evaluate the thrombus imaging characteristics on non contrast CT brain and CT angiography and the various procedural factors and correlate with the degree of recanalization and outcome after EVT in acute ischaemic stroke. Methodology: MATERIALS AND METHODS All patients more than 18 years of age with AIS and LVO in the anterior circulation who underwent EVT within 24 hours of onset of the stroke from 2013 to 2020 were identified from our prospectively maintained EVT database. The patients who underwent a noncontrast CT brain and a CT angiogram were included in the study. Patients with images having motion artefacts and excessive calcifications were excluded. The flowchart indicating the selection process of patients is depicted in Figure 1. The data on demographics, risk factors, prior medications, admission and 24 hours National Institute of Health Stroke Scale (NIHSS) score, baseline, discharge and 3 month modified Rankin scale (mRS) score were collected. Stroke etiology was classified based on TOAST (Trial of ORG 10172 in Acute Stroke Treatment) classification. Imaging analysis: All images were analysed by a neurologist and neuroradiologist blinded to the clinical details. Noncontrast computed tomography (NCCT) thick (5 mm) and thin sections (1 mm) and computed tomography angiography (CTA) acquired before EVT were analysed. Baseline and 24 hours CT Alberta stroke programme early CT score (ASPECTS) and hyperdense MCA sign (absolute MCA attenuation value > 43 Hounsfield units and a ratio of HU in the affected to contralateral MCA > 1.2 in thin sections) were assessed from plain CT (8). Thrombus imaging characteristics (thrombus location, clot burden score, thrombus length and permeability) and collateral status (Tan grading) were assessed from CT angiogram. Thrombus location was classified as occlusions in the internal carotid artery (ICA), middle cerebral artery (proximal M1, distal M1, M2 or M3) or anterior cerebral artery (A1, A2), based on the most proximal vascular segment which is occluded. Thrombus length was measured in millimetres (mm) in MCA M1 segment from the axial CT angiogram and length ≤ 8 mm was considered as a short thrombus. Clot burden score was calculated by assigning points for the presence of thrombus on CTA within the intracranial internal carotid artery and MCA M1 and M2 branches, and anterior cerebral artery A1 segment. A CBS of 10 indicates absence of a visible large vessel occlusion (LVO), whereas a score of 0 corresponds to a complete multisegmented occlusion of anterior circulation arteries, and a score <6 was considered as poor (9). Thrombus permeability was assessed by the degree of contrast permeation through thrombus in CTA and graded as 0 (impermeable) and 1 and 2 (permeable thrombus) (10) (11). Collateral status was graded from 0 (absent collateral supply in the occluded MCA territory) to 3 (100% collateral supply of the occluded MCA territory) (12). Procedural factors: The angiographic procedural factors (onset to groin puncture and groin puncture to recanalisation time, number of passes for EVT, technique of EVT- stent retriever alone or a multimodal procedure using combination of stentriever with aspiration were analysed. Primary outcome was defined as the degree of recanalization after EVT as assessed by mTICI (modified thrombolysis in cerebral infarction) score which indicates the degree of reperfusion in the distal territory (13) (14). TICI grade 2b, 2c and 3 were taken as a good recanalization. A 3 month modified Rankin scale score (mRS) of 0-2 was considered as a good functional outcome. STATISTICAL ANALYSES The baseline clinical and demographic parameters are expressed as mean, median and interquartile range (IQR) for continuous variables and frequencies and percentages for categorical variables. The association between thrombus imaging characteristics and angiographic procedural factors with primary and secondary outcomes were analysed using Chi square test, and Odds ratio (OR) and confidence intervals were estimated using binary logistic regression models. The characteristics which showed ´p’ value ≤ 0.10 were included in the multiple logistic regression model. Hyperdense MCA sign was excluded from this analysis as it was a nonsignificant factor when considering all thrombus locations. All statistical analyses were performed using STATA/IC 14.1 (Texas USA). Result: The demographic and clinical characteristics are shown in Table 1. The mean age of 102 patients was 60.5 ± 11.8 years. About 42 (41.2%) patients were females. The median NIHSS at admission was 16 (IQR 12-20). Median CT ASPECTS at admission was 6 (IQR 5-8) and at 24 hours, 6 (IQR 4-8). Bridging intravenous thrombolysis was given to 33 (34.3%) patients before mechanical thrombectomy. Cardioembolism was the most common etiology (46.1%) and about 27.5% patients had undetermined etiology. After EVT, a good recanalisation was achieved in 84/102 (82.4%) patients and 102 (47.1%) patients attained a good 3 month functional outcome. Of the 40 patients with hyperdense MCA sign, 90% had a good recanalisation (p = 0.07) and 45% had a good functional outcome [Table 2]. The presence of a permeable thrombus predicted good recanalization (86% vs 70%, p = 0.09). None of the other thrombus imaging characteristics was associated with better recanalization. Of the angiographic procedural factors [Table 2], less than 3 passes (90% vs 62%, p = 0.001), shorter groin puncture to recanalization time of < 60 minutes (95.1% vs 63.4%, p < 0.001) and use of stent retriever alone (90.4% vs 64%, p = 0.002) was associated with good recanalization and the use of less than 3 passes predicted good functional outcome (56.2% vs 24.14%, p = 0.003). Multiple logistic regression analysis [Table 3] showed thrombus permeability (p = 0.02; OR 5.9; 95% CI 1.3-26.6), use of stent retriever alone (p = 0.02; OR 5.4; 95 5 CI 1.3-22.5) and a groin puncture to recanalization time ≤60 minutes (p = 0.008; OR 7.95; 95% CI 1.7-36.8) were independently associated with good recanalization after EVT. The requirement of more than 2 passes (p = 0.02; OR 3.4; 95% CI 1.2-9.8) was independently associated with a poor 3 month functional outcome. Conclusion: Thrombus permeability was a predictor of successful recanalization after EVT. The requirement of 3 or more passes during EVT was associated with poor recanalization and poor functional outcome.


Award ID: 6
Transcranial Doppler Screening for Patent Foramen Ovale in Cryptogenic Strokes in Young - A Single Centre Experience from South India
Deepti Bal, Atif Iqbal Ahmed Shaikh, Appaswamy Thirumal Prabhakar, Sanjith Aaron, Viji Samuel Thompson, Jesu Krupa, Murali Rayani, Arun Mathai Mani, Rohit Ninan Benjamin, Ajith Sivadasan, Vivek Mathew, Mathew Alexander
Department of Neurosciences, Christian Medical College Vellore, Tamil Nadu, India
E-mail: dr.deeptibal@gmail.com
Background and Aim: Ischemic stroke continues to remain as one of the major causes of disability and death in the Indian setting (1). Despite extensive vascular, cardiac and serological evaluations, the cause remains unknown in 20%-40% of patients (2). These are classified as cryptogenic strokes. Cryptogenic strokes are especially important in young adults (3). Cryptogenic strokes can be further classified as non-embolic and embolic stroke of undetermined source (ESUS) (4). ESUS can be due to paroxysmal atrial fibrillation, atheroembolism, cancer associated and paradoxical embolism (4). The term paradoxical embolism is used to describe an embolus of venous origin entering the systemic circulation through a patent foramen ovale (PFO), atrial septal defect (ASD), ventricular septal defect (VSD) or extracardiac communication such as pulmonary arteriovenous malformation. PFO is present in about 25% of the adult population. PFO is seen more commonly in patients with ESUS compared to the general population and is known to contribute to recurrent strokes (5). Recent studies have shown the importance of identifying the high risk PFOs and the benefits of PFO closure for secondary stroke prevention of strokes (6). These observations are supported by findings of the CLOSE and DEFENSE-PFO trials which included only high-risk PFO (7,8). Percutaneous closure of PFO in selected patients with ESUS decreases the risk of recurrent strokes (7-9). Thus, screening for PFOs in patients with cryptogenic stroke is important. The routine Trans Thoracic Echocardiography (TTE) is of limited diagnostic power in picking up PFO while Trans Esophageal Echocardiography (TEE) is considered as the golden standard. However, TEE is a semi-invasive investigation requiring significant patient cooperation and often mild sedation. Also, it is difficult to perform a Valsalva maneuver with this procedure. Transcranial Doppler (TCD) is non-invasive, simple and easy-to-perform test. It has been shown previously that TCD is superior to TEE for the detection of right to left shunt in stroke patients (10). Percutaneous PFO device closure in selected patients with high risk for paradoxical emboli is beneficial. Data on PFO closure in cryptogenic strokes in the young is limited in India (11). The aim of our study was to determine the utility of screening for Right to Left shunt using Transcranial Doppler in patients with stroke in the young and cryptogenic strokes and describe our single center experience in PFO closure in selected patients with ESUS. Methodology: This was a prospective observational study between January 2013 and December 2019, conducted in a tertiary level hospital in South India. All ischemic stroke patients between the ages of 18-45 years were included. The study was approved by the Institutional Review Board. All included patients underwent a detailed history and physical examination to look at any clues towards a possible etiology. All patients had imaging including vascular imaging with Computed Tomography Angiogram (CTA) or Magnetic Resonance Angiogram (MRA) and Carotid Doppler, TTE, hematological evaluation including vasculitis, HIV and VDRL screening. Complete thrombophilia workup was done which included genetic markers and protein assays. Fabry’s disease screening was done in selected patients. MR imaging scans were performed on a 1.5T (Magnetom Avanto, Siemens) or a 3T (Intera Achieva, Philips Medical Systems) scanner. CT scan was performed on a 64-section scanner (Discovery750 HD, GE Healthcare). Radiological images were reviewed form Picture Archiving and Communication System (PACS, GE). Lesion location and vessel involvement was noted. All included patients underwent a TCD bubble contrast study that was performed by trained stroke neurologist in the department. Transcranial Doppler Ultrasound head frame was fixed with a 2 MHz Probe (Nicolet® SONARA®. Transcranial Doppler System). The middle cerebral artery (MCA) was identified through the temporal window and continuously monitored to look for any microembolic signals (MES). Throughout the procedure, Agitated Saline (9 ml of saline and 1 ml air with few drops patient’s blood mixed 20 times using a three-way stopcock) was injected through an 18-gauge needle inserted into the antecubital vein. For all patients a total of 4 injections were done, two each in the supine and sitting (45 degrees incline) positions the first without and the next with Valsalva maneuver (VM) which was done 4 seconds after the saline injection. Any MES noted was graded according to the Spencer’s Logarithmic Scale (Grade 0: No MES., Grade 1: MES count 1-10., Grade 2: MES count 11-30., Grade 3: MES count 31-100., Grade 4: MES count 101-300., Grade 5: MES count more than 300) (12,13). After extensive evaluation the stroke neurologist categorized the patients as those with established etiology of stroke in the young, cryptogenic stroke and ESUS. ESUS was defines as a non-lacunar infarct (subcortical infarct ≤1.5 cms on CT or ≤2.0 cms on MRI) in the absence the following: extracranial or intracranial atherosclerosis causing >50% luminal stenosis in the artery supplying the ischemic region, major cardioembolic sources [permanent or paroxysmal atrial fibrillation (AF), sustained atrial flutter, intracardiac thrombus, prosthetic cardiac valve, atrial myxoma or other cardiac tumors, mitral stenosis, myocardial infarction within the past 4 weeks, left ventricular (LV) ejection fraction <30%, valvular vegetation’s or infective endocarditis], and no other specific cause of stroke (e.g., dissection, arteritis, migraine/vasospasm, drug misuse)(4). Those patients who were diagnosed to have ESUS and found to have TCD bubble study positive were referred for TEE. The TEE was performed by a trained cardiologist who was a part of the Cardio-Neuro team. The patients who were diagnosed to have a PFO were seen by the stroke neurologist and the interventional cardiologist. The RoPE score and AF RoPE score were calculated for those who had a PFO. The decision of PFO closure was made after discussing with the patient/relatives the risks and benefit of the procedure taking into consideration the negative work up for stroke etiology, risk of recurrent strokes, high risk TEE parameters like ASA, PFO size and length and also presence or absence of spontaneous shunting. PFO closure was done under conscious sedation with Fentanyl and Midazolam. All patients received intravenous heparin 5000 units prior to the procedure. The access was through the femoral vein and Intracardiac Echography (ICE)/ TEE guidance was used. MP 1 (5 or 6F) and straight tip glide wire (260 cm) was used for crossing the defect. Amplatzer PFO Occluder (Abbott, Illinois, United States) (14). Patients were followed up in the Stroke clinic and Cardiology clinic (For those who underwent PFO Closure) and any further vascular events noted. Statistical analysis was done using a statistical package STATA (Stata Corp). Variables were compared using univariate analysis. All factors reaching significance were analyzed using a logistic regression model to perform a multivariate analysis. Two-tailed Fisher’s exact test was used to look for significant associations. Result: During the study period from January 2013 to December 2019, a total 7179 patients were admitted under the Neurology department. Of these, 6197 (86.32%) were ischemic strokes and 972 (13.68%) were hemorrhagic strokes. The number of patients with ischemic strokes with an age at the time stroke onset less than 45 years was 300. All the 300 patients were screened for possible paradoxical emboli with the TCD bubble contrast study. The mean age at presentation was 32 (7.2) years. Of these 225 (75%) were males. Of the included patients 283 (94.3%) had infarcts and 17 (5.7%) had Transient Ischemic Attack (TIA). Amongst the 300 patients who were screened, 121 (40.3%) of the patients were found to have a positive TCD bubble contrast study. The flow of patients recruited for the study is given in Figure 1. The characteristics of the patients with and without a positive TCD bubble study are given in Table 1. The activity at the time of stroke was documented in 105 (35%) of the patients. Patients who lifted heavy weights (p = 0.02), strained to perform a mechanically challenging work or did an activity that was equivalent to a valsalva maneuver (p= <.0.01) were likely to have a positive TCD bubble contrast study. The list of activities at the time of stroke onset is given in Table 2. ESUS was identified in 72 (24%) of patients. Based on the clinical discretion of the stroke neurologist and calculated RoPE score, these patients then underwent TEE for PFO confirmation. Of these, 65 (90.27%) patients had PFO, 4 (5.5%) were negative and 3 (4.16%) were found to have extra-cardiac shunts. Based on clinical indication and affordability, 33 (50.76%) patients underwent PFO device closure and continued on dual antiplatelet therapy. The patients with PFO who did not undergo PFO closure were continued with dual antiplatelet therapy. The clinical characteristics and morphological features of the patients who underwent PFO closure are given in Table 3. The mean RoPE score was 6.8 in the patients who underwent PFO closure and in those who were medically managed (p = 0.906). The patients who were selected for a PFO device closure had a higher AF RoPE score, a high-grade shunt on TCD bubble contrast study, had a longer length of the tunnel and had presence of an interatrial septal aneurysm (p = 0.012). 18 (27.7%) patients were managed with anticoagulation and the rest were on antiplatelet therapy. All patients were followed up for a mean duration of 13 months and the follow up period ranged from 1 month to 84 months. During the follow up period, 1 patient in the no PFO closure group and 1 patient who underwent PFO closure had recurrent ischemic stroke. One patient in the PFO closure group had pulmonary embolism and gastrointestinal bleeding. Two patients who did not undergo PFO closure developed deep venous thrombosis on follow-up. There were no statistical differences in the complications between those who had PFO closure and those that did not have PFO closure. There was no difference in the Modified Rankin Score (mRS) at follow up. Conclusion: This study demonstrates that 40% of our patients with stroke in young have a positive TCD bubble contrast study and 54% of our patients with ESUS have a PFO. This is similar to the findings from North India and other parts of the world (6,15,16). TCD bubble contrast study is known to be superior to direct imaging of the left atrium and can easily be done in the office setting. Hence, it is a simple and reliable tool in the evaluation of patients with ESUS (10). One third of all our patients with stroke in the young had vascular risk factors and one fourth of the patients had ESUS. In patients with stroke in the young, a valsalva maneuver like activity such as lifting heavy weights or straining, at the time of stroke onset was found to be associated with the presence of R-L shunt and presence of PFO. This finding has been described by Adams et al. in 1986 in their study of non-hemorrhagic strokes in the young, but since then, there has been only limited literature on it (17-20). Our study reiterates this clinical finding and emphasizes that this could be an important clinical clue for the stroke neurologist, in evaluating patients with stroke in young. As strokes in the young are a heterogeneous group, the presence of a R-L shunt or a PFO does not necessitate causality. In young patients with vascular risk factors, atherosclerosis still remains an important etiology for ischemic stroke. However, in patients with ESUS, PFO remains an important cause for ischemic strokes and recurrent strokes. Even in patients with ESUS and PFO, ischemic stroke can be due to multiple mechanisms. The most common mechanism described is by paradoxical embolism (5). Rarely, in situ thrombus formation can contribute (5). Patient selection for PFO closure is guided by the clinical history, diagnosis of ESUS, exclusion of other significant risk factors, imaging findings and clinical scores (9). In our study presence of isolated cortical infarction and posterior circulation stroke were associated with R-L shunt and PFO. Our findings are similar to those described in other studies that looked at neuro- imaging studies in ischemic strokes associated with PFO (21-22). The RoPE Score combines some of the clinical and imaging details to help identify cryptogenic strokes more likely to have a pathogenic PFO. In younger patients without vascular risk factors and cortically placed infarcts if a PFO is identified, it is likely that the PFO is the cause of the stroke. Whereas, if a PFO is identified in an older patient with a subcortical cryptogenic stroke who has vascular risk factors, it is likely that the PFO is an incidental finding and not the cause for the stroke (23). In our study there was no difference in the mean RoPE score between those who underwent PFO closure and those that did not undergo PFO closure. There are few features of a PFO and certain associated features which can make it a high risk for an ischemic stroke. Combination of Atrial septal aneurysm (ASA) and PFO has the strongest association with a higher risk of cryptogenic stroke (24). Other features which increase the possibility of the PFO to be the cause for the stroke are large-size PFO (≥2 mm in height), long-tunnel PFO (≥10 mm in length), hypermobile interatrial septum, large right-to-left shunt during Valsalva maneuver, and low-angle PFO (≤10° of PFO angle from inferior vena cava) And the presence of a prominent Eustachian valve or Chiari’s network (25). The AF-RoPE score has incorporated these high-risk features of PFO to the existing RoPE Score trying to identify patients at high risk for recurrence who may benefit with PFO Closure (26). In our study, the patients who had PFO closure had a significantly higher AF-RoPE score than those who were medically managed. During the follow up period the patients who had PFO closure had a lower incidence of recurrent strokes when compared with those that were managed medically, but this difference was not statistically significant. In conclusion, Right to left shunt is common in young adults with ischemic strokes. TCD bubble contrast study is a feasible and a non-invasive tool for screening young patients with ischemic strokes for a right to left shunt. One half of the young adult patients with ESUS have a PFO. PFO closure in selected patients based on high-risk features is a feasible option for secondary stroke prevention in cryptogenic strokes in young in India.


Award ID: 7
The Effect of Refractive Blur on the Vividness of Mental Imagery
Selvakumar S, Appaswamy Thirumal Prabhakar, Tharan Suresh, Anupama Roy, Atif Shaik, Joanne Lydia Rajkumar, Vivek Mathew
Department of Neurosciences, Christian Medical College, Vellore, Tamil Nadu, India
E-mail: selvakumar.medico@gmail.com
Background and Aim: Imagination is one of the prime higher-order cognitive functions in everyday life and visual mental imagery forms one of its key component (Pearson et al., 2011). We use visual mental imagery in our day-to-day activities to accomplish various tasks. This includes memory, learning, navigation, decision making analytical thinking, creativity and art (Keogh & Pearson, 2011; Paivio, 1969). The phenomenon of imagination or ‘seeing with the mind’ can be explained as internally generating an image (visual representation) without an external visual stimulus (S. Kosslyn, 1987). The similarities of this phenomenon to visual perception has been vastly studied over a long period by philosophers and neuroscientists leading to a debatable conclusion that both visual perception and mental imagery share common neural pathways (S. M. Kosslyn, 1994). We hypothesised that, if there is a common neural substrate for mental imagery and visual perception, a perceptual defect affecting visual perception would increase the load on the common neuronal networks, and thus may affect mental imagery. A refractive error causes impairment in the clear perception of visual representation resulting in a visual perceptual deficit. We aimed to study, whether an introduction of a refractive blur affects the vividness of the internally generated mental image. Methodology: Materials and Methods Subjects We recruited healthy volunteers after informed consent. The study was conducted in accordance with the Declaration of Helsinki. The participants had no neurological or psychiatric disorders and were blinded to the purpose of the experiment. The eyesight of every subject was examined at a tertiary care ophthalmology unit. The subjects were examined for visual acuity; a certified ophthalmologist assessed refraction, visual field, retinal examination and colour vision. Based on the ophthalmology results, the subjects were divided into two groups – Ametropes (subjects with refractive error) and Emmetropes (subjects without refractive error –normal vision) similar to the study by Palmero et al. (Palermo et al., 2013). Verbaliser-Visualiser Questionnaire (VVQ) Verbalizer-Visualizer Questionnaire (VVQ) is a self-administered questionnaire consisting of 15 true-false items (Antonietti & Giorgetti, 1998). After the eyesight examination, the subjects were asked to fill the Verbaliser-Visualiser Questionnaire (VVQ). The VVQ assessed the subjects’ mental imagery function for various modalities like form, colour, shape, detail and spatial orientation. A score of 5 corresponded to a clear and vivid mental image, and a score of 0 corresponding to a very unclear/blurred image or an unimaginable scenario. The total score of the VVQ was calculated. Introduction of refractive blur Immediately after the scoring was completed, the subjects were asked to perform a mental imagery task with and without refractory blur. The participants were asked to generate amental image of a specific object initially with eyes closed, eyes open and then with refractive blur in random order and then to judge the vividness of his mental image on a Likert scale ranging from 1 (low vividness) to 5 (good vividness). The EM participant had to wear a + 2D spectacles to produce refractive blur. A time interval of 30 seconds to 1 minute was given between the trials. Apple, elephant, a red rose, and a house were some of the specific objects that the subjects had to imagine for the mental imagery task. Figure 1 shows the graphical representation of the methodology with eyes open, eyes closed and with refractive blur. The participants were comfortably seated in a well-lit and quiet room for filling up the VVQ with no time restrictions. The Imagery tasks were also performed in a similar room setting, allowing enough time for the subject to visualize in detail. Result: A total of 162 participants were recruited to the study. Of these 73 were EM and 89 were AM. Of the AM, 30 had additional astigmatism. The characteristics of the enrolled subjects is given in Table 1. The mean VVQ score was 64.9 (11.2), 66.3 (9.1) in EM and 62.5 (14.3) in AM. The mean refractory error amongst the AM was 1.8 (1.3) D. Following the mental imagery task, at baseline with eyes closed, 138 (85.5%) subjects had vivid mental imagery close to visual perception (Likert scale: 5). With the opening of the eyes the vividness of the image dropped by at least 1 point in the Likert scale in 139 (85.8%). With refractive blur, 153 (94.4%) subjects had a drop in vividness of the image by at least 1 point and 22 (13.6%) subjects by at 2 points [Figure 2]. The mean drop of the vividness with the introduction of refractive blur was 1.9 (95% CI 1.8 – 2.0). The summary of results is given in Table 2. Kruskal Wallis test was performed on the data with the three conditions (Condition1: Mental imagery task with eyes open, Condition2: Mental imagery task with eyes closed and Condition3: Mental imagery task with refractive blur) as factors. The Kruskal-Wallis rank sum test showed a significant difference between the groups and effect size was calculated using epsilon squared (Kruskal-Wallis Chi-squared = 394.21, df = 2, p-value <0.0001, Ƹ2 = 0.813). Dunn Post-hoc test for multiple comparisons after Bonferroni correction showed significant differences between all three conditions with maximum significance between the eyes closed and refractive blur condition (Z = 9.769, adj-p < 0.001). Discussion Mental imagery is conceived of as a type of top-down perception that functions like a weak form of perception (Lee et al., 2012). Behavioural data and functional brain imaging suggest that common sets of neural structures are employed during both processes (Pearson et al., 2011). Like visual perception, mental imagery seems to involve visual areas that are organized topographically (Kaas et al., 2010). The neural representation of mental imagery significantly overlaps with visual working memory and visual attention (Albers et al., 2013; Moriya, 2018). It has been previously demonstrated that visual working memory is limited both by visual information load and by the number of objects (Alvarez & Cavanagh, 2004). Behavioural data suggest that domains such as attention, recognition, and memory have capacity-limited buffers that can be viewed as competing map architectures (Franconeri et al., 2013). In this context, we postulated that if visual perception and mental imagery shared a common but limited neural substrate, introduction of a transient refractive blur should increase the information load and thus adversely affect the quality of the on-going mental imagery process. Vividness, that was used to assess the quality of mental imagery is defined as a construct expressing the self-rated degree of richness, amount of detail, and clarity of a mental image, as compared to the experience of actual seeing (D’Angiulli & Reeves, 2007). Vividness though a subjective measure, correlates with objectively quantifiable f-MRI activity in the visual cortex (Cui et al., 2007). Our results demonstrate that vividness of mental imagery was highest in the eye closed condition and dropped significantly with eyes open condition and further more after the introduction of refractive blur. This corroborates with our hypothesis that visual mental imagery and visual perception share a capacity- limited common neural substrate. Our results also show that the vividness of mental imagery as measured by the VVQ scores was higher in the EM as compared with the AM. This is similar to the results of Palermo et al. and demonstrates that peripheral visual defects can affect mental imagery (Palermo et al., 2013). Our results correlate with the common experience of difficulty in imagining while multitasking. This could be explained by stating that generating mental images requires attention, and divided or fragmented attention would cause difficulty in generating mental images as a whole (Pearson et al., 2015). Mental imagery is a proven method to enhance neuro-rehabilitation, and mental imagery techniques have known to minimize the recovery period. Our results suggest that correction of peripheral visual defects including refractive errors may help in improving mental imagery in the context of rehabilitation (Evans et al., 2006). The limitations of our study included the use of VVQ, which may not be a pure measure of vividness of mental imagery (Antonietti & Giorgetti, 1998) and using only subjective behavioural data, without any f-MRI or electrophysiological correlates. Conclusion: In conclusion, our results show that when a refractive blur is introduced, the vividness of the internally generated image drops significantly thus supporting the hypothesis that visual perception and mental imagery share a common neural substrate.


Award ID: 8
Clinical, Laboratory and Radiological Correlates of Xpert MTB/ RIF Assay Study in Cerebrospinal Fluid in CNS Tuberculosis
Ruchika Tandon, Pratheesh Anand R, Sanjeev Jha
Neurology, SGPGIMS, Lucknow, Uttar Pradesh, India
E-mail: rtlib161080@gmail.com
Background and Aim: Introduction Around one-third of world’s population has latent tuberculosis (TB)[1] and worldwide, tuberculosis is the ninth leading cause of death.[2] In 2017, approximately 10 million people developed tuberculosis and there were around 1.57 million deaths due to tuberculosis.[3] Approximately 1% of all cases of tuberculosis involve central nervous system (CNS).[4] There are three main varieties of CNS tuberculosis: subacute or chronic tubercular meningitis (TBM), intracranial tuberculoma and spinal arachnoiditis and commonest is TBM.[5, 6] Incidence of pulmonary TB has decreased, however, number ofTBM cases and mortality is high.[2, 7] Drug resistant TB is also major concern. According to World Health Organization (WHO), 3.6% and 18% of new and previously treated TB cases respectively, are rifampicin-resistant (RR) or multidrug-resistant (MDR) (resistance to at least bothisoniazid and rifampicin)..[3] Hence, it is essential to detect infection by drug resistant organisms early in disease course. Early diagnosis of tuberculosis including TBMis essential for treatment of individuals as well as for preventing community spread.[5, 8] Clinicians diagnoseTBM by performing CSF routine studies, smear and culture, combined with CSF polymerase chain reaction (PCR) or nucleic acid amplification test (NAAT). CT and MRI head can diagnose complicationsand monitorthe clinical course of the disease.[5, 9] Xpert MTB/RIF assay (Gene Xpert) is nucleic acid amplification test which also detects rifampicin resistance. In 2014, World Health Organization recommended use of CSF XpertMTB/ RIF assay (NAAT) in preference to conventional microscopy and culture for initial diagnosis of CNS tuberculosis, if sample volume is low or if it is not feasible to get additional specimens for quick diagnosis.[10] CSF Xpert MTB/RIF assayis an initial test for TBM diagnosis in places where Xpert Ultra assay is not available.[11] However, sensitivity of Xpert MTB/RIF assay may be as low as 50-60%.[12] There is paucity of studies regarding factors which influence CSF GeneXpert/ MTB test. Therefore, our aim was to assess the relationship, if any, between the clinical, laboratory and radiological parameters of CNS tuberculosis patients and the Gene Xpert study in CSF in such patients. Methodology: Methods For this study, we selected cases admitted to our institute from 2019 to 2020 and this study is an observational, analytical study approved by the institutional ethical committee. Inclusion criteria We have added cases diagnosed as CNS tuberculosis by clinical, radiological and laboratory parameters and which satisfiedcriteria described below: - Case definition [13] Clinical entry criteria Symptoms and signs of meningitis include one or more of: headache, irritability, vomiting, fever, neckstiffness, convulsions, focal neurological deficits, altered consciousness, or lethargy and the cases are either definite, probable or possibleTBM, using criteria mentioned in Table 1. But, we did not include Gene Xpert inthe case definition. Exclusion criteria In this study, exclusion criteria comprise of people who did not give consent for the study. Sample size An estimated 2.69 million cases reside in our country and 20% of these are from our state, which counts to a total of 538000 cases.[14] Hence, if we take a confidence interval of 95%, margin of error of 7% and population proportion of 50%, we would get a sample size of 196. Therefore, we included 200 patients in the study. Evaluation For evaluation, we took a detailed history, didexamination and collected data via proforma. Patient’s history included onset and duration of symptoms, duration of anti-tubercular treatment (ATT) taken before Xpert MTB /RIF assay, compliance to treatment, history of seizures or loss of consciousness and symptoms pertaining to other systems. On clinical examination, main findings noted were signs of tuberculosis in other systems, Glasgow coma scale for assessing sensorium, presence of papilledema, muscle tone, deep tendon reflexes, focal weakness, neck stiffness and stagingof meningitis. [5, 15] Investigations All the patients underwent investigations like blood counts, renal functions, liver functions, coagulation profile and X-ray chest. We also considered Ultrasound abdomen and CT chest in relevant cases. At our institute, the radiologists helped in noting basal exudates, acute/ chronic infarcts, hydrocephalus and the number of tuberculomas and for this purpose, our cranial MRI used a 3T scanner (Signa, GE medical system, Wisconsin USA. Then, the researchers marked individuals with less than 3 tuberculomas as category 1, those with 3 to 6 tuberculomas as category 2 and those with more than 6 tuberculomas as category 3. Along with routine CSF cytology, the authors also performed biochemical analysis, mycology, bacteriology and mycobacteriology studies of the CSF. Amongst mycobacteriology studies, we subjected samples to microscopy, Gene Xpert/MTB Assay as well as culture Xpert. Statistics The authors analyzed data using SPSS version 20. In history, authors correlated duration of symptoms, duration of prior ATT andpatient’s age with CSF-Gene Xpert/ MTB reports. On examination, we correlated parameters like presence of raised intracranial pressure, neck stiffness, focal weakness, stage of TBM (BMRC staging) and the presence of dissemination of tuberculosis with CSF-Gene Xpert/ MTB. In laboratory parameters, the authors correlated CSF protein, sugar, total count and lymphocytic predominance with CSF-Gene Xpert/ MTB reports. In radiology, we correlated basal exudates, hydrocephalus, brain infarct, acute infarct and tuberculomas with CSF-Gene Xpert/ MTB. Also, we evaluated predictors of outcome using univariate binary logistic regression method via SPSS 20 and considered a P-value of < 0.05 to be significant. Result: Results Among 200 cases (aged from 2-72 years, mean = 33.3 ± 15.608 years, median = 30 years), who satisfied the inclusion criteria, 75 cases were CSF Gene Xpert/MTB positive (8 were rifampicin resistant) and 125 patients were negative, which are 37.5% and 62.5% ofthe total cases respectively. In positive cases, median age was 24 years and in negative group, it was 36 years. Of all patients, 118 (59%) were female. In the positive group, 43 (57.3%) were female and in the negative group, 75 (60%) were women. Table 2 depicts various clinical, CSF and radiological parameters of all the patients, patients who were Gene Xpert/MTB positive and those who were Gene Xpert/MTB negative. Median total CSF cell count was 100 and mean was 193.04 ± 350.93. The positive group had a median CSF cell count of 120, while the negative group had a median CSF cell count of 56. A median of 90% of all cells were lymphocytes. In the positive group, a median of 80% of all cells were lymphocytes, while in the negative group, amedian of 98% of all cells were lymphocytes. Although, the median CSF protein was 122 mg/dl, and it was 122 mg/dl in the Gene Xpert/MTB positive group, it was only 114 mg/dl in the negative group. The patients had a median CSF glucose of 45 mg/dl. Also, the median CSF sugar was 34 mg/dl in the Gene Xpertpositive group, while it was 52 mg/dl in the Gene Xpert negative group. Here, Figure 1 depicts the MRI images of patients having basal infarcts, tuberculomas and acute infarcts. Table 2 also mentions the P-values of the correlationof CSF-GeneXpert/MTB with various clinical, radiological and CSF parameters. Among these parameters, duration of illness, BCG vaccination, significant weight loss or failure to thrive, history of abdominal tuberculosis or radiological evidence of abdominal tuberculosis, loss of consciousness or seizure, signs of meningeal irritation, stage III of TBM, evidence of dissemination, number of cases with CSF lymphocytic predominance (>50% of total cell count), number of cases with low CSF glucose, basal exudatesand hydrocephalus correlated withpositive Gene Xpert/ MTB results. In a patient in whom first CSF-Gene Xpert was positive, the CSF findings were as follows: - Total cells were 270 (lymphocytes were 60%), protein was 112 mg/dl and sugar was 41 mg/dl. When we repeated the study after 4 months, in the same patient, Gene Xpert was negative and the other parameters were: total count <5 (lymphocyteswere 100%, protein was 60 mg/dl and sugar was 27 mg/dl. The clinicians here, found a sensitivity of 80% and a specificity of 74.84% against culture and a sensitivity of 37.5% against case definition. Conclusion: Discussion In clinical parameters, median age inGene Xpert/ MTB positive group was significantly lower than in the negative group (P < 0.001). According to a previous study employing CSF culture, higher the age of patient, lesser is the chance of getting positive CSF cultures, like in our study,[16] although another study did not corroborate these findings.[17] Sex ratio of both the groups was comparable in our study (P = 0.713) in contrast to an earlier observation of male sex being associated with a greater chance of positive Gene Xpert.[15, 17] Median duration of disease was higher in the positive group than in the negative group. We already know that greater the duration of illness, more are the chances of microbiological confirmation of disease.[17] On clinical examination, presence of meningeal signs, severe stage of TBM (stage III) andthe evidence of disseminated tuberculosis were around two to three times more in the positive group, than in the negative group and this was also according to the expectations that as the disease progresses, the chances of getting a positive result on Gene Xpert increase owing to a higher load of microorganisms in severe illness. However, few earlier studies had shown lesser chances of detection of bacteria in the CSF in people with stage III disease rather than those with stage I disease [16, 18] and another study did not demonstrate any significant association between stage of disease and microbiological confirmation of the disease.[17] The presence of raised ICT and focal weakness was, however, comparable in both the groups, proving thereby that factors other than the number of bacilli might be responsible for raised ICT and focal weakness. We could not find any previous study correlating meningeal signs, disseminated disease or raised ICT with Xpert/ MTB positivity. On regression analysis, thestage of TBM (P < 0.001) was statistically significant. Hence, the presence of bacilli or the positivity on Gene Xpert may be more in those at a later stage of the disease as expected due to more bacilli causing more damage/ disease and the greater duration of treatment, more would be the chances of bacteria dying due to treatment resulting in a lesser chance of their being detected in the test. This result is pertinent in prognosticating the response to treatment as prognosis for treated TBM is better if physicians start the treatment at an early stage.[5] In other words, Gene Xpert can be useful in prognosticating the response to treatment. The presence of features of raised ICT did not correlate with the results and probably many other pathophysiological processes may be affecting these clinical signs rather than only the number of bacteria or Gene Xpert positivity. In a similar study, in a larger sample, age, male sex, GCS, stage of TBM did significantly correlate with CSF Xpert MTB /RIF assay.[15] We already know that the duration of prior antitubercular treatment decreases the detection of bacilli via Xpert MTB/ RIF assay due to decrease in the number of bacilli.[17] We also observed this trend but the results were not significant. Among the radiological parameters, basal exudates, hydrocephalus, tuberculomas and infarcts were more in Gene Xpert positive group than in the negative group. This may be because these patients have an active disease and hence, positive Gene Xpert tests. However, only the presence of basal exudates and hydrocephalus correlated significantly with positive Gene Xpert levels, here. So, factors other than number of bacilli may contribute to the formation of tuberculomas in the brain. A previously published study, though, showed a significant association between CSF Gene Xpert and the presence of hydrocephalus, tuberculoma brain or basal exudates on imaging, in children.[19] Among CSF parameters, as expected, >90%positive cases had elevated total cells but only around three-fourth negative cases had increased total CSF cells. Also, all positive cases had lymphocytic predominance while in negative group only three fourth had lymphocytic predominance. Very high number of patients, in both the groups had high CSF protein levels, as expected, but positive group had a higher median level than the negative group. In our patients, a low CSF sugar was more in the positive group than in the negative group. CSF parameters like high counts, high proteins and decreased glucose levels in the CSF may indicate severe illness and may be the reason for giving more positive reports. But amongCSF parameters, only lymphocytic predominance and decreased CSF glucose correlated with positive MTB/RIF assay. In a previous study, all the parameters in CSF like total cells, lymphocyte counts, sugar levels and protein levels did correlate significantly with CSF Xpert MTB /RIF assay[15] and in another study, low CSF sugar levels and high CSF protein levels correlated significantly with positive Xpert MTB /RIF.[17] A published study showed a significant association between CSF Gene Xpert and CSF lymphocytic predominance (>50% of total CSF cells) and between CSF Gene Xpert and elevated CSF protein levels (>100 mg/dl), in children.[19] Higher the CSF glucose levels, lesser are thepositive CSF bacteria detection rates.[16] In other studies, the presence of HIV co-infection, high spinal fluid protein concentration and greater CSF neutrophil percentage (marking acute phase), probably due to higher bacteremia, did correlate with CSF culture positivity.[20, 21] A study using Metagenomic Next-Generation Sequencing for the diagnosis of TBM found high CSF cell count and high CSF protein levels to be correlating with a higher positive test result.[22] The greater duration of disease, higher neutrophil percentage and low CSF glucose levels have a greater AFB detection rate via smear or culture, according to another study.[23] None of our patients was HIV positive. In our study, however, Gene Xpert positive group had higher CSF lymphocytic predominance. Though not an aim of this study, nevertheless the correlation of different clinical and lab parameters with CSF culture Xpert also yielded results similar to those of CSF Gene Xpert. We found a sensitivity of 80% and a specificity of 74.84% against culture and a sensitivity of 37.5% against case definition. [12, 16, 19, 24-28}, [29 ] Hence, this is quite in accordance with the previous reported literature. In our study, duration of illness, weight loss or failure to thrive, loss of consciousness or seizure, signs of meningeal irritation, stage III of TBM, evidence of dissemination, basal exudates, hydrocephalus, CSF lymphocytic predominance and reduced CSF glucose correlated significantly with Xpert MTB/ RIF, proving thereby that Xpert MTB/ RIF might be more useful in later stages of the disease and in more severely affected individuals. Further studies in larger sample may reveal new significant findings. Due to critical nature of illness in TBM, often we were not able to ensure large volumes of CSF/ repeat CSF studies which might have affected sensitivity of results. In case of radiological parameters, we were not able to quantitate the parameters evaluated. A dedicated study for radiological parameters may improve the results. In Gene Xpert positive cases, ideally repeat evaluation of all parameters could have revealed better correlation. But financial constraintsand invasive nature of CSF study prevented the plan. Also, we did not compare Gene Xpert with sputum Xpert or with Gene Xpert Ultra. Declarations of interest: none Funding: This research did not receive any specific grant from funding agencies in the public, commercial, or not-for-profit sectors. Table 1 Diagnostic criteria for definite, probable, possible and not-tubercular meningitis Clinical criteria Diagnostic score (maximum = 6) Symptom duration of more than 5 days 4 Systemic symptoms suggestive of tuberculosis (one or more of the following): weight loss (or poor weight gain in children), night sweats, or persistent cough for more than 2 weeks 2 History of recent (within past year) close contact with an individual with pulmonary tuberculosis or a positive TST or IGRA (only in children <10 years of age) 2 Focal neurological deficit (excluding cranial nerve palsies) 1 Cranial nerve palsy 1 CSF criteria Diagnostic score (maximum = 4) Clear appearance 1 Cells: 10–500 per µl 1 Lymphocytic predominance (>50%) 1 Protein concentration greater than 1 g/L 1 Cerebral imaging criteria Diagnostic score (maximum = 6) Hydrocephalus 1 Basal meningeal enhancement 2 Tuberculoma 2 Infarct 2 Evidence of tuberculosis elsewhere Diagnostic score (maximum = 4) Chest radiograph suggestive of active tuberculosis: signs of tuberculosis = 2; miliary tuberculosis = 4 2/4 CT/ MRI/ ultrasound evidence for tuberculosis outside the CNS 2 AFB identified or Mycobacterium tuberculosis cultured from another source—ie, sputum, lymph node, gastric washing, urine, blood culture 4 Positive commercial M tuberculosis NAAT from extra-neural specimen 4 Exclusion of alternative diagnoses An alternative diagnosis must be confirmed microbiologically (by stain, culture or NAAT when appropriate), serologically (like syphilis), or histopathologically (like lymphoma). The list of alternative diagnoses that should be considered, dependent upon age, immune status, and geographical region, include: pyogenic bacterial meningitis, cryptococcal meningitis, syphilitic meningitis, viral meningo-encephalitis, cerebral malaria, parasitic or eosinophilic meningitis (Angiostrongyluscantonesis, Gnathostomaspinigerum, toxocariasis, cysticercosis), cerebral toxoplasmosis and bacterial brain abscess (space-occupying lesion on cerebral imaging) and malignancy (like lymphoma). TST = tuberculin skin test. IGRA = interferon-gamma release assay. NAAT = nucleic acid amplifi cation test. AFB = acid-fast bacilli. The individual points for each criterion (one, two, or four points) were determined by consensus and by considering their quantified diagnostic value as defined in studies. Tubercular meningitis classification Definite tubercular meningitis Patients should fulfill criterion A or B: A) Clinical entry criteria plus one or more of the following: acid-fast bacilli seen in the CSF; Mycobacterium tuberculosis cultured from the CSF B) Acid-fast bacilli seen in the context of histological changes consistent with tuberculosis in the brain or spinal cord with suggestive symptoms or signs and CSF changes, or visible meningitis (on autopsy). Probable tubercular meningitis Clinical entry criteria plus a score of 10 or more points (when cerebral imaging is not available) or 12 or more points (when cerebral imaging is available) along with exclusion of alternative diagnoses. CSF or cerebral imaging criteria should comprise at least two points. Possible tubercular meningitis Clinical entry criteria plus a total diagnostic score of 6–9 points (when cerebral imaging is not available) or 6–11 points (when cerebral imaging is available) along with exclusion of alternative diagnoses. One cannot diagnose or exclude possible tuberculosis without doing a lumbar puncture or cerebral imaging. Not tubercular meningitis Alternative diagnosis can be established, without a definitive diagnosis of tubercular meningitis or other convincing signs of dual disease Table 2 Clinical and laboratory parameters of patients of tubercular meningitis and correlation of these parameters with CSF Gene Xpert/MTB and culture positivity Parameter All patients Xpert MTB/ RIF Assay positive Xpert MTB/ RIF Assay negative P-values of correlation of different parameters with the Gene Xpert/ MTB positivity P-values of correlation of different parameters with culture Xpertpositivity Clinical Mean and median duration of illness 211.72 ± 361.76 days, 90 days 221 ± 509.89 days, 60 days 206.16 ± 234.07 days, 150 days 0.017 0.383 Meanand median duration of ATT taken before the study 46.17 ± 119.28 days, 0 day 12.81 ± 24.76 days, 0 day 66.18 ± 146.26 days, 0 day 0.159 0.682 History of close contact with tuberculosis patient 23 (11.5%) 9 (12%) 14 (11.2%) 0.230 0.239 BCG vaccination covered 93 (46.5%) 28 (37.3%) 65 (52%) 0.034 0.606 Significant weight loss or failure to thrive (children) 117 (58.3%) 51 (68%) 66 (52.8%) <0.001 0.037 Poor compliance with treatment in the past or no treatment 137 (68.5%) 31 (41.3%) 86 (68.8%) 0.372 0.110 Lymphadenopathy 17 (8.5%) 4 (5.3%) 13 (10.4%) 0.452 0.004 History of pulmonary tuberculosis or radiological evidence of pulmonary tuberculosis 29 (14.5%) 14 (18.7%) 15 (12%) 0.543 0.556 History of abdominal tuberculosis or radiological evidence of abdominal tuberculosis 3 (1.5%) 3 (4%) 0 (0%) 0.045 0.421 Loss of consciousness or seizure 127 (63.5%) 58 (77.3%) 69 (55.2%) 0.001 0.264 Features of raised intracranial tension 66 (33%) 28 (37.3%) 38 (30.4%) 0.828 0.554 Focal weakness 49 (24.5%) 20 (26.7%) 29 (23.2%) 0.985 0.495 Signs of meningeal irritation 116 (58%) 58 (76%) 59 (47.2%) 0.027 0.059 Stage III of TBM 79 (39.5%) 52 (69.3%) 27 (21.6%) <0.001 0.678 Evidence of dissemination 70 (35%) 36 (48%) 34 (27.2%) 0.003 0.009 Blood tests Low hemoglobin 125 (62.5%) 53 (70.7%) 72 (57.6%) 0.678 0.527 Leucocytosis 95 (47.5%) 24 (32%) 71 (56.8%) <0.001 0.020 Low albumin 48 (24%) 17 (22.7%) 31 (24.8%) 0.953 0.836 Raised SGPT 62 (31%) 26 (34.7%) 36 (28.8%) 0.972 0.410 CSF Number of cases with high total cell counts (>5 cells/cumm) 166 (83%) 70 (93.3%) 96 (76.8%) 0.143 0.034 Number of cases with CSF lymphocytic predominance (>50% of total cell count) 170 (85%) 75 (100%) 95 (76%) <0.001 0.012 Number of cases with elevated CSF protein level 192 (96%) 75 (100%) 117 (93.6%) 0.074 0.350 Number of cases with low CSF glucose 125 (62.5%) 59 (78.7%) 66 (52.8%) 0.011 0.400 Radiological Basal exudates 93 (46.5%) 52 (69.3%) 55 (44%) 0.004 0.010 Infarcts 94 (47%) 34 (45.3%) 24 (19.2%) 0.469 0.028 Acute infarcts 58 (29%) 41 (54.7%) 53 (42.4%) 0.087 0.677 Hydrocephalus 69 (34.5%) 22 (29.3%) 47 (37.6%) 0.018 0.527 Tuberculomas 114 (57%) 49 (65.3%) 65 (52%) 0.252 0.029 Greater number of tuberculomas 45 (22.5%) 27 (36%) 18 (44.4%) 0.153 0.205 Declaration of conflict of interest: None of the authors have conflict of interests to declare.

Award ID: 9
Blood-CSF-Barrier Permeability in Tuberculous Meningitis and its Association with Clinical, MRI and Inflammatory Cytokines
Ruchi Shukla, Jayantee Kalita, Rudrashish Haldar, Usha K. Misra
Neurology, SGPGI, Lucknow, India
E-mail: shuklaruchi738@gmail.com
Background and Aim: Tuberculosis is an ancient disease widespread in developing countries including India where TB is associated with high morbidity and mortality (1). Implementation of directly observed therapy short (DOTS) course was a breakthrough in the management of TB and the introduction of Fixed Drug Combinations (FDCs) for the anti-tubercular treatment (ATT) has been proven to be the boon to the society (2). It includes combination of Isoniazid (H), Rifampicin (R), Pyrazinamide (Z) and Ethambutol (E) with dosage 75 mg/day, 150 mg/day, 275 mg/day, and 400 mg/day of HRZE respectively (2). Ocular toxicity is a well-known adverse effect of ethambutol and it has potential of causing irreversible visual loss (3). As ethambutol has been prescribed for longer time (in some cases > 8 months), the incidence of Ethambutol- induced Optic neuropathy (EtON) is expected to rise (3). The situation is worse when the patients develop apparent visual loss (4). Often axonal loss occurs leaving the fundus pale/ chalky white is observed mainly at the temporal side of optic disc. While mitochondrial damage is thought to be one of the casual theories of EtON, the damage may be precipitated by the excessive use of tobacco, alcohol or other medications (5). Even Isoniazid has been noted to worsen the visual loss associated with ethambutol. Moreso, wider implications need to be recognized because only limited treatment options are available for patients who develop EtON. Often EtON is considered irreversible and is believed to have no specific treatment except the discontinuation of drug (6). The role of high dose vitamins and anti-oxidants are available in literature with some improvement in ocular functions but their role remains dubious (7), (8), (9). The literature is devoid of studies showing the usage of steroids in patients with EtON. We believe that inflammation has a major role in initial stages of EtON and hence potent anti-inflammatory properties of steroids may help in salvaging vision in patients of EtON. We aim to evaluate the role of high dose pulse mehlyprednisolone (IVMP) in EtON patients. Methodology: This is a two-arm, double-blinded, parallel group, prospective Randomized Control Trail (RCT) [Table 1]. Patients with age more than 13 years and presenting to neurology, ophthalmology and neuro-ophthalmology out-patient department with bilateral sudden onset vision loss on anti-tubercular treatment are being recruited. Enrollment of cases was done after obtaining the written informed consent from every patient as per the declaration of Helsinki. A total of 27 patients have been recruited and randomized. Patients with secondary causes of vision loss and with probable medical conditions with contraindication to steroids such as active infection, sepsis, or any other contraindication, pregnant or lactating women and patients not consenting for the study are being excluded. All patients were subjected to detailed neurological and ophthalmologic examination including Best Corrected Visual Acuity (BCVA) using the Snellan Chart, Color Vision (CV), Visual Fields (VF) examination using automated perimetry (Zeiss, Switzerland), Fundus examination (VISUPAC), and Visual Evoked Potential (VEP) using Nicolet Viking Quest machine system. Cranial MRI Brain with T1W, T2W, FLAIR images with pre and post-contrast gadolinium-enhanced along with Optic Nerve cuts are being done. Complete blood examination including CBC, RFT, LFT, ESR, CRP, HbA1c, NMO Antibody, MOG Antibody, ana/anca and lactate levels are being done for the patients. Lumbar Puncture is being performed in left lateral decubitus position with a 22G lumbar puncture needle as a routine procedure to rule out presence of Central Nervous System (CNS) Tuberculosis (TB) and inflammation if indicated. After ruling out any contraindication to steroids, patients are being randomized using Block Randomization Method into either in intervention or comparator arm. Visual functions are being assessed every two weeks for one month and subsequently after every three months in patients. Details of the treatment (Standard Treatment and Intervention) are given in Table 2. Result: It had been observed that males in our cohort were getting more effected with EtON (59.26% (n = 16)) as compared to females (11 patients (40.74%)). The Median age (IQR) of patients (n = 27) is 37 (31, 55). Majority of the patients (48.14%) belongs to age-group 26-38 years [Table 3] The mean (SD) time difference in months between onset of symptoms to presentation in hospital was 4.35 (5.01) [Table 3]. The Median age (IQR) of patients (n = 25) is 40 (32.5,55) [Table 3]. 56% of the patients in our cohort were having extra-pulmonary TB and 11 (44%) patients were having pulmonary TB [Table 3]. It was noted that the patients taking appropriate dose of ethambutol as per the guidelines (15-20 mg/kg/day) were developing visual symptoms. Also, most of the patients were having low cumulative dose of ethambutol [Table 3] at the time of development of EtON. Diabetes Mellitus (48%) was found to be the high risk factor followed by the hypertension (29.6%) and Kidney diseases (7.4 [Table 3]. All the patients were having bilateral vision loss, with retrorbital pain in 07 (28%) patients and colour vision loss in 18 (66.66%) patients [Table 4]. 17 (70.37%) patients were having severe vision followed by moderate vision loss in 22.22% of the patients [Table 4]. Due to this, 44.44% of patients could not assess the visual fields and 10 patients were having ceco-central scotomas [Table 4]. Radiological investigation provides an insight that 40.74% of the patients were having chiasmic enhancement and 25.92% were having right and left hyperintense optic nerve [Table 4]. Follow-Up: Out of 27 patients, 26 patients are having baseline and follow-up details for one month. Eight patients are having complete follow-up of six months and two patients lost to follow-up [Table 7]. It may be noted that five patients are showing improvement in their visual acuity in whom six month follow-up has been completed. Two patients are showing no improvement and one is showing some improvement. This points us towards the positive result of study but combined comparative assessment of the entire subset and the allocation revealment will be done after the completion of recruitment and follow up of the patients. The study is still ongoing, but the observed pattern of results points us towards the positive results. Discussion: Ethambutol, one of the first-line agents against Mycobacterium tuberculosis, is a synthetic bacteriostatic agent introduced as a chemotherapeutic agent in tuberculosis in 1961 (1). It has many side effects, including hypersensitivity, hyperuricemia, peripheral neuropathy, acute interstitial nephritis and optic neuritis (10). EtON is a well-known side effect of ethambutol since it had been in use. The common form of optic neuropathy is retrobulbar neuritis which is generally reversible and is related to dose and duration of ethambutol. Clinically, EtON presents with bilateral sudden onset progressive vision loss which may be responsible for the consequent delay in management (11). Though the etiology is unknown, the disruption of oxidative phosphorylation (OXPHOS) pathway of mitochondria and retinal ganglionic cells (RGCs) apoptosis affects the central fibers of optic nerve eventually causing blurred vision, decreased visual acuity, central scotoma, and frequently, a loss of the ability to distinguish green and red. The only available treatment is to stop the drug exposure (12). We aimed to study the role of high dose IVMP because of its anti-inflammatory properties. In our study, the Mean Age in years was 37 (18-72 years) with majority of patients in the age-group of 26-38 years as compared to previous studies where Lee et al. in 2008, studied the age of affected patients ranged between 31 and 86 years (mean 58.23 ± 16.68 years)(13). In another study by Chen et al. in 2015, the mean age was 76.75 ± 7.21 years (range 59-85 years) (14). This difference in findings between the studies would likely be due to gentic and ethnic differences. Moreover, our study is being done after the introduction of new guidelines of prolonged treatment (dose and duration) of ATT. Conclusion: The current study is the first prospective randomized controlled trial highlighting the role of steroids in EtON patients. As there is no treatment available till date except the stoppage of drug, this study provides an insight into the role of streoids in treating the disease because of its anti-inflammatory property. The study is still ongoing, thus the binding is not revealed, but the pattern of results shows a positive trend in improvement in visual acuity and fields of EtON patients.


Award ID: 10
Neuropsychological and Imaging Predictors of Longitudinal Cognitive Outcomes in Persons with Mild Cognitive Impairment (MCI) AADAR-DSP Study Group
Prashanth Poulose, Ramshekhar Menon, Ravi Prasad Verma, Meenu Surendran, Gouthami Nair, Sushama SR, Rajesh PG, Bejoy Thomas, Kesavadas Chandrasekharan
Neurology, Sree Chitra Tirunal Institue of Medical Sciences, Trivandrum, Kerala, India
E-mail: prashanthpl1406@gmail.com
Background and Aim: BACKGROUND-Memory problems and changes in instrumental activities of daily living are often seen as a part of senescence rather than early symptoms of dementia. Most often these early symptoms are overlooked by the family as well as the primary physicians at first contact. There is a perceptible delay in diagnosis of mild cognitive impairment (MCI), a heterogeneous entity of varied etiologies and dementia both among families and health sector added to the other challenges like lack of resources, poor help seeking, cultural beliefs, limited education, and untreated chronic co-morbidities are barriers to early identification and interventions. There is a paucity of large scale hospital based studies on conversion rates of MCI to dementia of any subtype in India. It is not certain whether the annual conversion rates in hospital based cohorts are higher than community based cohorts in India. It is uncertain which neuropsychological measures at baseline predict conversion or progression in MCI over time. There is also no certainty whether these measures are more relevant than baseline clinical variables such as vascular risk factors, MRI measures and after correction for age which variables provide the best predictive estimates. The absence of prediction scores with regard to risk of progression or conversion in MCI, lack of sufficient data regarding the relevance of baseline structural MRI and volumetric variables in MCI to predict conversion and also relevance of subtypes of MCI in India with regard to longitudinal outcomes in terms of conversion or progression has led to this hospital based cohort study of MCI patients. AIMS-a) To determine the longitudinal cognitive trends in an MCI cohort with single and multi-domain cognitive impairment b) To ascertain the clinical, neuropsychological and qualitative imaging predictors of cognitive decline in MCI c) To estimate logistic regression based stratification of MCI based on progression and conversion risk Methodology: The study is a hospital-based cohort study to assess the clinical, neuropsychology and MRI predictors of conversion patients with MCI based on criteria detailed as under: A) Inclusion Criteria 1. MCI diagnosed as per modified Petersen’s criteria 2. Age 55-80 years at time of recruitment 3. At least one neuropsychological assessment at baseline and clinical follow up of a minimum of 2 yrs should be available at time of inclusion 4. Clinical Dementia rating -CDR <1 at time of inclusion into cohort 5. Domain specific test scores on atleast 2 neuropsychological tests should be < mean-1.5SD for age and education based cut-off norms derived previously B) Exclusion Criteria 1. Dementia diagnosis at baseline as per DSM IV criteria 2. Clinically significant anxiety, depression, bipolar disorder or psychosis 3. Major cardiovascular or medical comorbidity (malignancy, congestive heart failure, strokes, renal or hepatic failure, major traumatic brain injury) 4. MCI following strategic infarcts or autoimmune encephalitis or identified treatable causes. 5. CDR >1 at the time of inclusion into cohort 6. Lack of clinical follow up beyond two years from baseline 7. MRI Brain showing changes of early AD as per NIAA criteria5. This cohort study was designed based on the registry of patients who had a diagnosis of MCI recruited between 2010-2018 with at least one formal neuropsychological assessment in accordance with our protocol detailed previously (Menon et al.)4 and clinical follow up of a minimum of 2 yrs with MRI Brain done at baseline. Follow-up was completed based on-site evaluation at last follow up by the first author (PP), information provided by a first degree relative staying with the patient and where available review of longitudinal neuropsychological tests on follow up, after obtaining informed consent. All patients were literate in Malayalam language and were under regular follow up of the Memory& Neurobehavioral Disorders Clinic of a tertiary care hospital situated in the southern Indian city of Thiruvananthapuram, India. The recruitment of subjects for the study was done prospectively by a cognitive neurologist (RNM) who verified the clinical diagnosis at baseline and last follow up as well as the categorization into MCI and dementia subtypes. The institutional ethics committee approved the study. Subjects in whom clinical follow up was not available between 2020-21 due to the COVID-19 pandemic were contacted over phone. C) TOOLS AND OUTCOME MEASURES a) NEUROPSYCHOLOGICAL TESTS b) OUTCOME MEASURES a) Instrumental Activities of Daily Living (ADL) score b) Clinical Dementia Rating scale (CDR) c) DMS IV criteria for dementia c) IMAGING PARAMETERS (Subset analysis) 1) Qualitative (Subset analysis in patients who had structural MRI 3T scans available for review; N = 61) a) ERICA SCORE-Regional or diffuse atrophy b) FAZEKAS GRADING for small vessel disease c) Cerebral microbleed number 2) Quantitative D) SAMPLE SIZE ESTIMATION Assuming 10% of patients to have single domain non-amnestic MCI, and cumulative conversion rates to AD of 11.1% for non-amnestic MCI and 31.6% for multi-domain MCI. The sample size required to meet all statistical requirements for such a study (computed using Open Epi version 3.1) would be 396. This number may be feasible only with multi-centric studies or studies with extensive community screening and recruitment and is beyond the feasibility of the current exercise. However we anticipated a number of 95 patients who fulfil the inclusion and exclusion criteria. This number will suffice to capture predictors that have a risk ratio of approximately 6 or above and are sufficiently common in the studied population. E) STATISTICAL ANALYSIS Means were compared using unpaired t- test /ANOVA or Mann Whitney U test as appropriate; Proportions were compared using Chi Square test /Fisher’s exact Correlations of neuropsychology, imaging measures and outcome were explored using Spearman’s Rank correlation test. Variables significant on bivariate analysis were taken for multivariate analysis using the binary logistic regression (forward conditional method). Age was forced into the model even if it was not significant in the forward conditioning model and predictors were derived for convertors. An equation was generated based on the logistic model for converters and a new score was created. The validity of the derived score in classifying converters from non converters was tested using ROC analysis. Youden’s J was computed for each of the cut off values and the J Max was reported. Age adjusted repeated measure ANOVA was done for CDR and IADL comparing for conversion and progressor status between baseline and final follow up. Kaplan Meier survival analysis was done to compare survival across baseline MCI groups (single vs multidomain), CDR and based on the generated new prediction score for conversion. The log rank test was used to check statistical significance. Throughout the statistical analysis a p value of <0.05 was considered statistically significant. SPSS version 25.0 was used for this study Result: 1) BASELINE DEMOGRAPHICS Ninety five patients with MCI with mean age 68.4 ± 6.4 at baseline were followed up for a mean duration of 6.4 ± 3.15 yrs. MCI status at baseline and final follow up Cumulative conversion rate to dementia was 22.2% (21/95) and the annualised conversion rate (ACR) was 3.3% per year of follow up. The majority of subjects who had converted had multidomain MCI (66%). On follow up N (22.1%) of MCI had converted to dementia and N (27.4%) were progressors. Seven patients had expired during the follow up period of which five MCI converters expired in a state of advanced dementia, one MCI converter due to head injury and one non converter due to sudden cardiac arrest. Majority of the converters evolved into early AD (13; 72%) followed by moderate (2;11.1%) and advanced AD (3; 16.7%). Few patients in the cohort evolved into Lewy body dementia (2; 9.5%) and frontotemporal dementia (1;4.7%) The baseline neuropsychology test battery at the time of baseline entry into the study was reviewed in all patients, however 68 and 37 patients only had full second and third follow up neuropsychology tests respectively. The outcome measures CDR and IADL were available for all patients at baseline and final follow up. There were significant decline in the CDR (0.445 ± 0.157 to 0.64 ± 0.56) and IADL scores (1.88 ± 2.1 to) at last available followup. [Table 1] 4) BRAIN MRI PARAMETERS The MRI parameters could be retrieved for 61 subjects. All of the patients had undergone imaging with 3 T MRI. The mean GM score at baseline were 551.87 ± 48.53 mm3, WM scores 452.46 ± 58.4 mm3 and CSF volumetry was 500.87 ± 115.4 mm3. The mean left hippocampal, right hippocampal scores were 2.9 ± 0.76 mm3 and 3.12 ± 0.64 respectively mm3. The mean cerebral microbleed number was 2.67 ± 3.06 1) VARIABLES AMONG CONVERTERS (21) AND NON CONVERTERS (74) [Table 2] On comparison between amnestic vs multidomain MCI and dysexecutive vs multidomain MCI, there was a higher distribution of multidomain MCI among convertors. Higher FAZEKAS score at baseline was noted among converters (p < 0.05). The mean age at presentation was higher among converters. The mean duration of diagnosis and years of education were similar across groups. The neuropsychology scores at baseline which were more significantly impaired among convertors were ACE orientation, tests for memory and learning -ACE recall, RAVLT recognition, WMS visual immediate, WMS visual delayed, WMS digit forward, WMS logical memory immediate and tests of executive function Trail A errors, Trail B errors, WCST perseverative errors. The CDR and IADL scores showed significant decline across convertors. 7) Comparisons between single and multidomain MCI A non-significant trend towards a higher prevalence of positive family history of dementia and higher FAZEKA score was found among multidomain MCI. Proportion of subjects with moderate atrophy on ERICA score was found to be higher among multidomain MCI in comparison to single domain MCI and those with no atrophy on ERICA score were more prevalent among single-domain MC. The neuropsychology scores which were significant impaired in multidomain MCI groups at baseline were MMSE, ACE total, ACE orientation S, ACE language, tests for memory- ACE recall RAVLT total, RAVLT delayed recall, WMS visual immediate, WMS visual delayed, WMS logical memory immediate and test for executive function Trail A errors. The IADL scores showed significant decline among multidomain MCI however this was not noted to be significant following post-hoc Bonferroni correction (p = 0.271). The CDR scores showed no differences on last followup. Fazeka’s grading in the MRI available for review grade across MCI subgroups (amnestic, dysexecutive and multidomain) showed no statistical significances. C) CORRELATION -FAZEKA AND NEUROPSYCHOLOGY SCORES On correlation analysis between FAZEKA changes on MRI and neuropsychology variables ACE orientation, ACE recall and RAVLT delayed recall showed significant negative correlation at baseline (p value < 0.05). D) MULTIVARIATE ANALYSIS [Table 3] On binary logistic regression, the age corrected models across converters showed that lower RAVLT recognition score, WMS logical memory immediate scores and higher WCST perseverative error scores at baseline were independent predictors of MCI conversion. An equation was generated based on the logistic model for converter and a new score was created which could predict conversion from MCI during the mean duration of follow up 6.49 years CONVERSION SCORE = 0.058*AGE -0.308 (RECOG memory) - 0.123 (WMS L1) +1.137 (WCST P) 3) ROC CURVE [Figure 1] The variables derived were from Beta logarithmic form and they were converted to linear regression model. Hence the validity of the derived score was tested using the ROC Analysis and the conversion score was found to be valid with AROC 0.881 (p < 0.001). The new score was able to reliably classify converters from non converters. Predicted cut off score The Youden’s J was computed for each cut off values and the J Max wasreported. A conversion score greater than or equal to 2.6105, could predict with sensitivity of 71.4% and specificity of 98.1%, Youden’s J max 0.695 for the risk of conversion over a period of 6.4 yrs. F) KAPLAN MEIER SURVIVAL CURVE 1) SINGLE DOMAIN Vs MULTIDOMAIN MCI-SURVIVAL ANALYSIS [Table 4] [Figure 2] The Kaplan Meier survival analysis showed multidomain MCI would convert to dementia over a mean duration of 10.46 yrs (95% CI 8.261-12.666) when compared to single-domain MCI 12.45 yrs (95% CI 11.230-13.687) and the log rank test showed significant p values (p-0.003). 2) SURVIVAL ANALYSIS -CDR [Figure 3a] Subjects with higher CDR scores (>0.5) at baseline had more decline and would convert earlier to dementia than subjects with low CDR. 3) NEW SCORE BASED CUT OFF [Table 5] [Figure 3b] The Kaplan Meier survival curve for the conversion score as detailed previously with cut off above 2.615 showed conversion to dementia over 4.6 yrs (95% CI 2.909 -6.243, log rank test p < 0.001) when compared to score below 2.615 which would convert over 14.8 years (95%CI 13.671-15.939). Conclusion: CONCLUSION 1. Cumulative conversion rate of 22.2% was noted in our hospital based cohort (of patients with well characterized MCI who were diagnosed based on standard clinical and neuropsychological criteria) similar to as in other studies, however a lower estimate of annualized adjusted conversion rate to dementia of 3.3 per hundred person years was noted (as in community based cohorts). 2. Higher risk of conversion and progression is associated with multidomain MCI at baseline highlighting the importance of subclassifying MCI at baseline. 3. Intra individual change in neuropsychological test scores over time can diagnose dementia better than clinical or imaging parameters. 4. Neuropsychological tests for memory and learning such as Rey Auditory Verbal Learning Test, Wechsler Memory Scale and tests for executive functions as WCST are more specific in predicting conversion to early dementia and are the earliest to show changes. 5. CDR and IADL at baseline can potentially predict risk of progression both within and between the groups, however may not differ between MCI subtypes of amnestic, dysexecutive and multidomain. 6. FAZEKA changes at baseline correlates with decline in memory tests such as RAVLT, ACE orientation and Recall. 7. Logistic regression based estimations of dementia risk in MCI have a high specificity especially if it takes into consideration age, memory and executive domain test scores. 8. Clinical variables such as vascular risk factors among others, education status and MRI volumetric measures did not differ between convertors to dementia and non-convertors among our cohort of MCI. However the significance of white matter integrity measures which is directly linked to vascular risk factors such as hypertension, diabetes and age needs to be studied in more detail using quantified DTI as Fazeka’s score was higher among both convertors and progressors. DISCUSSION Our study is a rare-hospital based cohort study which addresses longitudinal outcomes in MCI diagnosed at a single centre using a standardized battery of neuropsychology tests followed by subsequent clinical follow-up. Notable neuropsychology and imaging differences were apparent between convertors and non convertors on baseline tests.. Despite a cumulative conversion rate of 22.2%, the low annualized conversion rate of 3.3 per 100 person years highlights the heterogeneity of an MCI diagnosis in a hospital cohort with a sizeable number of patients remaining cognitively stable. Hence over a period of follow up for 6.4 yrs in our cohort, around 19.2 patients out of hundred converted to dementia with multidomain MCI converting earlier. Our results also address the utility of a robust logistic regression based score for prediction of an earlier time point of conversion by using measures of new learning, delayed recognition memory and errors on executive function test. To our knowledge there is a paucity of similar hospital-based studies which identified MCI predictors and also looked at the longitudinal trends of evolution in MCI from the Indian subcontinent. The mean age at presentation was higher among converters and multidomain MCI. Even though in our analysis we could not find significance, anticipating a potential confounding effect due to referral bias to hospitals, it was forced into the logistic regression model and the conversion score. Our study population was from Kerala and it consisted of a highly literate population and 94.8% of cohort had more than 12 yrs of education. The mean years of education did not differ significantly between convertors and non convertors or between single and multi-domain MCI. Education status has a definite influence on most of domains of cognition and is protective against MCI conversion. This can also potentially explain our lower ACR which is similar to that of community based cohorts but significantly lower than other hospital-based cohorts. This could indicate a higher proportion of ‘worried well’ persons who have a lower propensity to disregard their cognitive issues as simple aging associated memory impairment and are referred for early diagnosis and intervention. Prior studies studies have shown significant association between vascular risk factors, metabolic syndrome, hypothyroidism with cognitive decline and dementia conversion on follow up. The major comorbidities in our cohort were hypertension, diabetes, obstructive sleep apnoea, dyslipidemia, CAD 17.9%, hypothyroidism and epilepsy. None of the comorbidities had a significant bearing on dementia conversion in our cohort as opposed to the findings of other community based cohorts. This may be because of a referral bias to our centre which deals with only cardiac and neurological illnesses and a higher health seeking behaviour leading to early risk stratification and interventions for patients with these comorbidities. Neuropsychiatric symptoms as prognostic markers for MCI conversion have been addressed by various studies and depression has been associated with increased risk of progression. The lack of association with anxiety-depression sub-scores in our study may be because we excluded patients with clinically significant anxiety, depression, psychosis and bipolar disorders. Another aspect could be of early interventions including counselling and targeted treatment The cumulative conversion rate in our cohort was 22.1% on follow up. This was almost comparable to the multiple hospital based cohorts worldwide. Our study demonstrated the relevance of memory variables, particularly new learning, encoding or retrieval measures as determined by delayed recognition score and executive function as determined by errors on set shifting to be particularly relevant. This is similar to the results of other studies and ours is the first study from Indian to demonstrate the superior relevance of neuropsychological tests after correction for age as opposed to comorbidities to be factors that estimate conversion. Logistic regression has found low RAVLT recognition, WMS immediate logical memory scores and high WCST -perseverative errors as predictors of progression. There was significant decline in the tests for memory and learning (RAVLT total, RAVLT recognition, WMS visual immediate, delayed, digit forward, WMS logical memory immediate) and tests for executive function (Trail A errors, Trial B errors, WCST P) from baseline among converters. Higher clinical dementia rating score (CDR) and IADL at baseline has been associated with a greater risk of MCI conversion as has been shown in other studies. This combination of tests of memory and executive functioning as predictors suggests that a baseline diagnosis of multi-domain MCI indicates a higher risk of conversion. Our longitudinal follow up revealed that 66.6% of the multidomain MCI converted to dementia as opposed to single-domain (amnestic-33.6% or dysexecutive-28.4% subgroups). However we did not observe a higher rate of progression in isolated amnestic MCI indicating that presence of subtle executive deficits on cognitive testing needs to be ascertained and the focus should not be restricted to the memory domain alone. Conversion to AD was noted in a significant proportion of our cohort with rare patients converting to DLBD and FTD. This also suggests that AD is more likely to have a prolonged prodromal phase as MCI as opposed to DLBD and FTD which are syndromes which can present as mild behavioural impairment (MBI) to psychiatrists and will be evaluated neurologically only once overt cognitive decline is apparent to the extent of affliction of ADL. Despite limitations of a subset analysis, none of the MRI Brain parameters except FAZEKA grading were found to differ among convertors in our study. After correction for age on our bivariate analysis no volumetric variable was found to be significantly correlated with conversion however multidomain MCI demonstrated an increase CSF volume in comparison to single-domain which may be an indirect marker of global cerebral atrophy and is likely to be more pronounced in the former. Imaging differences between single-domain and multidomain MCI were apparent on ERICA score with moderate atrophy more frequent in the latter subgroup. On correlation analysis between FAZEKA changes on MRI and neuropsychology variables like ACE orientation, ACE recall and RAVLT delayed recall showed significant correlation at baseline in converters. This raises the spectre of white matter integrity as a measure of dementia risk among persons with MCI. The most significant aspect of our study is the derivation for the first time in the subcontinent a conversion score based on data from the logistic regression which could predict the risk of conversion with sensitivity of 72% and specificity of 98% over a period of 6.4 yrs follow up, suggesting the utility of our equation which combined age, learning and encoding score with executive errors to predict conversion in MCI. The validity of the derived score was tested using the ROC analysis with a high AROC 0.881 (p < 0.001). The survival analysis showed that the hazards of conversion of multidomain MCI to dementia would take around 10.46 yrs when compared to 12.45 yrs in single domain MCI. The survival analysis also suggested that for the cut off score 2.615 showed conversion to dementia over 4.5 yrs when compared to score below 2.615 which would convert over 14.8 yrs. The conversion rate noted in our study was much lower than the reviewed data from hospital based cohorts and is similar to other community based cohorts (3-10%) for dementia and its subtypes. This might be due to fact, the early health seeking behaviour of our patients who were predominantly from urban/semi urban regions of Kerala with high literacy and education levels and where the healthcare systems are well developed and the subjects would have an early diagnosis of MCI. Such subjects would be under follow up with constant monitoring and follow up of vascular risk factors and also early identification and treatment of associated neuropsychiatric illness along with other comorbidities which were treated with targeted interventions or pharmacotherapy. It is possible that the MCI non convertors in our subgroup could harbour other etiologies such as VCI (although only a small subset had a past history of stroke) and a longer period of follow up could be more relevant given the fact that progressors were older in comparison to non-progressors in our study. This observations reinforces the fact that all MCI etiologies are not degenerative dementias. Our results could suggest a significant intervention window in MCI and the necessity to have a high specificity for diagnosis of MCI due to AD or other etiologies using MRI, PET and other biomarkers. Another possibility for the low conversion rates might be most of our patients might fall in the “worried well” category and they have a tendency of health seeking behaviour and reassurance is also the key, especially if test performances are borderline with regard to the cut off score for that particular age and education status. Our results suggest the importance of specific baseline neuropsychological measures of memory (learning, recall, recognition) and executive function measures (especially performance errors on set shifting) to predict MCI at risk of conversion using specific age and neuropsychological test subscores in a logistic regression based model. The model derived by us can be useful for not only prediction of progression in MCI but also risk of conversion independent of other clinical variables after controlling for the independent effect of age. Other strengths include subsets which have longitudinal neuropsychology, baseline volumetry and qualitative MRI estimates in subsets of patients (especially white matter disease burden) as well as inclusion of different subtypes of MCI (single-domain, multiple domain). We were also able to highlight the neuropsychological differences between convertors and non convertors, amnestic, dysexecutive and multidomain subtypes. The relevance of CDR and IADL measurements at baseline and followup were also ascertained indicating the necessity to not only measure domain specific test scores but also real-world performance measures in MCI. Ours is the largest study from India with a cohort of MCI patients and long duration of follow up using a combination of age and neuropsychology predictors. Our study is not without limitations. this study was carried out in a single center, thus further large cohort studies are needed to confirm the generalizability of our findings Possible biases related to diagnostic ascertainment and lack of self- referral to memory clinic cannot be excluded. It is possible that a proportion of patients did not seek medical attention for mild memory issues Functional imaging like PET, CSF biomarkers were not done in this study as these resources are not available in our country, an aspect inherent to issues in many LMIC. This was a single center hospital based study hence the sample size was adequate but considering the overall sample size some statistical assumptions were violated. Selection bias and referral biases also effect hospital based registries. It is possible patients with subjective memory complaints who did not undergo formal neuropsychology assessment a baseline may have been excluded. The neuropsychological tests at various time points were done by different personnel hence mild interobserver variations may have crept in resulting in measurement bias. Although clinical and ADL outcome variables could be evaluated, baseline neuropsychological measures alone were relied upon as the entire cohort did not have identical time points of longitudinal neuropsychological assessment. Referral for neuropsychology is largely clinically driven hence an ascertainment bias is also likely. However DSM IV criteria was relied upon with regard to conversion of the MCI patients all of whom had complete neuropsychological measures available at the baseline visit.


Award ID: 11
Study of Flow Dynamics by Transcranial Doppler in Patients of Idiopathic Intracranial Hypertension Before and after Lumber Puncture and Correlation with Optic Nerve Sheath Diameter: A Case- Control Study
Shubham Garg
Neurology, Government Medical College, Kota, Rajasthan, India
E-mail: shubham.meet@gmail.com
Background and Aim: Transcranial Doppler (TCD) can accurately measure blood flow velocity in cerebral blood vessels.1 Previous studies demonstrated that transcranial Doppler measurements of pulsatility index correlate accurately with the degree of elevation in ICP. 2 Both the pulsatility index (PI) and resistivity index (RI) indicate changes in vasoconstriction and vasodilatation in cerebral blood vessels.3 The PI, firstly described by Gosling and King characterizes the shape of a spectral waveform.4 The PI describes the degree of downstream vascular resistance. Small resistance vascular beds have large diastolic flow with rounded waveforms and small PIs. In contrast, larger resistance beds have high diastolic flow, a peaked waveform, and high PIs.5 Also, many studies have proven the use of PI and RI to study the relationship between cerebral perfusion pressure (CPP) and ICP.6 Hunter et al. demonstrated that TCD-obtained PI values altered significantly with change in ICP and proposed potential role of TCD in noninvasive IIH monitoring.7 The idiopathic intracranial hypertension syndrome (IIH) is characterized by increased intracranial pressure with unknown cause, and affecting females predominantly.8 Headache, nausea, vomiting and visual disturbance are the presenting symptoms with associated papilledema on ocular examination.9 In population-based research, the incidence of IIH has been noted to be around 0.9 per 100,000 people.10 Females are found to be eight times commonly affected in comparison to males and incidence rises multiple times in overweight as well as obese patients.11 ICP assessment for monitoring response to therapy may necessitate recurrent lumbar punctures and is not comfortable for the patient and physician. To overcome this, noninvasive modalities, like TCD as well as the optic nerve sheath diameter (ONSD) are being evaluated and assessed as indirect ICP measures. ONSD assessment is a favorable modality to identify increased ICP and is fast attaining popularity as a well-accepted test for ICP in critically ill patients.12-14 Augmented intracranial pressure conducts directly along the optic nerve and causes papilledema. The cerebrospinal fluid (CSF) surrounds the retrobulbar optic nerve sheath so various studies have found that rise in ONSD correlates with an elevation in ICP.15 Meta-analyses and systematic reviews aid the usage of ONSD as a non-invasive ICP assessment test.16 On an extensive literature search, it was noted that few studies in Western countries have been conducted separately to evaluate the flow dynamics of TCD and to assess the ONSD, in IIH before and after lumber puncture (LP). However, there is a lack of such studies in Indian population. In addition, there is a dearth in studies which have evaluated the correlation of TCD and ONSD findings, in IIH cases. Hence, it was decided to evaluate the changes in the TCD parameters as well as correlate them with the ONSD, in IIH cases before and after lumbar puncture. This study will help in understanding the utility of the non-invasive tests versus the invasive methods in evaluating and monitoring the IIH cases, which will add to the scientific armamentarium from India and help in the neurologists in better management of such cases. Aim: To study the flow dynamics by transcranial doppler in patients of idiopathic intracranial hypertension before and after lumbar puncture and its correlation with optic nerve sheath diameter. Objectives: 1. To evaluate the changes in TCD parameters, before and after therapeutic cerebrospinal fluid (CSF) drainage. 2. To check the utility of flow dynamics assessment (noninvasive) over CSF drainage (invasive) to evaluate IIH. 3. To study the correlation between opening pressure and ONSD. Methodology: A prospective, double arm, single center, cohort study was conducted at the department of neurology of government medical college, Kota. Study was initiated only after institutional ethics committee permission was obtained. Patients of either gender between the age of 18 years to 65 years presenting with suspected IIH to the department of neurology at the tertiary care teaching hospital were screened for enrolment in study for case group. Controls were included to match the patients according to BMI, age, and gender, so that the parameters evaluated in IIH cases can be compared with the control population as well, and conclusions which are drawn will be stronger in a comparative study design. A total of 25 cases who were diagnosed with IIH and admitted in the Neurology ward were enrolled in the case group. On the other hand, a control group of 25 individuals were included in whom TCD was performed to compare the values between the patient group (IIH) and control group. Based on the validated and universally accepted Friedman criteria, all the relevant assessments were done in the enrolled cases which included routine laboratory tests, ophthalmological examination, lumbar puncture, CSF assessment as well as MRI evaluation of brain for ONSD. In addition, the TCD study was done to assess the standard parameters used generally to evaluate cases – viz., Mean flow velocity (MFV), Peak systolic velocity (PSV), End-diastolic velocity (EDV), Pulsatility Index (PI), and Resistance index (RI). All the key arteries (ophthalmic artery, middle cerebral artery, basilar artery, and vertebral artery) were studied to get a holistic assessment of all enrolled cases. The quantitative parameters were compared between case and control groups using unpaired t test. The qualitative parameters were compared between case and control groups using Fisher’s test. Correlations of ONSD with TCD in various arteries among cases and controls was also done using Pearson’s correlation coefficient test. All p-value < 0.05 were considered as statistically significant. Exclusion criteria (common for both study groups)1. Patient/Attendant’s refusal to participate in the study.2. Pregnant or breastfeeding females3. Patients who do not need a diagnostic lumbar puncture at the time of evaluation4. Patients treated with acetazolamide, topiramate or furosemide for IIH or suspected IIH before inclusion in the study (baseline)5. Any other primary or secondary headache diagnosis than migraine with or without aura or tension type headache as a comorbid disorder6. Patients in whom the examination cannot be performed due to anatomical reasons such as severe head dysmorphia or severe ophthalmological diseases7. Participants with secondary causes of raised intracranial pressure, or patients that have been treated for such (e.g., brain tumour, hydrocephalus, stroke, or severe head injury)8. Participants with known atherosclerotic disease or known heart disease. Inclusion Criteria (Case group)1. All patients ready to sign informed consent form.2. Age between 18 years to 65 years3. Patients of either gender4. Patients diagnosed with IIH Inclusion Criteria (Control group)1. All individuals ready to sign informed consent form.2. Age between 18 years to 65 years3. Individuals of either gender4. Individuals matched with cases for age, gender, BMI Lumber puncture with CSF opening pressure and drainagePost CSF drainage TCDBaseline TCDMRI Brain + MRV50 patients clinically suspected of IIH CSF pressure < 200 mmH2oCSF pressure > 200 mmH2o25 patients included as cases25 patients included as controls Study design. CSF, cerebrospinal fluid; IIH, idiopathic intracranial hypertension; MRI, magnetic resonance imaging. Result: Twenty-five eligible participants fulfilled the diagnostic criteria of IIH and were included in the final analysis. Twenty-three females and two males, with mean age of 31.2 ± 5.91 years were studied over a period of 1 year. Mean BMI of case group was 30.65 ± 2.51. Most common symptom was headache which was seen in (100%) cases. Other common presentations were TVO (72%), pulsatile tinnitus (60%), photopsia (24%), retro bulbar pain (16%), diplopia (16%), visual loss (16%). Most cases were found to be belonging to grade 1 papilledema (36%) followed by grade 2 (24%), grade 3 (20%) and grade 4 (12%) respectively. The mean CSF pressure was found to be significant higher in the case group versus control group (282.8 versus 106.4 units, p < 0.05). Other parameters like mean protein, sugar and cell count were statistically comparable (p > 0.05). MRI finding in case group was partial empty sella was noted in 76%, followed by other common findings like flattening of posterior sclera (72%), and tortuosity of optic nerve (44%). The mean ONSD for both the right and left side were found to be significantly higher in the case group versus control group (p < 0.05). *CLINICAL FEATURES Headache2525-TVO183<0.001*Pulsatile Tinnitus150<0.001*Photopsia620.247Retro Bulbar Pain420.667Visual Loss420.667Diplopia451.000Papilledema grading Grade 19- Grade 26- Grade 35- Grade 43- Grade 52- CSF Pressure282.80106.40<0.001*Protein31.0830.880.900Sugar61.6464.840.081Cell Count2.402.120.574MRI Partial empty sella19- Flattening of posterior sclera18- Tortuosity of optic nerve11- Intraocular protrusion of prelaminar ON5- Distension of peri optic subarachnoid space7- ONSD Left (mm)5.964.12<0.001*Right (mm)6.014.13<0.001*TVO: transient visual obscuration, ONSD: optic nerve sheath diameter The PSVs in both the right and left OA, ACAs MCAs reduced significantly following CSF drainage (p = 0.001 and 0.003, respectively). In the posterior circulation, PSV was reduced post-CSF drainage, which was statistical significance in the BA and bilateral VA. [Table 2] Similar to PSV, the systolic MFVs in bilateral OA, ACA, MCA reduced significantly post-CSF drainage (p = 0.001 and 0.003, respectively). There was also significant reduction in MFVs in both the VA and BA. [Table 2] PI values in all the studied intracranial arteries decreased concurrently with decrease in CSF pressure and were statistically significant. [Table 2] Similar to PSV, the EDV in bilateral OA, ACA, MCA reduced significantly post-CSF drainage (p = 0.001 and 0.003, respectively). There was also significant reduction in MFVs in both the VA and BA. [Table 2] Although RI values in all the studied intracranial arteries decreased concurrently with decrease in CSF pressure in both anterior and posterior circulation, none of them reached levels of statistical significance in posterior circulation vessels. [Table 2] In case group, on left side significant correlations were noted between PI and ONSD in ACA (r = 0.57), and PSV and ONSD (r = 0.53) in MCA. On right side, once again significant correlations were noted between PI and ONSD in ACA (r = 0.47), and PSV and ONSD (r = 0.58) in MCA. Besides, PI in MCA also correlated significantly with ONSD on right side (r = 0.66). PSV of BA was also significantly correlated with ONSD (r = 0.48). In control group, no significant correlations of ONSD were noted for any TCD parameter bilaterally. [Table 3] Table 2: Transcranial Doppler findings in study population Pre-CSF drainagePost-CSF drainagep -ValueLEFT OA PSV68.88 ± 5.4949.18 ± 5.190.074MFV58.56 ± 5.3842.76 ± 5.13<0.001*EDV23.76 ± 2.6518.16 ± 2.29<0.001*RV0.67 ± 0.030.65 ± 0.070.044*PI0.79 ± 0.050.76 ± 0.080.114RIGHT OA PSV70.84 ± 3.5458.00 ± 3.96<0.001*MFV53.60 ± 2.6148.04 ± 3.82<0.001*EDV25.56 ± 3.5623.76 ± 2.65<0.001*RV0.70 ± 0.060.62 ± 0.050.026PI0.85 ± 0.080.72 ± 0.08<0.001*LEFT ACA PSV69.44 ± 5.5552.00 ± 4.910.001*MFV41.16 ± 5.0336.56 ± 3.81<0.001*EDV30.40 ± 2.6922.28 ±2.23<0.001*RV0.58 ± 0.040.56 ± 0.02<0.001*PI0.96 ± 0.070.87 ± 0.07<0.001*RIGHT ACA PSV68.88 ± 5.3351.04 ± 4.29<0.001*MFV47.00 ± 3.2534.88 ± 2.99<0.001*EDV23.00 ± 2.9720.04 ±2.56<0.001*RV0.67 ± 0.030.62 ± 0.05<0.001*PI0.97 ± 0.080.89 ±0.09<0.001*LEFT MCA PSV99.84 ± 10.9982.60 ± 10.16<0.001*MFV59.84 ± 5.2055.68 ±6.03<0.001*EDV38.12 ± 2.9833.16 ± 2.32<0.001*RV0.63 ± 0.050.58 ±0.05<0.001*PI1.00 ± 0.090.89 ± 0.09<0.001*RIGHT MCA PSV96.60 ± 8.9383.00 ±10.67<0.001*MFV55.08 ± 5.5751.12 ±5.02<0.001*EDV42.52 ± 3.8338.24 ±3.26<0.001*RV0.57 ± 0.050.53 ±0.04<0.001*PI0.99 ± 0.120.87 ± 0.10<0.001*LEFT VA PSV60.28 ± 7.9150.28 ± 5.93<0.001*MFV38.68 ± 4.4531.88 ±5.36<0.001*EDV25.64 ± 6.1420.48 ±4.87<0.001*RV0.61 ± 0.050.59 ± 0.060.222PI0.92 ± 0.050.81 ± 0.05<0.001*RIGHT VA PSV61.72 ± 5.7749.12 ± 6.78<0.001* MFV39.76 ± 4.8029.92 ± 4.80<0.001*EDV23.04 ± 3.5322.20 ±4.96<0.001*RV0.66 ± 0.030.57 ±0.040.333PI0.96 ± 0.080.82 ±0.08<0.001*BA PSV69.64 ± 4.6855.76 ±5.26<0.001*MFV51.32 ± 5.5842.44 ±5.77<0.001*EDV28.36 ± 5.3823.24 ±4.83<0.001*RV0.59 ± 0.060.58 ±0.030.579PI0.85 ± 0.070.78 ± 0.04<0.001**p < 0.05 considered significant by Unpaired ‘t’ testMFV: Mean flow velocity, PSV: Peak systolic velocity; EDV: End-diastolic velocity; PI: Pulsatility Index; RI: Resistance index; BA: basilar artery; MCA: middle cerebral artery; ACA: anterior cerebral artery; VA: vertebral artery; OA: ophthalmic artery Table 3: Correlations of ONSD with TCD parameters in various arteries among cases ArteryTCDCaseLeftRightOA‘R’‘p’ Value‘R’‘p’ ValuePSV0.2250.2790.2310.266MFV0.2280.274-0.1330.528EDV-0.1000.6340.0140.947RI0.0910.6660.0020.991PI0.3510.0850.1240.556ACAPSV0.3480.0880.1650.430MFV0.2100.315-0.1180.574EDV-0.3400.0960.3440.093RI0.0750.7220.1730.408PI0.5700.0030.4680.018MCAPSV0.5280.0070.5800.002MFV0.0320.8780.0540.797EDV0.0980.641-0.1970.346RI0.3010.144-0.0980.642PI0.3370.1000.663<0.001VAPSV0.2170.2980.1190.572MFV0.1370.513-0.1940.354EDV-0.1520.4690.1210.563RI-0.0490.817-0.1880.369PI0.2110.3120.3290.109BAPSV0.3080.1340.4780.016MFV0.2630.2050.2690.194EDV0.1200.5690.0670.751RI0.1040.6220.0500.811PI0.1130.5910.0930.659MFV: Mean flow velocity, PSV: Peak systolic velocity; EDV: End-diastolic velocity; PI: Pulsatility Index; RI: Resistance index; BA: basilar artery; MCA: middle cerebral artery; ACA: anterior cerebral artery; VA: vertebral artery; OA: ophthalmic artery Figure 2: Scatter plots showing significant correlation between cerebral blood flow and Optic nerve sheath diameter. EDV: end diastolic volume; PI: pulsatility index; PSV: peak systolic velocity; BA: basilar artery; MCA: middle cerebral artery; ACA: anterior cerebral artery Conclusion: An IIH is idiopathic increase of intracerebral tension is a clinical setting of unknown etiology which is characterized by elevated CSF pressure more than 20mmHg in the absence of underlying neurological abnormalities or cranial structural lesion.11TCD is a useful tool to assess the cerebral vasculature non-invasively. It is safe, convenient, cheap, and reliable when compared with other techniques. It can be repeated multiple times and can be used for continuous monitoring of ICP if needed.10 ONSD is a non-invasive way to supervise ICP, and its accuracy, in comparison to gold standard measurement via invasive intracranial devices in the ventricles or cerebral parenchyma, has been shown in a few studies. The reason behind using ONSD for intracranial pressure monitoring is that, increased ICP is transmitted to the subarachnoid space surrounding the optic nerve which causes the sheath around the nerve to enlarge with CSF, and this enlargement can be measured directly via ultrasound or MRI.17 In current study the mean age was found to be statistically comparable between the case and the control group (p > 0.05). The gender distribution was noted to be statistically comparable between case and control group (p > 0.05), with females being predominant in both study groups (88% in case group, 80% in control group). This indicated a baseline-matched comparison between the groups was possible. The mean BMI was significantly higher in the case group (p < 0.05), which probably indicates that IIH cases were prone to have higher than normal BMI, in comparison to the normal subjects. In previous studies, females were found to be eight times commonly affected in comparison to males and incidence rises multiple times in overweight as well as obese patients.11 These findings were also replicated in present study. Table 4 below gives a comparison of demographic details with similar studies. All the similar studies with IIH cases had an identical mean age, and almost all studies had female preponderance, identical to present study. Table 4: Demographic details in IIH group of similar studiesStudyParameter assessedMean age (+ SD) (in years) Present study31.2 + 5.91 Wang et al. (2014)1841.3 ± 15.1 Patterson et al. (2018)1932 ± 10 Pradeep et al. (2020)1029.92 + 6.92 Schott et al. (2020)1549.03 Allam et al. (2020)2027 ± 9 Gender distributionPresent studyMales: 12%, Females: 88%Wang et al. (2014)18 Males: 60.4%, Females: 39.6%Patterson et al. (2018)19 Males: 14%, Females: 86%Pradeep et al. (2020)10 Males: 23.08%, Females: 76.92%Schott et al. (2020)15 Males: 27.59%, Females: 72.41%Allam et al. (2020)20 Males: 22.5%, Females: 77.5% The proportion of patients in case group with TVO (72% versus 12% in control group) and pulsatile tinnitus (60% versus 0% in control group) was significantly higher in the case group (p < 0.05). Other clinical features were statistically comparable between cases and control group (p > 0.05). These findings are in line with various other similar studies as well as review articles on IIH. In a review article by Thurtell et al., its mentioned that the IIH cases usually present with clinical features suggesting increased ICP. These include headache, transient visual obscuration, and pulse-synchronous (pulsatile) tinnitus.21 In the study by Allam et al., TVO was 2nd most common feature after headache just like our study (67.5%), followed by blurring of vision (30%) and diplopia (2.5%).20 On evaluating the IIH cases for papilledema, most cases were found to be belonging to grade 1 papilledema (36%) followed by grade 2 (24%), grade 3 (20%) and grade 4 (12%) respectively. It can be inferred that 60% of the cases were low grade, that is either grade 1 or 2 papilledema in present study. In the study by Allam et al., 52.5% of the enrolled cases were either grade 1 or 2 papilledema, a finding identical to our study.20 It indicates that most of the cases develop mild papilledema and visual disturbances before approaching to appropriate medical services. On evaluating the patients with help of MRI, partial empty sella was noted in 76% of cases, followed by other common findings like flattening of posterior sclera (72%), and tortuosity of optic nerve (44%). The various arteries were evaluated with respect to the TCD findings, and a comparison was done between pre and post CSF drainage. In both the ophthalmic arteries (Right and Left) as well as in BA, the mean PSV, mean MFV, mean RI and mean PI were significantly higher in case group versus control group, both pre and post CSF drainage (p < 0.05). The mean EDV was significantly lower in case group versus control group in LOA, both pre and post CSF drainage (p < 0.05). In case of LACA, the mean PSV and mean PI were significantly higher in case group versus control group, both pre and post CSF drainage (p < 0.05). The mean RI was significantly higher only pre-CSF drainage (p < 0.05) in case group while it was comparable post drainage with control group (p > 0.05). The mean MFV and mean EDV were significantly lower in case group versus control group in LACA, both pre and post CSF drainage (p < 0.05). For RACA, the mean PSV, mean RI, and mean PI were significantly higher in case group versus control group in RACA, both pre and post CSF drainage (p < 0.05). The mean MFV and mean EDV were significantly lower in case group versus control group in RACA, both pre and post CSF drainage (p < 0.05). Identical to ACA and OA findings, the mean PSV, and mean PI were significantly higher in case group versus control group in LMCA as well as RMCA, both pre and post CSF drainage (p < 0.05). The mean MFV and mean EDV were significantly lower in case group versus control group in LMCA, both pre and post CSF drainage (p < 0.05). For the LVA, the mean PSV, MFV and EDV were significantly lower in case group versus control group in both LVA and RVA, while mean RI and PI were both significantly higher in case group, post CSF drainage in LVA while only mean PI was significantly higher in case group, post CSF drainage in RVA (p < 0.05). Almost all these parameters reduced in the case group in all arteries post-CSF drainage versus pre-drainage (P < 0.05), except RI in basilar artery, PI in LOA and EDV in RVA which did not alter significantly post-drainage (p > 0.05). In the control group, though there was alteration noted in the parameters post CSF drainage, it was erratic and unpredictable, with some significantly increasing and some significantly decreasing. The findings of present study are like the few similar studies which have been conducted, and which have tried to compare the mean blood flow velocities between IIH cases and control. he initial peak and mean blood flow velocities (PSV and MFV) in most of our study population were within the upper limits of normal. This is similar to Gur et al. and Pradeep et al., who found that blood velocities, PI, and RI of IIH patients were higher than normal controls.10,12 Previous studies have shown that cerebral regulatory functions are still effective during moderate increase of ICP as seen in IIH. Hence, the systolic blood flow velocities do not increase as expected in patients of traumatic brain injury or subarachnoid hemorrhage.22,23 However, it has been consistently shown that peak and mean systolic as well as diastolic flow velocities are significantly higher in patients with IIH when compared with controls with normal CSF pressure.24 TCD was done immediately after CSF drainage and normalization of ICP and found to have uniform reduction in systolic as well as diastolic flow velocities. Similar to a study by Pradeep et al., the uniform reduction was replicated in present study as well. Hunter et al. demonstrated a significant decrease of PI after CSF drainage and ICP became normal just like our study in most arteries, another small study in five female patients failed to do so.2,25 In the cohort study by Pradeep et al., there was an insignificant reduction in PI values post-CSF drainage. It is important to remember that PI is an advance measurement and is dependent on many hemodynamic variables including cerebral perfusion pressure (CPP), cerebrovascular resistance, compliance of arterial bed, and the pulse rate.26 PI reflects the CPP more correctly than ICP, especially in cases of moderate ICP elevations in chronic disorders such as IIH.27 Correlation was checked between ONSD with TCD in various arteries to understand the its utility in evaluating IIH cases. In case group, on left side significant correlations were noted between PI and ONSD in ACA (r = 0.57), and PSV and ONSD (r = 0.53) in MCA. On right side, once again significant correlations were noted between PI and ONSD in ACA (r = 0.47), and PSV and ONSD (r = 0.58) in MCA. Besides, PI in MCA also correlated significantly with ONSD on right side (r = 0.66). PSV of BA was significantly correlated with ONSD (r = 0.48). These indicate that in various arteries, the mean flow velocities indicated by PI and PSV did have a positive correlation with ONSD, indicating if one goes up the other will also increase and vice versa. However, this was not a uniform finding and hence, future studies need to evaluate this in more detail. The mean ONSD for both the right and left side were found to be significantly higher in the case group versus control group (p < 0.05). This points to the fact that ONSD was higher in IIH cases, which was evident from the MRI assessment. In the study by Abdelrahman, et al., there was a strong correlation between the measured ONSD in the 3D DRIVE and the increased ICP more than 20 mmHg which is a cornerstone for diagnosing IIH, with a significant difference between the mean ONSD in the patients with increased ICP and the control healthy volunteers (mean = 5.81 ± 0.33 mm and 4.95 ± 0.45 mm, respectively, P value < 0.001).28 Another study by Wang et al. reported a higher correlation between ONSD and changes in lumbar puncture (r = 0.724, 95% CI 0.470–0.876; p < 0.001) among patients admitted for suspected elevated ICP.29 Present study used MRI to evaluate ONSD, while many studies used USG for measuring the ONSD catching the advantage of USG as a bedside test with less cost. However, the main disadvantage of USG is that the USG is an operator-dependent technique so its measurement may be affected by the inexperience of the examiner, the other disadvantages are the poor penetration of USG beam, the artifacts from the tissues under observation, the bad cutting plane, and the low spatial resolution, all these drawbacks could explain the difference in ONSD value using the MRI and the ultrasound. A study by Patterson et al. evaluated and compared the performance of ocular ultrasonography (US) and magnetic resonance imaging (MRI) for detecting increased intracranial pressure (ICP) in patients with IIH. The authors had concluded that US and MRI provide measurements of ONSD that are well-correlated and sensitive markers for increased ICP.19 The study has many strengths as well as novelty factors, there are few limitations. The sample size is small, and the study is conducted at a single center. Post LP ONSD change is not measured in current study. Future studies with a larger sample size and multicenter study design can help in validating our study findings. Conclusion Raised intracranial pressure significantly impacts cerebral blood flow. A normalization of transcranial Doppler parameters was noted lowering of intracranial pressure through lumbar puncture and CSF withdrawal. This indicates that TCD has utility in monitoring as well as managing IIH cases. Mean flow velocities indicated by PI and PSV had a positive correlation with ONSD, indicating if one goes up the other will also increase and vice versa. Therefore, ONSD can also be used to monitor ICP non-invasively.
Award ID: 12
PET Scan in Autoimmune Encephalitis – A Highly Sensitive Biomarker
Parthvi Khandhar, Sangeeta Ravat, Shwetal Pawar, Kshiteeja Jain, Sangeeta Ravat, Shwetal Pawar
Neurology Department, Seth GSMC and KEM Hospital, Mumbai, Maharashtra, India
E-mail: dr.parthvi@gmail.com
Background and Aim: Autoimmune encephalitis (AIE) is a relatively newer entity in our field of neurology if you compare it with stalwart neurodegenerative like Parkinson’s disease and Stroke which have been first diagnosed some hundred 200 years ago. The criteria for AIE were laid down in the early 2000s and then revised continually, to finally have the latest consensus Criteria in 2016. [1] These include a set of diagnostic features including clinical, investigational aspects (serum, CSF, MRI, EEG) as well as the exclusion of other known causes of those symptoms. This has helped us a lot in putting a diagnosis on patients presenting with this set of symptoms and channelizing them into a proper treatment protocol, thereby achieving good results. But still, a lot of patients go undiagnosed and are left untreated or given purely symptomatic treatment with antipsychotics or ASMs, instead of immunotherapy, thus achieving poor control of symptoms. There are newer antibodies being discovered every day and at, present we do not know all the antibodies that exist. The laboratory setup also is a developing entity when it comes to autoimmune antibodies, and our country like India has a panel of 10 to 12 readily available tests. Special state-of-the-art laboratories are required for a comprehensive autoimmune antibody analysis, which is only available in some states at a few select centres. We try to address this lacuna in the diagnostic criteria and added a relatively accessible entity of nuclear medicine to the diagnostic armamentarium – the PET scan. Methodology: This retrospective, observational study was conducted at a tertiary care public health hospital in Mumbai, Maharashtra. Over a span of 3 years, 29 patients were selected who presented with the symptom spectrum of refractory seizures, psychiatric/behavioural abnormalities, cognitive deficits and a rapid progression of symptoms. These patients were those either presenting to the Neurology OPD or referred to Neurology from Medicine Department or Psychiatry department, in view of refractory seizures or Neuroimaging MRI abnormalities. The data was acquired from screening the archives of ward and OPD clinics of the Neurology Department, KEM hospital. All of these were screened by MRI brain and only 20 were included. 8 were excluded due to the MRI brain showing structural abnormality or strokes. 1 was excluded due to having an MRI picture of Creutzfeldt Jacob disease. [2] The rest were included, the subjected to Serum and CSF antibody testing, EEG, and Neuropsychology assessment. An autoimmune panel for autoantibodies was conducted in serum and CSF for all of them. They were segregated into two groups thereafter, antibody-positive AIE and seronegative AIE. The patients who satisfied either of the following criteria for AIE were further subjected to a PET scan at our Nuclear Medicine department. [Tables 1, 2 and 3]. A subgroup descriptive analysis was done on them and then data was analysed. A telephonically informed consent was taken from each and every patient included in this study. Result: Out of our series of 20 autoimmune encephalitis patients (including both seronegative or antibody-positive patients), PET scans showed abnormality in 100% of our sample. The commonest was hypermetabolism in active cases in temporal lobes. This was the case even in those in whom the MRI was normal. Some patients also showed bilateral frontal hypermetabolism. Also, an association was found of active disease activity, in earlier PET scans. Earlier the PET scan from the onset of symptoms, the better the yield of the scan. Conclusion: PET Scans must be initiated early on in suspected autoimmune encephalitis patients. The threshold for ordering a PET Scan should be lower, especially when the clinical suspicion is high. Given that it is more often abnormal when compared with MRI in the acute setting, this molecular imaging technique may be better positioned as an early biomarker of disease so that treatment may be initiated earlier, resulting in improved patient outcomes. These results corroborated well along with the results of other similar study suggesting a role of early PET scan. [3] The problems with unexplained sudden onset psychiatric changes and normal MRI scans doesn’t need to be written off as having a psychiatric diagnosis. Our study essentially proved that patients with such specific symptoms and MRI normal scans must be more thoroughly investigated with an entity like a PET Scan. The blood work, EEG, and MRI may have a supportive role, but PET scan findings were found in our study specific to Autoimmune encephalitis. In another series of autoimmune encephalitis from South India, Magnetic resonance imaging (MRI) of the brain was abnormal in 53.3% of patients. MRI hasn’t been either the most sensitive or the most specific investigational modality for this disease.[4] Precision medicine is increasingly important in modern clinical medicine, as it aims to obtain an early and accurate diagnosis and reduce the subsequent treatment failure and intervention in disease development, which usually involves highly individualized patient management and multidisciplinary cooperation[5] The field of radiomics has also been explored in our study as to see how minor PET Scan parameters can help correlate with our patient symptoms. Radiomic analysis exploits sophisticated image analysis tools and the rapid development and validation of medical imaging data that uses image-based signatures for precision diagnosis and treatment, providing a powerful tool in modern medicine. [6] Our data subgroup analysis also showed the relevant FDG-PET results having high metabolism corresponding to early swelling of the lesion parenchyma. There are efforts being made in identifying new antibodies, by proteomic or candidate approaches, which could help with the diagnosis of potentially treatable forms of epilepsy still considered to be of unknown origin. [7] At the same time, a novel approach using PET Scan for earlier and quicker diagnosis has been proposed in our study in the given clinical scenario, which might change the management and lives of many patients.


Award ID: 13
Association of Short Latency Afferent Inhibition with Stage of Disease in Parkinson’s Patients
Supriyo Choudhury, Ummatul Siddique, Simin Rahman, Yogesh Kumar, Sattwika Banerjee, Mark R. Baker, Stuart N. Baker, Hrishikesh Kumar
Movement Disorder, Neurology, Institute of Neurosciences Kolkata, West Bengal, India
E-mail: choudhurydrsupriyo@gmail.com
Background and Aim: Parkinson’s disease (PD) is described as a degenerative condition of the basal ganglia accompanied by dopamine deficiency in the striatal complex (1). Whilst this subcortical network is perhaps the primary anatomical substrate for impaired motor control in PD patients, many of the non-motor symptoms of PD, including (but not limited to) apathy, hallucinosis, impulse control, cognitive impairment, anosmia and sleep disorders are more likely to be a manifestation of cortical disease (2), associated with degeneration of non-dopaminergic forebrain neurons as disease progresses (3, 4). Brain imaging, including positron emission tomography (PET), magnetic resonance imaging (MRI) and functional MRI, has identified regions of abnormal cortical function (5, 6) and significant changes in cortical thickness and cortico-cortical connectivity (7, 8) in patients with PD. There is also some evidence that there may be defective central sensory processing in this patient group, leading to sensory-motor decoupling (9). There are limited means to evaluate the functional integrity of human cerebral cortex. Transcranial magnetic stimulation (TMS) is a non-invasive tool for evaluating cortical function, particularly with regard to motor control. The motor evoked potential (MEP) is the EMG response generated by magnetic stimulation over the contralateral motor cortex and can be modified by sensory stimulation delivered prior to the magnetic stimulus. Short Latency Afferent Inhibition (SAI) is a well-known inhibitory paired pulse paradigm, where median nerve stimulation precedes (~20 ms) the TMS pulse (10). This paradigm has been used previously to assess the integrity of sensory-motor coupling in human participants (11). Pharmacological studies have suggested that SAI is mediated by muscarinic and GABAergic receptors (12, 13). Studies in patients with Alzheimer’s disease (AD) (14) and PD dementia (15) have shown reduced SAI consistent with cholinergic/GABAergic neuronal loss. However, whilst some studies have shown normal SAI in PD patients without dementia [15] others have reported reduced SAI in PD patients only in their ON phase (10). Moreover, a linear correlation between gait speed in PD patients and SAI has also been reported (16), suggesting that SAI might show a gradual decline with the advancement of disease in PD. In the present cross-sectional study, we assessed SAI in PD patients stratified in early to advanced stages of disease and explored the clinical correlation of this neurophysiological index in our sample. Methodology: The study was conducted at a movement disorders laboratory in Eastern India with ethical approval from the Institutional Ethics Committee. All participants provided informed consent. The stage of disease was assessed using the modified Hoehn and Yahr (H&Y) scale. Patients with H&Y stage ≥ 4 were excluded from the study. Motor and cognitive function were assessed using the Movement Disorder Society-sponsored revision of the Unified Parkinson’s Disease Rating Scale (MDS-UPDRS part III) and Montreal Cognitive Assessment (MoCA) respectively. Gait parameters were measured using an electronic walkway with embedded pressure sensors (GAITRite, USA). The medical history was documented. This included a medication history and documentation of the time at which the last dose of L-dopa was taken. None of the patients demonstrated prominent motor fluctuation and thus we considered time since last L-dopa dose in our sub-group analysis. All patients were right-handed. The laterality of disease was surmised from the asymmetry index of the UPDRS score. SAI was tested while patients were sitting comfortably in a chair with arm rests. Adhesive EMG electrodes (H59P; Kendall) were placed over the muscle belly of the first dorsal interosseous (FDI) muscle and metacarpophalangeal joint of the right index finger. The ground electrode was placed on the same hand over the dorsal surface of the wrist joint. EMG signals were recorded through a custom-built isolated EMG amplifier (gain x1,000, bandpass 30Hz−2 kHz). Amplified EMG signals and event markers were digitized via a power1401 interface (Cambridge Electronic Design, Cambridge, UK) at a sampling frequency of 5,000 Hz and saved to desktop for off-line analysis, through custom analysis scripts written in MATLAB (MathWorks, USA). The median nerve was stimulated by two adhesive surface electrodes placed over the volar aspect of the wrist joint using a constant current stimulator (DS7A; Digitimer). The anode was placed proximal to the skin fold separating the forearm and wrist and the cathode was placed parallel to it 2-3 cm proximal to the anode. The sensory threshold was identified for every individual by gradually increasing the current (0.6-11 mA; 0.2 ms pulse width). For SAI experiments we stimulated the median nerve at three times sensory threshold. A figure of eight coil (model D702, Magstim Ltd, Whitland, UK) and magnetic stimulator (Magstim 2002 stimulator, Magstim Ltd, Whitland, UK) were used to stimulate the left motor cortex. The coil was positioned with the handle pointing posterior and lateral at 45° to the sagittal plane resulting in the flow of current in the coil from the posterior to anterior direction. Patients were requested to remain relaxed throughout the TMS study but maintain their hand in the same posture. The TMS coil was moved over the head to locate the optimal location for MEPs from the FDI muscles. The resting motor threshold (RMT) was determined as the minimum intensity required to evoke > 50 µV peak-to-peak responses in relaxed FDI muscle in at least five out of 10 trials. Test/control MEPs were elicited at 120% RMT during SAI experiments. SAI was tested at five different conditioning intervals (TMS was preceded by median nerve stimulation at intervals of 18, 19, 20, 21 and 22 ms). Each condition was tested ten times (10 X 5 = 50) and unconditioned TMS was also delivered ten times (n = 60). Combinations of stimuli were randomized and precisely timed through a script written in Spike2 software (Cambridge Electronic Design). The average percentage inhibition of MEPs in all five conditions relative to the average unconditioned MEP was computed using a MATLAB (Mathwork, USA) script and the value at the inter-stimulus interval with maximal inhibition was used for inter-group comparisons. Normality of data was tested using the Shapiro-Wilk test. One way ANOVA with post-hoc Tukey’s test was applied to test the difference between three groups (e.g., % SAI between three H&Y stages) and unpaired t-tests were used to compare % SAI between two sub-groups. The post-hoc categories created for subgroup analysis were the following: patients with or without anticholinergic medications; benzodiazepines; laterality of disease; and patients receiving levodopa dose within or beyond 2 hours. Four patients did not report the last levodopa intake time. One patient did not show any laterality of disease. The sub-groups were generated by direct interview and review of past medical records. Spearman’s rank correlation coefficient was used to find associations between gait speed and cognitive domains. A p value < 0.05 was considered as the threshold for rejecting the null hypothesis. Predictive statistics were not attempted because of the small sample sizes. The SPSS v20 (IBM, USA) statistical software package was used for statistical analysis. Result: A total of 22 patients (13 males) with Parkinson’s disease, diagnosed by a movement disorders neurologist in accordance with the Movement Disorders Society Parkinson’s Disease Criteria, with a mean age of 61 (±10.4) years, were enrolled in the study. Mean disease duration was 72 (±50.3) months, with a mean age of onset of disease of 55 (±13) years. The mean H&Y and UPDRS III scores were 1.9 (±0.68) and 28.6 (±12.9) respectively; the mean MoCA score was 20.7 (±6.3). Figure 1a and 1b depict two representative average MEP waveforms from an early (H&Y stage 1) and an advanced (H&Y stage 3) patient respectively; typical inhibition was demonstrated at all interstimulus intervals (ISIs) in the early case, whereas in the patient with more advanced disease inhibition was lost at all ISIs. Group data summarised in Figure 1c showed a gradual decline in SAI (values closer to 100%, indicating no inhibition) with the increasing advancement of disease. Whilst the overall MoCA score did not show a linear correlation with percentage inhibition, two cognitive domains (orientation and visuospatial executive function) demonstrated an inverse correlation with SAI [Figure 1d and 1e]. We did not observe a correlation between SAI and score of MDS-UPDRS part III (p 0.29). We performed a sub-group analysis to understand between-group differences in patients taking psychoactive drugs, which have previously been reported to affect SAI. Surprisingly, medication, including centrally acting anti-cholinergic agents, had no significant effect on SAI [Figure 2a and 2b]. The levodopa equivalent daily dose (LEDD) did not show any significant correlation with SAI (p 0.08). Whilst there was a visible separation between users and non-users of benzodiazepine at therapeutic doses, this did not reach statistical significance. There was no significant difference in SAI between patients who were tested within 2 hours of taking L-dopa compared to those who took L-dopa more than two hours prior to testing [Figure 2c]. SAI between more and less affected sides was comparable [Figure 2d]. Unexpectedly, we did not find any significant correlation between gait speed and SAI in subgroups separately [Figure 2e, 2f]. Drawing conclusion from 5 patients on correlation between gait speed and SAI is likely to be inappropriate. Hence, we tested correlation between gait speed and SAI in all 22 patients. Still, it did not reach the level of significance (p = 0.08). Finally, we did not observe any difference in resting motor threshold between different stages of PD or cognitive scores. Conclusion: In this study, we observed a decrease in cortical sensory-motor coupling in PD patients with disease progression, evaluated by testing SAI in this patient group. Additionally, we found that the visuospatial executive function and orientation domains of cognition demonstrated a negative correlation with SAI. SAI has been frequently used as a surrogate estimate of cortical cholinergic tone. Whilst the non-specific muscarinic receptor antagonist scopolamine has been reported to reduce SAI (12) and GABAA receptor agonists have been shown to increase SAI (13, 17), the wider pharmacology of SAI is not well-documented. If we accept that the reduction in SAI we have observed is through cholinergic denervation, then the current study reinforces a hypothesis of an ‘acetylcholine deprived brain’ in patients with advanced PD. Studies investigating SAI in PD have produced conflicting results. For example, Sailer et al. (2003) reported that SAI was reduced on the more affected side in PD patients on medication but remained normal in PD patients off dopaminergic medications (10), whereas Di Lazzaro et al. (2004) reported a selective increase in SAI on the more affected side in hemi-parkinsonian patients (18). Guerra et al. reported that SAI was comparable between patients and heathy subjects, and that dopaminergic therapy did not modify the amplitude of MEPs evoked during the SAI protocol (19). In a recent review, the authors mentioned that the abnormal disinhibition of cerebello-thalamocortical cicuits is a probable reason for bradykinesia in PD patients (20). SAI was significantly reduced in mild PD patients with visual hallucination (VH) compared to those without VH and controls (21). Rochester et al. (2012) observed significant associations between SAI and age, gait speed, postural instability and attention in a relatively large sample of PD patients, with gait speed remaining an independent predictor of reduced SAI on regression analysis (16). A study focussed on cognitive attributes of neurodegeneration found that SAI was significantly reduced in AD but not in PD patients without dementia compared to controls. However, SAI was significantly reduced in PD patients with dementia (PDD) and there was a strong correlation between SAI and Mini–Mental State Examination (MMSE) score (15). Another group of investigators found that SAI was significantly reduced in patients with mild PD and REM sleep behavioural disorder (RBD) compared to PD patients without RBD and controls (22). SAI values correlated positively with neuropsychological tests measuring episodic verbal memory, executive functions, visuo-constructional and visuo-perceptual abilities. No significant differences were observed in SAI between PD patients with Freezing of Gait (FOG), PD patients without FOG and healthy controls (23). PD patients with dysphagia showed significantly reduced SAI compared to those without dysphagia (24). However, in the same study, SAI was not significantly correlated with disease duration, modified H&Y stage, or UPDRS-III score. In broad agreement with Rochester et al., a more recent study reported significant reductions in SAI in patients with mild to moderate PD compared to older adults with a history of two or more falls, with mean SAI correlating with changes in gait speed under a dual-task condition (25). SAI and its correlation with clinical parameters is thus quite variable across studies. These inconsistencies may be explained by factors including small study sample size, stage of PD, different phenotypes of PD, method of analysis, and the presence of cognitive impairment. Our observations that a reduction in SAI is correlated with the stage of disease and negatively correlated with two specific cognitive domains (orientation and visuospatial executive function) are consistent with dysfunction in cholinergic neuronal networks. Cholinergic neurons are concentrated in a number of nuclei including, but not limited to, the basal forebrain complex, the pedunculopontine nucleus (PPN), the latero-dorsal tegmental nucleus (LDTN) and the medial habenula. Cholinergic interneurons are also found in the striatum, nucleus accumbens and the neocortex. A recent review by Pasquini et al. (2021) has detailed the evidence from various modalities (MRI, PET, Electroencephalogram/ EEG, TMS) for cholinergic pathology in PD (26), and has speculated that, because cholinergic dysfunction is not a universal finding in PD, it may represent a phenotypic variant of PD. Although, Braak’s original ascending model postulates simultaneous involvement of dopaminergic and cholinergic neurons, there is limited clinical evidence for this. Moreover, whilst animal studies have shown a link between dysfunction of cholinergic striatal interneurons and the severity of motor symptoms such as tremor and levodopa-induced dyskinesia, these preclinical observations have not translated into the clinic. Studies in Alzheimer’s disease (AD), where cholinergic pathology is well recognized, have also identified impairment in SAI correlated with UPDRS-3 score (R = 0.731, p = 0.016) and Aβ42 levels (R = –0.652, p < 0.05;), suggesting a direct relationship between motor impairment and amyloidopathy (27). Similar findings have also been reported by Bologna et al. in patients with normal-pressure hydrocephalus (28); AD-mediated cholinergic degeneration may also therefore account for motor impairment in this condition. Some of our ‘null findings’ are also somewhat surprising and require confirmation [Figure 2]. For example, we observed a lack of correlation between SAI abnormalities and motor functions as assessed by the MDS-UPDRS. This is not unexpected given the significant weighting assigned to features of tremor, which, unlike bradykinesia or gait disturbance, might not be a direct reflection of cholinergic deprivation. Similarly, we failed to observe differences in SAI between those treated with centrally acting anti-cholinergic medications or benzodiazepines at therapeutic doses, compared to those who were not. We also failed to find any difference in SAI between patients with left/right predominant disease or any effect of the timing of L-dopa relative to testing, or a significant correlation between gait speed and SAI. These ‘null findings’ could all be attributed to a limited sample size. Moreover, as discussed above, there are persisting uncertainties regarding the pharmacology of SAI in healthy controls, and thus our observations regarding the effects of medication should not be entirely dismissed. In conclusion, the current study provides evidence of a gradual decline in sensory-motor integration in PD patients with advancing stage of disease. Moreover, our observations regarding SAI and visuospatial/orientation domains of cognition are compatible with previously published literature.
Figure 1.

Correlation of Short Latency Afferent Inhibition (SAI) with stage of Parkinson’s Disease and cognitive function 1a – Average test (grey) and conditioned (black) motor evoked potential (MEP) from a representative patient with PD at modified H&Y (modified Hoehn and Yahr) stage 1 (early stage) showing the expected reduction in MEP amplitude when conditioned with median nerve stimulation. 1b - Average test (grey) and conditioned (black) MEP from a representative patient at H&Y stage 3 (advanced stage) showing no change in MEP amplitude when conditioned with median nerve stimulation. ISI = Interstimulus interval. 1c – Gradual mean reduction in percentage inhibition of test MEP with advancement in the disease stage (One way ANOVA with post-hoc Tukey’s test). 1d – A significant negative correlation between SAI and the orientation cognitive domain (Spearman’s rank correlation). 1e - A significant negative correlation between SAI and visuospatial executive function (Spearman’s rank correlation). P < 0.05 was considered the threshold to reject the null hypothesis. N = sample size
Figure 2.

Psychoactive medications and clinical factors showing no effect on Short Latency Afferent Inhibition (SAI) in Parkinson’s patients 2a - Comparing SAI between groups of patients with and without centrally acting anticholinergic drugs at therapeutic doses failed to show any difference. 2b - Comparing SAI between groups of patients with and without oral benzodiazepine drugs at therapeutic doses failed to show any difference. 2c - Comparing SAI between groups of patients administered L-dopa within or more than 2 hours before the test failed to show any effect of the timing of L-dopa administration on SAI. 2D - Comparing SAI elicited from intrinsic muscles of the right hand, between patients with left or right predominant PD failed to show any difference (2a-2d – Unpaired T-Test). 2e, 2f – Scatter plots of SAI and gait speed among patients who consumed L-dopa more than 2 hours before testing and within 2 hours of testing respectively showed no significant correlation (Spearman’s rank correlation). P < 0.05 was considered the threshold to reject the null hypothesis. N = sample size
Award ID: 14
Genotype-Phenotype Correlation and Disease Progression in GNE Myopathy: A First Study on Indian Patients
Dipti Baskar, Seena Vengalil, Saraswati Nashi, Gautham Arunachal, Gayathri Narayanappa, Mainak Bardhan, Preethish Kumar Veeramani, Akshata Huddar, Gopikrishnan U, Abel Thomas, Nalini Atchayaram
Neurology, National Institute of Mental Health and Neuro Sciences (NIMHANS)
E-mail: diptibaskar@gmail.com
Background and Aim: GNE myopathy (GNEM - UDP- N- acetylglucosamine 2 Epimerase/ N-acetyl mannosamine kinase) is a rare slowly progressive adult-onset distal myopathy with autosomal recessive inheritance. This was first described by Ikuya Nonaka in 1981 as distal myopathy with rimmed vacuoles [1] and later by Argov Zohar et al., in Iranian Jewish families as quadriceps sparing myopathy [2]. This is also known as hereditary inclusion body myopathy due to its characteristic histopathological features [3]. The first Indian report of 23 GNE patients was reported by Nalini et al., in 2010. [4] The estimated worldwide prevalence is 1 to 9 in 10,00,000 population [5]. The onset of symptoms occurs most commonly in the third decade[3]. It presents as distal lower limb weakness which progresses proximally with upper limb involvement paralleling proximal lower limb progression. The clinical signpost for diagnosis is the relative sparing of quadriceps even in advanced stages. Beevor’s sign indicating the hip flexor and lower abdominal weakness is reportedly common in Indian patients [6]. There is no consistent risk of respiratory or cardiac abnormalities noted. These patients have only mild to moderate elevation of serum creatine kinase levels [7]. Electromyography shows myopathic potentials with occasionally spontaneous activity [8]. The characteristic histopathological features include small angular fibres with rimmed vacuoles in the atrophic fibres which may also contain congophilic material immune reactive to beta-amyloid, ubiquitin, tau and lysosomal proteins [9]. The GNE gene is located on chromosome 19p13.3 and consists of 13 exons. About 70% of GNE myopathy patients display compound heterozygous mutations. In addition, a few indels, intronic variants, rearrangements and copy number variations with recombination hotspots have been reported. The clinical course and progression of GNEM have been described in several case reports and small cohorts only. There are only a few studies done previously on the disease progression. Mori-Yoshimura, et al., 2014 studied 121 GNEM patients and reported duration from onset to use of assistive device and loss of ambulation as 12.4 years and 21.1 years respectively [10]. Quintana et al., in 2019, longitudinally studied 38 GNEM subjects and showed a decline in muscle strength and physical functioning as a function of estimated disease progression. [11]. In 2021, Lochmuller et al., studied 87 patients with a significant decline in handheld dynamometer muscle strength over 36 months of follow-up.[12]. Hence this study aims to analyse the phenotypic and genotypic characteristics, their correlation and also to assess the disease progression in a large cohort of Indian GNEM patients. Methodology: This is a retrospective observational study done at the Neuromuscular division, Department of Neurology, NIMHANS, India. Institutional ethics committee approval has been obtained. All patients genetically diagnosed with GNE myopathy by Sanger and Next-generation sequencing were included. Chart review of all GNEM patients was done and data on basic demographic details, family history and consanguinity, clinical details including age of onset, total illness duration, presenting complaints, pattern of weakness, muscle power charting, deep tendon reflexes, laboratory details such as serum creatine kinase levels, lactate dehydrogenase levels, electroneuromyography findings, muscle biopsy findings were documented. Functional assessment rating scale scores: total and individual item scores of the following scales – Inclusion Body Myositis Functional Rating Scale (IBMFRS) and Muscular Dystrophy Functional Rating Scale (MDFRS), progression of illness included age at use of assistive devices, time to loss of ambulation and wheel-chair bound state. All patients included in the study underwent genetic testing by next-generation sequencing. Result: Baseline demography: The study cohort consisted of 152 patients with 65.8% being males. The mean age of symptom onset was 26.6 ± 6.2 years with the majority of patients in the 3rd decade of life. The mean age in females (25.7 ± 5.7) was slightly less than in males (27.1 ± 6.5). The oldest age noted was 53 years. The mean duration between symptom onset and diagnosis was 6.2 ± 4.9 years. Clinical features: The most common presenting symptom was foot drop (87.5%). About 18% of patients had proximal lower limb weakness masquerading as a limb-girdle syndrome. Bifacial weakness was noted in 9 patients and Beevor’s sign was seen in 87 patients (57.2%) denoting lower abdominal muscle and hip flexor weakness. Most of the patients had predominant involvement of tibialis anterior (88.1%), hip adductors (85.5%), hamstring (84.5%) and iliopsoas (80.9%) with only 5 patients (3.2%) having quadriceps weakness. The mean serum creatine kinase level was 501 ± 393.7 with normal levels seen in 25 patients. Muscle biopsy was done in 36 patients with 75% of patients showing rimmed vacuoles. Genotype features: The founder Indian mutation (c.2179G > A, V727M) was found in 126 patients (84%) and Roma Gypsy founder mutation (c.1853T > C, I618T) in 7 patients (4.6%). All compound heterozygotes had V727M in one allele. 56.3% of patients with V727M were unable to walk at presentation with loss of ambulation on follow-up noted in further 21.8% of patients who were followed up (n = 78). Most of the patients had involvement of kinase (44.7%) or kinase and epimerase domains (39.4%). The mutation distribution by exons and domains is depicted in Figure 1. Missense mutations were seen in 59.8% with 36.8% having novel mutations. Two novel variants were noted namely p.Leu732Phe and p.Gly613Arg. 18 patients had rapid progression of symptoms with most of them having V727M mutation with involvement of either kinase or epimerase and kinase domains. Genotype-phenotype comparison: The mean age of onset was slightly earlier in the kinase only group as compared to epimerase and epimerase with kinase involvement. Also, the kinase only group has lesser ambulant patients with early wheelchair-bound state and reduced IBMFRS and MDFRS scores [Table 1]. Comparing the variants with clinical presentation, the Indian founder mutation had a later age of onset with more ambulant patients and good IBMFRS and MDFRS scores [Table 1]. Clinical progression: Among the 78 patients who were followed up, majority had only mild to moderate disability onthe IBMFRS scale (92%), whereas 76.3% had a mobility disability score of <50% on the MDFRS scale. The important clinical progression milestones are shown in Table 2. Conclusion: This is the first of its kind study in a large cohort of genetically confirmed GNE myopathy cases to report on the clinical features as well as genotype-phenotype comparison and disease progression. The mean age of onset and presenting complaints of foot drop was comparable to previous studies. Beevor’s sign was noted in a significant number of patients as noted in previous study by Preethish et al. [6]. As reported by Bhattacharya, et al., our study also noted c.2179G > A, V727M (Indian founder mutation) as the most common variant in the heterozygous state [13]. In our study, patients with mutations in the kinase domain were predisposed to a moresevere phenotype compared to the patients with both mutations in epimerase or epimerase with kinase domains. This could partially be attributableto the fact that mutation that is expected to cause a more severephenotype was prevalent in the kinase groups. This observation is in contrast to findings from previous studies by O. Pogoryelova et al., and Zhao et al., showing severe phenotype with epimerase – kinase and epimerase only domains respectively [14] [15]. Observed relationships between genotype and self-reported clinical parameters indicate that the severity of the disease might be partially attributable to the specific GNE genotype. Disease progression studies on rare muscle diseases are essential before any new drug trial to know its effect on disease course. This is one of the very few studies with a large cohort of patients analysed for genotype-phenotype correlation among Indian patients. This study highlights the important phenotypic and genotypic characteristics and their relationship in patients with GNEM and its variability with findings from reposts on other populations.


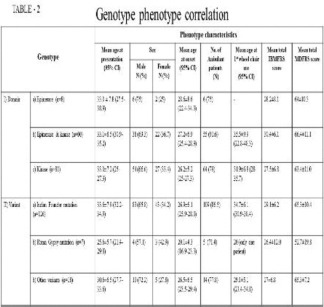
Award ID: 15
Genetic and Phenotypic Heterogeneity of Charcot-Marie-Tooth Disease in an Indian Cohort
SEENA V, Kiran Polavarapu, Mainak Bardhan, Saraswati Nashi, Veeramani Preethish Kumar, Gautham Arunachal, Dipti Baskar, Abel Thomas Oommen, Akshata Huddar, Gopikrishnan U, Atchayaram Nalini
Neurology, National Institute of Mental Health and Neurosciences, Bangalore, Karnataka, India
E-mail: seenavengalil@gmail.com
Background and Aim: Charcot-Marie-Tooth disease (CMT), also known as hereditary motor and sensory neuropathy, is a clinically and genetically heterogeneous group of inherited neuropathy disorders. The classical clinical presentation is characterized by slowly progressive weakness and atrophy of the distal muscles predominantly affecting the lower limbs, foot deformities, reduced or absent deep tendon reflexes and mild sensory loss [1,2]. In addition to the core clinical symptoms additional features can be frequently present in CMT such as central nervous system abnormalities, cranial nerve involvement, deafness, optic atrophy, cataract and vocal cord palsy [3]. Classification is based on a combination of electrophysiological characteristics, inheritance pattern, and underlying genetic cause [4]. Based on neurophysiologic findings CMT is classified into three different subtypes, namely, the demyelinating type (CMT1) defined by a motor conduction velocity (MCV) of the median or ulnar nerve of less than 38 m/s, the axonal type (CMT2) with MCV above 38 m/s, and an intermediate type which has both demyelinating and axonal features and MCV between 25 and 45 m/s [5]. The mode of inheritance of CMT is either autosomal dominant, autosomal recessive, or X-linked. Autosomal dominant inheritance is the most frequent pattern. Approximately a 100 causative genes of CMT have been reported to date [6], of which the copy number variant of PMP22 is the most common cause of CMT (followed by GJB1, MPZ and MFN2, which are responsible for 80-90% of genetically confirmed cases [7]. A number of studies have investigated the spectrum of mutations in CMT in different other ethnic groups. However, from Indian patients, a few reports are available with one or some particular genes in CMT patients [8, 9, 10,11]. Except for a study involving 22 patients with CMT, no extensive mutational analysis has been performed in CMT patients from India [12]. We aimed to investigate the clinical and electrophysiological diversity of variations, including the specific genotypes/phenotypes, in Indian CMT patients and hence provide new insights into the phenotypic spectrum of specific genetic subgroups. Results from this study provide a depiction of mutation frequencies in CMT and provides insight into the allelic spectrum of genes involved in the disorder. Methodology: Retrospective chart review of genetically confirmed cases of CMT attending the Neuromuscular clinic, Department of Neurology, National Institute of Mental Health and Neurosciences (NIMHANS), Bengaluru was done. Details regarding demographic profile- age at onset and presentation, clinical features like cranial nerve involvement, muscle weakness and wasting, sensory involvement, deep tendon reflexes and gait were collected. Family history and consanguinity were noted. Details of electrophysiological testing like Nerve Conduction Study (NCS) was collected. All the participants included in the study had undergone genetic analysis by either clinical exome or whole exome sequencing after appropriate genetic counselling. Written informed consent was obtained from all participants and in case of minors the consent was obtained from their parents on their behalf. This study was approved by the Institutional ethics committee. Functionally significant variants (missense, nonsense, exonic insertion/deletion (indel), and splicing site variants) were selected and were verified against the 1,000 genomes, EVS, gnomAD and Genome Asia 100K databases. Further, Sanger sequencing was used for segregation analysis wherever possible. Variant classification was based on the ACMG standards (Richards et al., 2015), and the pathogenic or likely pathogenic variants were identified accordingly. Result: 108 cases of CMT were genetically confirmed. Age at onset ranged from 1- 58 years (13.2+15.6 years). Age at presentation was 3-63 years (24.6+16.3). Duration of illness ranged 1-50 years (10.86 +10.8 years). Male: female ratio was 73:35. The most common mutations identified were GDAP1 (n = 15, 15.4%, 9 in a homozygous state and 6 in heterozygous, 7 mutations being novel), SH3TC2 (n = 14, 8 in homozygous state and 6 in heterozygous state, 4 novel variants), MFN2 (n = 12, all in heterozygous state, 2 novel mutations) and PMP22 (n = 10, 8 duplications, 1 deletion and 1 heterozygous missense variant). Table 1 summarises the clinical features of common genetic variants Other clinical features noted were: Retinitis pigmentosa (2 patients with PRX mutations), optic atrophy (2 patients, one case of NDUFS4 and SLC25A46 each), sensorineural hearing loss (2 cases each of SH3TC2 and PMP22 duplication), ptosis and ophthalmoparesis (3 cases of SH3TC2, 1 each of AARS, DHTKD1, HSPB8, MFN2, NDUFS4, MTMR2 and SLC25A46), tongue fasciculations (3 cases of SH3TC2, 2 PMP22 duplications, 1 HGS, 1 each of AARS, LRSAM1, MED25, MFN2 and MTMR). Table 2 gives the distribution of genetic variants Novel variants reported in more common genes were: GDAP1 (4 frameshift (c.361delG, c.497_498delAC, c.500_501delCA, c.807delA) and 3 missense variations (c.691C>T: p.Pro231Ser, c.742G>T: p.Asp248Tyr, c.818G>T:p.Arg273Leu), SH3TC2 (two frameshift (c.1096_1097delGT, p.Thr366SerfsTer5 and c.1773delG, p.Leu592TrpfsTer53) and one each of nonsense (c.1267G>T, p.Glu423Ter) and splice site (c.385+1G>A) variant) and MFN2 (c.716A>C; p.His239Pro and c.982G>A; p.Ala328Thr). Discussion This is the first study revealing the genetic heterogeneity and diverse clinical manifestations in a large cohort of Indian patients. We found 47.2% of the mutations in the CMT cohort were due to 4 genes- GDAP1, SH3TC2, MFN2 and PMP22. In a large cohort of CMT patients from UK (N = 266), 92% (244 patients) had mutations in PMP22, GJB1, MPZ and MFN2 [13]. PMP22 was the most common (168 patients). Other less common mutations identified were SH3TC2 (5), LITAF (4), NEFL (2), TRPV4 (3), GDAP1 (2), HSPB1 (2), BSCL2 and MTMR2 (1 each). PMP22 copy number variation was the most common in an Italian cohort too (38.8%), with MPZ, HSPB1, MFN2, KIF1A, GDAP1, MTMR2, SH3TC2 contributing a minority of cases [14]. A study on CMT2 patients from Taiwan found mutations in MFN2, GDAP1, AARS, GARS, HSPB1, HSPB8 and NEFL [15]. In a small series of 13 genetically confirmed cases of CMT from a cohort of 22 patients from Western India [12], 3 patients had mutations in PMP22, 2 each on GJB1, SH3TC2, HSPB1 and 1 each on SPTLC2, AARS, MPZ and NEFL. Among 128 patients with suspected genetically mediated demyelinating neuropathy, only 27 patients had PMP22 gene associated neuropathy (25 with duplications and 2 with missense mutations) [16]. This study and the current study may indicate that the genotypic spectrum of Indian population may be different from the European population. We observed a wide range of age of onset of symptoms ranging from 1-58 years and a long duration of illness ranging from 1-50 years. Interesting additional clinical features like ptosis, ophthalmoplegia, retinitis pigmentosa, optic atrophy and sensorineural hearing loss were observed in a few cases. SH3TC2 and PMP22 patients had cranial nerve involvement like ptosis, ophthalmoparesis, sensorineural hearing loss, facial and hypoglossal nerve involvement, which was concordant with previous series [16,17]. Bulbar involvement was seen in few cases of MFN2 mutations. Many underestimated associated features of CMT like cranial nerve involvement, cognitive and autonomic changes have been reported [3] and further studies in larger genetic cohorts are needed Conclusion: Conclusion This study is the first study of genotypic and phenotypic heterogeneity in a large cohort of Indian patients. It highlights a diverse genetic spectrum with mutations in GDAP1, SH3TC2, MFN2 and PMP22 dominating the clinical picture, unlike in Western population. Rare associated clinical manifestations like ptosis, ophthalmoparesis, sensorineural hearing loss, retinitis pigmentosa, optic atrophy, facial, bulbar and hypoglossal nerve involvement were found in a few patients, underscoring the diverse phenotypic spectrum associated with the disease. Novel variants were detected in many cases. This study throws light into mutation frequency of CMT in India which is different from Western populations and highlights the need for further studies in larger cohorts.


Award ID: 16
Epilepsy Profile in Children with Cerebral Palsy
Lokesh Saini, Archana K, Pradeep Kumar Gunasekaran, Prahbhjot Malhi, Paramjeet Singh, Jitendra Kumar Sahu, Naveen Sankhyan
Pediatrics, AIIMS Jodhpur, Rajasthan, India
E-mail: drlokeshsaini@gmail.com
Background and Aim: Cerebral palsy (CP), the most common motor disability in childhood, 1 is a chronic non-progressive heterogeneous group of neurodevelopmental disorders. The estimated prevalence of CP based on the population studies ranges from 1-4 per 1000 live births or per 1000 children.2–5 Although many classifications based on physiology, topography, etiology, and neuropathology are available, the widely accepted clinical functional classification of CP is Gross Motor Function Classification System (GMFCS), first proposed in 1997 and further expanded and revised (GMFCS-E&R) in 2007 by Palisano et al.6,7 GMFCS is an ordinal scale with five levels based on ambulation/mobility of CP children. CP is often associated with co-morbidities including epilepsy especially drug-resistant epilepsy, learning disabilities, feeding difficulties, behavioral disorders, visual impairment, hearing problems, and malnutrition.8 The prevalence of seizure burden ranges from 20-45% in children with CP.9–16 Among the Indian children with CP, the prevalence is estimated at 35-50%.17–19 Low birth weight, neonatal seizures, seizures during the first year of life, family history of epilepsy, and severity of CP are related to significantly increased risk of epilepsy in children with CP.12 The presence of epilepsy in children with CP carries a poor prognosis.12,18 Generalized seizures are the most common type and the incidence is higher in children with spastic quadriplegia (65-72%) followed by spastic hemiplegia (27-45%) and diplegia (20-27%).12,14,16,20 About 50-60% of the children with CP have seizure onset before 1 year of age.14,18 The currently recommended classification of epilepsy is International League Against Epilepsy (ILAE) 2017 classification.21 ILAE 2017 classification framework is designed for classifying in various clinical environments and emphasizes the need to establish the etiology due to its implications on treatment.21 The characteristics of epilepsy in children with cerebral palsy are sparsely defined in the literature and hence we aimed to address the literature gap. Methodology: This was a cross-sectional study conducted for a period of 18 months (January 2018 to June 2019) in the Department of Pediatrics at a Tertiary Care Center after obtaining ethical approval (INT/IEC/2018/000688). Inclusion criteria: Children aged 1-12 years with CP fulfilling the definition. Exclusion criteria: Children with CP aged <1 year and >12 years, and diagnostic dilemmas where it was not reliably ascertained at the time of enrolment. Consecutive children aged 1-12 years with CP were screened for eligibility and enrolled after assent/parental consent. Children were classified into various subtypes of CP. The presence or absence of seizures was noted. Seizures semiology was classified according to ILAE 1981, and 2017 classifications.21,22 The severity of seizures was assessed with the Early Childhood Epilepsy Severity Scale (E-Chess).23 For statistical analysis of data, descriptive statistics were used for baseline comparison. For categorical variables, Chi-square tests or Fisher’s Exact tests (if cell frequency <5), were used. A p-value of less than 0.05 was taken as significant. The relationship between various parameters was analyzed with bivariate analysis and Spearman’s correlation coefficient (r) was derived. Result: A total of 300 children were enrolled, out of whom 207 (69%) were males and 93 (31%) females. The Mean age of children in the study was 45.17 ± 31.12 months. Perinatal period: The majority of children i.e. 71% were >36 weeks, 15% were £32 weeks and 14% were between 33 and 36 weeks. In the study, 64% of children were small for gestational age (SGA). 211 (70.3%) were delivered by the vaginal route and 89 (29.7%) by Cesarean section. 208 (69.3%) of them had a delayed cry at birth based on history. Of them, 143 (68.8%) underwent resuscitation. 71 (23.7%) had neonatal jaundice. Of them, 68 received phototherapy, 9 required double exchange venous exchange (DVET), and 3 did not receive any intervention [Table 1]. Cerebral Palsy types: The types of CP were spastic CP (85.3%), followed by mixed CP (8.3%), dyskinetic CP (5.3%), and hypotonic CP (1%). The severity of motor dysfunction was assessed and classified age-wise according to Gross Motor Function Classification System (GMFCS). 219 (73%) had a score >=3, which indicated severe gross motor dysfunction. Seizures: Seizures, one of the major complications, were present in 79 (26%) of subjects. 89.9% of children had drug-responsive epilepsy and 10.1% had refractory epilepsy. Seizures were classified using ILAE - 1981 and 2017 classifications. ILAE 1981 classification: As per this classification, 40.5% had partial seizures and 59.5% had generalized seizures in the study cohort. Among children with partial seizures, 53.1% had simple partial seizures and 46.9% had complex partial seizures. Among the children with generalized seizures, 10.6% had myoclonic seizures, 19.1% had a tonic type, 14.9% had clonic seizures, and 55.3% had tonic-clonic type. ILAE 2017 classification: 1) Seizure type: A total of 38% of seizures were focal seizures, 57% had generalized seizures and 5% were unclassified. Among the 30 children having focal seizures, 13 (43.3%) had clonic seizures, 13 (43.3%) had tonic seizures, 3 (10%) had epileptic spasms and 1 (3.4%) had automatism. Among the 45 children with generalized seizures, 27 (60%) had tonic-clonic seizures, 9 (20%) had epileptic spasms, 8 (17.8%) had tonic seizures and 1 (2.2%) had a clonic seizure.2) Epilepsy type:30 (38%) had focal epilepsies, 45 (57%) had generalized epilepsies and 4 (3%) had combined focal and generalized epilepsy. 3) Epilepsy syndrome: The children with CP having seizures were classified under developmental and epileptic encephalopathy (DEE). 3 children had neuroimaging suggestive of genetic etiology. 4) Etiological classification: A majority (88.6%) were attributed to hypoxic-ischemic changes. Severity of Epilepsy: E-Chess (Early Childhood Epilepsy Severity Scale) score was used to assess the severity of epilepsy in children with cerebral palsy. The median value of E-Chess was 8 (4-14). Seizures and CP: Among the types of CP, 30.4% of children having spastic hemiplegia had seizures, followed by spastic quadriplegia (28.7%), spastic diplegia (26.3%), mixed type (24%), and dyskinetic CP (6.3%). The association between the presence of seizures and types of CP was not statistically significant (p = 0.388). Statistical associations of Seizures: The association between seizures and birth weight, gestational age, and mode of delivery was not statistically significant (p = 0.328, 0.402, 0.9 respectively). GMFCS score of 5 had maximum seizures (52.9%) followed by the GMFCS score of 1. The association between seizures and GMFCS score was statistically significant (p = 0.000). The association between seizures and delayed cry, sepsis, and neonatal hyperbilirubinemia was not statistically significant (p = 0.359, 0.45, 0.925 respectively). 44.8% of children who had hypoglycemia and 24.4%% of children who didn’t have hypoglycemia had seizures later in life. The association between seizures and neonatal hypoglycemia was statistically significant (p = 0.018). Children with CP whose etiology was derived to be a mismatch between clinical phenotype and history had seizures in 31.7% followed by children with HIE (28%). The correlation between seizures and the etiology-based diagnosis was not statistically significant (p = 0.108). Apart from unknown or mismatch diagnosis patterns on MRI, children with HIE patterns had maximum seizures (38.9%) and absence of seizures in children with etiology being neonatal jaundice. The association between the MRI-based diagnosis and seizures was statistically significant (p = 0.000). When the seizures and epilepsy were compared using the 1981 and 2017 ILAE classifications, it was noted that there was strong agreement between the two with the kappa value being 0.875. DiscussionIn this study, we found that the median age of presentation was 45 ± 31 months. There was male predominance in the study with a male to female ratio of 7:3. There are multiple risk factors in the causation of cerebral palsy. Prematurity is one of the most important independent risk factors for cerebral palsy. The majority of children in this study were born > 36 weeks (71%). This was similar to a study by Ozturk et al.24 in which 78% were born >36 weeks and also in a study by Rogoveanu et al.25 which had 35% of children born > 35 weeks. Children requiring neonatal intensive care admission secondary to hypoxic insult at birth can, later on, develop sepsis, meningitis, hypoglycemia, and other complications. Perinatal events studied as a risk factor for CP showed that most children had multiple risk factors. 69.3% of children had a history of delayed cry at birth. 31.7% had neonatal seizures, early-onset neonatal sepsis (EONS) was present in 20% and 6.7% of children had late-onset neonatal sepsis (LONS). 10% of the children had hypoglycemia. 71 (23.7%) had a history of neonatal jaundice; 68 of them received phototherapy and 9 required DVET along with phototherapy. Three children did not receive any intervention. In a study by Bangash et al., it was found that among the children with cerebral palsy, 50% had neonatal seizures, 40% had an infection, 30% had neonatal jaundice, and 25% had birth asphyxia.26 In our study, 85.3% had spastic CP and among the spastic type, 40.6% had diplegic CP. In an Indian study by Prasad et al., a predominance of diplegic CP (46.1%) was reported which is similar to the index study.19 In another Asian study conducted by Bangash et al. the distribution of CP subtypes was in concordance with our study.26 Major comorbidities associated with cerebral palsy are poor motor function. The motor skills were assessed according to the Gross Motor Functional Classification System (GMFCS) according to age. The majority of patients had a GMFCS of IV (51.3%). However, in a study by Oskoui et al., 40.1% of children had a GMFCS score of I.27 This can be due to a higher incidence of hemiplegic CP in their study (37.4%) and diplegic and quadriplegic CP in our study which tends to have poorer scores. Epilepsy is one of the most worrisome co-morbidity in children with cerebral palsy. 79 out of 300 children had epilepsy in the index study. Presence of epilepsy, especially if refractory has a significant impact on their global domestic abilities. The prevalence of seizures in our study was found to be 26%. In other studies conducted throughout the world, the prevalence was varying between 20-45%. The difference in the prevalence may be due to the difference in methodology for collection of data and the setting in which the children are enrolled, like general pediatric OPD, CP registries, neurology OPD, and epilepsy clinics, and also the sample size considered. In a study by Bearden et al., epilepsy was found in as high as 77% of patients.28 This may be due to the smaller sample size and there might be a possibility that at that particular cross-section the portion of CP patients having epilepsy was significantly high. In a study conducted by Singhi et al. in developing countries, it was found to be 44.4%. This study was done to assess the changes in the clinical spectrum of CP over 2 decades in northern India.17 In a systematic review by Novak et al. prevalence of epilepsy was 25%.10 Our results are consistent with this systematic review, which was pooled data from 30 studies worldwide. Epilepsy types were also classified under ILAE 2017 classification; children having focal seizures were 37%, generalized seizures were 58%, and combined focal and generalized seizures were 5%. They belonged to developmental and epileptic encephalopathy when classified under epilepsy syndrome. Zafeiriou et al. had shown that in their study children with CP had similar distribution however in their study seizures with secondary generalization were considered in both focal and generalized seizures.29 In a study by Mert et al. partial seizures were predominant (48.2%) probably because their study constituted 42.9% of spastic hemiplegics.30 In another study by Gururaj et al., only 39.3% had partial seizures and the rest had various types of generalized seizures. The varied distribution is secondary to the type of CP.31 There is a varied distribution of seizures among the type of CP. The type of brain insult determines the phenotype in CP and further the cortical injury secondary to the insult will result in epilepsy. The insult could be a malformation, hypoxic-ischemic injury leading to encephalomalacia, perinatal infarcts, hypoglycemic brain injury, etc. In the index study, epilepsy was most commonly found in spastic hemiplegia (30.4%) followed by spastic quadriplegia (28.7%). The association between epilepsy and CP type was not statistically significant (p = 0.388). The presence or absence of seizures in cerebral palsy could be explained by the presence or absence of cortical involvement. In types of cerebral palsies where cortical grey matter involvement is more, the chances of having seizures are more. However, if only white matter is affected or pathology is only restricted to deep grey matter (basal ganglia and thalamus), the possibility of having epilepsy becomes remote. For example, most children with hemiplegic CP have focal cortical loss or infarct (territorial or nonterritorial) leading to seizures. In quadriplegic CP there can be generalized cortical loss or encephalomalacia secondary to hypoxic-ischemic events during birth. The children born with prematurity have changes of periventricular leukomalacia, which doesn’t involve the cortical matter and therefore children with diplegic CP having isolated PVL changes have relatively lower chances of epilepsy. Epilepsy was less common among diplegics. In dyskinetic CP, deep grey matter is involved and therefore seizures are not a major concern to them. The prevalence of epilepsy in another study by Odding et al. was 22-40% and was found maximum in spastic hemiplegics.32 It was not consistent with another Indian study by Prasad et al., which showed the maximum incidence of epilepsy was in dyskinetic CP (83.3%) and the correlation between the two was statistically significant (p = 0.0037).19 In a study by Kakooza-Mwesige et al., it was found that maximum epilepsy was found in spastic bilateral CP (49.2%) followed by hemiplegic CP (26.2%).9 As diplegic and quadriplegic CP were combined in their study, the cumulative frequency could be spuriously more. Mert et al. showed results similar to our study in which there was no association between spastic CP and the presence of seizures.30 When GMFCS was compared with the presence of seizures, it was noted that the association was statistically significant (p = 0.000). Poorer GMFCS was found in children having epilepsy. In a study by Bearden et al., the seizure increased with poorer GMFCS, however, the association was not statistically significant (p = 0.12).28 In our study children with hemiplegic CP and spastic quadriplegia were maximum, and therefore many had a GMFCS of 1 and 5 respectively. Seizures were common between both types. Therefore, there is a significant statistical correlation between the two. In a study by Cooper et al., it was noticed that children with a GMFCS score of 1 had maximum seizures (41%), as their subtype distribution had a maximum of spastic hemiplegia (42%) compared to quadriplegic CP (5%).11 Epilepsy was classified under the ILAE 1981 and 2017 classification and was compared. In our study, epilepsy under the 1981 and 2017 classification were in high agreement (Kappa = 0.875). To the best of our knowledge, no studies are available in which both the classifications are compared in CP. 3 children who had partial seizures under the 1981 classification had secondary generalization. EEG done showed focal IED. Therefore, under the 2017 classification, they belonged to the unclassified type, i.e, focal with secondary generalization. 1 child who had generalized seizure under the 1981 classification had focal onset with secondary generalization under the 2017 classification. The rest of the seizure types were similar in both studies. However, under the 2017 classification, epilepsy type could be better delineated. The high agreement of both classifications in children having seizures in CP is because the cause for seizures is structural and doesn’t vary much in both classifications. However, 3 patients had isolated cortical malformation indicating a genetic cause thus warranting genetic workup. The 2017 ILAE classification thus empowers us to find the underlying etiology. MRI brain therefore should be done for all children with cerebral palsy in search of etiology because it can have significant prognostic and preventive value. Conclusion: The prevalence of epilepsy at the tertiary center studied is 26%. The highest incidence of seizures was in the spastic hemiplegia subtype (30.4%). The more severe the cortical damage, there is a high chance of having epilepsy. Isolated white matter or deep gray matter injuries had a less likely predisposition to epilepsy. The majority had poor GMFCS scores >3. The primary determinant of severity of GMFCS score is the type of cerebral palsy and not the presence or absence of epilepsy. In our study, epilepsy under the 1981 and 2017 classifications was in high agreement.

Award ID: 17
Post Stroke ‘Holmes – Like’ Isolated Head Tremors – A Network Localization Study
Angel T, Shaikh Atif Iqbal Ahmed, Deepti Bal, Arun Mathai Mani, Rohit N. Benjamin, Ajith Sivadasan, Vivek Mathew, Sanjith Aaron, Mathew Alexander, Prabhakar AT
Department of Neurosciences, Christian Medical College, Vellore, Tamil Nadu, India
E-mail: angel_miraclin@yahoo.com
Background and Aim: 1. Introduction An isolated HT, as sequelae of cerebral infarctions is a rare entity, with few cases and their anatomical correlates being published in literature (1). It appears to differ from traditionally described Holmes’s tremor described by Gordon Holmes in 1904 (2). Typical Holme’s tremor, with the anatomical substrate in red nucleus, occurs as a 3–4 Hz flexor-extension oscillation, present at rest and exacerbated with posture and additionally intensified with action (2). However reported cases of head tremors have documented a predominant side to side (no-no) oscillation, large amplitude and slow frequency, accentuated by erect fixed posture and persists on lying down (3). This tremor differs from the parkinsonian tremor in terms of frequency and accentuation on voluntary movements, and from essential tremors in terms of the acute onset and the variable pattern. Paramedian midbrain tegmentum lesions present with a unique array of symptoms, with a combination of ataxia, internuclear opthalmoplegia and head tremors (4). The pathogenesis appears to be a unified damage to the niagrostriatal loop as well as the rubro- olivo- cerebello - rubral loop, which results in a tremor with unique features (5). We aimed to identify the neuro-anatomical site responsible for occurrence of such tremor, using voxel-based lesion-symptom (VLSM) mapping and lesion network-symptom mapping (LNSM) methods. Methodology: 2. Methods Cases are the patients with isolated HT following stroke, and were identified from local cases seen in our center and by searching literature. Consent was obtained for the local cases and the study was approved by the Institutional Review Board. For identifying the local cases, inpatient records from January 2007 to January 2020 were searched using a computerized database, and records with a diagnosis of tremor and stroke were identified. Patients with isolated tremor were identified by reviewing their medical records and brain magnetic resonance imaging (MRI). T2-weighted sequences, fluid attenuated inversion recovery (FLAIR), and diffusion-weighted imaging (DWI) sequences were viewed and used for lesion mapping. Cases from the literature were identified through a systematic search of PubMed with search terms of “Holmes tremor” or “head tremor” and “stroke”. Inclusion criteria included patients with isolated head tremor following a brainstem stroke. Exclusion criteria included: (i) nonavailability of neuroimaging (or) (ii) poor image resolution such that lesion boundaries could not be delineated. Controls were included from local patients identified by the search who had a brainstem stroke but did not have tremor. 2.1 Lesion Localization Brain lesions were mapped onto the Montreal Neurological Institute (MNI) space manually using MRIcron (https://www.nitrc.org/projects/mricron)(6). Lesions from local cases were mapped in 3D using simultaneous axial, coronal and sagittal views. Lesions from published figures were traced in the 2D plane in which they were displayed, using neuroanatomical landmarks to accurately transfer the lesion location on to the template brain. To identify areas of lesion overlap, 2D lesions from figures were extended by 2 mm perpendicular to the plane in which they were displayed, as described previously by Boes et al. (7). 2.2 Voxel-based lesion-symptom mapping Individual lesions were entered into a voxel-based lesion-symptom mapping (VLSM) analysis using the nonparametric mapping toolbox (NPM) from the MRIcron software package (May 2016) (http://www.mccauslandcenter.sc.edu/mricro/npm/)(8). In order to increase the statistical power and to create an overlay map, all lesions were flipped onto the left side. Lesion overlap was first calculated and a color-coded overlay map of injured voxels across all patients and patients with OC was created. The statistical contribution of the lesion location to isolated HT was tested using VLSM in the NPM software. Cases with head tremors following stroke were included in the VLSM analysis. Voxel-wise nonparametric testing was done using the Liebermeister with presence of isolated tremor as the dependent variable (8). Voxels were required to be affected in at least 5 patients to be included in the test (9). To correct for multiple comparisons, all result maps were corrected using a threshold of a 1% false discovery rate (FDR)(10). The resultant statistical map was displayed on the MNI template using MRIcron. 2.3 Lesion network symptom mapping Lesion network mapping is a recently validated technique that identifies regions functionally connected to a lesion location, allowing one to localize symptoms even when lesions occur in different brain locations using normal connectome data (7). An open source normative rs-fMRI dataset assembled from the 1000 healthy Brain Genomics Superstruct Project (https://dataverse.harvard.edu/dataverse/GSP) was used for lesion network mapping (11). Pre-processing of resting state fMRI data was performed with SPM-12 (Wellcome Department of Imaging Neuroscience, London, UK) and the CONN functional connectivity toolbox (12) both implemented in Matlab R2015a (The MathWorks. Natick, MA, USA). After preprocessing, a denoising step using the CompCor method which is the default setting in the CONN toolbox was implemented. A band-pass filter of 0.008–0.09 Hz was used and a linear regression of noise sources was performed. All individual lesion maps were used as seeds in a resting state functional connectivity MRI analysis using the CONN toolbox. A connectivity r-map thus obtained for each individual lesion was converted to t- maps and thresholded at t > ±5 to create a binarized map of significantly functionally connected regions to each patient’s lesion site (whole-brain voxel-wise FWE-corrected P < 0.05; uncorrected P < 10−6)(7,13). Finally, maps from each of the patients with isolated head tremor were combined to form the lesion network mapping overlap for the group, showing the number of patients with lesions functionally connected with each individual voxel (14). Result: Results A total of 11 patients were included in the study, one patient from our centre and the remaining were identified from literature. 3.1 Case description of the patient from our centre: A 49 year old lady presented with history of acute onset diplopia with ataxia on waking up from sleep. She was transported to a health care centre, where MR imaging showed an acute infarct in the paramedian midbrain. She was given antiplatelet and was given symptomatic therapy. At discharge she had persistent horizontal diplopia with gait ataxia. On day 5 of discharge, she developed rhythmic head tremors, which was bidirectional, predominantly no –no type of movements with superimposed yes – yes movements. The tremors increase on attempting voluntary movements or assuming erect posture and regresses with persistence on lying down, disappears in deep sleep. Neurological examination revealed a left internuclear opthalmoplegia with bidirectional gaze evoked nystagmus, right pronator drift and bilateral cerebellar signs R>L. Surface Electromyography showed a rhythmic (3 – 5 Hz) tremor in the head. She was initiated on pharmacological therapy with L- dopa to which there was no response. She was initiated on a combination with clonazepam and tetrabenzine, with biofeedback to which she had mild improvement. The clinical characteristics of all the patients are summarised in Table 1. 3.2 Results the traditional voxel-based lesion-symptoms analysis. The lesion overlay map showing the location of lesion in 11 patients included in the VLSM analysis is given in Figure 1. This includes our patient, who presented to our centre with the other similar cases described in literature. The lesions were distributed across the rostral and paramedian midbrain. Figure 2 shows the statistical maps from the VLSM analysis, displaying voxels that showed a significant association between lesion location and head tremors. The colour scale indicates the z-scores from the Liebermeister test. The statistical maps were overlaid on a T1-template in MNI space (1 mm3× 1 mm3× 1 mm3). The areas mapped in red denote voxels with a statistically significant association with head tremors at a FDR level of 1%. From the location of these voxels, the corresponding anatomical site in the midbrain was identified. The MNI coordinates for the area maximally associated with head tremors was located in the rostral midbrain (MNI coordinate – 0, -17, -15) and cerebellum (MNI coordinate -18, -53, -14). 3.3 Results of the lesion-network symptom mapping Lesion-network mapping analysis showed significant connections of the rostral midbrain and cerebellum to the other areas of the cerebellum, thalamus, frontal and temporal cortex. Results of the LNSM study is summarised in Figure 3. Discussion In this study, we attempted to describe the phenomenology of symptomatic isolated HT, occurring as sequelae of vascular insult, and also map the neuroanatomical substrate of its origin and trace the circuitry. Knowledge of the same will be helpful in deciding the therapeutics, as most often they are treatment refractory. The tremor phenomenology in our patients, are slow amplitude (<5 Hz) coarse tremors which is present at rest, on movement and increases in erect posture and action with attenuation on lying down position. The median latency of tremor onset was about 3 weeks, and could be as delayed as later as 6 months. This bears some resemblance to the traditional ‘Holmes’ tremor, with some distinct features including prominent ‘no-no’ type of movement (3). Our patient had poor response to L – Dopa, as well as other drugs including clonazepam and anti- cholinergics. Varied treatment responses to L-Dopa have been reported with some showing spontaneous improvement on follow-up with a majority showing poor response to pharmacotherapy (5,15,16). The pathophysiology of these tremors appears to be due to collective malfunction of the niagrostriatal dopaminergic system and cerebellar outflow tract (4,17). The resting tremors are of striatal origin and the worsening with action/voluntary movements appears to be secondary to lack of cerebellar compensation. In our patients the lesion appears be the paramedian rostral midbrain, with the connectome not involving the striatum. There has been conflicting evidence on the involvement of niagrostriatal pathways. Remy et al. in their series of 6 patients with similar tremors of the extremity, found decreased FDG uptake in the striatum, ipsilateral to the lesion, with all patients being dopa- responsive (18). However, Gajos et al. had studied 3 patients with similar tremors involving the extremities, using the SPECT-DAT scan, and found no involvement of pre or postsynaptic niagrostriatal pathways (19). Hence there seems to be co – existence of two groups of patients with similar tremor phenomenology, but with selective involvement of the niagrostriatal pathways. Joutsa et al., had attempted to identify the neuro-anatomical substrate of Holme’s tremor circuit in 36 published cases in literature in comparison with 1000 healthy controls, using the brain connectome, interestingly none of the patients included in their analysis had isolated HT (20). They concluded that Holme’s tremors could not be localised to a particular region, but to a functionally connected circuit consisting of 8 particular brain regions involving the red nucleus, thalamus and cerebellum. Similarly in our patients with isolated HT, we find the circuit connecting the midbrain, thalamus and the cerebellum bearing resemblance to the functional circuitry of Holme’s tremor. Conclusion: In conclusion, we suggest that in patients with isolated HT, involvement of the paramedian portion of the rostral midbrain, disrupts the cerebellar outflow tracts more than the niagrostriatal system resulting in ‘Holmes – like’ tremor syndrome. In patients with midbrain infarction, the development of isolated HT can occur after a latent period ranging from 2-6 weeks. Though it remains a rare clinical entity, knowledge of this anatomical correlate can help to clinically anticipate and predict the occurrence of these tremors. The study also gives an interesting insight on the potential clinical utility of lesion mapping technology in contributing to routine clinical care.


Award ID: 18
A Study of Conduction Block, F Wave Abnormality and Autonomic Instability as a Predictor of Functional Outcome of Guillain-Barre Syndrome
Ashwin Lathiya, Maheshwari Dilip, Sardana Vijay, Bhushan Bharat
Department of Neurology, Government Medical College, Kota, Rajasthan, India
E-mail: ashwinlathiya55@gmail.com
Background and Aim: Background: Acute flaccid paralysis is most commonly caused by Guillain-Barre syndrome. Despite appropriate management it found have morbidity of up to 20% and mortality of approximately 5%. (1) Apart from various uncommon, atypical subtypes, Guillain-Barre syndrome can be subdivided into two major subtypes of acute inflammatory demyelinating polyradiculoneuropathy (AIDP) and acute motor axonal neuropathy (AMAN). (2) Researchers have correlated various clinical and electrophysiological variables with functional outcome of Guillain-Barre syndrome. In earlier studies conduction block has not been associated with poor prognosis in all types of Guillain-Barre syndrome (3,4), while other studies showed conduction block of the common peroneal nerve to be a good categorization parameter to identify a group of GBS patients at very low risk of developing respiratory failure. (5) F-wave abnormality is one of the earliest electrodiagnostic parameter to have suspicion of diagnosis of Guillain-Barre syndrome, especially AIDP subtype. Previous studies have shown its high sensitivity in diagnosing polyneuropathies (6) and its importance in prognosticating Guillain-Barre syndrome. (7) Up to seventy five percent of GBS cases can have autonomic instability including autonomic failure and its overactivity. (8) In addition to sudomotor, vasomotor dysfunction and gastrointestinal motility dysregulation, manifestations of affecting both arms (sympathetic and parasympathetic) of autonomic nervous system also includes life threatening arrhythmias. However, association of autonomic instability with functional outcome of GBS is uncertain. In our work we aim to study clinic-electrophysiological variables with emphasis on conduction block, f-wave abnormality and autonomic instability as predictor for functional outcome in Guillain-Barre syndrome. Aim: To study conduction block, f-wave abnormality and autonomic instability to predict functional outcome of GBS. Objectives:·To correlate presence of conduction block with functional outcome of GBS.·To determine presence of f-wave abnormality as a prognostic indicator of GBS. To establish autonomic instability as a predictor of functional outcome of GBS. Methodology: This study is a hospital based prospective observational epidemiological study conducted at Department of Neurology, Government medical college, Kota and attached group of hospitals which is a tertiary care hospital setting during Jan to Dec 2021. All the patients of Guillain-Barre syndrome diagnosed by Asbury and Cornblath criteria, (9) age > 10, of either sex giving consent for the study were included. Other causes of acute onset flaccid quadriparesis including hypokalemic periodic paralysis, acute intermittent porphyria, acute transverse myelitis with spinal shock were excluded. Detailed history including preceding infection, was taken and clinical examination was performed in all the patients of GBS satisfying inclusion criteria. All patients were undergone routine nerve conduction study with special emphasis on conduction block in ulnar or common peroneal nerve. F wave abnormalities were carefully looked after during nerve conduction study. Along with prolonged f-wave latencies, impersistent or absent f-wave were taken as an abnormal f-wave. According to nerve conduction study, patients were subdivided into 2 major subgroups - AIDP and AMAN. Those patient with inexcitable nerves were classified as AMAN as per Rajabally criteria. (2) Hughes disability score ranging from 0 (healthy) to 5 (required assisted ventilation) was taken as a measure of functional outcome (score ≤3= ability to walk unaided suggesting good outcome) and was assessed at time of admission and at nadir of illness and at the one month of the onset of symptoms. All eligible patients received IVIg (0.4 g/kg/day for 5 days) along with standard management after diagnostic confirmation as early as possible. During the hospital stay, along with vitals including single breath count, regular muscle power examination and autonomic instability including sinus tachycardia, sinus bradycardia, R-R interval analysis (Expiratory: Inspiratory ratio), transient or sustained hypertension, orthostatic hypotension, excessive sweating, sphincter disturbance, and respiratory paralysis requiring mechanical ventilation was assessed. Qualitative and quantitative data were analyzed using paired sample t test, independent sample t test and chi square (χ2) test respectively. p value <0.05 was taken to be statistically significant. Data were analyzed with SPSS software version 21. Result: Total fifty patients of GBS were included in analysis after excluding other differentials, of which prevalence of AIDP subtype was 70.0% while that of AMAN subtype was 30.0%. Mean age of patients was 39.77 ± 20.17 and 37.13 ± 20.06 years in AIDP and AMAN group respectively. Male: female ratio was 2.5: 1 in AIDP subgroup and 2:1 in AMAN subgroup. Antecedent infection in form of diarrhea was found in 21.87% and 53.33% of patients with AIDP and AMAN respectively. Cranial nerve involvement was more common in AIDP (25.71%) than AMAN (6.67%). Deep tendon reflex abnormality was more in AMAN (86.67%) than AIDP (77.14%). Respiratory involvement was equal in both groups, however ventilatory assistance required more in AIDP (11.42%) than AMAN (6.67%). Days of progression of illness meaning onset of symptoms to nadir was comparable in both groups. Autonomic instability was slightly higher in AIDP (37.14%) than AMAN (33.33%). While comparing conduction block among AMAN and AIDP subgroups and functional outcome at one month, it was found that patients with AMAN with conduction block had greater mean reduction in Hughes disability score at 1 month compared to patients without conduction block (1.75 ± 0.37 vs 0.64 ± 0.25, p = 0.0392) suggesting greater functional recovery at one month among patients with AMAN with conduction block. However, mean reduction in Hughes score was not different among AIDP with or without conduction block. [Table 2] Patients with AMAN with conduction block had greater mean reduction in Hughes score suggesting greater recovery at 1 month compared to AIDP with conduction block (2.3 ± 0.37 vs 0.95 ± 0.29, p = 0.0190). [Table 2] Patients with f-wave abnormality had lesser reduction in Hughes score at 1 month in both AIDP (0.6 ± 0.10 vs 1.6 ± 0.15, p = 0.0041) and AMAN (0.9 ± 0.08 vs 1.57 ± 0.09, p = 0.0351) subgroups compared to patients without f-wave abnormality suggesting poorer functional outcome among the patients with f-wave abnormality at 1 month. [Table 3] Various clinical parameters including diarrhea, upper respiratory tract infection, respiratory muscle involvement and deep tendon reflex abnormality do not differ significantly among patients with or without f-wave abnormality. [Table 4] While studying relationship of autonomic instability with functional outcome of GBS patients, it was seen that patients without autonomic instability had less severe illness at 1 month compared to patients with autonomic instability emphasizing autonomic instability as a poor prognostic factor for functional outcome of GBS. [Table 5] Conclusion: Guillain-Barre syndrome is considered as a leading cause of acute onset flaccid quadriparesis. Functional outcome of these patients depends on various epidemiological, clinical, and electrophysiological variables. After reviewing opposing results of the previous studies (3,4,5) regarding conduction block and functional outcome of GBS as a whole, we aim to study conduction block among major subtypes of GBS with its functional outcome at 1 month using Hughes score. To add further value to this study we also analyzed f-wave abnormality and autonomic instability as a variable to predict functional outcome of Guillain-Barre syndrome patients. Despite increasing prevalence of axonal variety of GBS (3) in southeast Asia we found prevalence of AIDP higher than AMAN (70.0% vs 30.0%). Mean age of the patients was 39.77 ± 20.17 and 37.13 ± 20.06 years in AIDP and AMAN respectively in our study [Table 1] which is comparable to previous studies comparing clinic-electrophysiological parameters with functional outcome by Wang YC et al. (4) and Zhang Y et al.(10) This is in contrast to the study done by Niu J et al.(11) which reported slightly higher mean age of patients (47.1 ± 14.7). We found diarrhea as an antecedent infection in 21.87% and 53.33% patients of AIDP and AMAN respectively [Table 1] which is comparable to the study done by Tian J et al. (12) reporting diarrhea in 36.2% and 9.1% respectively. While we report upper respiratory tract infection as an antecedent illness in 8.57% and 13.33% of AIDP and AMAN patients, Tian J et al. (12) report higher rate of infection (45.5% and 37.9% respectively). In our study Cranial nerve involvement was seen in 25.71% of AIDP patients [Table 1] and most common being LMN affection of facial nerve which is comparable to the Verma R et al. (3) and Wang YC et al.(4) We report abnormal deep tendon reflex in form of hyporeflexia or areflexia in 77.14% of AIDP patients and 86.67% of AMAN patients [Table 1]. Similarly Wang YC et al. (4) reported abnormal deep tendon reflexes in 87.7% of GBS patients. Twenty percent of the GBS patients had respiratory muscle paralysis in which 11.42% AIDP patients and 6.67% AMAN patients required ventilatory assistance in the present study [Table 1] which is comparable to study by Verma R et al. (3) where 16.7% patients needed ventilatory assistance. Tian J et al. (12) reported that 13.5% of AIDP patients and 5.2% of AMAN patients required mechanical ventilation at admission. Mean days of progression of illness (i.e. onset to nadir) was 6.2 ± 1.78 days in AIDP patients and 6.53 ± 1.76 days in AMAN patients in this study [Table 1] while it was 10.52 ± 5.60 in study by Verma R et al.(3) Comparing conduction block among major subgroups of GBS patients to functional outcome at 1 month showed that patients with AMAN with conduction block had greater mean reduction in Hughes disability score at 1 month compared to patients without conduction block (1.75 ± 0.37 vs 0.64 ± 0.25, p = 0.0392) suggesting greater functional recovery at one month among patients with AMAN with conduction block [Table 2]. While comparing conduction block among AMAN and AIDP subgroups, patients with AMAN with conduction block had greater mean reduction in Hughes disability score signifying greater recovery at 1 month compared to AIDP with conduction block (2.3 ± 0.37 vs 0.95 ± 0.29, p = 0.0190) [Table 2]. This could be related to transient reversible conduction block due to sodium channel inactivation at nodes of Ranvier occurring in AMAN compared to demyelination impairing impulse transmission at paranodal and internodal region which may be long lasting.(13) After immunotherapy conduction block due to sodium channel inactivation recover faster than demyelinating conduction block supporting the results of greater recovery among AMAN with conduction block. This results corelates with study by Niu J et al.(11) but contradicts with studies by Verma R et al. (3) and Wang YC et al.(4) may be related to analysis of data as a whole for GBS patients rather than correlating conduction block and functional outcome among its subgroups. So, conduction block is worth searching variable among axonal subtypes of GBS to prognosticate the illness. Patients with f-wave abnormality had lesser reduction in Hughes disability score at 1 month among both AIDP (0.6 ± 0.10 vs 1.6 ± 0.15, p = 0.0041) and AMAN (0.9 ± 0.08 vs 1.57 ± 0.09, p = 0.0351) subgroups suggesting poor functional outcome at 1 month in patients having f-wave abnormality [Table 3]. This results were comparable to study by Lee EB et al.(6) signifying f wave abnormality associated with poor functional outcome. An f-wave abnormality may arise from demyelinating conduction blocks, as in AIDP, or it may result from physiologic conduction failure at the nodes of Ranvier, as in axonal variants of Guillain-Barre syndrome (14) which later follow Wallerian degeneration influencing functional outcome of the patients. On looking relationship of f-wave abnormality with various clinical variables including diarrhea, Upper respiratory tract infection, respiratory involvement, and abnormal deep tendon reflexes, it was found that there was no significant difference among the patients with or without f-wave abnormality [Table 4]. While Lee EB et al. (6) reported correlation of abnormal deep tendon reflexes with f-wave abnormality. We found that GBS patients without autonomic instability had less severe illness at 1 month compared to patients with autonomic instability, suggesting autonomic instability as a poor prognostic marker for functional recovery at 1 month [Table 5]. This result was comparable to study by Kalita et al.(15) Up to seventy five percent of GBS cases can have autonomic instability including autonomic failure and its overactivity.(8) Dysautonomia can have a mortality rate as high as 7% in this population due to life threatening arrhythmias, so early diagnosis and appropriate management are the key to reduce mortality.(16) Positives of this study is that only few studies have compared the effect of conduction block on functional outcome among major subgroups of Guillain-Barre syndrome. This study also compares functional outcome of GBS patients with autonomic instability. However, the limitations of the study were that patients with AMAN with conduction block were very few. Dedicated laboratory testing for dysautonomia were not performed. Patients had not undergone various autoantibody levels to support diagnosis of GBS. Limited sample size and single center study. Extended follow up of the patients was not possible. Early recognition of various clinic-electrophysiologic parameters help to identify patients at risk for poor functional outcome and help to screen them for aggressive management. Larger multicenter studies with bigger sample size with correlation of conduction block other than major subgroups recommended. CONCLUSION Presence of conduction block, f-wave abnormalities and autonomic instability are associated with poor functional outcome of GBS. Early recognition of these parameters may help in classification of the patients, their aggressive management and predicting prognosis of the illness.


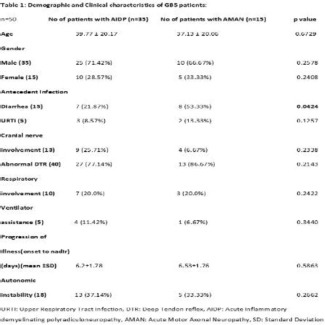
Award ID: 19
Comparative Study of Non-Motor Symptoms and their Correlation with Quality of Life in Patients of Parkinson’s Disease and Atypical Parkinsonian Syndromes
Madhusudan Tapdia, Deepika Joshi, Anand Kumar, Vijaya Mishra, Rameshwar Chaurasia, Abhishek Pathak, Varun Kumar Singh
Neurology, SSH, IMS BHU, Varanasi, Uttar Pradesh, India
E-mail: drmtapdia1991@gmail.com
Background and Aim: Parkinson’s disease (PD) is one of the most prevalent and complex neurodegenerative diseases. The diagnosis is primarily made on the basis of impaired motor functions, like rest tremor, muscle rigidity, akinesia, and postural instability. However, diverse non-motor symptoms (NMSs), such as sleep disorders, psychiatric disorders, autonomic disabilities, and sensory disturbances are also present in PD which are often responsible for the impairment of patient’s quality of life[1]. Non-motor symptoms (NMSs) frequently antedate diagnosis of motor symptoms of PD by a decade or even longer and they almost inexorably make an appearance with disease progression. They frequently come up with severe disability, impaired quality of life, and results in contracted life expectancy. In around 20% of individuals, non-motor symptoms may be first clinical manifestation of PD[2]. NMS and quality of life have inverse correlation with each other[3]. Routinely NMS are overlooked and such under recognition may lead to detrimental consequences on the quality of care since many of NMS are possibly treatable [4]. The non-motor symptoms in PD have been well studied and documented worldwide, including India[3,5]. However, they have been less well studied and described in the Atypical Parkinsonian Syndrome (APS) where they are perhaps more severe and disabling. Despite the importance of NMS in PD and APS, there are few studies which have compared the NMS between PD and APS[5,6,7] Aims -1. To assess frequency, type and severity of non-motor symptoms in Parkinson’s disease (PD) and Atypical Parkinsonian (MSA, PSP) syndrome and its correlation with quality of life (QoL). 2. The secondary objective is the comparison of NMS between PD and Atypical Parkinsonian (MSA, PSP) syndrome. Methodology: This was a cross-sectional, observational, single center study on 204 consecutive patients with Parkinson’s disease (PD), Multiple system atrophy (MSA) and Progressive supranuclear palsy (PSP) diagnosed by standard criteria [8,9,10] attending the outpatient movement disorder clinic of a tertiary care center University teaching hospital from December 2019 to December2021. The exclusion criteria of study included age <18 years, structural brain lesions -cerebrovascular disease, infectious brain lesions, post encephalitic, post anoxic injury, posttraumatic, toxic, metabolic disorders, Delirium, patients who were unable to provide information, drug induced parkinsonism, other heredodegenerative parkinsonism patients & diabetes mellitus. After explaining in their native language about the study, a written informed consent was taken from patient or guardian. Study was initiated after receiving ethics committee approval from the institution. A predesigned proforma was filled in all, which included a detailed clinical history and family history, followed by a thorough neurological examination. All patients were subjected to validated scales like : Modified Hoehn and Yahr (H&Y) [11] stage to measure disease severity which was classified as mild (1-2.5), moderate (3), severe (4-5) Movement Disorder Society (MDS) UPDRS part III[12] was used to measure motor score. Minimental State Examination (MMSE) used for assessment of patients’ mental capabilities classified into ≤24 & > 24. The non-motor symptom scale (NMSS)[13] was used to assess NMSs and was classified as mild (1-20), moderate (21-40), severe (41-70), very severe (>70)[14] QoL was evaluated by Parkinson’s Disease Questionnaire-39 (PDQ-39) questionnaire [15] Statistical analyses-Data was summarized separately for quantitative variables using measures of central tendency [mean, median and dispersion (SD)] and for qualitative variables/categorical variables using frequencies and proportions. Normality of quantitative data was checked by measures of kolmogorovsmirnov tests of normality. Discrete categorical data are presented as n (%); to compare means/medians of different variables including age, sex and duration of therapy etc., t-test and mann Whitney test was applied for normal and skewed data respectively. All statistical tests were two-sided and were performed at a significance level of p =.05. Analysis was conducted using IBM SPSS (version 23.0) Result: Two hundred fifty (n = 250) patients of various etiologies who were admitted were screened, out of which 46 patients got excluded because of exclusion criteria and 204 patients were enrolled in the study. Patients were of a significantly higher age group in PSP as compared to PD and MSA (p-0.015). Gender and Mean duration of disease was comparable among groups. Two hundred patients (98%) had at least one NMS. Patients have a significantly lower MMSE score (<24) in PSP group compared to PD and MSA (p-0.000). On Modified H & Y scale none of patients with PSP have mild grade (p-0.000). In our study 98% of population have at least one NMS and all enrolled patients of MSA and PSP have at least one NMS. [Table 1] Among PD patients most frequent NMS was difficulty in falling asleep (87.7%), followed by GIT (72.3%) & miscellaneous (59.4%). Among MSA patients most frequent NMS were urinary (100%), sexual (100%) & CVS (100%). Among PSP patients most frequent NMS was attention & mood/cognition (100%) followed by sleep (95.5%) [Table 2] Among PD patients most severely affected domain with maximum mean NMSS scores was sleep (3.93 ± 3.2) followed by GIT (3.3 ± 3.3), miscellaneous (2.8 ± 3.9), urinary domain (2 ± 2.3), sexual (1.3 ± 2), and least affected domain was perceptual problems (0.6 ± 1.5). Among MSA patients most severely affected domain with maximum mean NMSS scores was urinary (13.4 ± 2.8) followed by sexual domain (12.5 ± 4.1), CVS (7.3 ± 5) least affected domain was attention and memory (1.6 ± 1.6). Among PSP patients most severely affected domain with maximum mean NMSS scores was sleep (8.3 ± 10.7), followed by mood and cognition (8.2 ± 6.6) urinary (9.91 ± 12.95) followed by sexual (6.91 ± 8.57) least affected domain was perceptual problems (1 ± 1.6) [Table 3] Overall there is a significant strong positive correlation between NMSS score and UPDRS motor score and PDQ-39, Modified H & Y score, duration of disease (P < 0.01) [Table 4] Conclusion: Relatively sparse literature is available regarding characteristics of NMS and how they affect health-related QoL among patients with APS and their comparison with PD. For these reasons, we carried out a comparative cross-sectional study of the NMS and their impact on the Q0L of life between PD and APS patients. Non motor symptoms were more prominent and disabling in atypical parkinsonian syndromes (APS) than in patients with PD. In our study, the mean percentage score of the different NMSS domains were different in the PD and the APSPD group-This study showed a high prevalence of NMS in patients with PD (97.4%) and results are in line with previous studies by De souza et al.[16] (91.8%), Ravan et al.[17] (100%), and Krishnan et al.[3] (100%). Majority of person with PD have mild burden of NMS (60%) and only 5.2% of enrolled population have severe burden according to NMSS score. In our study most severely affected domain with maximum mean NMSS scores was sleep (3.93 ± 3.2) followed by GIT (3.3 ± 3.3) and least affected domain was perceptual problems (0.6 ± 1.5) among PD group. Sleep dysfunctions were prevalent in PD and represent an integral component of the disease, which may emerge over different phases of PD. It could be the result of the illness itself, secondary to other non-motor symptoms, or a side effect of drugs. It was severely affected domain in this study. This was in line with previous studies by Krishnan et al. [3] and Chaudhuri et al. [18] The GIT domain was second most common domain to be severely affected in present study which is line with previous study by Chandrasekaran et al. [19] Nearly all the previous studies indicated the preponderance of symptoms in the sleep, mood, memory, and urinary domains [3,18,19]. However, in our study we did find minor differences in various domains. Among PD patients all NMSS domain and total NMSS score showed a significant positive correlation with the PDQ 39 score and with duration of disease and results are in line with previous study by Pappala, et al.[20] [supplement table-1] MSA group-In this study majority of person with MSA have very severe burden of NMS (40.7%) and only 3.7% of enrolled population have mild burden according to NMSS this is line with previous study[12]. This study showed a high prevalence of NMS in patients with MSA and at least one NMS was present in all (100%) enrolled patients with MSA. Most severely affected domain with maximum mean NMSS scores was urinary (13.4 ± 2.8) followed by sexual domain (12.5 ± 4.1), CVS (7.3 ± 5) least affected domain was attention and memory (1.6 ± 1.6) results are in line with previous study by V. Kataria, V. Goyal [5]. Study by L. Zhang et al. [21] found that urinary symptoms (91.3%) are the most common NMS both in MSA-P and MSA-C patients. Similarly, Italian study among 34 MSA patients found that 91% of MSA patients have urinary symptoms.[22] In current study only small percentage of male patients have benign prostatic hypertrophy that to mild, so it’s very likely due to autonomic involvement among MSA patientsAmong MSA patient’s urinary dysfunction said to occur due to involvement of pontine micturition center, putamen, substantia nigra, sacral nucleus, frontal cortical center and postganglionic cholinergic fibers [23] Another significant finding of our study was that for all the APS NMSS scores have significant correlation with PDQ-39 and with UPDRS-III [supplement table-2]. This finding suggests that NMS are important contributing factors to health-related QoL, in APS patients, this result is in line with previous study by L. Zhang et al. who found significant correlation between NMSS scores and PDQ-39 scores among MSA patients. Similarly, Korean study also found the same results [24]. So overall study showed that NMS have a close relationship with QOL among PD patients so it is of great important to be attentive on treating NMS of PD patientsPSP Group-In present study majority of person with PSP have moderate burden of NMS (54.5%) and only 4.5% of enrolled population have mild burden according to NMSS score. This finding is in line with study by FG Radicati et al. [25] Most severely affected domain with maximum mean NMSS scores was sleep (8.3 ± 10.7), followed by mood and cognition (8.2 ± 6.6) urinary (9.91 ± 12.95) followed by sexual (6.91 ± 8.57) least affected domain was perceptual problems (1 ± 1.6). Most severely affected domain was sleep among PSP patients, this finding was in line with previous study by FG Radicati et al. sleep disturbances could be explained by considerable axial rigidity lading to difficulties in turning in night and in some study degenration of brainstem structure have been postulated as a cause of sleep interference among psp patients. [26] In present study the NMSS has also showed a higher score in mood/cognition and attention/memory domains in PSP patients. Similar results were drawn by FG Radicati et al.[25] Most of PSP patients referred deficit in the “attention/memory” domain this could be explained by slowness in processing information and dysfunctions in executive dysfunction are confirmed in lliterature. Arena et al.[27] Present study evidenced that urinary symptoms 3rd most frequent NMS domain to be involved among PSP Patients. Urological dysfunction has infrequently been studied in patients with PSP and sparse studies aimed to elucidate their etiology [28]. It has been postulated that typical of age, detrusor hyperactivity, detrusor sphincter dyssinergia and forebrain dysfunction appear to be related to these urinary disorders [29]. Our study has highlighted how salient such disorders are in PSP and it has been important to look for accurate pathophysiology of same so as to define an effective treatment among PSP patients Comparison of NMS between PD and APS-It is important to note that non-motor symptoms are heterogeneous and the domains of them are diverse. Some non-motor symptoms emerge secondary to the underlying pathogenesis of the disease, while others are recognized side effects of the treatment. In addition, they may appear before the onset of motor symptoms. These factors may explain the diversity and heterogeneity of our findings A study by v. kataria, v. goyal[5]. from India which is published as MDS abstract in 2018 enrolled 188 patients (101-IPD, 42-PSP and 45-MSA) and they found that mean NMSS score of 37.1 ± 33.1-IPD, 70.7 ± 50.7-PSP, 80 ± 43.7-MSA and concluded that the burden of NMS was worse in MSA > PSP > PD and this disorders may be recognized by prominent cardiovascular and sexual symptoms among MSA patients and attention/memory symptoms among PSP patients. Another study by a. grażyńska, et al.[6] from Poland published in 2020 enrolled 219 patients & made two groups{ IPD-184, APS-35 (Synucleinopathies-8, Tauopathies-27) } they found that sleep disorders were significantly more prevalent in patients with IPD (n = 92, 50%) than in patients with APS (n = 8, 22.86%, p = 0.0031). NMS were presented significantly often (p = 0.003) in AP patients (n = 32, 91.4%), then in patients with IPD (n = 122, 66.3%). A study by skogar and nilsson [7] from Sweden in 2018 enrolled 185 patients (73- IPD, 53-SP (secondary Parkinsonism), 59- controls) concluded that IPD and SP reported statistically more significant problems in all items compared to the controls and there were minor differences in the expression of NMS among groups. Present study enrolled total 204 (155-PD, 22-PSP,27-MSA) patients and found to have mean NMSS score of 23.7 ± 27.9-PD,47.6 ± 41.3-PSP,65.6 ± 35.5-MSA group and concluded that burden of NMS was worse in MSA > PSP > PD. Results are in line with previous study [5,22]. Thus, NMS are an an integral part of parkinsonism and affect the QoL thereby increasing caregiver burden. Many of the NMS are treatable; hence they must be identified at the earliest. The patients with APS encumber greater frequency and severity of NMS as compared to PD! NMS must be thoroughly enquired and appropriately treated to achieve patient satisfaction. Early identification and treatment of NMS will improve QoL, reducing caregivers burden. STRENGTH OF THE STUDY-1. The core aspect of this study was that good number of patients were enrolled which is comparable to other study worldwide.2. All patients were diagnosed based on standard validated criteria3. Secondary parkinsonism were excluded from study by appropriate investigations. 4. To minimize inter-operator bias, a single interviewer in a face-to-face interview administered all questionnaires. 5. This study call attention to the utility of the NMS for the early identification, quantification, and management of NMS in PD & APS. Limitations of the study-1. The single center study and participants were recruited from northern India which restricts the generalizability of our findings2. Being a cross sectional observational study a follow up could not be done which would have been more meaningful3. Being a questionnaire-based study recall bias cannot be ruled out5. PD patients outnumbered APS patient. 6. Non-motor fluctuations are now well known to occur among PD patients which may affects reporting of NMS among study group


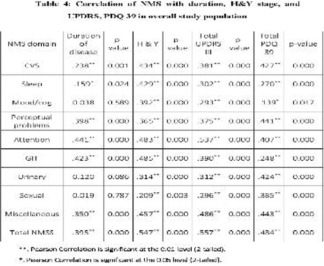
Award ID: 20
Sex Hormones and Migraine: An Acquaintance or Opponent
Vaibhav Somvanshi, Vijay Sardana, Bharat Bhushan, Dilip Maheshwari
Neurology, Govt Medical College, Kota, Rajasthan, India
E-mail: vaibhavsomvanshi@gmail.com
Background and Aim: Background Epidemiological evidence favours the clinical sense that migraine is largely a condition of females. Although migraine has an equal frequency in both sexes before puberty, but there is higher female prevalence in maturity.(1) This female preponderance tendency grows with age, culminating early in the fifth decade of life (2) followed by diminishing.(2,3) Some research estimate that the lifetime prevalence of migraine in females is 25 percent, compared to the males having just 8 percent.(4) This divergent tendency for the sex during the reproductive years is generally a manifestation of the additional trigger of undulating hormone levels during various periods of the menstrual cycle, a relationship that has long been documented. Migraine and menstruation relationship observed in more than 50 percent of females with migraine, both in the general community and patients presenting to headache clinics.(5,6) Migraine previously was assumed to be neurosis which was more frequent in young ladies. So, it was claimed to be a hysterical disease and marriage is advocated as a remedy.(7) The average duration of the menstrual cycle is 28 days—calculated from the first day of the monthly period to the commencement of the next—but the length is famously fluctuating, mostly owing to an erratic follicular phase. The menstrual cycle is separated into four stages: menstruation phase, follicular phase, ovulation, and luteal phase. Initially, progesterone insufficiency during the luteal phase was also connected to produce migraine episodes related to menstruation but no research corroborate this hypothesis.(8-10) In contrast to estrogen insufficiency association with episodes of migraine without aura (M-A), the high plasma level of estrogen is owing to attacks of migraine with aura (M+A). Women with pre-existing M-A may experience any form of aura for the first time during pregnancy.(7) Sufficient amount of serious discussion has previously been done over whether M-A and M+A are independent entities.(11-15) Studies showing regional cerebral blood flow (rCBF) measurement in acute migraine demonstrated widespread hypoperfusion in M+A but not in M-A patients, suggesting a pathophysiological dissimilarity.(16,17) For clinical practice and epidemiologic research reasons, recollection of features of pain and concomitant symptoms (nausea, sensitivity to light, aura) aid in establishing the diagnosis of different headache conditions. Migraine is a very complicated disorder, with yet contested perplexing physiopathology with the involvement of several neurotransmitters and hormones.(18) Some writers postulated that dopamine receptors hypersensitivity based on the data that migraine sufferers displayed greater prolactin levels after taking dopaminergic medications as compared to control. Earlier, it was considered that headaches associated to pituitary tumors connected only to the bulk impact of the tumor and to dural stretch.(19) However, Levy et al. reported that individuals with microadenomas may get a severe debilitating headache as contrasted to people with huge macroadenomas who don’t have any form of headache at all.(20) This opens up new gates for the potential of causation other than only the mass effect of tumors according to type and degree of headache. Smoker ladies were shown to have greater plasma testosterone (21), and non-smoker females do have lower free estradiol levels.(22) Women who are alcohol drinkers were shown to have elevated levels of estrogen and low level of progesterone as compared to non-consumers.(23) Variables determination owing to migraine is surely not an easy work; considering all the factors described above, we may conceive of the potential that certain hormones and lifestyle choices, to some extent, could have a heroic part in etiopathogenesis. Aim:- To study relationship of hormonal profile in migraine with and without aura Objectives:- 1. To evaluate correlation of various hormone level with type of headache 2. To evaluate impact of lifestyle habits on various hormone level and type of headache 3. To evaluate correlation of regularity of menstrual cycle with type of headache Methodology: A observational, cross-sectional hospital based single-center cohort study conducted in a neurology department of Government medical college, Kota which is tertiary care center setting with help of biochemistry department for assessment of different hormone level in addition to neurological evaluation. Study was initiated only after institutional ethics committee authorization was obtained by the investigators. Patients of either gender between the age of 30 years to 45 years presenting with headache to the headache clinic in the department of neurology at the tertiary care teaching hospital were screened for enrollment in the research. All were enrolled in this study on getting written consent and meeting inclusion criteria. Patients grouped in category of migraine with or without aura (30-45 yrs old) on the basis of fulfilling ICHD-3 criteria. Total 40 patients were included after screening on the basis of inclusion and exclusion criteria and separated in three categories on the basis of type of headache (migraine without aura, migraine with aura and other type of headache) (migraine without aura, migraine with aura and other type of headache). Relationship between different hormone levels (Estrogen, Progesterone, Testosterone, Prolactin, FSH, LH, TSH) with type of headache studied using proper statistical tools to establish the amount of correlation and depicted by graphs. Menstrual cycle regularity and other lifestyle behaviors association with type of headache and various hormone levels are also investigated. The quantitative characteristics were compared between different types of headache group using one-sample t test and independent-sample t test. The qualitative metrics were compared across groups using chi-square test and ANOVA (Log-linear regression) (Log-linear regression). Significance threshold (alpha) retained 5 percent in the statistical tests. Correlations of lifestyle habit with different hormone level and group of type of headache with various hormone level was also done using Pearson’s correlation coefficient test. All p-value <0.05 were deemed as statistically significant. SPSS (Statistical Package for the social sciences) version 22 analytic tool was utilized for data analysis. Result: Forty participants fulfilled the screening criteria were included in the final analysis. Twenty-seven females and thirteen males, with mean age of 36.2 ± 4.33 M+A group, 37 ± 5.43 M-A and 36.2 ± 2.58 years other type of headache group were studied over a period of 1 year. Most of the M+A patients found to have onset during early days of menstruation (41.18% perimenstrual, 35.3% first 3 days of menstrual period) and most of M-A patients (57.14%) found to have onset near to ovulation day (14 days prior to menstruation) with p-value 0.021 which is statistically significant. [Table 1] Majority of migraine with and without aura patients were found to have regular menstrual cycle (M+A; 71.43%, M-A; 82.35%) but all other type of headache patients have irregular menstrual cycle which is statistically significant (p = 0.016). [Table 1] Alcohol consumer M+A patients (63.63%) are statistically significant as compared to M-A patients (20.83%) (p = 0.011). [Table 1] During detailed history, various factors were asked that leads to change in headache frequency. Participants enquired regarding frequency of headache during previous pregnancy, during use of COC pills in past, during hormone replacement therapy (HRT) in past. Frequency of attacks, which is described as a number of days with migraine per month. Forty percent participant responded with decreased and 30% with disappeared headache during previous pregnancy and 20% do not find any change in headache frequency but 10% participants faced worsening of headache frequency with statistically significant p-value which is 0.03. Majority of M+A patients (71.4%) had headache completely resolved and 54.5% M-A patients had headache with decreased frequency but all patients with other type of headache had no change during previous pregnancy with statistically significant p-value (0.008). [Table 2] Forty five percent participant responded with decreased and 25% with disappeared headache during COC pills use in past and 10% do not find any change in headache frequency but 20% participants faced worsening of headache frequency with statistically significant p-value (0.04). Majority of M+A patients (57.1%) had worsened headache but 72.7% M-A patients had headache with decreased frequency with 50% patients with other type of headache had no change during COC pills use in past with statistically significant p-value (0.006). [Table 2] Participants were asked about their lifestyle habits and their responses correlated gender wise with the hormone level to look for the impact of habits over hormone level. The majority of smokers (75%) were found to have low estrogen level with Pearson’s correlation coefficient (r = -0.57) and statistically significant p-value (0.001). Majority of female smokers (76.9%) found to have low estrogen level with Pearson’s correlation coefficient (r = -0.49) and statistically significant p-value (0.034) but the majority of male smokers (70%) found to have normal estrogen level which is statistically non significant (p = 0.064). [Table 3] The majority of alcohol consumers (58%) were found to have high estrogen levels with Pearson’s correlation coefficient (r = 0.41) and statistically significant p-value (0.002). Majority of female alcohol consumer (55.5%) found to have high estrogen level with Pearson’s correlation coefficient (r = 0.46) and statistically significant p-value (0.011) but majority of male alcohol consumers (70%) found to have normal estrogen level which is statistically non significant (p = 0.064). [Table 3] All male participants, irrespective of their alcohol consumption habit status found to have normal FSH levels with Pearson’s coefficient (r = 0.752) and statistically significant p-value (0.003). [Table 3] All male participants irrespective of their alcohol consumption habit status found to have normal LH levels with Pearson’s coefficient (r = 0.607) and statistically significant p-value (0.028). [Table 3] In all forty participants various hormone level gender-wise assessment done and inference drawn statistically. Majority of M-A patients (66.6%) has low and 81.8% M+A patients has high estrogen level and amongst other type headache category 80% found to have normal estrogen level with Pearson’s correlation coefficient (r = 0.386) and statistically significant p-value (0.001). [Table 4] Among female participants majority of M-A patients (82.3%) has low and 85.7% M+A patients has high estrogen level and all other type headache patients found to have normal estrogen level with Pearson’s correlation coefficient (r = 0.419) and statistically significant p-value (0.001). [Table 4] Majority of M-A patients (87.5%) has normal and 63.6% M+A patients has high prolactin level and amongst other type headache category 80% found to have high prolactin level with Pearson’s correlation coefficient (r = 0.486) and statistically significant p-value (0.001). [Table 4] Among male participants all M-A patients has normal and 50% M+A patients has high prolactin level and all other type headache category found to have high prolactin level with Pearson’s correlation coefficient (r = 0.710) and statistically significant p-value (0.016). [Table 4] Among female participants majority of M-A patients (82.3%) has normal and 71.4% M+A patients has high prolactin level and amongst other type headache category 66.6% found to have high prolactin level with Pearson’s correlation coefficient (r = 0.484) and statistically significant p-value (0.024). [Table 4] Discussion Migraine is a very important public health concern leading to overall hindrance in marriage partnerships owing to the quality of life worsening. The mean age was found to be statistically comparable between all three groups (p > 0.05). The gender distribution was reported to be statistically equivalent amongst the groups (p > 0.05), with females being prevalent in all study groups (63.6 percent in M+A group, 70.8 percent in M-A group and 60 percent in other headache group). This showed a baseline-matched comparison between the groups was possible. Overall, 32 percent male and 68 percent female subjects were included in this study. In prior investigations, ladies were shown to be three times more typically afflicted in compared to males. (4) These findings were also reproduced partially in the present investigation. Table 5 shows a comparison of demographic characteristics with similar research. All the similar studies involving Headache patients had an equal mean age, and practically all studies had a female majority, identical to the present study. Migraine episodes in certain women have a closely knit relationship with menstrual timing (29, 30). Migraine is more frequent in the female gender as compared to males with onset predominantly perimenstrual or early menstrual phase as indicated in our study. The major goal of this study was to evaluate the impact of hormonal alterations in both M+A and M-A to discover if the two groups of migraine patients had any association to various hormones. In our study, majority of the subjects have a normal menstrual cycle in both migraine with and without aura group with a statistically significant p-value. In our study most of those participants who were using alcohol were found to be suffering from M+A and those who weren’t, found to be suffering from M-A with a statistically significant p-value. Although the quantity and kind of alcohol consumption association is out of scope of our study. The majority of individuals were non-smokers and non-tobacco chewers in our research. Pregnancy in women’s life brings chaos to the hormone level and thus has an influence on numerous ailments. In our study, individuals who had even one pregnancy in the past reported improvement or absence of migraine during pregnancy which was substantially more frequent than deterioration in both M+A and M-A patients. In one research, both M+A and M-A group patients during pregnancy substantially exhibited improvement. (31) We also observed that COC tablets consumption in the past impacted both groups of migraine. A worsening of headache during COC pills usage was shown to be much more frequent in M+A and improvement in M-A patients, while some research showed that the use of COC pills don’t have an influence on the course of migraine in both M+A and M-A patients. (32, 33) So, It appears that impact of COC tablets differs for the course of migraine separately. In our study, individuals with a history of HRT (for treatment of hot flushes prescribed by a gynecologist) consumption didn’t notice any statistically significant difference in headache frequency during the therapy. Lifestyle choices has a substantial influence on different hormone levels irrespective of sex. In our investigation, smokers especially females discovered to be having reduced estrogen levels as compared to non-smoker females as previously described in Ruan X et al. study. (34) Participants who were consuming alcohol, especially the female gender, discovered to have increased estrogen levels compared to non-consumers, as previously mentioned in purohit V et al. research.(35) Rest examined hormone levels were discovered to be having no statistically significant link with any of the lifestyle practices questioned in this investigation. Estrogen hormone is assumed to play a large impact in the pathogenesis of migraine with and without aura. In our study majority individuals of M-A group were found to be having statistically significant low estrogen levels as contrasted to the M+A group, who were found to be having high estrogen levels. Similar tendencies were detected in female patients of both the groups whereas male participants had normal estrogen levels in the M-A group and excessive levels in the M+A group. Epstein and co-workers observed that the fall in estrogen level was larger in women with migraine as compared with the control group who did not have migraine. (36) Prolactin hormone is hypothesized to play a role in headache phenotypic change via dopamine modulation with linkage shown in pituitary microadenoma (prolactinoma) patients. In our study, the majority of M+A individuals (both male and female) were found to be having statistically significant high prolactin levels as opposed to M-A participants found to be having normal prolactin levels. Testosterone hormone’s involvement in migraine pathogenesis is not substantially explored and has yet to be established. Glaser R et al. in a pilot trial, stated that subcutaneous testosterone implant with continuous release in blood was helpful in lessening the intensity of migraine headaches however in our investigation, we didn’t detect any link of testosterone hormone level with any of the migraine categories.(37) In our study, we evaluated the link of various hormone levels with different types of migraine categories but didn’t discover any statistically significant correlation of progesterone, FSH, LH, TSH hormone levels with all three study groups. Though the study featured several good features as well as diverse elements, there were a few shortcomings as well. The sample size was modest, most of the information was gathered from patient memory and the study was done at only one site. Further research with greater sample size and multicenter population-based methodology might offer more clarity in the links between hormone-related occurrences in M+A and M-A group of patients. Similar data might be utilized to diagnose migraine patients with high sensitivity to physiological, pathological, or pharmaceutical hormonal variations. This study could enhance the selection of the target population for a given treatment or diagnostic method and study design for future investigations. Conclusion: Hormones particularly estrogen plays a key impact in migraine with and without aura specifically in females. Migraine without aura patients can be addressed with estrogen level supplementation while migraine with aura could be managed with estrogen antagonist to bring estrogen level in normal range. Higher prolactin levels, both male and female consistent with migraine with aura disorders and can be utilized as a diagnostic tool with therapeutic implications. In this study, menstrual cycle irregularity was detected mostly in other type of headaches rather than migraine. Lifestyle habits in form of alcohol consumption preferably led to female predominant migraine with aura which is associated with high estrogen levels and female smokers who were suffering from migraine without aura discovered to have low estrogen levels. So, lifestyle modification can make a substantial influence on decreasing the illness burden of communities. Although bigger randomized double-blind controlled trials are needed to approve this conclusion.


Award ID: 21
Neurodevelopmental Outcomes of a Cohort of Children Diagnosed with Tuberous Sclerosis Complex and Epileptic Spasms
Lokesh Saini, Swetlana Mukherjee, Pradeep Kumar Gunasekaran, Prahbhjot Malhi, Arushi Gahlot Saini, Dipankar De, Jitendra Kumar Sahu, Naveen Sankhyan, Rajni Sharma, Indar Kumar Sharawat
Pediatrics, AIIMS Jodhpur, Rajasthan, India
E-mail: drlokeshsaini@gmail.com
Background and Aim: Tuberous Sclerosis Complex (TSC), also known as “Bourneville disease” was first described by Désiré-Magloire Bourneville, a French neurologist in 1880.[1] TSC has an Autosomal Dominant (AD) mode of Mendelian inheritance arising from mutations in TSC1 (OMIM* 605284) on chromosome 9q34.13 encoding hamartin and TSC2 gene (OMIM* 191092) on chromosome 16p13.3 encoding tuberin, both involved in the regulation of cell division and proliferation.[2,3] These inactivation mutations result in loss of mTOR inhibition signaling cascade leading to the formation of hamartomas.[4] The incidence of TSC is estimated at 1 per 6000 to 1 per 10,000 live births and the overall prevalence is estimated at 1 in 20,000.[5] In TSC, epilepsy often develops in the first few months of life and occurs in up to 90% of patients.[6] Early-onset seizures in TSC with infantile spasms, in particular, are associated with increased risk for poor long-term outcomes in terms of neurodevelopment disorders including Autism Spectrum Disorder (ASD), Attention Deficit Hyperactivity Disorder (ADHD), Intellectual Disability (ID), and also behavioral problems.[7,8] For epileptic spasms with TSC, vigabatrin is FDA approved first-line recommendation as monotherapy for 1 month to 2 years of age.[9] Early diagnosis and interruption of epileptic spasms at the very onset with vigabatrin prevents subsequent epileptic encephalopathy and reduces the risk of poor neurodevelopmental and behavioral outcomes but does not assure a normal cognitive outcome in the children with TSC.[10] However, the neurodevelopmental outcomes remain underdiagnosed and represent significant morbidity and mortality burden. This study aims to determine the long-term neurodevelopmental outcomes in children with epileptic spasms in TSC. Methodology: This was a Prospective Observational study conducted over a period of 18 months (January 2018 to June 2019) in the Department of Paediatrics at a tertiary care center obtaining approval from the Institute’s Ethical Committee (INT/IEC/2018/000349). Consecutive children having Tuberous Sclerosis Complex with epileptic spasms aged between 1 and 15 years attending the Paediatric Epilepsy Clinic were screened for eligibility. The basic demographic data were recorded in a pre-structured proforma. Children fulfilling the inclusion criteria were assessed with the American Psychiatric Association’s “Diagnostic and Statistical Manual of Mental Disorders - 5” (DSM-5) criteria for Autism Spectrum Disorder (ASD), Attention Deficit Hyperactivity Disorder (ADHD), and Intellectual Disability (ID).[11] Intelligence quotient (IQ) was assessed by using Malin’s Intelligence Scale for Indian Children (MISIC)[12] or Development quotient (DQ) using Development Profile 3 (DP3) [13] was done. Behavioral disorders were assessed by using Childhood Psychopathology Measurement Schedule (CPMS) [14]. Result: Demographic profile: A total of 72 children with Tuberous Sclerosis Complex (TSC) were assessed and 30 children with TSC with epileptic spasms were included in the study. In the study cohort, 16 (53%) were male and 14 (46%) were female. [Table 1] Epileptic Spasms: The median age of onset of epileptic spasms was 6.5 months (range: 1 month to 12 months). However, the median age at the time of enrolment in the study was 5 years (range: 1 year to 15 years). Among the 30 children with TSC with epileptic spasms, 23 (76.7%) children fulfilled the criteria for West syndrome. Neurodevelopmental profile and Behavioral problems: Neurodevelopmental disorders were assessed using DSM-5 criteria at the time of enrolment, no child had isolated Autism Spectrum Disorder (ASD), 2 (6.7%) children had isolated Attention Deficit Hyperactivity Disorder (ADHD), 15 (50%) children had isolated Intellectual Disability (ID), 4 (13.3%) children had ASD and ID, 3 (10%) had ADHD and ID, and 6 children had none of the neurodevelopmental disorders. 23 (76.7%) children had ID either isolated or with other co-morbid neurodevelopmental disorders [Figure 1]. Intelligence quotient (IQ) testing by using Malin’s Intelligence Scale for Indian Children (MISIC), Development quotient (DQ) testing using Development Profile 3 (DP3) revealed a median IQ/DQ score of 60.5 (range: 20-105). Behavioral disorders assessment by Childhood Psychopathology Measurement Schedule (CPMS) revealed a clinically significant behavioral abnormality in almost half of the children with TSC with epileptic spasms. Treatment profile: Among the study cohort of 30 children, 21 (70%) had received Vigabatrin. The median duration of receiving Vigabatrin treatment was 2 years (range: 6 months to 3 years). At the time of enrolment in the study, 10 (33.3%) children had drug refractory epilepsy. Outcome profile: Of the 30 children, 8 (26.7%) children were completely seizure-free for at least 2 years. 8 (26.7%) children currently had generalized tonic-clonic seizures, 11 (36.6%) children had focal seizures, and 3 (10%) children had evolved into EEG findings suggestive of Lennox-Gastaut syndrome [Table 1]. DiscussionThe association of early-onset epilepsy in TSC, particularly infantile spasms and intellectual disability was although documented before, was well established by Webb et al. in a population-based prevalence study and found that the prevalence of infantile spasms was more in males (33%) than females (18%) with a peak age of occurrence at 4 months.[15] There was a significant association of learning disorder and infantile spasms (p < 0.0005) and also with poor seizure control (p < 0.01). In patients with TSC, different seizure semiologies are known to occur, however, early-onset seizures with infantile spasms, in particular, are associated with increased risk for poor long-term outcomes and the prognosis of the cognitive outcome also depends on the age at onset of spasms. In a study by Riikonen et al. on the outcomes for 24 children with TSC with infantile spasms, the short-term outcome seemed favorable but the long-term outcome was worse, as all had intellectual disability, and most had behavioral abnormalities.[7] In the index study, 2 had isolated ADHD, 15 had isolated ID, 4 had ASD and ID, 3 had ADHD and ID. A total of 23 (76.7%) children had intellectual disability either isolated or with co-morbid neurodevelopmental disorders such as ASD and ADHD, underscoring the higher prevalence of intellectual disability in children with TSC with epileptic spasms. Though 6 children did not have any neurodevelopmental disorders, they were not neurologically symptom free, of which 3 children had persistent seizure activity. The median IQ/DQ score was 60.5 (range: 20-105). There were clinically significant behavioral abnormalities in almost half of the children with TSC with epileptic spasms. In children with TSC with epileptic spasms, vigabatrin is the recommended first-line monotherapy. In a study by Clement et al. on the vigabatrin therapy for 21 children with TSC with epileptic spasms, tonic seizures, and status epilepticus, the mean age at vigabatrin initiation were 48 months (median-27, range: 13-219 months), mean duration of receiving vigabatrin was 15 months (range: 2-33 months).[9] In this study, response to therapy was assessed in children with epileptic spasms, 8 were seizure-free and 2 had more than 90% improvement, but not seizure-free and 1 had no improvement. In the index study, 8 children were completely seizure-free for at least 2 years on treatment, 3 children had evolved into Lennox-Gastaut syndrome, 11 children had focal seizures, and 8 children had generalized tonic-clonic seizures. Prompt treatment aimed at the control of epileptic spasms at the earliest with vigabatrin aids in reducing the risk of subsequent epileptic encephalopathy and thereby improving the neurodevelopmental and behavioral outcomes however a normal cognitive outcome cannot be guaranteed. Although our study represents a significant cohort of children with TSC with epileptic spasms in the Indian population, the sample size is small to derive conclusions and further multicentric studies are required with large sample sizes. Conclusion: A high proportion of neurodevelopmental disorders including ASD, ADHD, ID, and behavioral disorders are seen in children with TSC with epileptic spasms. Hence, the occurrence of epileptic spasms in children with TSC hampers long-term neurodevelopmental outcomes. Children with TSC with epileptic spasms usually require vigabatrin for longer durations when compared to children with TSC without epileptic spasms. Our study underscores the need for treatment initiation at the earliest onset of spasms to have favorable long-term neurodevelopmental outcomes and we also emphasize the necessity for further studies in larger cohorts.


Award ID: 22
Guillain-Barré Syndrome in the Era of COVID-19: New Lessons Learnt
Lokesh Saini, Deepthi Krishna, Sarbesh Tiwari, Jagdish Goyal, Daisy Khera, Bharat Choudhary, Kuldeep Singh, Siyaram Didel, Pradeep Kumar Gunasekaran, Veena Laxmi, Samhita Panda
Pediatrics, AIIMS Jodhpur, Rajasthan, India
E-mail: drlokeshsaini@gmail.com
Background and Aim: In December 2019, the first case of severe acute respiratory syndrome coronavirus 2 (SARS-CoV-2) was reported (1). COVID-19 was declared a public health emergency of international concern on January 30, 2020, and WHO declared COVID-19 as a pandemic in march 2020. It has been more than two years since the SARS-CoV-2 pandemic began. Following the second wave, there has been a surge of neurological disorders in children, especially immune-mediated disorders including Guillain-Barré syndrome (GBS) (2). GBS, the most common cause of acute flaccid paralysis (AFP), is an immune-mediated polyradiculoneuropathy with varied clinical manifestations. The usual presentation is with acute symmetric ascending flaccid paralysis and areflexia (3). The pathophysiology in GBS is the post-infectious immune-mediated generation of antibodies that cross-react with gangliosides in peripheral nerve membranes resulting in destruction (4). This is mainly triggered after respiratory illness or gastrointestinal illness. A rising number of cases during the pandemic may raise the concern of SARS-CoV-2 as a trigger for GBS (5). There is an increase in reporting of unusual presentations of known immune-mediated neurological disorders including GBS. One thing which was common to most of these reports is significantly raised inflammatory markers and cytokine storm. Only a few studies regarding the GBS in adults following the COVID-19 infection are available; however, there is a dearth of literature regarding the same in children. Multiple single case reports of children presenting with GBS following SARS-CoV-2 infection are available, suggesting SARS-CoV-2 infection as a trigger for GBS (6–9). Our study aimed to describe the pattern and presentation of GBS and also the outcome of GBS in the era of COVID-19. We also tried to look into the utility of Neuroimaging as an upfront diagnostic modality in our cohort. Methodology: Retrospective data from May 2021 to January 2022 was collected, including all children aged from 1 month to 18 years of age who were admitted to the department of pediatrics in a tertiary care center, with the diagnosis of GBS or its variants. The study was conducted after obtaining ethical approval from the Institute Ethics Committee. Our study aimed to define the varied presentations of GBS in the era of COVID-19 and its outcome. A predesigned proforma was made, and details including demography, clinical manifestation, h/o SARS-CoV-2 infection or exposure, investigations, treatment, and outcome were recorded. The GBS diagnosis was further classified into subtypes including, acute motor axonal neuropathy (AMAN), acute inflammatory demyelinating polyradiculoneuropathy (AIDP), miller-fisher syndrome (MFS), polyneuritis cranialis variant, and descending variant of GBS. The Hughes disability scale (10) was used for disability assessment during the hospital stay. Children were followed up at regular intervals and assessed for improvement, using the modified Rankin scale (11). Result: Demographics and clinical presentation: Nineteen patients admitted from May 2021 to January 2022 with a diagnosis of GBS or its variants in the department of pediatrics were enrolled in the study. The mean age was 8.14 years (range: 1-17 years). Among the 19 children, 9 (47.36%) were females, and 10 (52.63%) were males. Only one patient previously had a history of a similar illness four years back, which gradually recovered in 6 months. The rest had no pre-existing neurological disease or any other comorbidity. The SARS-CoV-2 serology test was done in all 19 patients; 11 tested positive with very high titers of COVID-19 antibodies. The cohort was further divided into two subgroups based on the serology; Group A consisted of children with negative SARS-CoV2 serology, and Group B included those with positive serology. The demographic details, clinical course, and outcome of both groups are depicted in Table 1. The most common presentation in both groups was motor weakness. In group A, all the eight children presented with weakness which included quadriparesis in 5, upper limb predominant weakness in 1, and lower limb predominant weakness in 2 children. However, in group B, 8 out of the 11 children (72.72%) presented with weakness. Among the 8 children, quadriparesis and upper limb predominant weakness were noted in 3 each, and two children had lower limb predominant weakness. The other prominent manifestation in group B was the involvement of cranial nerves, i.e., 5 had facial nerve involvement, 3 had ophthalmoplegia, and 2 had bulbar palsy. Whereas three children from group A had only lower motor neuron type of facial nerve involvement. The other symptoms included ataxia and paresthesia. GBS and its variants: Seven out of the eight children in group A had classical GBS, and 1 had a descending variant of GBS. However, in group B, four children had classical GBS, and seven children had presented with GBS variants, including polyneuritis cranialis variant of GBS in 4, descending variant of GBS in 2, and Miller Fischer variant of GBS in 1 child. Therefore, those with COVID serology positive (Post Covid GBS) presented with variants of GBS rather than the classical symmetric ascending type of GBS, and this association was found to be statistically significant. Hughes GBS disability score: Hughes GBS disability score (maximum) in our cohort ranged from 2-5, i.e., four children had a score of 3-4, and four children had a score of 5 in group A. Whereas, 3 had a score of 2, 4 had a score of 3-4, and 4 had a score of 5 (requiring ventilatory support) in group B. Investigations: Inflammatory markers like C-reactive protein, and Interleukin-6 were done in all children; we found elevated inflammatory markers in 6 children in group B and none in group A. Nerve conduction studies (NCS) could be done in all patients. 13 had the demyelinating variant, 5 had the axonal variant, and one child had uncharacterizable NCS. Lumbar puncture could be done in all (19/19) patients; all had albumino-cytological dissociation. Neuroimaging (MRI) was done in all children, which was not only helpful in diagnosing but also ruling out other etiologies, especially in the case of variants. Those with classical and descending variants of GBS had gadolinium enhancement of ventral nerve roots and cauda equina nerve roots. Also, those children with polyneuritis cranialis variant of GBS had enhancement of cranial nerves. Clinical course: In our study, 8/19 children were admitted to the pediatric intensive care unit (PICU), and all eight children required ventilatory support. Among the 19 children, 6 had autonomic dysfunction (two from group A and four from group B), one child from group B had syndrome of inappropriate antidiuretic hormone (SIADH), and the same child had posterior reversible encephalopathy syndrome (PRES) and reversible cerebral vasoconstriction syndrome (RCVS) due to fluctuation in blood pressure, thus leading to increased morbidity. Treatment: All children received IVIG as per treatment protocol. However, three children received 2nd dose of IVIG in group B compared to one in group A, and two children (1 from each group) required plasma exchange as there was no significant improvement; apart from the treatment protocol, those with elevated inflammatory markers in group B and who responded poorly to IVIG were also treated with pulse steroids (5/11), following which they showed brisk recovery, probably depicting an inflammation predominant pathology. Apart from the above treatment, one child in group A required cyclophosphamide, however in group B, two children received cyclophosphamide, and one child required rituximab, because of unsatisfactory treatment response. Outcome and Follow-up: Children were followed up at regular intervals and assessed for improvement, documented by a modified Rankin scale. At three month follow-up, 7 out of 8 children in group A had a score of 0-1, and 1 had a score of 2-3. Whereas 9 out of the 11 children had a score of 0-1, 1 had a score of 2-3, and 1 child had a score of 4 which was due to complications of GBS (autonomic dysfunction). There was no mortality in our cohort. Discussion: The neurological manifestations of COVID-19 infection are similar to those of other infections in that they can be the result of either direct injury (due to neurotropism) that manifests during acute infection as hypogeusia, headache, hyposmia, and dizziness, or an immune-mediated phenomenon that results in the central nervous system and peripheral nervous system injury as in GBS, encephalitis, demyelinating disorders and many more. In our cohort, we found that the children with positive SARS-CoV2 serology presenting with variants were more than classical GBS. Variants included were the miller Fischer variant, polyneuritis cranialis variant, and a descending variant of GBS. A systematic review done by Abu-Rumeileh et al., which included 73 patients of GBS associated with COVID-19 aged from 11-94 years, concluded that the most common presentation was a classic sensorimotor variant, even though few other variants were also reported (12). A systematic review by Sansone et al. reported that the demyelinating variety was more common in western countries; however, a quarter of patients had the MFS variant of GBS (13). Our study also highlights the role of neuroimaging in diagnosing GBS cases. GBS is a clinical diagnosis, which is further supported by lumbar puncture and NCS. However, when a child presents with manifestations apart from classic symptoms of GBS (symmetric ascending flaccid paralysis), neuroimaging may be of value both to confirm the diagnosis of GBS and simultaneously exclude the other differentials, which commonly arise whenever we encounter an uncommon variant of GBS. In our study, MRI was done on all the patients. Those who had classical GBS revealed post gadolinium enhancement of ventral nerve root. In patients with polyneuritis cranialis variant, enhancement of involved cranial nerves was also noted. IVIg was used as the first line of management in all the children; those who had poor response were either given a second dose of IVIg or plasma exchange was tried. We also used pulse steroids in our study apart from the IVIg and plasma exchange (PLEX), as few patients affected with COVID-19 have underlying cytokine storms and intense inflammation responsible for the severity of the illness. These elevated cytokines can contribute to dysregulation of the immune process, resulting in Multisystem inflammatory syndrome in children (MIS-C) and other neurological disorders. Therefore, in patients with elevated inflammatory markers, steroids can be helpful by causing immunosuppression. Similarly, our study found that those who had elevated inflammatory markers and residual weakness responded to steroids better. Limitations of the study: Our study had a small sample size. We underscore the need for better structured prospective multicentric studies with larger sample sizes. Conclusion: Post-COVID GBS (COVID-19 serology positive) presented with variants of GBS rather than the classical symmetric ascending type of GBS with statistically significant association. Neuroimaging is of great value in both confirmation of GBS diagnosis and exclusion of differentials. The children with GBS with elevated inflammatory markers and residual weakness should be given pulse steroids trial.


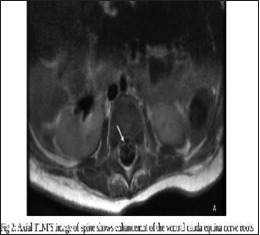

Award ID: 23
Felodipine to Re-Activate Impaired Mitophagy: A Novel Re-Purposed Approach Towards Therapeutics of Parkinson’s Disease
Akash Roy
Neurology, Institute of Neurosciences Kolkata, West Bengal, India
E-mail: akashachena25@gmail.com
Background and Aim: Parkinson’s disease (PD) is a neurodegenerative disorder of unknown etiology. Although the etiology of PD remains unknown, it is believed to involve both genetic and environmental factors, and is associated with aging1. Thus far, several proteins have been identified as contributing to PD pathogenesis, including α-synuclein (α-syn), Parkin etc. Many of these are known to participate in mitochondrial quality control or lysosomal functions2. Furthermore, familial PD patients with gene mutations usually show mitochondrial defects and impairment of the autophagic pathway, indicating that these two elements are critical components of PD pathogenesis3. Several studies have shown that dysfunction of mitochondrial biogenesis and dynamics disrupts mitochondrial homeostasis which in turn triggers the selective degradation of mitochondria via autophagy i.e. mitophagy4. Mitochondrial respiratory chain deficits, were found in post-mortem brains from sporadic PD patients, indicating a significant role of mitochondria in PD pathogenesis 5. Mitophagy impairment results in the progressive accumulation of defective mitochondria, leading to neuronal death and eventual neurodegeneration. Interestingly, GBA, PINK1 and Parkin associated gene mutations mainly participate in mitochondrial dysfunction of PD6. Mitophagy can be divided into Parkin-dependent or independent pathways. Under normal conditions, PINK1 localizes to mitochondria and is translocated to the mitochondrial inner membrane (MIM), where it is cleaved and subsequently degraded by an N-end rule pathway. However, when mitochondria become depolarized, PINK1 accumulates at the outer mitochondrial membrane (OMM) and recruits Parkin. Activated Parkin leads to the ubiquitination of substrates and the recruitment of autophagy receptors to initiate mitophagy7. Mitochondrial deficits and autophagy impairment are critical aspects of PD pathogenesis, with impaired mitophagy found in the brains of PD patients and models. Therefore, correcting mitophagy is a promising avenue for the development of efficient treatments for PD. Pharmacological agents that selectively modulate mitophagy are currently lacking, and thus the clinical applicability of this approach remains limited8. Although some compounds such as trifluorocarbonylcyanide phenylhydrazone and the combination of antimycin/oligomycin were found to trigger mitophagy, their effects were toxic and non-specific9. Therefore, re-purposing of conventional drugs towards selective correction of mitophagy impairment could be an alternative approach. Previously, from a screen of a library enriched in approved drugs, verapamil, an L-type calcium channel blocker, as an inducer of autophagosome formation was identified. However, verapamil does not cross the blood–brain barrier (BBB) and is therefore not suitable to this end. Therefore, 10 screened L type Ca channel blockers that can cross BBB and found a L type Ca channel blocker; Felodipine as the most suitable candidate to clear toxic proteins in tauopathy, Huntington’s disease and PD (A53Tα-synuclein mutation). But whether felodipine has specific role in restoring impaired mitophagy in neurodegenerative disorders like PD remains unclear. To our understanding, to date there is no such validated study that clearly demonstrates the specificity of a re-purposed drug in restoring mitochondrial dysfunction in monogenic and idiopathic (IPD) PD patients. Therefore, a thorough understanding of the mechanisms underlying mitochondrial dysfunction in PD and its therapeutic implications with an easily available re-purposed drug could be meaningful. Methodology: Ethical Approval This work on the patient derived cells was approved by IEC, Institute of Neurosciences Kolkata and Department of Physiology, University of Calcutta. Fibroblast culture Fibroblast cell-lines of PD patients and matched controls were obtained from Bio-bank of UCL, UK. Freezing stocks thawed in a 37°C water bath and transferred into 5mL prewarmed growth medium (DMEM+GluMAX-I+10% FBS+1% Pen/Strep) in 25-cm2 flasks. The media was changed 24h after seeding and then every 48h until the culture reached 80–100% confluency. MTT assay for cell viability Fibroblasts were plated into 96-well plates at 10,000 cells/well (6 replicates per line), and the MTT [3-(4,5-dimethylthiazol-2-yl)-2,5-diphenyltetrazolium bromide] (Invitrogen, Carlsbad CA) assay were performed as per standardize protocol to quantify cell viability. On the basis of spectrophotometric measurements, the cell viability was calculated compared to the control cells (the absorbance of the control cells as 100% viability). The 50% inhibitory concentration (IC50) value was calculated from the graph of the dose-response curve. Drug treatment Cells were pre-treated with best viable conc. of felodipine and DMSO (Vehicle control) for 24 hrs. to check the effect of Felodipine in fibroblast as per standard protocol10. Western blot For isolating protein, fibroblasts were trypsinized, washed once in PBS, and resuspended in RIPA buffer (Sigma-Aldrich, St. Louis MO) containing Protease Inhibitor Cocktail (Sigma-Aldrich). Equal protein amounts were separated on SDS-PAGE gel and transferred to a PVDF membrane. Membranes were incubated overnight with the following antibodies: p-mTOR, mTOR, p62, LAMP1, TOM20 and LC3. Protein bands were detected and analyzed as described followed by standard protocol of western blotting. The quantitative data obtained was normalized to β-actin. Confocal based TMRM imaging Fibroblasts were seeded (100,000 cells/well) in a blank fluro-dish. Thirty minutes before the time point, cells were washed once in PBS and stained with 20 nM TMRM (Thermo Fisher Scientific T668) in imaging medium (10 mM HEPES, 1.8 mM CaCl2, 1 mM MgCl2, and 0.1% glucose in PBS). Fluorescence was visualized on an Images were captured using Zeiss LSM 980 with Airyscan 2 confocal microscope with a 63x oil objective. Images were analyzed using ImageJ (https://imagej.nih.gov/ij/). Mitochondrial fragmentation count Fibroblast images were taken using Zeiss LSM 980 with Airyscan 2 confocal microscope with a 63x oil objective and analyzed using ImageJ (https://imagej.nih.gov/ij/). Mitochondrial fragmentation count was calculated as per standard equation and data were interpreted. Statistical analysis The descriptive statistics was presented using standard measures for central tendency, dispersion for the numerical variables and frequency for categorical variables. The normality of the data was assessed by Shapiro–Wilk test. Unpaired t-test was applied to find the difference between the two unpaired groups with nonparametric data distribution. Mann Whitney U test was performed to assess the difference between two non-parametric unpaired data. A p value < 0.05 was considered significant to reject the null hypothesis. Pearson correlation test and Spearman’s correlation test was performed for finding association between the two parametric and non-parametric numerical data. Result: Cell viability after Felodipine treatment Fibroblast cells with optimum confluency were pre-treated with 0, 10, 50, 100, 500 µM conc. of Felodipine for 24 hrs., where non-treated cells were considered as 100% viable. Up to 100 µM conc. of Felodipine there were no significant change in cell numbers (p > 0.05). After 100 µM i.e., in 500 µM there was significant decrease in cell number (p 0.001). So, we took 50 µM Felodipine (half of CC50 dose) for further experiments [Figure 1]. Effect of Felodipine in impaired mitophagy of PD Panel of western blots showed that levels of LC3, p62 and pmTOR (Mitophagic markers) were significantly decreased in GBA mutated cell lines compared to Healthy controls (p 0.01) and it was corrected with Felodipine treatment (p 0.05). But we failed to show any significant changes with LAMP1 and TOM20 (p < 0.05) [Figure 2]. Change in Mitochondrial membrane potential and the role of Felodipine Live cell confocal images showed that, there is significant decrease in the mitochondrial membrane potential in GBA mutated cell lines compared to Healthy controls and there is significant correction in it after 24 hrs. of Felodipine treatment (p 0.01) [Figure 3]. Mitochondrial structural changes in PD Live cell confocal images showed that, there is significant increase in mitochondrial fragmentation in PD cell line compared to control fibroblast (p 0.01). But we have failed to show any significant change in mitochondrial fragmentation after Felodipine treatment (p > 0.05) [Figure 4]. Conclusion: Dys-regulated mitochondrial physiology in PD is well defined 11. Impaired Mitophagy in PD is one of key players in this context. There is a strong reciprocal relationship between mitochondria and autophagy, with the impairment of one process usually resulting in damage to the other, and this vicious cycle eventually contributes to the pathogenesis of PD 12. We have showed that levels of LC3, p62 and pmTOR (Necessary for Mitophagy and mito-lysosomal cross-talk) were significantly decreased in GBA mutated cell lines of PD compared to Healthy controls and it was corrected with Felodipine treatment [Figure 1]. In line with our findings, recent evidences have also highlighted mitochondria within autophagosomes in the neurons of PD patients, indicating a potential link between autophagy, damaged mitochondria, and PD pathogenesis 13. Mitochondrial membrane potential is another prominent marker of mitochondrial survival and bio-energetics. It is generated by proton pumps (Complexes I, III and IV) is an essential component in the process of energy storage during oxidative phosphorylation14. In this study, TMRM based live cell confocal imaging15 has shown decreased mitochondrial potential in GBA mutated cell lines of PD compared to Healthy controls and with felodipine treatment it got corrected. It is well evident that, mitochondrial complex I deficit in PD and as a result of that depleted energetics decreased MMP observed in PD. therefore, may pave way for early interventions. Since MMP has a role in the maintenance of electrochemical gradient, the disruption of which may lead to neuronal death. While these efforts have identified a number of existing drugs as mitophagy inducers, the animal studies using such repurposed drugs have not tested whether any benefits that they may have been achievable with concentrations of the compounds that exist in people taking these compounds8. Commonly used hypertensive drugs can be the best option for that due to PD risk reducing epidemiological data among users16. The L-type calcium channel blocker, felodipine was found effective in inducing mitophagy and was associated with mito-protective in PD. Thus felodipine, a well-tolerated antihypertensive drug and with epidemiological indications of its benefit in reducing PD risk offers an opportunity for its repurposing for PD treatment. The role of felodipine in targeting impaired autophagy in PD, needs further investigation in a large PD population. In summary, for the first time, we have explored these impaired mitochondrial functions as an established peripheral marker of PD and a step forward identified an easily available therapeutic target for it. However, there are some remaining questions. Although the modulation of mitophagy is regarded as a potential approach in PD treatment, whether mitophagy can be specifically targeted is always a question. We believe that a prospective larger cohort and adequately powered study including other synucleinopathy and varied cellular markers would be worth undertaking to validate the specificity of these novel markers in PD.


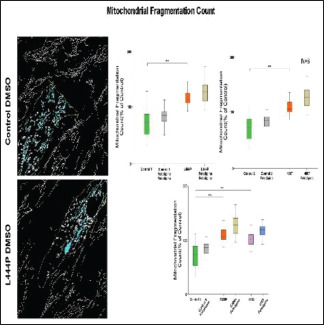
Award ID: 24
Prevalence of Headache Disorders in Persons Living with Epilepsy (PWE) in Rural Region in Western Part of India
Harshadkumar Chovatiya, Anudeep D, Anudeep D, Gautham Arunachal, Chetsi Sudhir Shah
Neurology, Shree Krishna Hospital and Pramukhswami Medical College, Karamsad, Gujarat, India
E-mail: h.r.chovatiya@gmail.com
Background and Aim: Epilepsy is, and still remains, one of the most prevalent, most challenging and one of the most studied aspects of Neurology. Epilepsy affects around 70 million people globally (1), and 10 million in India (2). Similarly, headache also forms one of the most common presentation to a Neurologist. Around 488 million Indians are affected by one or the other variant of headache, primarily, Tension Type Headache (TTH) and Migraine (2). The presence of headache in Persons living With Epilepsy (PWE) has a prevalence of nearly 48% (3). Amongst the various types of headaches, migraine was seen to have a higher prevalence in PWE (3). This can be explained by a common underlying pathophysiology of Cortical Spreading Depression (CSD) (4,5) and increased cortical cellular hyperexcitability (6) as the link between migraine and epilepsy. Despite the high prevalence, and its significant negative effect on Quality of Life (QoL) and the mental health of these patients (7), headache still remains one of the more ignored symptoms in PWE. Most studies evaluating the presence of headache in PWE focus mainly only on migraine. Other variants, such as TTH, Interictal Headache (IIH) and Post Ictal Headache (PIH) remain understudied. Migralepsy, a controversial term, included in International Classification of Headache Disorders – 3 (ICHD), but not in International League Against Epilepsy (ILAE 2017) has not been, as per our knowledge, included in any study till date. Even fewer such studies have been conducted in India. In this study, we estimated the prevalence of all the primary headaches, including Migralepsy. The quality of mental health, wellbeing and psychiatric comorbidities in such patients was also evaluated, which are frequently associate with epilepsy, but are under-reported. Hence, this study has to its credit, the prevalence of all types of headaches, mental wellbeing and psychiatric comorbidities in PWE, which can be used to effectively decide the further course of management in such cases, and hence improve not only the symptoms, but also the quality of life of these patients. AIMS: · To estimate the prevalence of various primary headache disorder in Persons living With Epilepsy (PWE). · To estimate number of patients with Migralepsy. · To estimate the prevalence of post-ictal headache. · To describe the psychiatric co-morbidities in patients with headache and epilepsy and it’s impact on quality of life. Methodology: This cross-sectional study was conducted on 203 PWE (>18 years of age) visiting the Epilepsy Clinic of Neurology Department of Shree Krishna Hospital and Pramukhswami Medical College, Karamsad, Gujarat, India between September 2019 and August 2021. People with static encephalopathy (IQ < 50), dementia (as per MMSE <24/30 or FAB <12/18) and those less than 18 years of age were excluded. Informed consent of all the participants was taken before enrolling. Study flow chart: All the patients were diagnosed to have epilepsy according to definition of ILAE 2017 (8) and evaluated with the help of structured proforma to include details of: age at onset of epilepsy, duration of epilepsy, type of seizure, frequency of seizure during the last one year, type and dose of antiepileptic drugs. Relevant investigations in the form of appropriate brain imaging [CT /MRI], EEG were performed and after that Epilepsy was classified as per the ILAE guidelines (8). Every patient taken in study were interviewed about the presence of comorbid headache disorder and details about headache using a structured proforma to get details of duration of headache, location of headache, frequency of headache, type of headache, severity of headache according to HURT-3 (Headache Under Response to Treatment) questionnaire. HURT questionnaire contains 8 questions (scored from 0-24). Out of these, first 3 questions are about the frequency of and disability due to headache (scored from 0-9). HURT-3 questionnaire is a validated questionnaire with good internal consistency and reliability (α = 0.90); which focuses on symptom burden and takes about 2 minutes for evaluation (9). The relationship of headache with seizure, type of medicines used headache and ICHD 3 based diagnosis of comorbid headache disorder was assessed using structured proforma. We also assessed psychiatric co-morbidity and classified according to Axis 1 DSM-IV by using the MINI 5.0.0 version 1.1.05 (Mini International Neuropsychiatric Interview). MINI use to assess the presence of co-exiting current DSM-IV Axis -I psychiatric disorder. We assessed only the presence of current psychiatric disorders and did not assess for lifetime prevalence of any psychiatric disorders. It takes about 20-30 minutes for complete evaluation of psychiatric illness (10). The Mental wellbeing in the patient living with epilepsy was assessed by the WHO-5 Well-Being Index. The WHO-5 Well-Being Index contain only 5 questions which takes about 2 min. It measures current mental well-being (time frame the previous two weeks) and a cutoff value of WHO-5 index <50% is considered to significant affection of quality of mental health with a sensitivity-0.95, Specificity-0.79, PPV-0.49 and NPV-0.99 (11). Descriptive statistics was calculated using Microsoft Office Excel 2007 and SPSS Statistics 20.0 software. Socio demographic data were presented as proportions (%). Descriptive statistics (number, percent, mean, range) were used to characterize the sample. A logistic regression model was used to evaluate the association of headache and epilepsy with other associated factors like Age, Gender, Seizure control, AED, MINI and WHO-5. Result: We studied 203 PWE out of which 103 were males (Mean age 35.9 years) and 100 were females (Mean age 34.8 years). 133 participants (65.52%) had focal seizures and 70 (34.48%) had generalized seizures. The prevalence of headache in our study in the PWE was 45.32% (92 out of 203 PWE). Out of these 92, 37 (40.22%) were males and 55 (59.78%) were females. Out of these 92 patients with Headache, Migraine was the most prevalent form, accounting for 70.65% (n = 65), followed by TTH (22.82%; n = 21), followed by Migralepsy (4.34%; n = 4) and lastly by a combination of TTH and Migraine (2.17%; n = 2). Both, migraine and TTH in PWE were more prevalent in females as compared to males. Migraine was present in 39 females (60%) and 26 males (40%), and TTH was present in 13 (61.90%) females and 8 (38.09%) males. Migralepsy was present in 3 males (75%) and 1 female (25%). Both patients of combined TTH and Migraine were females. According to temporal relation of headache with seizure, 74 (80.43%) PWE had IIH, 8 (8.69%) had PIH and 3 (3.26%) had pre-ictal headache. 7 (7.6%) had headache in the pre-ictal, ictal, inter-ictal and post-ictal phases. The severity of headache was classified as per the HURT – 3 questionnaires. Majority of them (44.56%; n = 41) required acute headache management. 28 of the 92 PWE (30.43%) with headache, had good headache control and required no intervention, and 23 of them (34.78%) required prophylactic management. No patient reported disabling or chronic daily headache. [Table 1] Talking about epilepsy in headache patients, out of the 65 PWE with migraine, both JME and FLE were equally prevalent, constituting 27.69% (n = 18) each, followed by TLE (26.15%; n = 17), IGE (10.77%; n = 7), PLE (4.62%; n = 3) and OLE (3.08%; n = 2). Similarly, in the 21 PWE with TTH, FLE was most prevalent, constituting 42.86% (n = 9) followed by JME and TLE, each with 23.81% prevalence. In the 8 patient of post-ictal headache, 3 had FLE and IGE, 1 had JME and TLE. [Table 2]. In the 4 patients with migralepsy, 2 had OLE and 2 had IGE. [Table 3]. When clinical characteristics in PWE were statistically tested for relation with headache, the female gender was found to have statistically significant correlation with a p value of 0.01. Similarly, female gender and younger age were significantly correlated to migraine, with p values of 0.03 and 0.05 respectively. Similarly, when types of epilepsy were tested, only OLE was found to have a statistically significant correlation with headache (p = 0.03), and the rest did not show any significant correlation with headache. A younger age had a statistically significant correlation with TTH (p = 0.04). [Table 4]. Out of 203 PWE in our study, we found 53 patients (26.10%) who had a coexisting psychiatric morbidity. Of these 53, 28 had a coexisting depressive disorder, comprising of both depression and dysthymia, and was the most prevalent psychiatric illness (52.83%). This was followed by general anxiety, constituting 37.73% (n = 20). In PWE with coexisting psychiatric illness, JME was most common variant of epilepsy encountered, (71.42% of combined dysthymia and depression, and 28.58% of generalized anxiety). This was followed by FLE (57.89% of combined dysthymia and depression, and 36.84% of generalized anxiety). [Table 1] At the same time, out of the 92 patients with headache in PWE, 34 patients (36.95%) had a coexisting psychiatric illness, i.e. nearly 1.5 times more than the PWE without headache. Out of these 34, 10 (62.50%) had Depression, 10 (83.33%) had Dysthymia, 13 (65%) had General Anxiety and 1 (33.33%) had PTSD. [Table 1] Out of the 203 PWE, 36 had a WHO – 5 index of <50%, out of which, 9 were found to have headache, and 16 were found to have both, headache and a concurrent psychiatric illness i.e. 25 PWE with at least headache had a significantly affected quality of the mental health. Logistic regression analysis of the same again showed statistically significant correlation between WHO – 5 wellbeing index of <50% and headache and psychiatric disorder in PWE (p < 0.001). [Table 5]. Conclusion: DISCUSSION: Our cross-sectional study assessing the prevalence of headache disorders in PWE in western part of India revealed that nearly half of the PWEs had a comorbid headache disorder. Our study highlights the fact that all PWEs also need assessment of comorbid headache disorder. Amongst the PWE with headache; nearly three-fourth of them have migraine while nearly one-fourth have comorbid TTH. In our study population of PWE, females had a higher prevalence of headache and also higher prevalence of all primary headache then male. Amongst the PWE with comorbid headache, nearly one third had reasonable control with lifestyle modification alone, nearly half required medications for acute headache attacks and nearly one-third required regular prophylactic treatment for headache along with anti-seizure medications. The following table has been adapted and modified from the meta-analysis done by Duko B et al. (3). Author Country Sample size Study design Gender wise prevalence (%) Prevalence of headache (%) MH (%) TTH (%) PreIH (%) PosIH (%) Migralepsy (%) Singla et al. India 123 Cohort NA 47.10 21.10 26.00 NA NA NA Joshi et al. India 120 Case Control study NA 60.00 25.8 41.7 13.3 7.5 NA Ashjazadeh N et al. Iran 100 Cross-sectional 48 (M) 52 (F) 54.00 15.00 39.00 NA 31.48 NA Fattahzadeh AG et al. Iran 900 Cross-sectional NA 85.20 27.90 48.20 NA NA NA Ito M et al. Japan 364 Cross-sectional NA 40.40 26.00 14.4 NA 40.40 NA Mainieri et al. Italy 388 Cross-sectional NA 53.90 26.30 19.10 48.50 19.10 NA Gokhan O et al. Turkey 86 Cohort NA 47.60 26.70 16.30 NA NA NA Mameniskiene R et al. Lithuania 289 Cross-sectional 42 (M) 62 (F) 83.20 31.70 39.00 77.90 NA NA Wang et at China 1109 Cross-sectional 57 (M) 64 (F) 60.10 60.20 30.30 11.70 31.10 NA Sayed MA et al. Egypt 100 Cross-sectional 27 (M) 73 (F) 78.00 70.60 25.58 50.00 66.50 NA Botha, et al. Africa 200 Cross- Sectional NA 63.00 47.00 38.00 0.00 63.00 NA Current Study India 203 Cross-Sectional 103 (M) 100 (F) 45.32 68.47 22.82 2.17 8.69 6.52 One systemic review and metanalysis study on the epidemiology of headache in patient with epilepsy was published in 2020 which showed pooled prevalence of headache in PWE was 48.4%. In sub-classification of primary headache, pooled prevalence of migraine was 36.4% and TTH was 26.2%. There are three probabilities for the underlying mechanism of epidemiological relationship between migraine and epilepsy are: 1) Migraine is itself a risk factor for epilepsy (similarly like to be the injury caused by cerebral ischemia), 2) Epilepsy is itself a risk factor for migraine (may be due to it link with the activation of trigeminovascular system), and 3) Epilepsy and Migraine share a same pathogenic factor on acquired or genetic basis (12). In many studies, the main starting mechanism of migraine and Epilepsy is the increased cortical cellular hyperexcitability (6). However, there is no such hypothesis which showed relation between Epilepsy and TTH. It is possible that TTH may be neglected in the routine assessment of PWE though it may affect mental health significantly (1). There is no systemic study done to see the migralepsy in epilepsy patient hence exact prevalence of migralepsy not known. As per our knowledge 53 cases reported till the date and mechanism is probably same as between migraine and epilepsy. We found that 4 patients in our cross-sectional study had Migralepsy. This study also showed pooled prevalence of headache in female was 63.0% (p < 0.03) which is higher than male (33.3%) (3). The findings of prevalence of headache in PWE in our study are similar to the published studies from other centers. Different studies also report that females manifest with high prevalence of migraine and migraine attacks more frequent, long lasting and more intense than male (13,14). One study published in 2015 on relation of migraine with gender which showed sex hormone (estrogens) which sensitized cells around trigeminal nerves as well as conducting blood vessels in head. Estrogen level highest during childbearing age and trigger migraine attack by sensitizing these cells (15). Classification of headache according to temporal relation of headache with epilepsy is done as pre-ictal, ictal, post-ictal and inter-ictal headache. In our study, Interictal headache was the most common form of headache. We did not find high prevalence of post ictal headache in our study, as also found in another study from India (16). However, in many studies done outside India revealed higher prevalence of pre-ictal and post-ictal headache. (like Ashjazadeh N et al. (17), ItoM et al. (18), Wang et al. (19) and Sayed MA et al. (20) studies) showed high prevalence of post-ictal headache were 31.48%, 40.40%, 31.10% and 66.50% respectively. This discrepancy between our study and other studies might be due to 1) most of other studies are retrospective (21,22) and few are prospective studies. These most of prospective studies were conducted for brief period (23) or on pediatric population (24). 2) type and the type/ refractoriness/ control of epilepsy could be influence post-ictal headache hence higher prevalence of post-ictal headache in drug-resistant epilepsy (25). In our study nearly four-fifth of PWE had well-controlled epilepsy. In our study there was no any significant relation between post-ictal or pre-ictal headache with types of seizure or types of epilepsy. No previous study showed relation between post-ictal or pre-ictal headache and types of seizure or types of epilepsy. However, as the pathophysiology of both epilepsy and migraine have similarities, it is possible that there could be a relationship between these. It is likely that multicenter studies assessing patients prospectively with a large sample size may better assess this relationship. In our study we didn’t find any patients with ictal-headache as ICHD-3 criteria for the diagnosis are very stringent, need epileptic activity in EEG during headache relieved by anti-seizure drugs and this is not feasible. In our study, 4 patients had migralepsy and out of these 50% had pre-ictal and 50% had (pre-ictal+Ictal+post-ictal+Inter-ictal) headache. Our study did not show significant difference in prevalence of migraine and TTH headache with different types of seizure or epilepsies. Wagner AK et al. study assessed quality of mental health in PWE [61.3% had poor quality] (26) and revealed that the poor quality was higher than in our study. This might be due to multiple possibilities. That study was conducted in 1996 and that time awareness about epilepsy was very less and many stigmas in society would me more. Also, in that study SF-36 questionnaire was used while in our study we used WHO-5 well-being questionnaire because it is easy and less time consuming hence very suitable in busy OPD. Quality of life decrease in both headache and epilepsy due to uncertainty in life, social stigma, decrease self-esteem, financial constrained, disturbed marital and occupation life (27). Nearly one-fourth of PWE in our study had a comorbid psychiatric disorder. Amongst these, depressive disorders [depression/dysthymia] were more common followed by anxiety disorder. Another study conducted by Desai et al. (28). on psychiatric illness in refractory epilepsy by MINI interview showed 16.2% had depression, 8.5% had dysthymia, 23% had anxiety disorder and 9.4% had other psychiatric disorders. This study also found temporal lobe epilepsy (right > left) had high prevalence (39.31%) of psychiatric illness. We found a lesser prevalence of psychiatric disorders in our study. This discrepancy between our study and the study by Desai et al. is because Desai et al. study was conducted among patients with refractory epilepsy and in our study around 4/5th number of PWE had well controlled epilepsy. Around 20-30% of PWE have psychiatric illness (29) which same as our study (26.10%). There is complex pathology with social, psychobiological and economic consequence in PWE responsible for a higher prevalence of psychiatric illness in PWE (29). We specifically assessed the relationship between presence of comorbid headache disorders and psychiatric disorders in PWE. We found a high prevalence of comorbid psychiatric disorder in patients with both headache and epilepsy together. Amongst PWE with headache, more than one-third had comorbid psychiatric disorder. Amongst them, depression, dysthymia and anxiety were present in nearly half of such patients. There is dearth of studies evaluating the relationship between of comorbid headache, epilepsy and associated psychiatric disorder. One study by Omid Mirmosayyeb et al. (30) assessed psychiatric illnesses amongst PWE and compared with those with migraine. In that study, prevalence of psychiatric illness was more in patients with migraine or epilepsy compared to normal population. CONCLUSION: Headache is a frequently ignored co-morbidity in PWE. It can worsen the overall mental health quality of PWE. Migraine is more common headache disorder in PWE in western part of India. TTH is second most common headache disorder among PWE. Females are more affected than males and this might be due to sex hormone (estrogens) which sensitized cells around trigeminal nerves as well as conducting blood vessels in head. Quality of life and mental health are more affected in patient with epilepsy and this is further worsened in patients with both epilepsy and headache. This may occur due to multiple factors like social stigma which predominate in both disorder, problem in social and occupation life, uncertainty in life, adjustment issues, financial constraint. Migralepsy is gray zone because it included in ICHD-3 headache classification and not yet included in ILAE. It may not be uncommon to find patients with Migralepsy. Multi-centric prospective studies assessing the relationship between headache and epilepsy as well as impact of prophylactic therapy in PWE with headache are needed further. Proper diagnosis, counseling, education, life style modification and drug therapy for headache in PWE may help improve QOL.


Award ID: 25
Interictal Cardiovascular Autonomic Function in Drug-Resistant Epilepsy
ATHIRA S B, Pravati Pal, Pradeep P. Nair, Nivedita Nanda, Rajeswari Aghoram
Physiology, JIPMER, Pondicherry, India
E-mail: sreeharigowri@gmail.com
Background and Aim: Epileptic seizures are known to activate the autonomic nervous system (ANS), thereby altering sympathetic and parasympathetic functioning. Activation of ANS and changes in cardiac function observed during a seizure are due to the origin or propagation of electrical discharges to the central autonomic network (CAN) (Wannamaker, 1985). Increased sympathetic activity or reduced parasympathetic activity is observed during partial and generalized seizures though, a predominant activation of the parasympathetic system or inhibition of sympathetic activity is observed in partial seizures (Sevcencu and Struijk, 2010). Autonomic dysfunction observed in epilepsy may extend from the ictal phase to the interictal period. Disturbance in the ANS activity is hypothesized as one of the causes of sudden unexpected death in epilepsy (SUDEP), especially in drug-resistant epilepsy (Devinsky 2016). Chronic and recurrent seizures can cause progressive autonomic imbalance, leading to cardiac and pulmonary system changes, thereby causing SUDEP (Lee and Devinsky, 2005). Certain antiepileptic drugs (AEDs) and polytherapy are also known to cause autonomic dysfunction in epilepsy. Considering the autonomic dysfunction and associated SUDEP in epilepsy, it is important to screen and identify the grade of autonomic nervous system dysfunction in people living with epilepsy for its early management. Also, it aids in screening those who are at risk of developing sudden unexpected death. Previous studies have reported reduced heart rate variability (HRV) and impaired cardiac autonomic dysfunction using a battery of conventional autonomic function tests; however, they lack the assessment of baroreflex sensitivity (BRS), a predictor of cardiac mortality (La Rovere, 2010). Therefore in the present study, we aimed to study the cardiac autonomic function in drug-resistant epilepsy using a battery of non-invasive cardiac autonomic function tests including HRV, conventional autonomic function tests, and BRS. Methodology: This was a cross-sectional analytical study conducted from 2019 to 2022. Fifty-seven patients diagnosed with drug-resistant epilepsy who attended the Epilepsy clinic, Department of Neurology, Jawaharlal Institute of Postgraduate Medical Education and Research (JIPMER), Puducherry were recruited for this study after obtaining written informed consent. Thirty age and sex-matched healthy controls were recruited among the patient attenders and hospital staff. The diagnosis of drug-resistant epilepsy was made according to the ILAE definition for drug-resistant epilepsy (Patrick Kwan 2016). Clinical details including disease duration, seizure frequency, semiology, and drug dosage were collected. The SUDEP 7 risk score was calculated using SUDEP-7 risk inventory (version 2.0) (Novak, J. L 2015). All study participants were aged between 18 to 50 years. Patients who had seizures in the last 24 hours were excluded. Subjects with a known history of diabetes mellitus, hypertension, cardiopulmonary disease, neurological disease (other than epilepsy), endocrine disease, metabolic disorder, neurocognitive deficits, ongoing medications other than AEDs affecting the ANS activity, and substance abuse were excluded. Pregnant and lactating mothers were also excluded. The study protocol was approved by the Institute’s Ethics committee. All study participants had undergone a battery of tests to assess their cardiovascular autonomic tone in the Autonomic function testing laboratory, Department of Physiology, JIPMER, Puducherry. Heart Variability Analysis Lead II ECG was recorded for 5 minutes after appropriate rest in the supine position using BIOPAC MP150. Consecutive RR intervals were derived from the raw ECG, and HRV indices were computed using Kubios HRV software version 2.0. The following time domain and frequency domain indices were selected for analysis according to the recommendation by the “Task Force of the European Society of Cardiology and the North American Society of Pacing and Electrophysiology” (Taskforce 1996). Time-domain indices: it is the amount of variation observed in inter-beat intervals, reflecting the overall variability. This includes · Standard deviation of N-N intervals (SDNN) · Root mean square of the sum of the squares of the differences between adjacent N-N intervals (RMSSD) · Number of pairs of adjacent N-N intervals differing by more than 50 ms in the entire recording (NN50) · NN50 count divided by the total number of all N-N intervals (pNN50) Frequency domain indices: They quantify the magnitude of oscillations in terms of power spectrum by applying Fast Fourier Transformation (FFT). This includes · Very-low-frequency (VLF) · Low frequency (LF) · High frequency (HF) · Total Power · LF power in normalized units (LFnu) · HF power in normalized units (HFnu) · LF/HF Ratio Cardiovascular autonomic function testing Heart rate (HR) and blood pressure (BP) changes during rest and various physiological challenges were recorded using lead II ECG recording and automated BP recording. Following were the battery of tests used to assess the cardiovascular autonomic function: HR and BP response to standing: HR and BP changes during active standing were recorded. The longest RR interval around the 30th beat and shortest RR interval at the 15th beat were noted to calculate the 30:15 ratio. BP changes following standing were recorded immediately after standing and every one minute for five minutes. Deep breathing test: HR changes during six cycles of deep breathing in sitting position was recorded. The mean ratio of longest RR interval during expiration and shortest RR interval during inspiration was noted to calculate the expiratory - inspiratory ratio (E: I ratio). Isometric handgrip exercise: HR and BP changes during sustained handgrip with 30% maximum voluntary contraction was recorded. The change in the diastolic BP during rest and just before the release of the handgrip was noted. Baroreflex sensitivity BRS was assessed using Finapres beat to beat BP recording system. A brachial cuff was wrapped around the mid-arm and a finger cuff around the middle phalanx of the middle finger. Height correction was done by placing two sensors, one at the heart level and another at the finger level. Following 10 minutes of supine rest, recordings were obtained. A “return to flow calibration and the Physiocal” was done for the level correction between the brachial and finger pressure during the initial 5 minutes of recordings. After this, continuous BP recording was carried out for 10 minutes and the BRS value was computed. Statistical analysis Statistical analysis was done using SPSS software version 20. Continuous data were expressed in mean with standard deviation and median with range following the Kolmogorov-Smirnov test for normality check. The difference between the two groups was studied using the student t-test and the Mann-Whitney U test. Chi-square test was done for the comparison of categorical data. Spearman’s correlation test was done to study the association between clinical characteristics and cardiovascular autonomic dysfunction. p-value < 0.05 was considered significant. Result: Demographic data and clinical details The mean age of patients with drug-resistant epilepsy was 30.51 ± 7.05 and the healthy volunteers was 28.04 ± 4.84. Both patients and controls did not differ in age and gender [Table 1]. The height, weight, and BMI were significantly reduced (p-value 0.018, 0.003, and 0.049, respectively) in patients compared to controls. Table 2. shows the clinical details of the patients. The median age of seizure onset was 15 (1,37) years, and the disease course was 15 (1,34) years. Patients had a median seizure frequency of 3 (1,8) per month and all were on multiple AEDs. The AEDs administered were carbamazepine, sodium valproate, phenytoin, clobazam, levepil, phenobarbital, lacosamide, and levetiracetam combinations. Among 57 drug-resistant patients, 65% had generalized seizures, 16% had focal seizures and 19% had both generalized as well as focal seizures. From the available CT/MRI imaging, 35% of the patients had temporal lobe epilepsy. SUDEP 7 risk score was obtained using SUDEP-7 risk inventory (version 2.0). Cardiovascular autonomic function tests The resting heart rate, systolic BP, diastolic BP, and mean arterial pressure were recorded in supine posture and the rate pressure product was calculated [Table 3]. BRS was significantly reduced in the patients [Table 3]. The 30:15 ratio and E: I ratio in conventional autonomic function tests were also reduced in patients compared to controls [Table 3]. The heart rate variability parameters are shown in Table 4. All time-domain indices were reduced in patients and in the frequency- domain, a reduced total power, and HFnu were observed in patients. A positive association was found between time-domain indices, total power, HF, E: I, BRS, and the number of AEDs taken in patients [Table 5]. Conclusion: Dysfunction in cardiac autonomic regulation is observed as one of the complications in epilepsy. The present study aimed to assess the cardiovascular autonomic tone in drug-resistant epilepsy compared to controls. We found a predominant parasympathetic dysfunction in the patients with drug-resistant epilepsy compared to healthy volunteers. One possible reason for this dearrangement in patients with drug-resistant epilepsy could be due to recurrent unprovoked seizures. Recurrent seizure activity causes cortical damage, disturbs the neurohumoral axis, and the resulting consequences are cardiac arrhythmia and alteration in cardiovascular tone (Jansen and Lagae, 2010). Our study found an impaired HRV in patients with drug-resistant epilepsy. HRV is a commonly used tool to study the functional status of cardiac autonomic activity. The time-domain indices reflecting the parasympathetic tone were significantly reduced in the patients. The total power reflecting the overall variability in the heart rate was also significantly reduced in the patients. A previous study on intractable and well-controlled epilepsy also showed similar findings. HRV showed a lower parasympathetic tone in subjects with intractable epilepsy when compared to patients with well-controlled epilepsy (Mukherjee et al., 2009). In a longitudinal study in refractory focal epilepsy, a reduction in HRV that was progressive along the disease course was observed compared to HRV in patients with well-controlled epilepsy (Suorsa et al., 2011). However, our’s was a cross-sectional study and hence could not assess the progressive nature of the dysfunction along with the course of the disease. Ansakorpi et al. showed a heightened sympathetic tone and reduced parasympathetic tone in subjects with intractable temporal lobe epilepsy compared to well-controlled temporal lobe epilepsy (Ansakorpi et al., 2000). The reduced HRV observed in epilepsy might be due to the recurrent ictal discharges altering the cardiac function and autonomic activity, which may persist even in the interictal state. Reduced HRV (Tsuji et al., 1994) and increased heart rate are known cardiovascular risk factors (Perret-Guillaume et al., 2009). Therefore, decreased HRV and increased heart rate observed in drug-refractory epilepsy may constitute an important risk factor for SUDEP. We attempted to study whether any association exists between the HRV parameters and the SUDEP 7 risk score but did not find any significant association between both. The cardiovascular stress tests performed in the present study to assess the cardio-vagal modulation, such as HR response to deep breathing and supine to standing, were significantly impaired in the study group. We did not find any significant difference in the sympathetic reactivity test. Sathyaprabha et al. reported similar findings in chronic drug-resistant epilepsy. They found autonomic dysfunction in 56.3% of the patients with refractory epilepsy and it was more severe among patients with longer disease duration (Sathyaprabha et al., 2006). Mukherjee et al. also reported a reduced parasympathetic modulation in intractable epilepsy using HRV and conventional autonomic function tests. The strength of our study compared to the previous studies is that in addition to HRV and conventional autonomic function tests, we have assessed the baroreflex sensitivity, a predictor of cardiac mortality. The BRS in our study group was significantly reduced when compared to controls. There is a paucity of data on BRS in epilepsy. Reduced BRS could be due to baroreceptor abnormalities and involvement of central autonomic structures modulating the baroreceptors owing to recurrent seizures. The present study could provide a comprehensive picture of the cardiovascular autonomic functioning in drug-resistant epilepsy. The autonomic dysfunction observed in refractory epilepsy might be due to the seizure’s uncontrolled and chronic nature (Berilgen et al., 2004). Long-term seizures can lead to progressive disturbance in the cardiac autonomic system (Ansakorpi et al., 2002). This could be probably due to structural and functional changes in the various regions of the brain owing to uncontrolled electrical stimulation that occurs during a seizure. Altered cardiovascular autonomic function due to chronic and recurrent seizures might increase the risk of SUDEP. The association between AEDs and autonomic dysfunction in epilepsy is still unclear. AEDs with sodium channel blocker activity such as carbamazepine (CBZ) can cause significant autonomic dysfunction in epilepsy. CBZ can also cause cardiac arrhythmia due to its anticholinergic properties (Persson et al., 2003). It acts by blocking sodium channels, thereby slowing depolarization and increasing the QRS complex duration on ECG (Koutsampasopoulos et al., 2014). CBZ has a negative impact on HRV by altering parasympathetic and sympathetic cardiac activity (Persson et al., 2007). Cardiovascular disturbance and arrhythmias observed during seizures might cause SUDEP in some cases (Devinsky et al., 2016). The link between CBZ and autonomic dysfunction remains debated. Sathyaprabha et al. studied the effect of chronic CBZ monotherapy on ECG in focal epilepsy and did not find any significant change in ECG and HRV (Sathyaprabha et al., 2018). A recent study reported reduced parasympathetic activity in patients on CBZ monotherapy compared to other AEDs (Sourabh Jain et al., 2022). A prospective cohort study by Walczak and co-workers reported that sedative effects induced by AEDs could suppress the respiratory reflex and increase the autonomic dysfunction contributing to SUDEP (Walczak et al., 2001). As the drug-resistant group in our study was on multiple AEDs, we cannot rule out the effect of individual drug impact on autonomic dysfunction observed. Twenty-one patients out of fifty-seven in our study were on CBZ along with other AEDs. When checked for the association between the number of AEDs taken and the cardiovascular autonomic function tests we found that, those who were taking more AEDs had a better parasympathetic tone. Controversy remains about the role AEDs contributing to autonomic dysfunction and it is still unclear whether autonomic dysfunction results from epilepsy or is due to AEDs. Pharmacological treatment for epilepsy can also cause other side effects like weight gain or weight loss. A significant decrease in weight and BMI was observed in patients when compared to controls. AEDs such as gabapentin, pregabalin, valproic acid, and vigabatrin are known to cause weight gain whereas felbamate, topiramate, and zonisamide are associated with weight loss. Lamotrigine, levetiracetam, and phenytoin are reported as weight-neutral AEDs. As the study group was taking multiple AEDs in various combinations we could not elucidate the effect of a single drug contributing to changes in weight. The present study findings reveal an impaired parasympathetic modulation than sympathetic modulation in patients with drug-resistant epilepsy. Being a cross-sectional study with limited sample size, we could not establish any association between the severity of autonomic dysfunction and the chronicity of the disease. Since the patients were on multiple AEDs, the effect of individual drugs on autonomic function and weight gain or loss could not be studied. The strength of our study was the assessment of the cardiovascular autonomic modulation using HRV, cardiac autonomic function test, and baroreflex sensitivity. Also, the study participants were age and gender-matched thereby the effect of these parameters on autonomic function was nullified. The drug-resistant patients in our study were heterogeneous with different etiology, seizure type and seizure loci therefore, the role of these factors on autonomic dysfunction could not be studied. A prospective study on a larger sample size with a homogenous population may help in further explaining the cause of dysautonomia in epilepsy. Monitoring the autonomic tone in people living with epilepsy may help in identifying people who are at risk of developing SUDEP and other causes of death among patients with chronic uncontrolled seizures.


Award ID: 26
Biomarkers Predict Hemorrhagic Transformation and Stroke Severity in Acute Ischemic Stroke Patients
Soumya Krishnamoorthy, P. N. Sylaja, Sapna Erat Sreedharan, Gurpreet Singh, Deepa Damayanthi, Srinivas Gopala, U. K. Madhusoodanan, Harikrishnan Ramachandran
Comprehensive Stroke Care Program, Department of Neurology, Sree Chitra Tirunal Institute for Medical Sciences and Technology, Thiruvananthapuram, Kerala, india
E-mail: soumyamoorthy.k@gmail.com
Background and Aim: Despite successful recanalization by intravenous thrombolysis (IV rt-PA) or endovascular thrombectomy (EVT), some patients may not achieve favorable outcomes due to the occurrence of hemorrhagic transformation (HT)[1, 2]. This makes the use of thrombolytic intervention a prime concern in AIS, especially in individuals with severe strokes. HT is a post-stroke complication occurring in 10-40% of patients and is characterized by bleeding in the ischemic zone either spontaneously or post-recanalization, leading to poorer outcomes with significant morbidity and mortality[1]. Severity of neurological deficits, large ischemic core, advanced age, hyperglycemia, higher baseline systolic blood pressure, and anticoagulant use are recognized as some of the risk factors of HT[3]. Although the pathophysiology is not well established, it is speculated that disruption of the blood-brain barrier (BBB) within 4-5 h post-ischemia, leads to HT[4]. Various components of the barrier contribute to its selective and protective function which, during disintegration, may leak out and be expressed as circulating biomarkers[5]. Plasma biomarkers may act as adjuncts to clinical decision-making. Potential biomarkers such as Claudin-5, matrix metalloproteinase-9 (MMP-9), and soluble serum stimulation-2 (sST2) have also been correlated with HT but there is not enough data to establish their predictive roles[6-10]. However, heterogeneity of data and variability in the methodology across studies have made validation of these markers uncertain in a clinical setting. We sought to determine the predictive values and temporal relationship of the BBB-specific proteins, MMP-9 and Claudin-5, and the post-ischemic inflammatory protein, sST2, in the risk of HT and their correlation to baseline stroke severity in AIS. Methodology: The study protocol was approved by the institute ethics committee and each participant had given their written informed consent. Consecutive patients with AIS were recruited during their admission at the comprehensive stroke unit of our institute. Patients included in the study were: (i) 18-85 years of age, (ii) first-ever ischemic stroke, (iii) admitted within 24 hours of symptom onset (iv) thrombolysis initiated if the patient was within 4.5 hours of onset (v) absence of HT on baseline brain CT or MRI and, (vi) no prior anticoagulant use. Patients were excluded if they had (i) history of intracerebral hemorrhage, (ii) stroke or TIA within the past 3 months, (iii) serum creatinine level >2 mg/dL at the time of admission, (iv) absence of other central nervous system diseases, (v) signs of concomitant infection or, (vi) any malignant diseases. Baseline Clinical Data Patient demographics, vascular risk factors, medical history, diagnostic workup were collected through the course of hospital admission. Etiological classification of stroke subtypes was done using trial of ORG 10172 in acute stroke treatment (TOAST)[11]. The stroke severity at admission and discharge were documented using the National Institutes of Health Stroke Scale (NIHSS). The details of the reperfusion therapies received were noted in detail. Diagnostic Criteria of HT CT or MRI was performed on all patients upon admission and at 24-48 h after admission. HT was documented using CT or MRI imaging and was defined according to the European Cooperative Acute Stroke Study (ECASS) III criteria[12]. HT detected within 48 h was graded as either hemorrhagic infarction type-1 (HI-1) or type-2 (HI-2) or as parenchymal hematoma type-1 (PH-1) or type-2 (PH-2) based on the follow-up neuroimaging diagnosis. Symptomatic intracranial hemorrhage (sICH) was defined as clinical and neurological deterioration of ≥4 NIHSS points from baseline or leading to death within 24 h. Biochemical Analysis Blood samples were collected at three time points: (i) at the time of admission, (ii)12 h, and (ii)24 h from stroke onset. Patients who underwent revascularization at the time of admission had their baseline blood samples collected before intervention. Six patients who were admitted 12-14 h from onset had their baseline samples taken as 12 h timepoint. Plasma was separated by centrifugation at 2,500 rpm for 15 minutes and stored as aliquots at -80°C until analysis. Each marker was assessed to determine their cut-off values in each group and was evaluated by commercially available enzyme-linked immunosorbent assays (ELISA). MMP-9 was assessed using Quantikine ELISA Human Immunoassay kit (DM900; R&D Systems, MN, USA). Soluble ST2 levels were determined using Duoset ELISA kits (DY523B-05; R&D Systems, MN, USA), and Claudin-5 was assessed using Cusabio ELISA kits (Cusabio Technology LLC, Houston, TX, USA). Absorbance of the analytes was measured at 450 nm using a microplate reader (Biotek ELX 800). Statistical Analysis Sample size was calculated based on the assumptions for one of the biomarkers namely, MMP-9 as 75% and 24.6% above the cut-off value in the HT and non-HT groups, respectively, as reported in previous literature. To achieve a power of 90% with alpha error 5%, minimum sample size required was approximately, 25 each. By adjusting for 4-5 confounding variables, another 50 samples, 25 in each group, were added to get a total of 112 patients. Continuous variables were expressed as means and standard deviation (SD) or medians and interquartile range (IQR) based on their distributions, and categorical variables were given in percentages. The predictive discrimination of each marker was first analyzed by univariate analysis. Based on the intercorrelation of these markers and statistical significance, we created a multiple logistic regression model using covariates identified as statistically significant along with other potential predictors independent of their univariate p values. Separate models were developed for the three time points of marker sampling. Pearson’s Chi-squared test, Wilcoxon rank sum test, and Fisher’s exact test were conducted for univariate analyses. The logistic regression model including the biomarkers that provided good discriminative capacity to predict HT was finally included. Receiver operator characteristic (ROC) curves and area under the curve (AUC), in which sensitivity was plotted as a function of (1-specificity), were used to identify optimal cut-off levels and compare predictive accuracies of the markers. A probability value less than 0.05 was considered to be statistically significant. Result: Between December 2018 and April 2021, 111 patients were enrolled in the study. A summary of the screening of patients, timeline of blood sample collection, and follow-up is provided in Figure 1. The baseline clinical and imaging characteristics of the patients enrolled in the study are given in Table 1. Mean age of the population was 62.3 ± 11.7 years and 70% were males. NIHSS score was significantly higher (12.0[IQR:8.0-18.0]) indicating stroke severity at admission. The mean time of arrival at the hospital was 4.2 h. Mean ASPECTS score was 6. Intravenous thrombolysis with rt-PA was administered to 43 (39%) patients, whereas 35 (32%) patients underwent EVT, and 6 (5.4%) patients were given bridging therapy. Thirty patients (27%) were detected with HT with a significantly higher number of patients with atrial fibrillation, low ASPECTS scores, reperfusion therapies, and delayed time of arrival had HT as compared to those without HT. Although 47% of the patients who underwent EVT were detected with HT, this included both the HI and PH subtypes. The temporal profile is shown in Figure 2, indicating a maximum elevation of all three biomarkers at the 12-hour timepoint. The median 12-hour MMP-9 level of 153.9 ng/mL [IQR:110.6–309 ng/mL] showed a trend towards statistical significance in HT (P = 0.05). Claudin-5 levels were elevated at 12 h as compared to the other two time-points but were not found to be statistically significant (43.1 pg/mL [IQR: 26.7–72.6 pg/mL] vs 59.4 pg/mL [IQR:24.5–100.8 pg/mL]; P = 0.4). There was no correlation between any biomarkers at baseline or at the 24 h timepoint with HT. No significant correlation was reported between sST2 levels and HT. The ROC curves generated for the biomarker levels at all timepoints given in Table 2, showed baseline MMP-9 levels showed maximum sensitivity of 85.7% for a cut-off value of 56.06 ng/mL which was maintained at 12 hours (80%) for a threshold of 96.3 ng/mL (AUC = 0.63) and declined by the 24 h timepoint. Similarly, Claudin-5 had a maximum sensitivity of 62% and specificity of 62.3% at the 12 h time point for a cut-off of 50 pg/mL (AUC = 0.552). sST2 thresholds progressively increased from baseline to 24 h and yielded a maximum sensitivity of 95% and low specificity of 21.6% at baseline albeit for a lower cut-off value of 8.65 ng/mL. Multiple logistic regression model including MMP-9, sST2, and Claudin-5 levels at 12 h from the onset and the covariates that were statistically significant in the univariate analysis as shown in Table 3. Claudin-5 did not show a statistically significant association for the prediction of HT in the univariate analysis. However, after adjusting for the risk factors such as age, AF, baseline plasma glucose and systolic blood pressure, ASPECTS, NIHSS scores, IV tPA, EVT, and cardioembolic etiology, a statistically significant predictive performance was found (OR 9.46; 95% CI:1.97-64.6; P = 0.01) and low ASPECTS scores at baseline (OR 20.3; 95% CI:3.46-193; P = 0.003). We examined the correlation of these biomarkers with baseline stroke severity as given in Table 4. Of these, 11 patients (22%) with baseline NIHSS scores (5-15) and 18 patients (44%) with severe stroke (NIHSS > 16) were detected with HT (P = 0.006). patients with severe strokes with NIHSS ≥ 16 had median MMP-9 levels significantly elevated at 12 h (62.0 ng/mL [IQR:48.1-162.7] vs 116.8 ng/mL [IQR: 60.1,233.6] vs 160.0 ng/mL [IQR: 107.0,285.9]; P = 0.04). Conclusion: This prospective, observational study evaluated the association of circulating MMP-9, Claudin-5, and sST2 levels with HT and stroke severity in AIS. We found that Claudin-5 and low ASPECTS scores independently predicted HT. Although temporal profiles of all three biomarkers indicated an overall increase within the first 12 h after onset, MMP-9 at 12 h showed a trend toward a significant positive correlation with HT. Pathological data suggested that MMP-9 released by degranulation of neutrophils is highly expressed in blood 6-8 h after stroke onset in patients with HT subsequently plummeting around 24-26 h [13, 14]. However, studies have also shown that temporal distribution between HT subtypes tends to vary due to slightly different pathophysiologies[9]. Our study showed a differential time of the release of MMP-9 with a peak around 12 h that gradually declined thereby consistent with previous findings[13]. The ROC curve of MMP-9 showed a good sensitivity of discrimination of 80% for a cut-off value of 96.3 ng/mL, which was maintained from baseline to 12 h signifying that an earlier measurement of the marker would predict the risk of HT. This represented a progressive increase in the threshold levels in both MMP-9 and sST2 with a maximum sensitivity obtained for MMP-9 and Claudin-5 (64%) at 12 h. Claudin-5 did not show a statistically significant association for the prediction of HT in the univariate analysis. However, after adjusting for covariates and the concentration of other biomarkers at 12 h, a statistically significant predictive performance was reported. Claudin-5 is a principal tight junction protein restricting paracellular permeation of polar solutes and transcytotic vesicles across the barrier[15]. The presence of Claudin-5 in blood after the ischemic-reperfusion injury is an important indicator of HT given its direct involvement in BBB disruption. Experimental data in animals have shown a biphasic elevation-one at 3-6 h and the second, at 120 h indicating its role in barrier leakage and redistribution[16]. Our findings supported the elevation of the marker within the first 12 h from the onset in HT patients thereby proving to be an important marker for screening for high-risk patients. We did not find sST2 to be a significant predictor of HT contrary to previous findings[7]. However, the temporal distribution of the marker showed a gradual increase from baseline to 24 h from onset indicating its role in the inflammatory phase of the ischemic cascade. Although the highest sensitivity was observed at baseline for sST2 (95.2%), a low cut-off value of 8.8 ng/mL may affect its discriminative capacity. Our study did not show any baseline level association between the three markers and the risk of HT presumably owing to the variability in the time of sample collection at admission. Furthermore, we found that MMP-9 correlated with baseline stroke severity in our study population thereby establishing a relevant relationship between severe strokes and increased expression of MMP-9. Patients with moderate to severe baseline NIHSS scores had significantly elevated levels of MMP-9 when assessed at 12 h and 29 of these patients were detected with HT. This finding is similar to a previous study that showed the association of MMP-9 with stroke severity whereby NIHSS > 8 correlated with neurological deterioration within 48 h from onset[17]. MMP-9 is the most studied biomarker in the prediction of HT with data indicating the efficacy of the marker in predicting HT and outcome[8-10]. Our meta-analysis based on previous studies had reported that MMP-9 ≥140 ng/mL had a 29.5 times higher risk of developing HT with relatively higher pooled sensitivity and a low false positivity rate[18]. However, it may be pertinent to note that recent studies have also indicated the lack of correlation of MMP-9 with either HT or stroke severity, possibly owing to its heterogeneity in the eligibility criteria, and time of blood collection which usually ranges between 6 to 20 h from the onset in these studies[19, 20]. The strengths of our study are meticulous sample collection at specific timepoints from the onset of stroke and a detailed review of the imaging for the severity of hemorrhagic transformation. Temporal distribution is an essential factor of biomarker expression relative to the pathophysiological mechanism in stroke. Hence, our study employed sequential analyses of the analytes, rather than at a single timepoint adopted in earlier studies, which helped us understand the dynamic changes in biomarker expression over time. We also ensured that two of our time points were assessed from the time of onset of stroke and not from the time of presentation in the hospital thus maintaining uniformity in the elevation of the biomarkers with the stroke onset. Our study has some limitations that may impede the generalizability of our findings. The monocentric design and the small sample size make it difficult to appropriately assess the differences in the biomarker levels between the HT and non-HT groups thereby yielding wide confidence intervals in the logistic regression analysis. Prospective studies with a larger sample size may be taken into consideration provided that samples are taken at specific time intervals from stroke onset which may help establish predictive roles of these biomarkers that are important in HT. In conclusion, Claudin-5 levels, combined with low ASPECTS score at baseline, independently predicted the risk of HT in AIS. MMP-9 was positively correlated with baseline stroke severity in AIS.


Award ID: 27
Role of High Dose Pulse Methylprednisolone (IVMP) in these Patients with Ethambutol-Induced Optic Neuropathy (EtON)- A Randomized Controlled Trial (RCT)
Prabhjit Kaur, Aastha Takkar, Megha Varshney, Amit Kaur, Aastha Takkar, Valliappan Muthu, Kathirvel S, Paramjit Singh, Ramandeep Singh, Vivek Lal
Neurology, Post Graduate Institute of Medical Education and Research (PGIMER), Chandigarh, India
E-mail: missghotra.ghotra@gmail.com
Background and Aim: Tuberculosis is an ancient disease widespread in developing countries including India where TB is associated with high morbidity and mortality (1). Implementation of directly observed therapy short (DOTS) course was a breakthrough in the management of TB and the introduction of Fixed Drug Combinations (FDCs) for the anti-tubercular treatment (ATT) has been proven to be the boon to the society (2). It includes combination of Isoniazid (H), Rifampicin (R), Pyrazinamide (Z) and Ethambutol (E) with dosage 75 mg/day, 150 mg/day, 275 mg/day, and 400 mg/day of HRZE respectively (2). Ocular toxicity is a well-known adverse effect of ethambutol and it has potential of causing irreversible visual loss (3). As ethambutol has been prescribed for longer time (in some cases > 8 months), the incidence of Ethambutol- induced Optic neuropathy (EtON) is expected to rise (3). The situation is worse when the patients develop apparent visual loss (4). Often axonal loss occurs leaving the fundus pale/ chalky white is observed mainly at the temporal side of optic disc. While mitochondrial damage is thought to be one of the casual theories of EtON, the damage may be precipitated by the excessive use of tobacco, alcohol or other medications (5). Even Isoniazid has been noted to worsen the visual loss associated with ethambutol. Moreso, wider implications need to be recognized because only limited treatment options are available for patients who develop EtON. Often EtON is considered irreversible and is believed to have no specific treatment except the discontinuation of drug (6). The role of high dose vitamins and anti-oxidants are available in literature with some improvement in ocular functions but their role remains dubious (7), (8), (9). The literature is devoid of studies showing the usage of steroids in patients with EtON. We believe that inflammation has a major role in initial stages of EtON and hence potent anti-inflammatory properties of steroids may help in salvaging vision in patients of EtON. We aim to evaluate the role of high dose pulse mehlyprednisolone (IVMP) in EtON patients. Methodology: This is a two-arm, double-blinded, parallel group, prospective Randomized Control Trail (RCT) [Table 1]. Patients with age more than 13 years and presenting to neurology, ophthalmology and neuro-ophthalmology out-patient department with bilateral sudden onset vision loss on anti-tubercular treatment are being recruited. Enrollment of cases was done after obtaining the written informed consent from every patient as per the declaration of Helsinki. A total of 27 patients have been recruited and randomized. Patients with secondary causes of vision loss and with probable medical conditions with contraindication to steroids such as active infection, sepsis, or any other contraindication, pregnant or lactating women and patients not consenting for the study are being excluded. All patients were subjected to detailed neurological and ophthalmologic examination including Best Corrected Visual Acuity (BCVA) using the Snellan Chart, Color Vision (CV), Visual Fields (VF) examination using automated perimetry (Zeiss, Switzerland), Fundus examination (VISUPAC), and Visual Evoked Potential (VEP) using Nicolet Viking Quest machine system. Cranial MRI Brain with T1W, T2W, FLAIR images with pre and post-contrast gadolinium-enhanced along with Optic Nerve cuts are being done. Complete blood examination including CBC, RFT, LFT, ESR, CRP, HbA1c, NMO Antibody, MOG Antibody, ana/anca and lactate levels are being done for the patients. Lumbar Puncture is being performed in left lateral decubitus position with a 22G lumbar puncture needle as a routine procedure to rule out presence of Central Nervous System (CNS) Tuberculosis (TB) and inflammation if indicated. After ruling out any contraindication to steroids, patients are being randomized using Block Randomization Method into either in intervention or comparator arm. Visual functions are being assessed every two weeks for one month and subsequently after every three months in patients. Details of the treatment (Standard Treatment and Intervention) are given in Table 2. Result: It had been observed that males in our cohort were getting more effected with EtON (59.26% (n = 16)) as compared to females (11 patients (40.74%)). The Median age (IQR) of patients (n = 27) is 37 (31, 55). Majority of the patients (48.14%) belongs to age-group 26-38 years [Table 3] The mean (SD) time difference in months between onset of symptoms to presentation in hospital was 4.35 (5.01) [Table 3]. The Median age (IQR) of patients (n = 25) is 40 (32.5,55) [Table 3]. 56% of the patients in our cohort were having extra-pulmonary TB and 11 (44%) patients were having pulmonary TB [Table 3]. It was noted that the patients taking appropriate dose of ethambutol as per the guidelines (15-20 mg/kg/day) were developing visual symptoms. Also, most of the patients were having low cumulative dose of ethambutol [Table 3] at the time of development of EtON. Diabetes Mellitus (48%) was found to be the high risk factor followed by the hypertension (29.6%) and Kidney diseases (7.4 (Table 3). All the patients were having bilateral vision loss, with retrorbital pain in 07 (28%) patients and colour vision loss in 18 (66.66%) patients [Table 4]. 17 (70.37%) patients were having severe vision followed by moderate vision loss in 22.22% of the patients [Table 4]. Due to this, 44.44% of patients could not assess the visual fields and 10 patients were having ceco-central scotomas [Table 4]. Radiological investigation provides an insight that 40.74% of the patients were having chiasmic enhancement and 25.92% were having right and left hyperintense optic nerve [Table 4]. Follow-Up: Out of 27 patients, 26 patients are having baseline and follow-up details for one month. Eight patients are having complete follow-up of six months and two patients lost to follow-up. It may be noted that five patients are showing improvement in their visual acuity in whom six month follow-up has been completed. Two patients are showing no improvement and one is showing some improvement. This points us towards the positive result of study but combined comparative assessment of the entire subset and the allocation revealment will be done after the completion of recruitment and follow up of the patients. The study is still ongoing, but the observed pattern of results points us towards the positive results. Discussion: Ethambutol, one of the first-line agents against Mycobacterium tuberculosis, is a synthetic bacteriostatic agent introduced as a chemotherapeutic agent in tuberculosis in 1961 (1). It has many side effects, including hypersensitivity, hyperuricemia, peripheral neuropathy, acute interstitial nephritis and optic neuritis (10). EtON is a well-known side effect of ethambutol since it had been in use. The common form of optic neuropathy is retrobulbar neuritis which is generally reversible and is related to dose and duration of ethambutol. Clinically, EtON presents with bilateral sudden onset progressive vision loss which may be responsible for the consequent delay in management (11). Though the etiology is unknown, the disruption of oxidative phosphorylation (OXPHOS) pathway of mitochondria and retinal ganglionic cells (RGCs) apoptosis affects the central fibers of optic nerve eventually causing blurred vision, decreased visual acuity, central scotoma, and frequently, a loss of the ability to distinguish green and red. The only available treatment is to stop the drug exposure (12). We aimed to study the role of high dose IVMP because of its anti-inflammatory properties. In our study, the Mean Age in years was 37 (18-72 years) with majority of patients in the age-group of 26-38 years as compared to previous studies where Lee et al. in 2008, studied the age of affected patients ranged between 31 and 86 years (mean 58.23 ± 16.68 years)(13). In another study by Chen et al. in 2015, the mean age was 76.75 ± 7.21 years (range 59-85 years) (14). This difference in findings between the studies would likely be due to gentic and ethnic differences. Moreover, our study is being done after the introduction of new guidelines of prolonged treatment (dose and duration) of ATT. In our study, 16 (59.26%) were males and 11 (40.74%) were females showing male preponderance for the disease similar to previous studies (13), (14). In our study all types of tuberculosis patients whether Extrapulmonary TB (59.26%) or Pulmonary TB (40.74%) were recruited in the study and were equally prone to develop ETON. As compared to study by Thitiwichienlert et al. in 2020, twenty-four patients (88.9%) have pulmonary tuberculosis (TB), two patients (7.4%) have tuberculous lymphadenitis, and one patient (3.7%) has shoulder joint tuberculosis (15). The maximum number of participants 15 (55.56%) in our study were receiving a dose of 15-20 mg/kg/day of ethambutol. The mean average dose of ethambutol received in our study group was 19.04 ± 5.24 mg/kg/day (Range 10.50 - 36.53 mg/kg/day) for 4-6 months duration, with a mean duration of ATT intake 6.15 ± 3.57 months (range 2.00 - 23.00 months). The recommended dose as per WHO TB guidelines/ Indian NTEP guidelines for ethambutol is 15-25 mg/kg/day (2). In a meta-analysis by Ezer et al. noted from the available studies, that patients enrolled in two-month duration regimens with drugs dosages from 15-20 mg/kg/day appeared to have a low rate of visual complications (16). Contrary to our study in which maximum number of the patients were taking dose in this range and still developing EtON. These findings can be contributed to the introduction of new treatment guidelines using weight band fixed dose combination regime. It was noted that all (100%) participants had vision loss at the time of presentation. Nineteen participants (70.37%) had visual acuity of less than 6/60 (sever vision loss) as per the Snellen chart. Interestingly only two patients (7.41%) of the patients presented with mild visual acuity at baseline suggesting progressive and severe bilateral, painless vision loss in the patients at the time of presentation. Of 26 eyes examined in a study by Lee et al., 17 (65.4%) showed decreased visual acuity (13). This shows that the onset of structural irreversible damage to the optic nerve fiber starts before the clinical decline in visual acuity. Out of 27 patients, 12 patients were not able to assess the visual fields because of poor visual acuity and 10 patients developed ceco-central scotomas. Peripheral constriction in fields was observed in 06 patients and only one patients had hemifield defect. Visual field defects were found in all patients as compared to other study by Lee et al. reported visual field defects in 65.4% of patients (13). It was observed that 18 (66.67%) in our study were having marked color vision defects. This implicates that ethambutol impairs color vision early in the disease course. Previous study by Kaimbo, et al. reported the incidence of color vision defect without decreased visual acuity in 42 patients who were receiving ethambutol (17). In our study, MRI abnormalities were seen in all the patients with optic chismatic enhancement in 40.74% and right and left hyperintense optic nerve in 25.92%. This is currently being the largest study highlighting the radiological characteristics of the EtON patients. As the study is still ongoing, it is expected to be the study showing the radiological parameters of the EtON patients. The pattern of results observed shows the trend of improvement in visual acuity and visual fields at one-month and at six-month follow-up. Marked recovery of visual acuity observed at six-month follow-up than at one-month follow-up. Patients in other arm are also improving as it is believed that reversibility of vision occurs after the ethambutol stoppage. In the study by Lee et al. in 2008, 60% that had visual loss showed improvement in visual acuity at 5.386 ± 1.71 months after discontinuation of ethambutol. The visual fields of 7 (77.8%) of 9 patients with defects had improved 5.86 ± 3.56 months after discontinuation of ethambutol (13). Conclusion: The current study is the first prospective randomized controlled trial highlighting the role of steroids in EtON patients. As there is no treatment available till date except the stoppage of drug, this study provides an insight into the role of streoids in treating the disease because of its anti-inflammatory property. The study is still ongoing, thus the binding is not revealed, but the pattern of results shows a positive trend in improvement in visual acuity and fields of EtON patients.


Award ID: 28
A comparative Study of Neuromyelitis Optica Spectrum Disorders (NMOSD) and Myelin Oligodendrocyte Associated Glycoprotein Antibody Associated Disease (MOGAD)—A Single Centre Retrospective Study
Radhika Lotlikar, Soumya Sundaram, Sruthi Nair, Sanjeev Thomas, Arun Prasad, Muraleedharan Nair, Bejoy Thomas
Neurology, Sree Chitra Tirunal Institute for medical sciences and Technology, Trivandrum, Kerala, India
E-mail: radhika.lotlikar58@gmail.com
Background and Aim: Covering letterTo, The IAN secretariat, AOCN IANCON 2022, I am pleased to submit my original research titled “A comparative study of Neuromyelitis optica spectrum disorders (NMOSD) and myelin oligodendrocyte associated glycoprotein antibody associated disease (MOGAD)—a single centre retrospective study” for consideration for an award paper presentation in the forthcoming AOCN-IANCON-2022. The ever expanding spectrum of NMOSD with still under explored AQP4—Ab negative NMOSD and MOGAD highlight the need for distinct differentiation among these groups with early therapeutic strategies for effective outcome. This study aims to describe the clinic-radiological profile and study treatment strategies (acute and maintenance) and outcome differences between these three groups. This manuscript has not been published and all the concerned authors are in agreement with the content of the data. Yours sincerely (Presenting author) AbstractBackground and purpose: Myelin oligodendrocyte glycoprotein antibody associated demyelination (MOGAD) has emerged as a distinct entity from neuromyelitis optica spectrum disorders (NMOSD). We compared the clinical, therapeutic and radiological profile among AQP4—Antibody (Ab) positive, AQP4—Ab negative NMOSD and MOGAD and assessed the outcome. Methodology- Patients attending the inpatient/outpatient clinic at Department of Neurology, SCTIMST from January2016-March2021 were retrospectively screened for AQP4—Ab positive NMOSD, AQP4—Ab negative NMOSD and MOGAD according to serum antibody by fixed cell-based assays. Groups were compared for demographic, clinicoradiological characteristics, therapy and outcome. Results- 110 cases comprised 48 (43.6%) AQP4—Ab positive NMOSD, 38 (34.6%) MOGAD and 24 (21.8%) AQP4—Ab negative NMOSD. Mean age of onset was 25.8 ± 14.8 years with 30%pediatric onset (<18 years). Mean disease duration was 78.8 months with a mean follow-up of 44 months. Female preponderance was noted in AQP4—Ab positive NMOSD (M:F = 1:5)(P-0.006). AQP4—Ab negative NMOSD had frequent brainstem (P-0.007) syndrome with rarer ON (p-0.001). Area postrema syndrome (APS)(p-0.005), lhermitte (p-0.081) and tonic spasms (p-0.027) were exclusive in NMOSD. Brain imaging revealed long segment ON with rare chiasmal affliction (p-0.096) and more subcortical involvement (p-0.008) in MOGAD. Spinal cord imaging showed cervical (p-0.001) and cervico-medullary affliction (p-0.024) in NMOSD. Bright spotty lesions were specific for AQP4—Ab positive NMOSD (p < 0.001). Coexistent autoantibodies were absent in AQP4—Ab negative NMOSD (p-0.024).23.2%relapsed while on some maintenance therapy. Rituximab therapy reduced relapses in AQP4—Ab positive NMOSD (p 0.04). Conclusion AQP4—Ab positive NMOSD had female preponderance, bright spotty lesions and significantly reduced relapses on rituximab. AQP4—Ab negative NMOSD had more brainstem presentations with rarer ON. MOGAD has a unique spectrum with rarity of APS, tonic spasms, lhermitte and chiasmal involvement which can be used for exclusion. The common thread remains the higher propensity for relapses needing early immunomodulation. Key words - NMOSD, MOGAD, AQP4—Ab, spectrum, outcomeIntroductionNeuromyelitis optica spectrum disorders (NMOSD) and myelin oligodendrocyte associated glycoprotein (MOG) antibody associated disease (MOGAD) has now emerged as a distinct inflammatory demyelinating disorders of central nervous system (CNS) with evolving spectrum (1). Detection of specific antibodies directed against aquaporin-4 (AQP4) channels and MOG has a pivotal role in the diagnosis of these disorders. The discovery of these antibodies and subsequent description of these disorders has lead to delineation of the specific clinical and radiological features of these entities (2). These disorders are accompanied by multiple unique presentations other than the myelitis and optic neuritis and varied radiological and immunopathological characteristics and temporal profile (3). NMOSD has been classified into AQP4 antibody positive (NMOSD AQP+) and negative (NMOSD AQP-) subtypes based on results of assay of antibody against AQP4. With the introduction of cell based assays (CBA) which has a higher specificity and sensitivity when compared to conventional assays, enzyme linked immunosorbent assay (ELISA) or tissue-based immunofluorescence, had led to higher detection rates in previously seronegative patients (5). A subset of persistently seronegative patients under NMOSD revealed to have a different demographic and clinical profile which turned out to be MOGAD (6). Thus earlier studies has inadvertently included MOGAD patients also in the seronegative NMOSD and MS as the MOG antibody testing came much later thus diluting the clinical and radiological spectrum of these conditions. However later studies has demonstrated the unique profile of MOGAD extending beyond that of NMOSD. The diagnostic distinction between NMOSD and MOGAD is necessary as they differ greatly with regard to treatment strategies, prognosis and outcomes. This is very well explained by the differences in pathophysiological mechanism that exists between these two entities; NMOSD AQP4+ being an autoimmune astrocytopathy and MOGAD having predominant myelin injury without astrocyte damage.(1,7). The clinical spectrum of NMOSD AQP4+ is defined into distinct syndromes however MOGAD and NMOSD AQP4- need further clarification regarding their varied presentations and course (4). The spectrum of manifestation is expanding to involve rare presentations like focal encephalitis, radiculopathy and cauda equina syndrome in these categories especially in MOGAD (17). The radiological characteristics for NMOSD has been clearly defined, however the distinct differentiation of areas and patterns involved in MOGAD and NMOSD AQP4- need to be explored for early diagnosis for targeted therapies (6). Since these disorders are polyphasic, maintenance therapy for preventing relapse is a significant aspect in treatment related decision and there is rarity of literature with regard to effectiveness of the maintenance therapy in seronegative NMOSD and MOGAD. Hence this study was planned to describe the varied clinical, laboratory and radiological features of NMOSD AQP4+, A NMOSD AQP4- and MOGAD. We also aimed to study the treatment strategies both acute and maintenance therapy and outcome differences between these three groups. Methodology: Subjects: The study was a retrospective single centre study which included patients with NMOSD and MOGAD who attended the general neurology outpatient and MS clinics and those admitted with Department of Neurology, Sree Chitra Tirunal Institute for Medical sciences and Technology, Thiruvananthapuram from January 2016-March 2021. All consecutive patients of all age groups fulfilling the International consensus diagnostic criteria 2015 for NMOSD and consecutive patients with primary demyelination and MOG antibody positivity were included in this study (4,9). NMOSD was further sub-classified into NMOSD AQP4+ and NMOSD AQP4- based on the AQP4—Ab serostatus. In NMOSD AQP4- group, MOG—Ab status was also negative. All patients with clinical features indicating primary demyelination and MOG antibody positive were included under MOGAD group. Serum sample was tested for antibodies using a commercially available fixed CBA (Indirect Immuno-Fluoroscence Test – IIFT) (Euroimmun, Lübeck, Germany) at a dilution of 1:10. Patients were screened retrospectively from the hospital electronic medical records database by putting the search words as “Neuromyelitis optica”, “NMO spectrum disorders”, “NMO”, “NMOSD”, “AQP4 positive”, “aquaporin”, “MOG”, “MOGAD”, “Optic neuritis”, “LETM”, “Transverse myelitis” and “Demyelination”. Patients were screened to look for secondary causes of demyelination and patients whose clinical features indicate and confirmed alternative diagnosis such as sarcoidosis, neoplasms, infective, toxic or metabolic causes were excluded. Patients who also satisfied the revised McDonald criteria 2017 (8) for MS or those on disease modifying therapy for MS were also excluded. Patients were not included in if their AQP4 and MOG antibody status were unavailable or unknown or if adequate information regarding clinical attacks, brain and spinal cord magnetic resonance imaging (MRI) were unavailable. Data collection: Demographic characteristics, age at disease onset, clinical features, antecedents, laboratory parameters, serological and immunological profile, treatment (acute and maintenance therapy) and outcome parameters were collected using a structured proforma. The course of the disease (monophasic/polyphasic) and detailed information about each event and distinct phenotypic presentation (brainstem, optic nerve, spinal cord, area postrema, cerebral) and other atypical presentations were noted. Associated other clinical findings such as Lhermitte sign and painful tonic spasms were also recorded. Neuroimaging: MRIs of brain, optic nerve and spinal cord which were taken within the first six months of event onset in all the eligible patients were reviewed by a neuroradiologist. Sequences reviewed were T1 and T2 weighted, 3D fluid-attenuated inversion recovery (FLAIR), high resolution thin 2 mm T2 coronal fat suppressed sequences for orbit (Short Tau Inversion Recovery, STIR), diffusion weighted (DWI), susceptibility weighted (SWI) sequence, T2W sagittal sequences for whole spine and axial T2 spin echo sequences at the level of lesions and post contrast sequences. The radiological findings were documented based on the following definitions (16,21,23,25,27) i) Optic nerve: Optic neuritis was defined as hyperintense signal on STIR/T2 fat-saturated images with intense homogenous enhancement. T2/FLAIR hyperintensity was then classified into anterior and posterior involvement based on the mid point of optic nerve which is globe junction and orbital apex. Involvement of prechiasmatic, chiasma, post chiasmatic segments were also noted. The length of involvement was classified as less than 50% (short segment) and more than 50%(long segment). ii) Brain: Supratentorial lesions were defined and noted regionwise as T2/FLAIR hyperintensity involving periventricular and deep white matter (WM), grey matter nuclei, corpus callosum, hypothalamus, periaqueductal grey matter (PAG), corticospinal tract, cerebral peduncle. Lesions involving cortex, juxtacortical (both cortex and subcortical U fibres) and subcortical (white matter within 10 mm distance from the inner border of the cortex) were noted. Infratentorial lesions in the form of brainstem such as involvement of midbrain separate from PAG, pons, medulla, cerebellar peduncles, Area postrema and cerebellar white matter lesions were noted. Tumefactive demyelination (TDL) are defined as large > 2 cms solid white matter lesions with mild mass effect and surrounding vasogenic edema, showing complete/incomplete ring of enhancement on post contrast images. iii) Spinal cord: Location of lesions was classified into cervicomedullary, cervical, cervicothoracic, thoracic and conus. Based on hyperintensities in the axial T2W sequences, the cord involvement was defined as central or peripheral and whether the lesions involving > 50% and < 50% of the total area of the cord. Length of the lesions were defined as T2 hyperintensities involving > 3/< 3 vertebral bodies. Bright spotty lesions were defined as small rounded T2 hyperintense areas equivalent to CSF signal intensity within the hyperintense area in the cord on T2W axial images. If there was involvement of more than one segment of spinal cord with normal segment of cord in between the lesions, then it was termed as multiple lessons. Laboratory parameters: Cerebrospinal fluid (CSF) analysis for cytology, protein and sugar, oligoclonal bands (OCB) and IgG index were recorded. Other coexistent serum autoimmune antibody association was also noted. Antibody status of AQP4 and MOG antibodies in the CBA were recorded. Treatment related aspects: Acute therapy was defined as treatment intended to be given for a period of less than or equal to three months. Maintenance therapy was defined as treatment given or total duration of treatment was beyond 3 months (glucocorticoids) or use of any immunomodulatory therapy (azathioprine, mycophenolate mofetil, rituximab, cyclophosphamide or methotrexate). (16) The initial acute therapy as well as subsequent acute as and maintenance therapies in the order used were recorded along with duration of treatment. Data regarding maintenance therapy, the drug, its dose, duration of treatment and side effect profile was also recorded along with its cause for withdrawal if any. Outcome parameters: Outcome parameters that were considered are the number of relapses, time to first relapse and disability outcome at last follow-up. Relapse was defined as recurrence of event or new onset symptoms after completion of one month after the previous event onset (16). Total number of relapses in each patient with or without therapy and on individual maintenance therapy (MT) were noted. Time to first relapse among the relapsing cases and time to relapse after initiating MT were also noted. Disability in all patients at last follow up were recorded based on a disability scoring generated by grouping the functional scoring system and modified Rankin scale (mRS) grading into 3 groups. Mild disability was defined as very mild residual disability or near normal patients not affecting their daily routine activities (mRS 0-2); visual disability less than 6/18 in worse eye. Moderate included needing minimal support for ambulation and partially dependant for daily activities (mRS 3); visual disability from 6/18 to 6/60 in worse eye. Severe disability comprised patients who are bed bound or need two persons support to walk or completely dependant for activities of daily living (mRS 4-5) or visual disability > 6/60 in either eye. Statistical analysis: The data was collated into an excel sheet and was analysed using statistical package for social sciences version 26 software (SPSS Inc, Illinois, Chicago). Categorical variables were described as proportions and compared using Chi square test of Fishers exact test. Numerical variables were described as mean and standard deviation and compared using analysis of variance (ANOVA) based on the clinical profile, diagnostic criteria and antibody status (AQP4 and MOG), patients were grouped into 3—group 1 NMOSD AQP4+, group 2 MOGAD and group 3 NMOSD AQP4- (double seronegative for both MOG and AQP4 antibodies). Variables predicting the disability and relapse were compared among the groups using logistic regression analysis. P less than 0.05 was considered to be statistically significant. Result: 110 patients were included in the study of which 48 (43.6%) were NMOSD AQP4+, 38 (34.6%) were MOGAD and 24 (21.8%) were NMOSD AQP4- [Figure 1]. The socio-demographic profile, clinical presentation and the outcome is mentioned in the Table 1. The mean age of onset was 25.8 ± 14.8 years and 30% had pediatric onset (<18 years). The mean disease duration was 78.8 months and mean follow-up period was 44 months. 91 patients (82.7%) had a relapsing course while 19 (17.3%) had monophasic course. Clinical parametersThe comparison of clinical features and laboratory parameters are described in Table 2. Significant female preponderance in AQP4—Ab group (M:F ratio of 1:5) with equalizing effect on other groups were noted (p = 0.006). Majority of the patients in all the three groups had a relapsing course. The initial phenotype of isolated optic neuritis (ON) was more common in NMOSD AQP4+ and MOGAD and A NMOSD AQP4- group had frequent isolated brainstem syndrome (p = 0.007) and isolated cerebellar syndrome (p = 0.001). Area postrema syndrome (APS) was exclusively seen in NMOSD (p 0.005). ADEM—like presentation was seen 5 patients of which 4 were MOGAD and 1 was AQP4—Ab positive patient. Lhermitte sign (p 0.081) and painful tonic spasms (p 0.027) were exclusive in NMOSD groups predominantly in NMOSD AQP4+ patients. A total of 384 events were reported in the study population of which 182 events were in NMOSD AQP4+ group while 124 were in MOGAD and remaining 78 were in NMOSD AQP4- group. The median number of demyelinating events per patient was three in all the groups. The second event was associated with maximum disability irrespective of the subgroup (p = 0.310). When all demyelinating events were analysed, isolated optic neuritis (41.1%) was more frequent followed by isolated transverse myelitis (27.6%). Isolated ON was more common in MOGAD (50%) and NMOSD AQP4+ (42.3%) as compared to NMOSD AQP4- group (24.4%) and the results were statistically significant (p = 0.001). Brainstem syndrome was more common in NMOSD AQP4- group (16.7%) as compared to other two groups (p = 0.007). ADEM-like presentation was more frequent (p 0.018), whereas none had APS in MOGAD (p 0.005). Laboratory parameters CSF analysis showed no differences among the groups [Table 2]. Coexistent serum autoantibodies were distinctly absent in NMOSD AQP4- group (p = 0.024) and present in 20% among other groups. The most common antibodies detected were antinuclear antibody (ANA) followed by antibodies to Mi-2 and SS-A. Radiological spectrum [Figures 1-3] The optic nerve imaging [Table 3] showed predominant long segment involvement with rare chiasmal affliction in MOGAD (p 0.096). Brain imaging showed grey matter involvement in non AQP4—Ab positive groups (p 0.059) and subcortical involvement in MOGAD (p 0.008). Brainstem involvement was significantly associated with NMOSD AQP4- group (p 0.01). Leptomeningeal enhancement was seen in all 3 groups along with cloudy and nodular pattern with no intergroup difference. Spinal cord imaging showed short segment lesions in 25.8% patients. Predominant location in all groups was cervicodorsal with predominant cervical (p 0.001) and cervico-medullary (CM) affliction (p 0.024) in non-MOGAD groups with predominant conus involvement in MOGAD (p-0.012). Bright spotty lesions in spinal cord were specific for NMSOD AQP4+ group (p <0.001). Therapeutic strategiesInitial acute therapy was either intravenous (IV) or oral glucocorticoids. Among the 384 events, 350 (91.1%) received acute therapy. Pulse IV glucocorticoids, immunoglobulin (IVIG) and plasma exchange (PLEX) was given for 330 (85.9%), 15 (4%) and 28 (7.4%) respectively. 95% received maintenance therapy with azathioprine (53.6%), mycophenolate mofetil (MMF, 38.2%) and rituximab (20%) with no significant difference among the groups. OutcomeThe mean number of relapses were 2.49 ± 2.493 and 91 patients had a relapse (polyphasic course) irrespective of therapy. Out of the 105 cases who were initiated on maintenance therapy, 61 (58.1%) patients never had a relapse. Relapse free cases were comparable between those on azathioprine and Mycophenolate mofetil but higher for rituximab. Patients on Rituximab had significant lesser relapses in NMOSD AQP4+ group (p 0.04). Mean time to relapse was 25.7 months. NMOSD AQP4- group had a lower mean time to relapse (19.3 months) as compared to the other groups, however, the difference was not statistically significant (p-0.62). 62.7% of the study population had near normal to mild residual disability and were independent for activity of daily living. 16.4% had moderate disability and severe disability was noted in 20.9% cases. Near normal recovery was more common in MOGAD patients however the results did not attain statistical significance. Conclusion: DiscussionOur study is a single centre retrospective study comparing between three distinct groups of antibody mediated primary demyelinating disorders —NMOSD AQP4+, MOGAD and NMOSD AQP4- entities and their phenotypic expression and response to treatment and outcome. Our cohort of 110 cases showed a predominance of NMOSD AQP4+ followed by the MOGAD and NMOSD AQP4- cases. We had found distinct presentation in each of these three groups both clinically and radiologically, however our study was underpowered in the subgroups to elicit significant results in treatment related aspects. However rituximab has emerged to be an important contender for the maintenance therapy for these conditions especially NMOSD. The expanding spectrum of NMOSD and MOGAD had led to a renewed interest in comparison and typifying these separate entities and double seronegative NMOSD requires further studies (4,9,10). A significant female preponderance with a ratio of 1:5 (male: female) in NMOSD AQP4+ group has been in concurrence with previous studies who have shown female dominance with variable M:F ratios (11,14). Our study had equalising effect on gender in MOG and NMOSD AQP4- group which is also consistent with few recent studies (14–16). Our study comprised cases with predominant adult age of onset with mean age of onset in third decade which is in line with the younger age of onset in Asian population as compared to Caucasians (11). Pediatric cases constituted one-third in all the subgroups which is consistent with MOGAD and NMOSD AQP4- groups; however is higher in the NMOSD AQP4+ group as compared previously reported literature of 3-5% (6,12,13). We had also found important differences in the clinical presentation such as isolated ON was more frequently reported initial phenotypic presentation in NMOSD AQP4+ and MOGAD, whereas NMOSD AQP4- had significantly lesser isolated ON presentation which is lesser than the recent study where 32% had ON presentation (14). Isolated TM was also seen in all 3 groups but was the most common presentation in NMOSD AQP4- group which is consistent with previous studies (18). APS was not found in MOGAD cases supposed by one Korean study which showed the rarity of APS as the initial presentation in MOGAD highlighting its specificity in diagnosing NMOSD AQP4+ over MOGAD (19). Out of the total 384 events, phenotypic presentations in each group showed significant differences. Not only initial attack, but isolated ON events were much lesser in NMOSD AQP4- group (24.4%) than the other groups and the results were significant. Interestingly, brainstem and cerebellar presentations were commoner in the NMOSD AQP4- group and much lesser in MOGAD which were also significant. APS was exclusively present in non-MOGAD groups with maximum in AQP4 positive patients signifying its AQP4 rich region expression (20). ADEM presentations was more common in MOGAD which were consistent with previous studies (17). In our cohort, Lhermitte sign and painful tonic spasms were exclusively present in non-MOGAD groups with twice as common in AQP4 than the seronegative group, thus having a significant diagnostic specificity for NMOSD. However, on multivariate forced model with gender, the significance was diluted suggesting a gender impact on these conditions being found in female population predominantly. The course of AQP4 expressing differently in females need to be explored. Dual screening for AQP4 and MOG antibody status and reviewing of events MRIs in our study highlighted distinct differences in the 3 groups. Optic nerve was involved much more commonly in AQP4 group and bilateral involvement was commoner except in AQP4 negative patients where unilateral involvement was seen. Isolated anterior segment as seen in previous studies was common in MOGAD (16,21); however also seen in other groups reducing its differentiating effect. Majority had both segment involved with > 50% length; however chiasmal involvement was rare in MOGAD. Previous studies have corroborated the chiasmal predilection in non MOG cohort; however studies have shown shorter lesions to be present in MOGAD (22–24). Grey matter lesions were commoner in non- AQP4 positive groups; while subcortical involvement was significantly associated with MOGAD. Brainstem involvement were commoner in NMOSD AQP4 negative group which might be due to commoner brainstem presentations in our cohort. Leptomeningeal enhancement as seen commonly in MOGAD (24) was seen in all 3 groups in our cohort along with cloudy and nodular pattern suggesting overlap amongst the enhancement patterns in the groups (25). Spinal cord imaging also showed significant occurrence of isolated cervical cord or CM involvement in non MOGAD cases, whereas MOGAD has a predilection to conus; however cervicodorsal region remained a common location in all 3 groups (24). Predominantly long segment lesions were noted; however one-quarter had short segment lesions suggesting that a short segment lesions similar to MS may not be rare occurrence in these disorders (26). AQP4 group had significant specificity to bright spotty lesions; being a rare occurrence in MOG which was consistent with the literature (27). CSF cytology and IgG index are not helpful in differentiating these three groups. But, association of other serum antibodies was present in around 20% of cohort with a striking absence in seronegative group which was also reported previously. This might suggest a different pathophysiology of the NMOSD AQP4 negative group which needs to be further researched (28). Oral steroids, Azathioprine and MMF as maintenance therapy had no intergroup differences, while Rituximab had a significant reduction in relapses with remission in 77.3% cases with significant reduction in relapses characteristically in NMOSD AQP4+ group. The superiority of rituximab has been reported in various studies with 70% relapse free on 7 years follow up in NMOSD (29,30). With the mean disease duration of 78.8 months and mean follow-up of 44 months, nearly 83% cases relapsed irrespective of therapy suggesting that all the 3 groups had a higher propensity to eventually relapse highlighting the need for early maintenance therapy. MOGAD which was earlier thought to be a monophasic disease has a relapsing course corroborated in recent studies (16,17). Among the outcome variables, time to first relapse irrespective of therapy was earlier in NMOSD AQP4- group as compared to NMSOD AQP4+ group thus highlighting the need for an early suspicion and diagnosis of this NMOSD AQP4- entity as it has no biomarkers causing delay in treatment which could lead to earlier relapses (14). Majority of the patients in all the groups had a near normal recovery or mild disability. MOGAD had a trend towards milder disability while NMOSD AQP4+ patients had more proportion of severe disability cases as compared to other groups. A larger multicentre study will be required to validate these results and to typify the predictors of disability outcome. This is a single centre study from the south India with fair number of cases for interpretation and analysis. The strength of the study lies in the strict classification based on fixed cell-based assays for inclusion and categorising of the groups into NMOSD AQP4 positive and negative groups and MOGAD. We also had considerable number of double seronegative NMOSD which is an under explored group for analysis and derived few clinically and radiologically significant parameters to distinguish these three entities. Duration of follow-up was also sufficient enough to report the outcome and disability parameters. However sample size were underpowered to study the effect of each therapy in these groups for which larger cohorts are needed. Retrospective nature of study is one of the limitation as event related details were taken from chart records. CONCLUSIONThe three groups have distinct demographic, phenotypic presentations along with MR imaging features and treatment effects. NMOSD AQP4+ group had female preponderance and more frequent ON presentations and had shown significantly reduced relapse rate on rituximab. Whereas, NMOSD AQP4- group had more TM and brainstem presentations and ON presentation was rare and had an earlier time to relapse irrespective of therapy. MOGAD has a unique spectrum with rarity of APS, tonic spasms, Lhermitte and chiasmal involvement which can be used for narrowing the diagnosis. The common thread remains the higher propensity for a relapsing course needing early immunomodulatory therapy.
Figure 1.
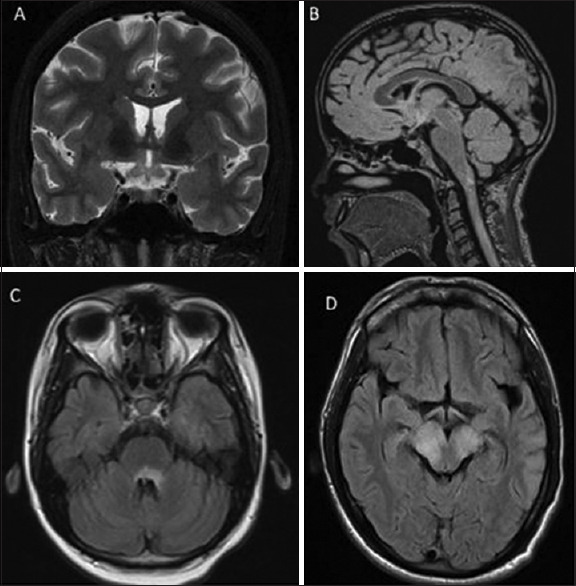
AQP4—Ab positive NMOSDA. A case of bilateral ON with MRI Brain T2 coronal fat supressed image showing hyperintensities involving the optic chiasma and bilateral optic tract. B. A case of TM with MRI FLAIR sagittal 3D sequence showing hyperintensities involving cervicomedullary region C. Case of recurrent vomiting showing MRI FLAIR axial image with hyperintense area postrema region. D. Case of brainstem syndrome with MRI FLAIR axial suggestive of hyperintensity involving midbrain with bilateral cerebral peduncles


Figure 3.

AQP4—Ab negative NMOSDA. Case of TM with MRI T2 sagittal spinal cord showing long segment hyperintensities involving the cervical cord from C2 to C6. B. Case of ataxic presentation with MRI Brain FLAIR axial sequence showing hyperintensities in left cerebellar hemisphere and left MCP. C. Case of vomiting with hypoglossal palsy with MRI FLAIR axial sequence showing hyperintensities in medulla involving right hypoglossal nuclei. D. Case of focal seizures with MREI Brain FLAIR 3D sequence showing cortical hyperintensities involving the mesial frontal- cingulate region and parietal- postcentral region

Figure 2.
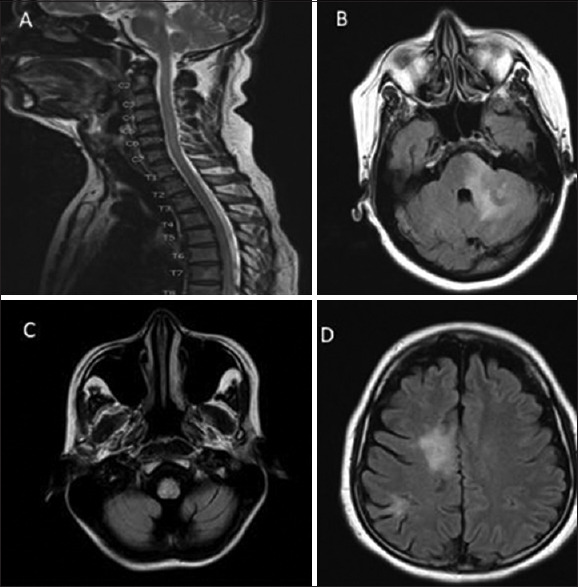
MOGAD group A. Case of ON with MRI T1 gadolinium contrast coronal sequence showing perineural enhancement in bilateral optic nerves. B. Case of TM with Post contrast T1 spine showing conus involvement. C. Diencephalic syndrome with FLAIR 3D axial sequence with hyperintensities in bilateral thalamus and PAG region. D. Case of focal seizures showing axial FLAIR 3D sequence showing sulcal hyperintensities in insular cortex

Award ID: 29
Diagnostic Utility of Next Generation Sequencing in Leukodystrophies and Genetic Leukoencephalopathies
Manisha K. Yalapalli, Soumya Sundaram, Prashanth Poulose, Ramshekhar N. Menon, Ajith Cherian, Divya K P, Sruthi S. Nair
Neurology, Sree Chitra Tirunal Institute for Medical Sciences and Technology, Thiruvananthapuram, Kerala, India
E-mail: doctormanishakaramala@gmail.com
Background and Aim: White matter disorders can be acquired or genetic. The genetic white matter disorders are termed as leukodystrophies (LD). They are defined as heritable disorders affecting white matter of the central nervous system with or without peripheral nervous system involvement. The diagnosis depends on the magnetic resonance imaging (MRI) appearance of brain. LD is broadly classified into hypomyelinating disorders and other white matter pathology which includes demyelination 1. T2-weighted (T2W) hyper intensity in the affected white matter, along with mildly hypo or iso to hyper intense appearance of white matter in T1-weighted (T1W) sequences relative to cortex is consistent with a hypomyelinating leukodystrophy. Significantly hypointense appearance in T1W in the presence of T2 hyper intensity indicates demyelinating LD or LD due to other white matter pathology (Schiffman, 2009) 2. Leukoencephalopathies are disorders with significant white matter abnormalities that did not meet criteria for LD with primary neuronal involvement and systemic manifestations over and above white matter abnormalities.1 They are clinically and genetically heterogenous disorders with diverse etiology encompassing demyelination, hypomyelination, astrocytic and microglial defects. (Chen et al., 2021)3 The diagnosis of LDs and genetic leukoencephalopathies (gLE) are challenging and majority of them remain undiagnosed, placing a high economical and psychological burden on the affected families. There are as yet many unidentified genetic aetiologies for this disease spectrum. Advances in gene sequencing like whole exome (WES) and whole genome sequencing (WGS) unravel the causes of LDs. 10 It confirms the diagnosis and may offer a chance for disease specific treatment in some conditions or experimental therapies. Molecular genetic analysis would also help to streamline genetic counselling, family screening and reproductive decisions.9 The reason for the recent increase in diagnosis of LDs is the availability of genetic testing and reduction in cost making genetic testing more feasible. Next generation sequencing (NGS) has the potential to achieve the diagnosis in a shorter time and less cost with a single DNA based test through targeted capture of exomes. 8 It is a cost effective test and should be considered in conditions with heterogenous phenotypes with diagnostic dilemmas. There is a paucity of data regarding the utility of NGS in diagnosis of leukodystrophies especially from India. Hence this study was planned to assess the utility of next generation sequencing in the diagnosis of LD and genetic leukoencephalopathies and to study the genetic spectrum in Indian population Methodology: This is a single centre retrospective cohort study of patients with genetically confirmed leukodystrophies and leukoencephalopathies. The period of study was from January 2016 to December 2021. The search terms “Leukodystrophy “,”leukoencephalopathy”, “hypomyelinating “demyelinating” and individual disorders like Krabbe, metachromatic leukodystrophy etc, were applied to the electronic medical records of patients who attended the outpatient services and those who were admitted in the paediatric neurology subdivision and department of neurology of Sree Chitra Tirunal Institute for Medical Sciences and Technology (SCTIMST). Individual case files were scrutinised for the clinical details, neuroimaging and NGS results for inclusion in the study. Patients matching clinical and imaging profile for gLE with progressive neurological syndrome, T2 hyper intensities of white matter and genetic confirmation on NGS were included in the study. Patients with incomplete data, other causes of cerebral white matter hyper intensities such as vasculitis, inflammatory demyelination of central nervous system (CNS), vascular white matter disorders not due to genetic vasculopathy were excluded from the study. Clinical and demographic data including the age of onset, developmental aspects, clinical presentation, psychomotor regression, pyramidal and extrapyramidal signs, anthropometric measurements, ophthalmological findings (cherry red spot, retinitis pigmentosa and optic atrophy), facial and non facial dysmorphism, seizures, cerebellar signs, dermatological manifestations and presence of peripheral neuropathy were recorded. Family history was recorded for similar disorders, consanguinity or any other neurological disorders. The inheritance pattern was classified into autosomal recessive (AR), autosomal dominant (AD), sporadic, X-linked and mitochondrial. Laboratory studies including blood routine examination, renal and liver function tests, arterial blood gas analysis, plasma ammonia, immunological profile, cerebrospinal fluid (CSF) analysis with total counts, protein, glucose, oligoclonal bands, IgG index, specific enzyme studies, very long chain fatty acids (VLCFA) if done was collected. The findings from electrophysiological studies such as electroencephalogram, nerve conduction study and visual evoked potentials were recorded. Magnetic resonance imaging of brain MRI brain sequences were analysed by neuroradiologist and the sequences reviewed were T1W, T2W, fluid attenuated inversion recovery (FLAIR), susceptibility weighted imaging (SWI), diffusion weighted imaging (DWI) and magnetic resonance spectroscopy (MRS). Patients were classified based on MRI diagnostic algorithms of Van der Knaap et al. into hypomyelinating LD and LD due to other white matter pathology. 3 Radiological features were defined based on whether lesions were multifocal or confluent and predominant localisation of the lesions (frontal, parieto-occipital, periventricular, subcortical, diffuse cerebral and posterior fossa predominant). Presence of calcification, white matter rarefaction or cystic changes were also noted. Grey matter (basal ganglia, substantia nigra and dentate nuclei) and corpus callosum involvement were also assessed. Spine imaging when available was reviewed for any spinal cord involvement. Next generation sequencing analysis Genetic testing was done in all patients after informed written consent from parents of the proband (children), or caregiver (in adult patient unable to provide consent) and from adult patients who can consent. 4 ml Ethylene diamine tetra acetic acid (EDTA) blood was collected from each patient and the DNA extracted from blood was used to perform targeted gene capture using a custom capture kit. Illumina sequencing platform was used and the libraries were sequenced to mean >80-100X coverage. The sequences obtained were aligned to human reference genome (GRCh38.p13) using Sentieon aligner. Single nucleotide variants (SNVs) were annotated using the variant effect predictor (VEP) program (https://grch37.ensembl.org/Homo_sapiens/Tools/VEP) against the Ensembl release 99 human gene model. Small Indels, delins and copy number variants (CNVs) were detected from targeted sequence data using the exome depth method. Clinically relevant variants of gene were annotated and cross referenced with the literature evidence (segregation analysis, functional study, allelic dataset and genome wide association studies). The disease data bases like ClinVar (https://www.ncbi.nlm.nih.gov/clinvar/), Online Mendelian Inheritance in Man (OMIM, https://www.omim.org) and Leiden Open Variation Database (LOVD, https://www.lovd.nl). The allele frequency was estimated from the population datasets of 1000Genome Phase 3 (1000G), Genome Aggregation Database (gnomAD v3.0), dbSNP (v151) and the internal Indian population database. Common variants (>5%) were filtered out based on allele frequency. The clinical exome panel consisting of 6120 genes were used for clinical interpretation. The type of variants were denoted as missense, nonsense, frameshift, non-synonymous and splice site variants. The computation tools used for functional prediction of the variants were done using sorting intolerant from tolerant (SIFT) version - 5.2.2;, PolyPhen-2 and MutationTaster2. ACMG classification were used to classify the variants into pathogenic (P), likely pathogenic (LP) and variants of uncertain significance (VUS) (Richards et al., 2015)5 Diagnosis of leukodystrophies and genetic leukoencephalopathies The clinical, neuroimaging and the genetic tests results were used for the final diagnosis in each patient. These disorders were classified based on the proposed classification system put forth by Van der Knaap and were classified under Myelin disorders (hypomyelination, demyelination and myelin vacuolization), astrocytopathies, leuko-axonopathies, microgliopathies and leukovasculopathies.4 The identified gene variants were compared with the OMIM and the clinVar database for the description of the clinical phenotype. If there is genotype-phenotype correlation, then the gene is attributed to be disease causing especially in patients having VUS. For the calculation of diagnostic yield of NGS, only P and LP variants were included. StatisticsThe clinical, imaging and genetic profile of the patients was analysed in microsoft excel using descriptive statistics by the presenting author. Institute Ethics Committee: The study has the approval of the institutional ethics committee from Sree Chitra Tirunal Institute for Medical Sciences and Technology. Result: The search results using key word entry in the EMR of the institute yielded 136 patients of which only 91 patients were included in the study based on the inclusion and exclusion criteria [Figure 1]. The mean age at onset was 5.63 ± 8.75 years and 40 (44%) were females. 83 patients (91.2%) had pediatric onset (<18 years of age). The predominant clinical presentation was developmental delay, followed by seizures, gait difficulty, psychomotor retardation, cognitive decline and ataxia which were seen in 26 (28.6%), 22 (24.2%), 13 (14.3%), 21 (23.1%), 5 (5.5%) and 4 (4.4%) patients respectively. Visual impairment was present in 22 patients (24.2%) and hearing impairment in 9 patients (9.8%). The most common ocular finding noted on fundus examination was optic atrophy (6), retinitis pigmentosa (5) and cherry red spots (3). Seizures were noted in 48 (52.7%) and myoclonus was noted in 19 (20.8%) patients. 47 (51.6%) of them had EEG abnormalities. MR brain imaging showed hypomyelinating pattern in 42 probands (46.7%) and 49 (53.3%) had other white matter pathology. Predominant lesions in other white matter pathologies were frontal in 2 (2%), parieto-occipital in 7 (7.6%), periventricular in 14 (15.4%) and diffuse cerebral in 15 (16.5%) pro bands. Brain stem involvement were seen in 8 patients (8.8%) and cerebellar involvement in 20 (21.9%). Diffusion restriction was noted in 12 patients (13.2%). Family history was positive for similar illness in 14 (15.3%) and consanguinity in 36 (39.5%). 94 patients underwent clinical exome sequencing and 91 had positive test results. As per ACMG criteria, pathogenic variants [Table 1], likely pathogenic [Table 2] and VUS [Table 3] were reported in 35 (38.4%), 20 (21.9%) and 36 (39.5%) patients. Among them 78 probands (85.7%) matched phenotypic profile. The most common variant type were missense followed by nonsense, deletion, insertion, duplication, indels and splice site variation. The most common mode of inheritance was autosomal recessive in 73 (80.2%) followed by X linked in 8 (8.7%) and autosomal dominant in 6 (6.5%) and mitochondrial in 4 patients (4.3%). 58% of variants were homozygous, 34% were heterozygous, 5% hemizygous and 3% were heteroplasmic. The diagnostic yield of genetic testing was 60.4% considering the pathogenic and likely pathogenic mutations. If VUS in the gene matching the clinical and radiological phenotype of LD were considered, the yield increased to 84.7%. Of the total variants identified 50 (44.6%) were novel. Most common variants identified in genes in our cohort were ARSA (5), GLAC (4) followed by L2HGDH (3), ABCD1 (3), HEXA (3), PLP1 (3), and CLN 6 (3) causing metachromatic leukodystrophy, Krabbe disease, L-2- hydroxy glutaric aciduria, adrenoleukodystrophy, Tay Sachs, Pelizaeus Merzbacher disease and Neuronal Ceroid lipofuscinosis respectively. As per Van der Knaap classification4, myelin disorders constituted the majority which was seen in 48 patients (52.7%) which include demyelinating, hypomyelinating and myelin vacuolisation disorders with m genes identified [Figure 2] ARSA (5), PLP1 (3), GALC (3), ABCD 1 (3), GJC2 (2), SUOX (2), CYP27A1 (1), FBP2 (1), DEGS1 (1), POL3RB (1), POL3RA (1), IDUA (1), GFAP (1), PLEKHG (1), L2HGDH (2), LYRM7 (1), FOL1R (1), ALDH3A (1), MT-ND3 (1), MT-TL1 (2) and FIG4 (1). Leukoaxonopathies were seen in 22 patients (28%) which includes CLN5 (3), CLN6 (3), CLN8 (2), HEXA (3), CLN3 (1), TUBB4A (1), PEX1 (1), SGSH (1), SLC17A5 (1), TPP1 (2), KCTD 7 (1), POLG (1), MFSD8 (1), SLC17A5 (1). Astrocytopathies were observed in 6 patients (7%) spanning ERCC8 (1), RNASE H2C (1), CLCN2 (1), MLC1 (2) and EIF2B3 (1) and microgliopathies in 2 patients (3%) due to CSF1R gene variation [Figure 3]. No leukovasculopathies were noted in our cohort. Conclusion: Discussion Inspite of various MRI pattern recognition approach, the diagnosis of leukodystrophies still remains a challenge considering the broad differentials. 11 Recent reports indicate next generation sequencing has improved detection in various genetic conditions. In our study, we assessed the utility of next generation sequencing among patients of leukodystrophy and genetic leukoencephalopathies identified using MRI patterns and the diagnostic yield of NGS for pathogenic and likely pathogenic variants were high (60.4%). We have followed the ACMG criteria for the variant classification 5 and around 40% were found to have met the criteria for only VUS. Around 78 patients with identified genetic mutation had imaging pattern consistent with the specific phenotype of the gene and in such cases the gene was said to be disease causing; thus increasing the cumulative yield when VUS were included to 84.7%. We have also identified 50 novel variants in our cohort. Autosomal recessive was the most common pattern of inheritance and majority of the variants were homozygous which could be very well explained by the high consanguinity in our population. Among the white matter abnormalities, myelin disorders were most common comprising predominantly ARSA, PLP1, GALC, ABCD 1 and GJC2 gene mutations and leukoaxonopathies with common genetic mutations in CLN5, HEXA, CLN6, CLN8 and TPP1. The high proportion of the NCL phenotype observed in out cohort could be due to the fact that ours is a high volume centre for epilepsy patients. Our cohort had less number of astrocytopathies and microgliopathies with no leukovasculopathies. The diagnostic yield in our study is higher when compared to a previous study done by Chen et al. 3, where they found a diagnostic utility of 44.4%, the population being adult onset leukodystrophy. Our study population predominantly comprised of pediatric onset, genetic aetiologies for leukoencephalopathy is more likely which would explain the higher diagnostic yield. In adult patients with white matter disorders, acquired causes like vascular, primary progressive multiple sclerosis, other inflammatory demyelinating disorders would be more thus decreasing the yield. 12,13 A recent study done by Vanderver et al. also suggested an increase in diagnostic yield to 75%, with addition of whole exome sequencing to other diagnostic modalities.6 The possible high yield in Vanderver et al., could be due to the fact that they used whole exome sequencing for genetic testing. However in our study we have used only clinical exome sequencing with coverage of only 6120 genes. Mahdieh et al., reported a diagnostic yield of 75% with whole genome sequencing in LDs in Iranian cohort.7 MLD, Canavan disease, Tay Sachs and adrenoleukodystrophy were predominant in this cohort; however Pelizaeus Merzbacher disease and POL3 related leukodystrophies were seen less commonly. Our cohort however showed, increased incidence of Pelizaeus Merzbacher, Krabbe, MLD and L-2-hydroxy glutaric aciduria along with Tay Sachs and Neuronal Ceroid Lipofuscinosis. These studies including ours suggest exome sequencing with either clinical exome or whole exome sequencing should be done as first tier investigation especially if MRI pattern recognition yields a broad differential diagnosis. Limitations of our study are that it is a retrospective study and exome sequencing was not pursued in all cases. Therefore the measurement of diagnostic yield might not be exact. Moreover, we have not done a trio based sequencing (including parents). We also did not proceed with functional studies for classifying VUS as disease causing which could have predicted a better diagnostic yield. Variants in untranslated region and intronic regions might have been missed as whole exome sequencing was not done in our cohort. Among all these limitations, ours is the first study which has detailed the genetic spectrum of LDs and genetic leukoencephalopathies from India. We have also included the paediatric and adult cases with sufficient large sample. Conclusion Our study confirms a high yield of incorporating next generation sequencing in the diagnosis of leukodystrophies and genetic leukoencephalopathies with diagnostic yield of 60%. NGS has the potential to decrease the unsolved cases of LD and genetic leukoencephalopathies and should be considered as first line diagnostic tool.


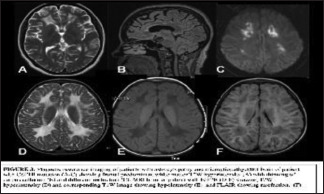
Award ID: 30
New Onset Unprovoked Seizure - Applicability of New ILAE 2014 Definition of Epilepsy and ILAE 2017 Classification of Seizures and Epilepsies – A Tertiary Care Hospital Based Prospective Study in South India
Keshava Anand
Co-Author:
Neurology, Care Hospital, Banjara Hills, Hyderabad
E-mail: dr_keshavaanand@yahoo.co.in
Background and Aim: Epilepsy is a common chronic neurological disorder with an estimated 69 million people with epilepsy (PWE) worldwide, 90% of them living in developing countries. The estimated number of PWE in India is about 6 million (1). The reported annual incidence of epilepsy in India was 27-60 per 100,000 (2). The overall estimated prevalence of epilepsy in developing countries was 5-74 per 1,000 (3) and in India it was 5.3 per 1,000 (4). Classification schemes are essential to facilitate diagnosis of seizure type and epilepsies, communication among health professionals, and communication between health professionals and PWE. Since the 1981 International League Against Epilepsy (ILAE) classification of epileptic seizures (5) and the 1989 ILAE classification of epilepsies and epilepsy syndromes (6) there have been several advances in neuroimaging, genomics and molecular biology improving the understanding of pathophysiology and anatomical substrates of epileptic seizures and epilepsies (7,8). This study aims to study the applicability of new ILAE 2017 classification of seizures (10), the new ILAE 2014 operational definition of epilepsy (9) and new ILAE 2017 classification of epilepsies (11) in consecutive patients with new onset unprovoked seizures attending both emergency department and outpatient neurology clinic in a tertiary hospital. Methodology: This is a prospective, observational study conducted on 150 patients of Out Patient (OP) and Emergency Department (ED), CARE hospital, Banjara Hills, Hyderabad, Telangana, diagnosed as “New onset unprovoked seizure”, for a period of 24 months from June 2017 to June 2019. The subjects were enrolled after a written informed consent. The approval of Institutional Ethics committee was taken prior to initiation of study. The inclusion criteria of study population were age > 18 years, patients presenting with New onset unprovoked seizure (including reflex seizure). The exclusion criteria were age < 18 years, diagnosis of Acute symptomatic seizure, patient is a diagnosed case of Epilepsy. All enrolled subjects were evaluated in detail by neurologist and the details were entered into pre designed proforma. The data was collected, and continuous variables were represented as mean and standard deviation where data follows normal distribution, otherwise as median with range. Categorical variables were represented as frequencies and percentages. The statistical significance and difference in the outcome variables between the groups was assessed using z- test. p value of less than 0.05 was considered as significant. Data was analysed using R studio. Result: 1) Of the 150 patients, 42 (28%) visited OP clinic and 108 (72%) visited ED. The mean age of the total cohort was 55.35 ± 19.04 years (range = 18-86 years). The patients who attended OP clinic were younger in age (43.60 ± 19.89 vs. 59.92 ± 16.66 years, p < 0.01). There was no gender difference [Table 1]. 2) Of the 150 patients of new-onset of unprovoked seizure, diagnosis of epilepsy was established after the first seizure in 79 (53%) patients. Diagnosis of epilepsy was established after the second seizure in 13 (8.7%) patients, 11 presented to the OP clinic after 2 unprovoked seizures 24 hours apart. Of the 60 patients who were not classified as epilepsy at the first visit, 2 patients developed second seizure during follow-up in the OP clinic. 3) Of the total cohort of 150 patients with new-onset unprovoked seizures, diagnosis of epilepsy by traditional definition was made in 13 (8.7%) patients only. 4) After first unprovoked seizure: five (6%) had epilepsy syndromes (Juvenile myoclonic epilepsy in four and Juvenile absence epilepsy in one), 74 (96%) had epilepsy due to structural lesion, abnormal epileptiform EEG, or abnormal neurologic deficit, all with enduring predisposition for recurrent seizures [Table 2]. 5) Of the 92 patients, 62 patients (68%) had unprovoked seizure due to a structural lesion which has enduring predisposition for recurrence of seizures. The etiological spectrum of structural causes of epilepsy included Gliosis (42 patients), Calcified granuloma and Mesial temporal sclerosis (6 patients), Subependymal heterotopia (3 patients), Cystic lesion (2 patients), Developmental venous anomaly / Calcified meningioma / Oligodendroglioma (1 patient). 6) Male gender, abnormal neurologic examination, and interictal EEG abnormalities predicted the diagnosis of epilepsy. Focal onset seizure either alone or in any combination could not predict the diagnosis of epilepsy [Table 3]. 7) Focal onset seizure (50%) was the most common seizure type followed by generalized onset seizures (31%). Generalized onset seizures include generalized tonic, generalized tonic-clonic (GTCS), myoclonic jerks (MJ) and typical absence seizures (TAS) [Table 4, Figure 1] 8) All the 10 patients with simple partial seizure by ILAE 1981 classification could be classified under focal onset aware motor or sensory seizure. Of the 36 patients with complex partial seizures by 1981 classification, the seizure type could be refined into focal impaired awareness motor in 25 (7%) and non-motor in 11 (3%). 9) All the 28 patients who were grouped under unclassified seizures by 1981 ILAE classification were classified under unknown onset group [Table 5]. 10) The Epilepsy type by ILAE 2017 classification showed the most common type of epilepsy was focal (55%) followed by generalized (24%) [Figure 2]. There was no difference in the epilepsy types and etiology between ILAE 1989 and ILAE 2017 classification systems of epilepsies [Figure 3]. Conclusion: We studied prospectively the applicability of new ILAE 2014 epilepsy definition and ILAE 2017 seizure and epilepsy classification in 150 patients with new-onset unprovoked seizure visiting OP clinic and ED of tertiary care corporate hospital. Of the 150 patients with new onset unprovoked seizures, only 13 (8.7%) patients were diagnosed to have epilepsy by the traditional epilepsy definition. By applying new 2014 epilepsy definition, 79 (53%) were classified as epilepsy after first seizure. Of these 79 patients 5 (6%) had epilepsy syndromes and 74 (94%) had epilepsy due to structural lesion, abnormal epileptiform EEG, or abnormal neurologic deficit, all with enduring predisposition for recurrent seizure. The only study that applied new ILAE 2014 definition of epilepsy is Long Term Prognosis of Epilepsy study (PRO-LONG). In the PRO-LONG study for 15.1% patients, diagnosis of epilepsy was established after first seizure by applying new ILAE 2014 definition of epilepsy. However, PRO-LONG study was retrospective clinic-based study. In this the risk factors for recurrence were abnormal neurological examination and focal epilepsy (12). In our study we compared patients who fulfilled the diagnosis of epilepsy with those patients who had not fulfilled the diagnosis of epilepsy. Factors associated with diagnosis of epilepsy after first seizure, were male gender, epileptiform EEG, and neurological deficits. Focal onset seizure in any combination did not predict seizure recurrence. In the PRO-LONG study, the risk factors for recurrence after first seizure were focal seizures or abnormal findings in at least one among neurologic examination, EEG, and neuroimaging (12). Only two studies (13,14) compared the 1981 ILAE seizure classification system (5) with new 2017 seizure classification system (10). With 1981 seizure classification system, seizures in 28 subjects were not classifiable (unclassified). Whereas new ILAE seizure classification system allowed classification of all the 150 seizures into one of the following: focal onset, generalized onset, or unknown onset. In addition, it allowed further refining complex partial seizures. Similar were the findings in the other two studies (13,14). There was no difference in the epilepsy types and etiology between ILAE 1989 and ILAE 2017 classification systems of epilepsies (14) The ILAE 2014 definition of epilepsy, ILAE 2017 classification of seizures and epilepsies allowed for diagnosis of epilepsy in more than 60% of patients. This classification can be applied with minimum investigations and it is of great help especially in resource poor countries. ILAE 2017 seizure classification can be applied to new onset seizure cases with detailed eyewitness account of seizure semiology. Including the category of unknown onset motor seizures majority of seizures can be classified based on onset whereas in 1981 classification many seizures remained unclassified.


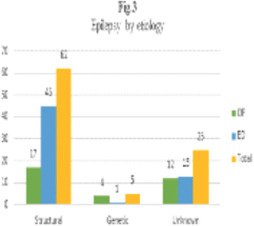
Award ID: 31
Exploring Neuroanatomical Morphometry and Gait Dysfunction in Patients with Progressive Supranuclear Palsy and Vascular Parkinsonism
Koustav Chatterjee, Subhadip Paul, Supriyo Choudhury, Rebecca Banerjee, Mona Tiwari, Purba Basu, Hrishikesh Kumar
Department of Neurology, Institute of Neurosciences Kolkata, West Bengal, India
E-mail: chatterjeekoustav@gmail.com
Background and Aim: Progressive supranuclear palsy (PSP) and Vascular parkinsonism (VaP) are two forms of parkinsonism. They are grouped under atypical parkinsonism and secondary parkinsonism respectively. Despite their heterogenous etiologies, both PSP and VaP may present with similar clinical symptoms which sometimes is a challenge to distinguish with a naked eye. Among various subtypes of PSP, PSP-Richardson’s syndrome (PSP-RS) is the most prevalent where gait, postural instability are the commonest symptoms (1). These symptoms can also be noticed in a group VaP (VaP with PSP like conditions). Gait is considered to be an important indicator of overall health (2). Poor gait performance in older adults and in various neurodegenerative conditions is associated with greater morbidity, mortality and fall risk (3). Over the years several approaches including electroencephalography, functional near infra-red spectroscopy, positron emission tomography, magnetic resonance imaging (MRI), magnetic resonance spectroscopy, diffusion tensor imaging showed involvement of higher-order cognitive process and interaction of various spinal and supraspinal structures in gait performance across individuals (4, 5). Adopting cross-sectional and longitudinal study designs to explore the relationships between discrete gait characteristics and brain structure and function are useful to understand neural correlates of gait. These techniques are used to analyse the brain on both a global and regional level, aiding our understanding of the general imaging parameters associated with gait. Brain volume was the most commonly derived brain imaging parameter and associations between brain volumes and gait characteristics are already available. There are several reports where gait impairments were associated with brain deterioration, specifically gray matter atrophy and white matter integrity loss. Moreover, gait velocity and gait variability, two important global measures of gait control were most frequently associated with these imaging markers within disperse brain regions. Brain structures and functions get altered in brain pathologies as observed in various age-related neurodegenerative conditions. Therefore, examining gait impairment and exploring its neuroanatomical correlates could be crucial in understanding the pathophysiology and development of patient-centered outcomes in PSP-RS and VaP, as well. Though gait has been investigated in PSP and its different subtypes, there are limited studies exploring gait in VaP (6, 7). Moreover, morphometric analysis that link to specific aspects of gait are lacking in VaP. This lack of clarity causes difficulty in discerning whether individual neural regions or networks should be targeted in a different manner when aiming to improve gait impairments. The objectives of this study were to characterize and compare gait between PSP-RS and VaP. Also, we wanted to identify and correlate the distribution of region-specific neuronal loss and volumetric measures with underlying gait impairment in PSP-RS and VaP. Methodology: The study was approved by the institutional ethics committee, and all participants provided written consent for participation in the study. A total of 20 PSP-RS patients were recruited from movement disorder outpatient department at a tertiary care neuroscience hospital in the eastern part of India. PSP was diagnosed and classified into PSP subtypes by a movement disorder neurologist according to the MDS criteria (8). In addition, 13 consecutive VaP were recruited fulfilling the criteria for VaP (9). Demographic and disease profile, routine physical and neurological examinations were done. They were also screened for cognitive impairment by the mini-mental status examination (MMSE)(10). Patients scoring MMSE < 18 were excluded from the study. Detailed assessments for cognitive and executive functions were performed through Mattis Dementia Rating Scale (DRS-2) and Frontal Assessment Battery (FAB)(11, 12). Motor severity was assessed using the MDS Unified Parkinson’s Disease Rating Scale part III (MDS-UPDRS-III)(13). Objective evaluation of the severity and stage of PSP was performed by the PSP rating scale (PSPRS)(14). In order to assess spatio-temporal parameters of gait, subjects were instructed to walk, 4 times successively at the self-selected normal pace without any aid on a 500 cm long electronic walkway (GAITRite, CIR Systems Inc., USA) which has pressure sensors embedded in it. Subjects bedridden or wheel chair bound or unable to walk independently without walking aid, for at least 10 meters were excluded from the study. Also, subjects with comorbid neuropsychiatric illnesses and unrelated neurological conditions like, history of stroke, peripheral neuropathy and/ non-neurological conditions (for example, lower limb or back pain) and / uncorrected visual disturbances which were likely to affect walking were excluded from the study. Participants underwent a standardized MRI protocol on a 3T Siemens Prisma scanner, which included a T1-weighted 3D magnetization prepared rapid gradient echo sequence (T1-MPRAGE). We excluded patients with concurrent illnesses/conditions that could account for symptoms or confound MRI, and if MRI was contraindicated. All the clinical measures and imaging were performed on subjects within 1 month from the day of recruitment. MRI structural images were acquired on a Siemens (Skyra model) 3T scanner using a 64 channel Siemens head coil. Head movements were minimized by placing a band over the forehead during the scanning procedure. A high-resolution T1-weighted MRI volume data set of the whole brain with a resolution of 1 x 1 x 1 mm3 was acquired using a Magnetization Prepared Rapid Gradient Echo (MPRAGE) sequence with the following parameters: Repetition time (TR) = 2000.0 ms, echo time (TE) = 2.28 ms, flip angle = 8°, matrix size 256 x 256; FOV = 247 mm. Total scan time was 4 mins 56 sec. All scans were inspected visually for any gross structural abnormality or artifacts by an expert neuroradiologist (M.T.) before proceeding for further analysis. The image files in DICOM format were transferred to a Linux workstation for morphological analyses. Surface-based analysis was carried out using FreeSurfer version 6.0 (Massachusetts General Hospital, Harvard Medical School; http://surfer.nmr.mgh.harvard.edu)(15). The FreeSurfer pipeline performs imaging intensity normalization, removal of non-brain tissues, segmentation of cortical and subcortical brain regions into white and gray matter, spherical surface-based intersubject registration, which is based on the cortical surface curvature (sulci and gyri), and, finally, an automated parcellation of the cortical surface. Quality control of the Freesurfer output was done by visual inspection. When errors were noted the first approach was to edit these errors and, if errors remained after rerun of the edited output, the images were discarded from further analysis. All the data were statistically analyzed using SPSS software package Version 20 (IBM, Armonk, NY, USA). The normality of the data was examined using Shapiro–Wilk test. For categorical data, absolute (number) and relative (percent) frequencies were determined and compared by use of the χ2 test. Unpaired ttest was used to compare the means for normally distributed data and Mann–Whitney Utest was used to compare non-parametric data. Oneway ANOVA was used to compare parametric variables, whereas Kruskal–Wallis ANOVA was done to understand if significant differences in mean score on all the nonparametric variables. Spearman’s correlation was used to find associations between all the gait parameters and anatomical measures in our whole data. A permutation test was used to obtain results that may generalize to other samples (i.e. providing a p-value that approximates the probability that the score would be obtained by chance). P values of <0.05 were considered statistically significant for all the statistical tests. Result: Demographic and clinical sample characteristics are summarized in Table 1. The groups were matched for age, gender and disease duration. Therefore, further analyses did not take into account the possible effects of gender, age and disease duration. However, UPDRS scores on part III as well as the H&Y score were significantly higher in PSP-RS compared to VaP. Majority of the spatio-temporal gait parameters were found to be comparable between our patient groups [Table 2]. Patients with PSP-RS displayed greater step time variability [PSP-RS: 0.08 (0.04) vs VaP: 0.04 (0.01), P = 0.0001], swing time variability [PSP-RS: 0.09 (0.09) vs VaP: 0.03 (0.01), P = 0.0002], stance time variability [PSP-RS: 0.12 (0.06) vs VaP: 0.05 (0.02) P = 0.0001], and stride time variability [PSP-RS: 0.12 (0.07) vs VaP: 0.06 (0.02) P = 0.005] as compared to VaP [Figure 1]. Neuroanatomical measures showed no significant differences in total intracranial volume (p = 0.667) and total gray matter volume (p = 0.961) between PSP-RS and VaP. However, we observed a significant difference in subcortical gray matter volume [PSP-RS: 43.81 ± 39.01 ml. vs VaP: 49.90 ± 38.79 ml., p < 0.001] between them. Therefore, subcortical gray matter volume was further used to normalize the volume of different subcortical structures. We found significantly smaller volume in PSP-RS patients than in VaP in the thalamus bilaterally and left caudate. On the other hand, significant volume loss in the bilateral cerebellar cortex, hippocampus, amygdala, acumbens area and right putamen were observed in VaP compared with PSP-RS [Table 3, pFDR ≤ 0.05]. In contrast to subcortical regions, we did not find significant differences in the volume, surface area and curvatures of any cortical gray matter regions. Also, no significant differences were observed in mean cortical thickness of entire cerebral cortex between PSP-RS and VaP. Interestingly, bilateral insula was found to be significantly thinner in VaP patients than in PSP [Table 4, pFDR ≤ 0.05]. To explore the relationship of gait and cortical measures, thickness of individual cortical regions was normalized to mean cortical thickness before running the spearman’s correlation. Variability of stance time, swing time and step time were shown to be positively correlated with thickness of both the left and right insular cortex. Moreover, thickness of left insular cortex was positively correlated with stride time variability but, negatively correlated with stride velocity. On the other hand, thickness of right insular cortex is positively correlated with step length variability. Similarly, volume of individual subcortical regions was normalized to total subcortical gray matter volume. Stride time variability was shown to be positively correlated with volume of the right cerebellar cortex. Swing time variability was positively correlated with volume of the left amygdala and right hippocampus. Stance time variability and step time variability were shown to be positively correlated with volume of cerebellar cortex bilaterally. Besides, step time variability was positively correlated with the volume of the right hippocampus. Volume of the right and left accumbens area were negatively correlated with stride length variability. Swing time was positively correlated with volume of both left and right accumbens area but, negatively correlated with volume of the left caudate. Also, volume of the right accumbens area was negatively correlated with cadence and stride velocity variability. Furthermore, stride velocity variability was negatively correlated with volume of the right thalamus. Step time asymmetry was negatively correlated with volume of the right thalamus. Base width was positively correlated with volume of the left caudate nucleus. Conclusion: Our study compares gait and neuroanatomical measures like, volume, thickness, surface area and curvature of different cortical regions along with volume of different subcortical structures in patients with PSP-RS and VaP. Furthermore, this study reveals the neuroanatomical correlates of gait impairment in these two diseases. We found that compared with VaP patients, PSP-RS had significantly greater step time variability, stride time variability, stance time variability (i.e., the variability in the time from initial foot-floor contact until final foot-floor contact) and swing time variability (i.e., a measure of stride-to-stride consistency) even in the comparable age groups. These results suggest that patients with PSP-RS exhibited dysfunction in temporal domains of gait as evident in previous studies (6, 16, 17). From our study findings it is evident that irregularity of timing of steps was significantly higher in patients with PSP-RS than VaP, however, amplitude of stepping was comparable between them. Gait variability, defined as fluctuations in gait characteristics from step to step, is a quantifiable feature of walking that has been shown to be altered (both in terms of magnitude and dynamics) and related to future falls and mobility disability in older adults and various neuro-degenerative disease (e.g., Parkinson’s and Alzheimer’s disease [10-19]. Similar to our findings, previous studies suggested that postural imbalance was found mostly in PSP-RS group while comparing different PSP subtypes and it showed association with multimodal imaging parameters. Usually, lower walking speed, reduced step length and increased step time have been interpreted as a more cautious, conservative gait pattern adopted to increase gait stability and decrease fall risk. These gait characteristics are seen in elderly subjects with aging. Our patients, however, had a comparable gait speed, yet gait variability was different in them. This might suggest that the stance time variability and swing time variability being the measure of dynamic balance do not get influenced by gait speed (18). It also suggests that gait speed and gait variability may be regulated by fundamentally different functional networks within the brain. This comparable gait patterns in our patients could at least partly depend on the ineffectiveness of medication on them as dysfunction of spatial gait variables (i.e., step length, step width) are generally responsive to dopaminergic treatment in PD patients (19) as our patient groups may not respond to dopaminergic medications. Step length variability were found to be deteriorated with the increasing severity of cognitive impairment in PSP patients. Step length variability may also be associated with a number of other factors related to the physical body and the nervous system. To explore the neural correlates of gait variability, we compared structural measures of gray matter in PSP-RS and VaP. This is the first study where neuroanatomical measures were investigated for exploring the gait dysfunction of PSP-RS and VaP. Earlier, Pan et al. studied brain gray matter abnormalities in PSP. They showed that as compared to healthy controls, patients with PSP demonstrated significant gray matter reductions in various cortical regions including the frontal cortices, insula, superior temporal gyrus along with subcortical regions like, striatum, thalamus, midbrain, and anterior cerebellum (5). Other imaging studies also demonstrated the atrophy of various brain regions including midbrain, premotor cortex, basal ganglia and thalamus in PSP. Previous studies suggested that prefrontal cortex is important for gait initiation and lower superior frontal volume strongly correlated to longer initial double support phase (20). Slower gait initiation and longer initial double support phase may lead to reduction in gait velocity which was comparable in our patient groups. Recent studies have demonstrated that slow gait speed associates with alterations in the function of the frontoparietal control network, which is closely linked to executive function. Similarly, our previous work showed that impaired executive function affects gait velocity in PSP. We speculated that reduction in the volume of frontal regions is similar in both PSP-RS and VaP as we observed comparable gait speed in PSP-RS and VaP. In contrast, we observed that PSP-RS patients exhibited reduced volume of subcortical gray matter as compared to VaP. Therefore, we expected to get significant differences in the volume of various subcortical structures between these patient groups. Patients with PSP-RS displayed reduction in volume of the thalamus bilaterally and left caudate as compared to VaP. On the other hand, significant volume loss in the bilateral cerebellar cortex, hippocampus, amygdala, acumbens area and right putamen were observed in VaP compared with PSP-RS. Basal ganglia structures have a prominent role in gait as Sintini et al., explained that the lower volume in supraspinal locomotor network regions including putamen and subthalamic nucleus are correlated with gait abnormalities in PSP-RS (20). Parallelly, previous studies advocated the prominent role of cerebellar cortex and its highly integrated connection to the brainstem and motor cortical areas for controlling posture and gait. These results are consistent with the notion that gait requires the complex interaction of brain networks including subcortical structures and cerebellum. Cortical thickness is another morphological phenotype which is known to be influenced by distinct genetic, cellular, developmental and evolutionary process in addition to diseases. The advantage of cortical thickness relies on its selectivity to detect changes in gray matter that may be more sensitive to cortical atrophy, compared to other gray matter volume analysis. In our patients’ group we did not observe any differences of global cortical thickness, however, more cortical thinning was observed in insular cortex bilaterally in patients with VaP as compared to PSP-RS. The associations between spatial, temporal, and spatiotemporal gait parameters and reduced cortical thickness have been widespread across cortical regions. Callisaya et al. showed that smaller gray matter in bilateral frontal, cingulate, insula, temporal, parahippocampal, parietal, occipital, cerebellar, thalamus, caudate nucleus, putamen, and claustrum associated with slower gait speed and shorter stride length. Other study showed that individuals with a thinner cortex of the left fusiform gyrus or the regions adjacent to the posterior insula, including the supramarginal gyrus, transverse and superior temporal gyrus, had gait impairment than those with a thicker cortex. Employing univariate analyses, we showed that stance time and step time variability were positively correlated with bilateral cerebellar cortex volume and insular thickness. Stride time variability was positively correlated with volume of the right cerebellar cortex. Previous literature suggests the connection of cerebellum with brainstem reticular formation and vestibular system in controlling posture and balance (21). We speculate that reduction of cerebellar cortex might disrupt the medial descending system resulting in profound dynamic instability in PSP-RS compared to VaP. The limitation of this study includes a lower sample size. Moreover, this is a cross-sectional study that limits to identify the causation of gait variability which was significantly different in PSP-RS and VaP. Also, visual input is an important form of sensory information for maintaining gait and balance. Clinically, patients with PSP-RS are diagnosed with vertical gaze palsy which is absent in VaP. Therefore, PSP patients could be expected to manifest greater gait and balance problems than VaP. However, the impact of impaired vision on variability of gait has not been assessed in this study. Our study describes that the patients with PSP-RS and VaP have similar gait characteristics despite the differences in their motor burden and disease severity. Postural imbalance, however is found to be a more prominent feature in PSP-RS as compared to VaP. Brain imaging findings furthermore demonstrate association of morphometric measures with gait parameters which in turn might reflect the involvement of dispersed cortical and subcortical regions in gait pathology in both PSP and VaP. The complexity of the associations between gait variability and morphometric patterns also supports the idea that gait is a multifaceted task that can be viewed as a process that requires various spinal and supraspinal structures and their connections. Our findings might be helpful in decoding the neuronal mechanisms underlying walking difficulty, balance problems, and executive functions in PSP and VaP.


Award ID: 32
Clinico- Radiological Profile of Neuromyelitis Optica Spectrum Disorders (NMOSD)- A Cohort Study from a Tertiary Care Center
Sri Sai Srujana Puppala
Neurology, Krishna Institute of Medical Sciences, Secunderabad, Telangana, India
E-mail: srujana.pss@gmail.com
Background and Aim: Neuromyelitis Optica Spectrum Disorders (NMOSD) are autoimmune chronic inflammatory neurological disorders with a prevalence of 4 to 10 per 1, 00,000 population with higher rates in African or Asian descent. Onset can occur anytime during the lifespan and is more common in women than men. The prevalence is 0.72 per 1 lakh south Indian population after the 2015 criteria. Neuromyelitis optica (NMO) and NMOSD are traditionally defined by the presence of myelitis and optic neuritis (ON). Antibodies to AQP4 are pathogenic and highly specific diagnostic biomarker for NMO which is considered an autoimmune astrocytopathy seen in 60% to 80% of patients with NMOSD. Among patients with an NMOSD phenotype who are seronegative for antibodies to AQP4 (AQP4-), 42% of have detectable serum antibodies to myelin oligodendrocyte glycoprotein (MOG). Compared with patients having AQP4 antibodies or patients who were seronegative, patients with MOG antibodies were frequently male, had a restricted phenotype (optic nerve more than spinal cord), mostly had bilateral simultaneous optic neuritis, more often had a single attack, had spinal cord lesions in the lower portion of the spinal cord and showed better functional recovery after an attack. Early diagnosis and initiation of adequate therapy is important to avoid relapses and persistent deficits. Long term immunosuppression with Rituximab (RTX) or Azathioprine (AZA) have emerged as the most effective therapies to reduce disease activity. There are limited studies from India on the phenotypic spectrum of these disorders, their response to therapy and outcomes. In this study, we evaluated and compared the clinical characteristics, imaging features, response to therapy, and disability outcomes in patients with NMOSD. Methodology: This study was started after approval by the institutional ethics committee and after taking consent from the patients. All the patients with the diagnosis of NMOSD as per Consensus criteria (2015) and following up for at least 6 months in the Neurology Department of our tertiary care hospital were part of the study. Few patients data was collected retrospectively but all patients were prospectively followed up between January 2021 until February 2022. Patients with other demyelinating disorders and other diseases presenting as optic neuritis and myelitis were excluded. Details of patient demographics were collected including age, age at onset, gender, time from onset to treatment, time until the diagnosis of NMO was made, associated autoimmune disease status, antibody status according to cell based assays, cerebrospinal fluid (CSF) analysis, visual evoked potentials, magnetic resonance imaging (MRI) findings (site, pattern and extent of involvement of lesions), treatment of acute attacks, relapse type, frequency and extent of its recovery. Each relapse was documented based on clinical worsening as well as imaging, wherever available. Visual and motor recovery was assessed with the help of visual evoked potentials and Modified Rankin score. All statistical analyses were analysed using SPSS (version 20). The chi square test was used for binary and categorical data. Student’s unpaired ttest was used for continuous variables. Result: Demographic data: A total of 34 patients with NMOSD were included in our study till date and the interim study details are as follows. The mean age in the study population was 31.2 years (±12.7 years) and mean age at onset was 29.67 (±12.8 years). The minimum and maximum age of the patients in our study was 11 years and 59 years respectively with majority 10 patients (29.4%) aged between 21-30 years. The majority of the patients were females 21 (61.8%) and female: male ratio in our study was 1.6: 1. Five (14.7%) patients had concomitant autoimmune disease antibodies. AQP4 antibody was positive in 11 individuals (32.4%) of which 9 (81.8%) were females and 2 (18.1%) were males. MOG Antibody was positive in 3 individuals (8.8%) and double seronegative NMOSD was seen in 20 individuals (58.8%). Disease presentation and course: Majority of the patients 11 (32.3%) presented with longitudinally extensive transverse myelitis (LETM) followed by optic neuritis (ON)9 (26.5%) and isolated brainstem syndrome 4 (11.8%). But in combination with other phenotypes, ON was seen in 17 (50%) at presentation followed by LETM in 13 (38.2%) and 11 (32.3%) with brainstem syndrome. The mean age of onset of patients presenting with LETM was 31.2 years was slightly higher than those presenting with ON 28.3 years. Mean age at onset in AQP4 Ab and MOG Ab positive patients was 28.8 and 25.7 years respectively. Mean time until the diagnosis and treatment for NMOSD was 14.3 ± 24.6 weeks. The mean duration of disease in study population was 15.9 ± 28.4 months. The mean age at diagnosis was 29.8 ± 12.8 years. Gender differences: There were no statistically significant differences between males and females for the age of onset (29.8 ± 12.8 vs 29.9 ± 12.9) and age of presentation (31.4 ± 12.7 vs 31.6 ± 12.8). Immunological profile: AQP4 Ab were positive in 11 (32.3%), MOG Ab were positive in 3 (8.8%) and 20 (58.8%) patients were seronegative. 5 (16%) had positive ANA profile. Females were seropositive (Aquaporin- 4 antibody positive) as compared to males (81.8% versus 18.2%). MOG antibody was positive in 2 female patients and a male patient in our study. Imaging features Onset of disease as isolated syndrome in majority of individuals 10 (29.4%) was in the form of LETM, followed by ON in 9 (26.5%) and brainstem involvement in 4 (11.8%). At the onset, spinal cord imaging of LETM (isolation and combination) was frequently seen to involve dorsal region 53.8% (7), cervical region in 23.1% (3) and cervicodorsal region 23.1% (3). Lower dorsal cord involvement was common in females and cervical cord involvement was seen frequently in males. Central cord hyperintensities on T2 were seen in 11/13 (84.6%). In combination ON involvement was seen in 50%. Entire brainstem was involved in 3 patients with brainstem involvement and all the three were MOG antibody positive. AQP4 antibody male patients had both optic neuritis and LETM in their disease course, of which one patient had holocord involvement and the other had cervical cord involvement. AQP4 positive female patients had Optic neuritis as a common manifestation. Treatment effects: Acute treatment strategies: Majority 26 (76.47%) of the patients received IV Methyl prednisolone, whereas 7 (20.6%) received both IV pulse steroids and plasma exchange and 1 (2.94%) received plasma exchange alone. Maintenance treatment: Majority 18 (44. 1%) received Rituximab as maintenance treatment followed by Azathioprine in 9 (23.5%), MMF was given in 3 (8.8%), Cyclophosphamide was given in 2 (5.88%) and oral steroids alone were given in 2 (5.8%). Azathioprine was replaced by Rituximab in 1 patient (2.94%) due to severe cytopenia and rashes despite not having TPMT mutation. Steroids were given as part of maintenance treatment in 17 patients (50%). Relapse rates A total of 8 patients had relapse after start of treatment (23.5%). 4 (50%) had relapse with LETM at onset, 3 (37.5%) had relapse with brainstem at onset and 1 (12.5%) had relapse with ON at onset. Median time to relapse after start of treatment was 54 weeks. Mean time for treatment initiation after symptom onset in patients with relapse was 2.25 weeks. Majority 6 (75%) who had relapse were seronegative, one (12.5%) patient with AQP4 Ab positivity had relapse and 1 patient (12.5%) with MOG positive status had relapse. 33.3% of MOG positive patients, 30% of seronegative NMOSD patients and 9.1% of AQP4 antibody positive patients had relapse after start of treatment. Patients who relapsed were mostly females 7 (87.5%) and 1 (12.5%) male patient had relapse. 7 out of 21 females showed relapse and 1 out of 13 male patients showed relapse. Relapse with positive autoimmune disease profile was seen in 3 patients (60%). Relapse on Rituximab was seen in 6/18 (33.3%) and mean time to relapse was 36 weeks. Relapse on MMF was present in 1/3 (33.3%) and mean time to relapse was 96 weeks. Relapse with cyclophosphamide was seen in 1/2 (50%) and time to relapse was 384 weeks. None had relapse on azathioprine. Treatmentrelated adverse events were seen in 7 patients (20.5%). Two patients developed steroidinduced adverse effects (weight gain and steroidinduced diabetes). Severe druginduced cytopenia was seen in one patient and rash in another patient when on Azathioprine. Fatigue was seen in 2 patients and another had headache while on treatment with Rituximab. Outcomes: Visual outcomes: Visual Evoked potentials on 3 month follow up showed improvement in 11 (32.3%). VEP worsened in 1 patient (0.02%) who had LETM at onset and took rituximab and VEP remained same in 21 patients (17.6%). VEP at baseline was normal in 16 (47%), prolonged in 13 (38.2%) and absent in 5 (14.7%) patients. Follow up VEP showed prolonged latency in 2 (5.8%) patients, absent in 5 (14.7%) and was normal in 27 (79.4%) patients. Improvement in vision was defined objectively with the help of visual evoked potential and as a change in disability compared to baseline status. Motor outcomes: A total of 20 patients had motor deficits during their clinical course. Improvement in motor function at follow up was defined as a change in disability as per Modified Rankin score when compared to the baseline deficit. MRS of 2 at follow up after minimum of 3 months was seen in 30 (88.2%). MRS of 3 at follow up was seen in 4 patients (11.76%) with 3 having LETM at onset and 1 with brainstem. MRS of 3 was seen in a patient of MOG positivity and the other 3 patients were seronegative. MRS of 3 was seen in 3 male patients and a female patient. All of them were on treatment with rituximab. Conclusion: NMO is an autoimmune astrocytopathy traditionally associated with serum AQP4 antibodies. There are only few studies in India after the 2015 consensus criteria which describe clinical, radiological features, visual outcome, motor outcomes and response to treatment. So in this study, we have tried to assess the demographic features, clinico- radiological features, treatment responses and disability outcomes. A total of 34 patients with NMOSD were included in our study till date and the mean age in the study population was 31.23 years (±12.75 years) with mean age at onset of 29.67 (±12.85 years). The minimum and maximum age of the patients in our study was 11 years and 59 years respectively with majority 10 patients (29.4%) aged between 21-30 years. The mean age of disease onset was younger as compared to previous studies. All our patients were Indians and many were of double seronegative NMOSD phenotype which could explain the younger age of onset. Our study also included seronegative patients who have been omitted in studies published before the introduction of the International Panel for Neuromyelitis Optica Diagnosis (IPND) criteria. The majority of the patients were females 21 (61.8%) and female: male ratio in our study was 1.6: 1. Female predominance in our study is similar to other previous studies as immune mediated diseases are common in females. In our study, AQP4 Antibody was positive in 11 individuals (32.4%) of which 9 (81.8%) were females and 2 (18.1%) were males. This is similar to other studies in which female patients are most likely to be aquaporin 4 Antibody positive. But the incidence of AQP4 A positivity is very less in our study probably due to partial treatment before referral to our center or due to the presence of unknown antibodies similar to AQP4 Ab causing NMOSD. MOG Antibody was positive in 3 individuals (8.8%) and double seronegative NMOSD was seen in 20 individuals (58.8%). The seronegative patients can become seropositive anytime later in the disease course. Five (14.7%) patients had concomitant autoimmune disease antibodies. The presence of coexisting autoimmune disorders was less frequent in our study when compared to the previous studies. The mean age of onset of patients presenting with LETM was 31.2 years, which was slightly higher than those presenting with ON (28.3 years). It was statistically insignificant. It may be due to optic nerve susceptibility to inflammation at a younger age. Majority of our patients 11 (32.3%) presented with longitudinally extensive transverse myelitis (LETM) followed by optic neuritis (ON) 9 (26.5%) and isolated brainstem syndrome 4 (11.8%). But concurrent ON at presentation was seen in 50% of the patients. This is probably because optic neuritis can be asymptomatic and LETM is more disabling and brings the patient to the physician. Mean age at onset in AQP4 Ab and MOG Ab positive patients was 28.8 and 25.7 years respectively. This is similar to studies in which MOG antibody disease is seen at earlier age groups compared to AQP4 antibody disease. Females were more likely to be seropositive (Aquaporin- 4 antibody positive) as compared to males (9 versus 2) like in previous studies. MOG antibody was positive in 2 female patients and a male patient in our study. There were no statistically significant differences between males and females for the age of onset (29.8±12.83 vs 29.9 ± 12.9) and age of presentation (31.4 ± 12.72 vs 31.6 ± 12.85). Onset of disease in majority of individuals 10 (29.4%) was in the form of LETM alone, followed later by ON alone in 9 (26.5%) and isolated brainstem involvement in 4 (11.8%) respectively. At the onset, spinal cord imaging of LETM (isolation and combination) was frequently seen to involve dorsal region. Lower dorsal cord involvement was common in females and cervical cord involvement was seen frequently in males. This could be due to higher concentration of aquaporin 4 receptors or susceptibility of that part of the cord based on gender. Central cord hyperintensities on T2 were seen in 11/13 (84.6%). This is similar to other studies in which central cord is affected due to the pathogenesis involved in NMOSD. Entire brainstem was frequently involved in 3 patients with brainstem involvement and all the three MOG antibody positive patients had brainstem involvement. MOG antibodies as understood from the previous studies frequently involve brainstem, supratentorial areas and conus regions. But in our study there was no MOG related myelitis and brainstem was frequently involved. AQP4 antibody male patients had both optic neuritis and LETM in their disease course, of which one patient had holocord involvement and the other had cervical cord involvement. This could be due to the involvement of these regions as they have maximum number of AQP4 receptors. AQP4 positive female patients had Optic neuritis as a common manifestation. Females are probably more prone to develop optic neuritis like in the case of multiple sclerosis similar to past studies. Majority 18 (44. 1%) received Rituximab as maintenance treatment followed by Azathioprine in 9 (23.5%). Rituximab and azathioprine have emerged as the effective first line therapies for NMOSD treatment so were frequently administered for maintenance treatment. Median time to relapse after start of treatment was 54 weeks. Mean time for treatment initiation after symptom onset in patients with relapse was 2.25 weeks. Relapse with positive autoimmune disease profile was seen in 3 patients (60%). Positive autoimmune disease is considered an indicator for the occurrence of other autoimmune diseases and so relapses in NMOSD. Relapse on Rituximab was seen in 6/18 (33.3%) and mean time to relapse was 36 weeks. Relapse on MMF was present in 1/3 (33.3%) and mean time to relapse was 96 weeks. Relapse with cyclophosphamide was seen in 1/2 (50%) and time to relapse was 384 weeks. None had relapse on azathioprine. Early relapses were seen with rituximab treatment in our study like they were seen with other studies done by et al. Because of the long half life and effect of cyclophosphamide the relapses tend to occur very late. Patients on azathioprine did not have relapse and was the most effective drug in our study group like seen in other studies. Visual Evoked potentials on 3 month follow up showed improvement in 11 (32.3%). VEP worsened in 1 patient (0.02%) who had LETM at onset and took rituximab and VEP remained same in 21 patients (17.6%). The visual disability had improved with immunosuppression and the P100 latencies which were prolonged have normalised but the VEP’s which were absent remained so even on follow up after treatment probably due to optic atrophy which is permanent. Rituximab can cause early relapses and probably can affect the optic nerve if not given along with steroids or other immunosuppressants. Motor deficit: MRS of 2 at follow up after minimum of 3 months was seen in 30 (88.2%). Early treatment initiation helps in the recovery of patients decreasing the MRS and motor disability. MRS of 3 with significant morbidity was seen frequently in males, patients treated with Rituximab, seronegative patients and those having LETM at onset. This can be due to seronegative patients being diagnosed late or due to male patients being susceptible to morbidity associated with myelitis as seen in previous studies. LETM is known to cause significant motor disability due to recurrent attacks and due to longer time needed to recover from the attack. Duration between diagnosis and initiation of treatment is significantly higher in relapse group (38.5 weeks vs 9 weeks; p = 0.008). This further reiterates the fact that treatment should be initiated early to decrease the morbidity and relapses associated with NMOSD. The other variables like age, gender, antibody status, clinic- radiological features at onset did not affect the treatment outcome significantly. Our study showed demographic, clinical, radiological, lmmunological profile in seropositive (AQP4 Ab and MOG Ab positive) and seronegative patients did not show any statistical significance. LIMITATION: This is a single center based study. Being a tertiary care hospital, undiagnosed or patients refractory to treatment would be frequently referred to our center. Small sample size is our major limitation and head to head comparison of patients who are seronegative and seropositive could not be done. As it is an ambispective study, recall bias can be present. CONCLUSION: Our study showed that females were commonly affected and LETM (dorsal cord) was the common initial presentation. Seronegative antibody status, female gender, LETM at onset and Rituximab therapy were frequently seen in patients with relapse but were statistically insignificant. Delay in initiation of treatment resulted in higher rates of relapse.
Award ID: 33
A Comparative Study of Blink Reflex and Brainstem Auditory Evoked Potentials in Neurodegenerative Diseases
Sireesha Chitturu
Neurology, Andhra Medical College
E-mail: iris.pinkrose@gmail.com
Background and Aim: BACKGROUND: Multiple functions are impaired in neurodegenerative illnesses, which are a set of progressive disorders. The prognosis is determined by the extent to which the circuits and structures that become sick during the process are involved. AIMS: To compare blink reflex and brainstem auditory evoked potentials in neurodegenerative diseases. Methodology: The study was conducted in Andhra medical college, K.G.H, Visakhapatnam, with a population of 60 patients. Result: The mean ± S.D. of age was 57.67 ± 9.93 years in the study population. Around 53.33% were diagnosed with P.D., 15% were diagnosed with PSP, and the rest 31.67% were diagnosed with other conditions. The mean of blink reflex parameters (I/L R1, I/L R2, and C/L R2) in the right latencies (ms) was identified as 11.06 ± 1.44, 31.65 ± 3.41, 33.4 ± 3.45 in the P.D. population whereas, they were identified with 11.31 ± 2.22, 31.86 ± 1.5 and 33.57 ± 1.76 in the PSP population. The mean of blink reflex parameters (I/L R1, I/L R2, and C/L R2) in the left latencies (ms) was 11.45 ± 1.25, 31.51 ± 3.93, 33.06 ± 3.51 in patients with P.D. while, they were 11.08 ± 1.87, 32.25 ± 1.69 and 32.16 ± 3.87 in patients with PSP. The mean (± S.D.) duration of diagnosis was 3.59 (± 2.55) years among patients diagnosed with P.D. and 3.22 (± 1.56) among patients diagnosed with PSP. Conclusion: When comparing the PSP, P.D., and other neurodegenerative groups, we discovered that P.D. patients had the most commonly aberrant blink reflexes. This could be explained by the nigrostriatal pathway’s pathogenic influence on the circuit connecting the basal ganglia, cerebellum, and brainstem. Also, this study showed some modifications of auditory evoked potentials, which can be determined by the neurodegenerative process that affects the brainstem.
Award ID: 34
Clinico-Radiological Evaluation and Short Term Follow Up in Patients with Neuromyelitis Optica Spectrum Disorders
Soumya A, A Soumya Reddy, G Butchi Raju, S Gopi Gopi, T Sateesh Kumar
Department of Neurology, Andhra Medical College
E-mail: soumya_arapreddy@yahoo.co.in
Background and Aim: AIMS AND OBJECTIVES: • To study clinical profile of patients presenting with NMOSD and to compare profile of aquaporin positive patients with negative patients • To study radiological findings in NMOSD and compare findings of aquaporin positive patients with negative patients • To assess short term follow up i.e. after 6 months of inclusion, in these patients using various modalities of treatment • Comparative analysis of outcomes among patients treated with various modalities of treatmentInclusion Criteria: patients aged less than 80 years Patients fulfilling the diagnostic criteria for NMOSD Exclusion criteria: A patient who has other proven CNS inflammatory/demyelinating disorders does not satisfy the diagnostic criteria for NMOSD. Patients whose complete clinical and radiological data is not available Patients who are MOG positive Methodology: Methodology: • Clinical and radiological data were collected from these participants, and their disability was graded according to three scales (EDSS / EQ5D-VAS / NMOSS) • These participants were followed up after a period of 6 months for reassessment based on the grading scales used previously. TREATMENT: All the patients were given acute rescue therapy with IV Methylprednisolone at a dose of 1 gm/day for 5 days, followed by an oral taper with prednisolone at a dose of 1 mg/kg/day tapered slowly over 4 months. All the patients were started on long-term immunosuppressive therapy before discharge. Patients who were given Azathioprine were started at a dose of 50 mg/day twice daily. After checking CBP and LFT after one week, the dose gradually escalated up to 2 mg/kg/day over the next few weeks based on tolerability. Choice of drug was based on availability in hospital. Patients who were given MMF were started on a dose of 500 mg/day initially, followed by an increase by 500 mg/day every week until the target dose of 2 gm/day was reached. Patients who relapsed on either AZA or MMF were started on Rituximab after baseline CD19/20 values were documented. The dose was 375 mg/m2 weekly for 4 weeks. CD19 B-cells were checked once every 2 months Result: Final analysis included 65 NMO subjects with mean age of 32.22 ± 7.53 years. A female predominance (73.85%) was found. Nearly 60% of the subjects had ON, 76.92% had LETM, 29.23% had APS. AQ +ve NMOSD was found in 64.62%. Overall relapse rate was 24.62% in the study population. Comparision between aquaporin positive and negative patients did not reveal any statistically significant difference except for relapse rate which was more in seroposive group. Majority of subjects were on AZA (76.92%) with relapse for AZA was 33.85%. AZA side effects were recorded in 9.23%. MMF was used in 23.08% where the relapse rate was 4.62%. There was no statistically significant difference between AZA, MMF and rituximab in other baseline parameters like EDSS score, NMOSS score and EQ5D-VAS prior to starting the treatment (P value >0.05). All scores improved significantly after treatment with all 3 drugs. Conclusion: female preponderenceRelapse was more in seropositive patients AZA and MMF were equally beneficial in improving disability scores RTX, MMF, and AZA are all beneficial in NMO individuals and could significantly reduce relapse rates.
Award ID: 35
Tumour Necrosis Factor-α, CD1A and CD1E Genetic Polymorphisms in Guillain-Barré Syndrome in Indian Population
Rajarshi Chakraborty, Rajesh Verma, Thamilpavai N, Nandakumar Vasudevan, Nithyanandam A, Lakshminarasimhan Ranganathan, Arun Kumar Natesan, Uma Maheshwari, Bala subramanian S, Lakshmi Narasimhan Ranganathan, Aastha Takkar, Deeksha Katoch, Vikas Bhatia, Karthiwel Soundappan, Sucharita Ray, Vivek Lal, Balasubramanian S, LakshmiNarasimhan Ranaganathan, Uma Maheswari E, Arun kumar Natesan, Lakshmi Narasimhan R, Shanmugasundaram K, Manikavasagam V, Vinoth Kannan Rajagurunathan, Meenakshisundaram U, Rithesh Nair Ramankuty, Ravi Kumar, Deva Abinaya V, Rajesh Verma, Rajesh Verma, Prithvi Giri, Ravindra Kumar Garg, Prithvi Giri
Neurology, King George Medical University, Lucknow, Uttar Pradesh, India
E-mail: satyalung@gmail.com
Background and Aim: Para neoplastic cerebellar degeneration (PCD) is a rare non metastatic neurological complication in cancer patients. Anti YO is one of the anti –onconeural antibodies found in PCD patients. It is believed that Anti YO occurs almost always in women and his most likely associated with gynaecological or breast cancers, although exceptions exist. Methodology: A 52 year old female with out any co morbidities presented with sub acute onset, gradually progressing neurogical illness, characterized by tendency to sways to both sides while walking, feels imbalance while sitting, incordination in both upper limbs, speech abnormality in the form of slurring with increased pauses between words and syllables especially longer words. No history of sensory, cognitive behavior abnormalities, cranial nerve dysfunction or weakness of limbs. No positive etilogical history for ataxia. On examination Nystagmus, hypometric saccades and broken pursuits are present. Bilateral cerebellar signs present, gait is wide based and ataxic. Result: Routine blood investigations with in normal limits. ANA profile, auto immune profile, viral markers negative, serum TSH is normal. para neoplastic pannel strongly Anti YO positive. MRI brain with whole spine screening is normal, NCS normal study. PET CT highly metabolic nodule present in lower quadrant of right breast. Conclusion: Anti YO antibody –positive PCD usually presents as symptoms of subacute cerebellar degeneration. The main clinical manifestation is cerebellar ataxia of trunk and limbs and speech abnormality, which last for weeks to months.


Award ID: 36
Hereditary Spastic Paraparesis in India: Knowing the Unknown
Ayush, Mohd. Faruq, Roopa Rajan, Divya M. Radhakrishnan, Ajay Garg, Achal Kumar Srivastava
Neurology, AIIMS, New Delhi, India
E-mail: ayushthetaurian@gmail.com
Background and Aim: Hereditary spastic paraplegia (HSP) describes a heterogeneous group of genetic neurodegenerative diseases. Their pathogenic mechanism, clinical features and imaging abnormalities vary substantially according to the affected gene. We conducted this study to determine the common mutations associated with HSP in India and their associated clinico-radiological findings. Methodology: The study was a single center, descriptive study, conducted at the Neurology Department, AIIMS, New Delhi. We recruited patients with suspected HSP presenting to the neurology OPD between July 2019-April 2022. Genetic testing by clinical exome sequencing was done to confirm the HSP diagnosis and subtyping. All genetically confirmed HSP patients were assessed for their clinico-radiological features. Result: We recruited 198 suspected HSP patients and genetic testing was conducted in random batches of 20. The results of the first has been described while the others are being tested. Ten out of the 20 suspected cases had HSP (7-SPG11 and 3-SPG4). The median age of presentation was 18 years with a male predominance. All cases presented with progressive spastic paraparesis with/without bladder involvement. Two SPG11 cases had cognitive impairment while 1 had a positive family history. Corpus callosum atrophy was found in 2/7 cases. Surprisingly, 6 out of 7 cases belonged to one particular community. Conclusion: Our study provides a novel finding of clustering of SPG11 mutations in a particular ethnic community, which if proven on further analysis, might help in tailoring genetic evaluations into individual specific algorithms. It also shows SPG11 mutations to be the most common in our region, which present similar to SPG4 mutations.

Award ID: 37
Long-Term Seizure Freedom, Cognitive Outcome and Quality of Life after Surgery in Children with Drug Resistant Epilepsy and Focal Cortical Dysplasia
Anuja Patil, Sita Jayalakshmi, Sudhindra Vooturi, Shanmukhi S, Manas Panigrahi
Neurology, Krishna Institute of Medical Sciences, Hyderabad, India
E-mail: patilanuja1986@gmail.com
Background and Aim: To evaluate factors affecting outcome in children with drug resistant epilepsy and focal cortical dysplasia (FCD) who underwent surgery. Methods: We analysed data of 112 consecutive children operated at a tertiary referral centre for drug resistant epilepsy and a diagnosis of FCD on histopathology between January2005 and December 2015. The inclusion criteria were 1) isolated type I and/or type II FCD within the surgical specimen 2) at least five years post-surgery follow-up. Results: The average age at onset of epilepsy was 4.56-3.88 (0-18) years with mean duration of epilepsy of 6.50-5.02 (0.3-18) years. The average age at surgery was 10.27 -5.14 (2-18) years. Delayed development was observed in 39 (34.8%), while 56 (50.0%) had below average intelligence. Associated psychiatric disorder and /or behavioural problems were diagnosed in 67 (59.8%) patients. Inter-ictal EEG showed focal/regional epileptiform discharges in 55 (49.1%). Seizure semiology was lateralizing in 77 (68.8%) while 52 (46.4%) had regional ictal EEG onset. MRI showed clear cut FCD in 96 (85.7%). At the latest follow-up 73 (65.2%) patients had a favourable Engels outcome. Onset of seizures below two years of (30.1 vs 53.8%; p = 0.024,) multiple types of seizures at presentation (21.9% vs 46.2%; p = 0.010), developmental delay (23.3% vs 56.4%; p = 0.001), generalized seizure semiology (54.8% vs 79.5%; p = 0.013) and acute post-operative seizures (19.4% vs 48.7%; p = 0.002), were associated with unfavourable outcome. Complete resection of the FCD (91.8% vs 46.2%; p < 0.001), type II FCD (51.4% vs 21.2%; p = 0.027), lateralizing semiology (75.3% vs 56.4%; p = 0.054) were associated with favourable outcome. Postoperatively after 6 months 59 (52.6%) had rated good QOLCE (>50) experience, (p < 0.0001). Above average IQ at the time of surgery determined good postoperative QUOLCE (p = 0.0369). Among children with above average (>70) IQ on pre-surgical assessment, 44 had good post-surgical outcome (77.1% vs 52.7%p = 0.009). Conclusion: Favourable outcome after surgery for DRE and FCD in children was seen in 65% and complete resection was the predictor of favourable outcome. Methodology: We analyzed data of 112 consecutive children operated at a tertiary referral centre for drug resistant epilepsy and a diagnosis of FCD on histopathology between January2005 and December 2015. The inclusion criteria were 1) isolated type I and/or type II FCD within the surgical specimen 2) at least two years post-surgery follow-up. Exclusion criteria were 1) FCD type III associated with other etiologies (hippocampal sclerosis, glioneural tumors, vascular anomalies, gliosis and other etiologies 2) patients with hemispherical dysplasia, tuberous sclerosis, periventricular nodular heterotopias. The presurgical, surgical and post- surgical parameters were collected through a structured proforma. Seizure classification was done according to the ILAE task force on classification and terminology guidelines 1 2. The study was approved after review by the institutional ethics committee. Written informed consent was obtained from all participants and/ or guardians of participants in the study. Pre-surgical evaluation Pre-surgical evaluation and surgery were performed after the necessary consent of the patient and/or the parent was obtained. The history included variables such as age, gender, etiology, semiology, age of onset of epilepsy, type and frequency ofseizures, neonatal seizures, febrile convulsions, and clinical findings of neurological examination. Pre-operative seizure frequency was considered for the year preceding the surgery. Standard MRI Brain was performed using a comprehensive Epilepsy protocol study on a 3T MRI Achieva System (Philips Health care, Netherlands) in a 8 Channel Head coil with the following Imaging strategies: DWI (diffusion weighted Imaging) axial, 2D T2 FLAIR axial, 2D T2 axial, 3D T2 FLAIR Volume sequence, 3D T1 FFE sequence, DTI (Diffusion Tensor Imaging) with a slice thickness of 2 mm with 0.5 inter slice gap. MRI abnormality was classified as clear cut FCD and subtle FCD (when MRI lesion was doubtful and/or confirmed based on FDG-PET hypo/hyper metabolism). Functional MRI was performed in selected cases for lateralization of language, memory and motor functions. All the patients underwent prolonged video-EEG (VEEG) monitoring and at least two seizures were recorded. Inter-ictal spikes were grouped as unilateral (when more than 75% of spikes are confined to the side of lesion), bilateral and multifocal. The seizure semiology was grouped as lateralizing, non-lateralizing and contralateral. The ictal EEG patterns were classified as focal, regional, hemispherical, generalized and contralateral. Unilateral spikes, lateralization on semiology and regional ictal EEG onset patterns were compared for analysis with the rest in the respective groups. All the patients underwent 18F FDG-PET. PET images were acquired using Siemens Biograph m-CT (Siemens AG, Muenchen, Germany), in 3D mode. PET MRI fusion was done using Syngo Multimodality Workplace software. FDG-PET and PET MRI fusion images were analyzed in all three projections (axial, coronal and sagittal). The PET metabolism was classified as focal hypo metabolism, hyper metabolism and normal metabolism. The extent of hypometabolism was classified as focal when confined to the lesion/lobe, lateralized if it is beyond one lobe but in the same hemisphere and not informative if normal or uncertain. For analysis focal hypo/hyper metabolism and the rest were grouped as two groups. Ictal SPECT was performed in 101 patients; 740 MBq of Technetium -99m Ethyl cysteinatedimer (ECD) was injected during ictal phase under VEEG monitoring. Brian SPECT images were acquired using GE Millennium MG, Dual Head Gamma Camera equipped with low energy, high resolution and parallel hole collimators. The SPECT hyperperfusion was classified as focal when confined to the lesion/lobe, lateralized if it is beyond one lobe but in the same hemisphere, contralateral and non-informative if bilateral or normal or uncertain. Focal hyper perfusion and the rest were separated into two groups for analysis. Neuropsychological tests done were- tests for intelligence, complex figure test for visual memory, Rey auditory verbal learning test for verbal memory, block design test for visuospatial functions, visuo-constructional test, object assembly test for visual integration and Montreal handedness test. In children aged between 2 and 14 years, developmental quotient (DQ), social maturity, and intelligence quotient (IQ) were assessed using standardized tests namely developmental screeningtest, Vineland Social Maturity Scale, Binet-Kamath Intelligence Scale, and standard progressive matrices. Children from 15 to 16 years were assessed on intelligence and neuropsychological tests which included tests of attention, visuospatial, and memory functions. Behavioural problem assessment, and psychiatric evaluation according to ICD-10 were performed. For quality of life, QOLCE 13 was used with necessary adaptation in local language (Telugu/Hindi) and by parental interview based on children’s behaviour, cognitive abilities, physical and neurological disability in the rest of the age group. Surgery All the cases were operated after the review of the multi-modality evaluation data at a multidisciplinary case conference. Patients were considered suitable for surgery after ensuring concordance amongst various imaging modalities; lesion clear cut on MRI or localized FDG-PET pattern or localized Ictal SPECT pattern. The type of surgeries performed were focal corticectomy/lesionectomy, lobectomy, multi-lobar resection, standard anterior temporal lobectomy with amygdalohippocampectomy (ATL with AH) and posterior disconnection. Lesionectomy including PET-ectomy was performed if the extent of the PET focal hypometabolism was more than MRI abnormality in patients with a localized PET pattern. All the surgeries were guided by neuro-navigation and intra-operative electrocorticography (ECoG). Motor cortex was defined by direct intraoperative cortical stimulation in cases with lesion close to or overlapping the motor cortex. Pathology Pathological examination of the resected tissue was done by a trained neuropathologist. The FCDs were classified as FCD type I, FCD type IIA and FCD type IIB according to ILAE classification 3. Post-surgical evaluation and outcome The postoperative hospital course, complications, and outcome data was analyzed. Acute postoperative seizures (APOS) were defined as seizures occurring within seven days after surgery. All the patients underwent routine inter-ictal EEG, neuropsychology, developmental assessment at three months and one year post surgery; MRI brain was done at one year post surgery. Outcome at the last follow-up was assessed according to Engels Outcome 14. Statistical analysis After confirming the homogeneity of the data, the study population was divided into two groups based on Engels outcome. All categorical variables were expressed as percentages and continuous variables as mean-standard deviation. Comparison between groups for categorical variables was done using Fisher’s exact test; where as independent student t-test was used for comparing continuous variables. Variables that were significantly different between groups for seizure control were included in logistic regression model to evaluate predictors of outcome. All data analysis was done using statistical package for social sciences (SPSS) for windows, version 17.0, IBM Computers, New York, USA. A p-value <0.05 were considered statistically significant. Result: Clinical variables The average age at onset of epilepsy was 4.56-3.88 (1-18) years with mean duration of epilepsy of 6.50-5.02 (0.3-18) years. The average age at surgery was 10.27-5.14 (2-18) years with 55 (49.1%) girls. Daily seizures were reported in 65 (58.0%) children. Prior history of febrile convulsions was reported in 20 (17.9%) patients while family history of epilepsy in 25 (22.3%). Delayed development was observed in 39 (34.8%), while below average IQ (<70) at the time of surgery was noted in 55 (49.10%). Of all children 42 (37.5%) had no behavioural or psychiatric comorbidities, while 38 (33.9%) had ADHD, 13 (11.6%) had depression, 15 (13.3%) had anxiety, 3 had mixed anxiety and depression disorders. Pre-surgical variables The inter-ictal EEG showed focal/regional epileptiform discharges in 55 (49.1%). Specific aura was reported by 23 (20.5%). The seizure semiology was hypomotor in 34 (30.4%), hypermotor in five (4.5%) and partial with generalized seizures in 32 (28.6%). Multiple types of seizures were recorded in 41 (36.6%). Seizure semiology was lateralizing in 77 (68.8%) children. While 52 (46.4%) had regional ictal EEG onset. Interictal FDG-PET showed hypo metabolism in 99 (88.4%), hypermetabolism in 9 (8.0%) and was normal in four (3.6%). The FDG-PET pattern was localizing in 83 (74.1%), lateralizing in 20 (17.9%) and was inconclusive in nine (8.0%) patients. Among the 61 patients where ictal SPECT was done, localized hyper perfusion was noted in 51 (45.5%) patients. MRI showed clear cut abnormality suggestive of FCD in 96 (85.7%) patients. In the remaining 16 patients with subtle MRI, FDG-PET helped in localizing the lesion in eight after PET-MRI fusion. Six more patients with subtle MRI and inconclusive FDG-PET were operated based on a localizing ictal SPECT pattern. Two children with highly refractory daily seizures and subtle lesion on MRI were operated based on lateralizing pattern on ictal SPECT and FDG-PET. Complete resection of the FCD was done in 85 (75.9%) patients. Histopathology was suggestive of FCD type I in 64 (57.1%), type IIA in 26 (23.2%) and Type IIB in 15 (13.4%) patients and combination of Type 1 and II in six (5.4%) patients. Outcome The post-surgery follow-up ranged from two to fifteen years. At the latest follow-up 73 (65.2%) patients had a favourable Engels outcome. On analysis of factors influencing favourable outcome, more number of children with onset of seizures below two years of age had unfavourable outcome (30.1 vs 53.8%; p = 0.024). Patients who had multiple types of seizures at presentation (21.9% vs 46.2%; p = 0.010) had unfavourable outcome. Unfavourable outcome was also more often seen in children with developmental delays (23.3% vs 56.4%; p = 0.001), generalized seizure semiology (54.8% vs 79.5%; p = 0.013) and those with APOS (19.4% vs 48.7%; p = 0.002), Table 1. Favourable outcome (Engel I and IIA) was higher in patients with complete resection of the FCD (91.8% vs 46.2%; p < 0.001) and in those with type II FCD (51.4% vs 21.2%; p = 0.027). Similarly, patients with semiology lateralizing to FCD had favourable outcome (75.3% vs 56.4%; p = 0.054). Neither regional inter-ictal (49.3% vs 48.7%; p = 1.000) nor regional ictal EEG pattern (43.8% vs 51.3%; p = 0.551) influenced outcome. No significant difference for outcome was noted with a localizing FDG-PET pattern (75.3% vs 71.8%; p = 0.821) or a localizing ictal SPECT pattern (50.7% vs 39.5%; p = 0.165). On further analysis of factors determining post-operative seizure persistence, the regression model attained Nagelkerke’s predictive value of 57.4% at statistical significance of p < 0.001. The predictor for favourable outcome was complete resection. Among the 16 patients with subtle MRI, six (37.5%) had favourable outcome at latest follow- up. When these 16 children were divided for outcome, more children with poor QUOLCE at presentation (50.0% vs 100.0%; p = 0.036) and multiple seizures (0.0% vs 70.0%; p = 0.011) had unfavourable outcome. There we no differences for clinical presentation, location of the lesion, frequency of seizures, findings on other investigations, completeness of resection and histopathology. Post-operative psycho-cognitive features: Among children with above average (>70) IQ on pre-surgical assessment, 44 had good post- surgical outcome (77.1% vs 52.7%p = 0.009). Post-surgery the mean change in IQ was +6.8 points, 47 (41.9%) had improvement in their baseline IQ (mean of 10.36 points), while 12 had drop in IQ post-operatively (mean of 7.08 points). Of these 12, 9 were frontal lobe epilepsies, 2 temporal and 1 PCE, 9 had onset <2 years and 9 had epilepsy duration of >2 years), 7/12 underwent surgery on dominant hemisphere. Altogether 15 children had an increase in IQ by more than 10 points. During pre-surgical assessment 93 (83.03%) rated poor QOLCE (<50 points). The proportion dropped to 53 (47.32%) after surgery. Postoperatively after 6 months 59 (52.6%) had rated good QOLCE (>50) experience, (p < 0.0001). Above average IQ at the time of surgery determined good postoperative QUOLCE (p = 0.0369), however, laterality of surgery, pre- operative Ictal EEG onset, clear-cut MRI lesions had no significant association in determining post-op QOLCE. DISCUSSION In the current study evaluating outcome of epilepsy surgery in children with focal cortical dysplasia, we report that localization of the FCD on MRI and complete resection of the epileptogenic focus leads to favorable outcome. Our findings are in accordance to existing literature on epilepsy surgery that included all age groups and all etiologies of refractory epilepsies. Additionally, our findings show that early onset of epilepsy, developmental delay at presentation, multiple types of seizure in semiology and generalized seizures at presentation are associated with an unfavorable seizure outcome. Similarly, APOS are also associated with unfavorable outcome. Importantly, in children with FCDs and a subtle MRI, poor quality of life at presentation and multiple types of seizures are associated with unfavorable outcome post-surgery. We report favourable outcome 65.17% children which is similar to that reported recently by Kwon et al. 15. The first two years of life are marked with rapid brain growth and psycho-social development. It has been previously showed that wide distribution of pathology 16 associated with early seizure onset cause severe forms of epilepsy and mental retardation 17,18. These reports from the existing literature may explain our findings of unfavorable outcome often reported in children with an onset under two years of age, multiple types of seizures; which lead to psychological and developmental delays. Furthermore, children with FCD Type I showed unfavorable outcome in the current study probably because of wide distribution of pathology or severe pathology. With only 39 children with unfavorable outcome, our study did not have enough power to evaluate factors or combination of factors affecting unfavorable outcome. Our findings of importance of complete resection for favourable outcome and APOS for unfavourable outcome are similar to Kim D W et al. 19, who have previously shown that incomplete resection of the FCD and pathological features as factors affecting outcome of epilepsy in patients (all ages) undergoing surgical resection of FCD. Furthermore, Jin B et al. 20, have reported incomplete resection of FCD, presence of habitual APOS as strong predictors for seizure recurrence after surgery. A recent study found cognitive impairment in nearly 51% children with FCD and mild MCD prior to surgery 21. This was more often associated with early age at onset of epilepsy and particularly FCD1, likely due to wider network and multifocality of dysmorphic neurons. In our study we found no significant association of laterality of surgery, pre-operative Ictal EEG onset, clear-cut MRI lesions in determining post-op QOLCE. This study reports that in children with FCD and subtle/normal MRI findings a favorable outcome is observed only in one-third of the patients, which is significantly lower than those with a lesion clear-cut on MRI. Our additional findings of poor quality of life at presentation in children with normal MRI may be because of the co-existing finding of multiple seizures in these children. Multiple seizures may indicate a wide-spread or severe underlying pathology. We also found that developmental decline might be caused by long-duration epilepsy. Therefore, children with multiple seizures, poor QUOLCE and negative MRI findings could be candidates for resective surgery. However, further research is required. Limitations: Though our study was limited to one epilepsy center, this helped us assure consistent evaluation and follow-up of children. Our study included multiple comparisons with a potential for inherent errors and may have been under powered to detect few associations in individual groups. However, the findings seem to be clinically plausible. Conclusion:

Award ID: 38
Genotype – Phenotype Corelation in Dravet Syndrome
Krishna S, Subhashani Prabhakar, Prasad Rao G, Ramshekhar Menon, Ashalatha Radhakrishnan, Soumya Sundaram
Neurology, SCTIMST, Thiruvananthapuram, Kerala, India
E-mail: drkrishnanikhil@gmail.com
Background and Aim: In 1978, Charlotte Dravet first described Severe myoclonic epilepsy of infancy (SMEI) and it was included in the International League Against Epilepsy (ILAE) classification in 1989, as an epileptic syndrome. (1) Dravet syndrome (DS) was proposed in the 2001 ILAE report and it included SMEI and borderline SMEI (SMEB). SMEB includes SMEI with atypical characteristics and low frequency.(2) The prevalence of DS is found to be 1 in 20,000 to 1 in 40,000 members of the population, with a male-to-female ratio of 2 to 1. 3- 8% of patients who have their first seizure before 1 year of age have DS.(2) Mutations in the SCN1A gene which codes for the alpha subunit of the voltage-gated sodium channel 1.1, are found in more than 70% of patients with DS (SMEI and SMEB) (1-3) Mutations are dominant and can result in a clinical spectrum ranging in severity from the mild phenotypes of familial syndrome generalized epilepsy with febrile seizures plus to the severe phenotype of SMEI. (3) Mutations result in either a gain or a loss of function. Failure of inhibition leading on to excitation is the proposed mechanism in loss of function mutations in DS.(2) More than 170 documented mutations are associated with SMEI and SMEB. Nearly 50% of the them are truncation mutations, with the remainder being missense, splice site and deletion mutations.(3) Mutation analysis using PCR-based sequencing identified point mutations, small deletions, and insertions. These were de novo in about 30 to 70% of SMEI patients. In the remaining patients, other types of mutations like microdeletions comprising the gene, mutations in regulatory sequences, or mutations in other genes were identified.(4) Intragenic and whole gene deletions were identified in a few cases of SMEI without truncation, missense or splice-site mutations (3) However, at least 20% do not have detectable mutations in any of the known genes, including SCN1A.(5) Truncation mutations are usually said to cause a severe disturbance in protein functions than missense mutations and almost all the reported truncation mutations of SCN1A having resulted in the phenotype SMEI, SMEB, or intractable childhood epilepsies with frequent generalized tonic clonic seizures (ICEGTC).(6) Missense mutations, however are identified in SMEI, SMEB, ICEGTC as well as in generalized epilepsy with febrile seizures plus (GEFS +), which is an autosomal dominant epilepsy with febrile seizures in children, which often persist beyond 6 years of age and afebrile seizures in adults. (6) Missense mutations in the S5-S6 pore forming regions of SCN1A are found to be associated with a more severe phenotype (SMEI with ataxia and early disease onset) than mutations in other regions.(3,6) One probable explanation for this is that the mutations in the pore regions may produce more severe channel dysfunction like activation/inactivation dysfunction or abnormal voltage dependency as compared to mutations in other transmembrane regions, thus determining the phenotypic presentation. (6) In reality, the phenotypic corelation with the various types of mutations is impossible to predict as patients with the same variant can cause a variety of phenotypes, even with the same genetic background. (7) Aim To ascertain electroclinical and cognitive phenotypic correlations of truncating and missense pathogenic/likely pathogenic variants of SCN1Avariants in DS To determine impact of the subtype of SCN1A variants on long term seizure outcome in DS and DB phenotypes Methodology: This was a prospective cohort study. Case definition : Typical DS was defined based on seizureonset usually in the first year of life of convulsive seizures which should include all of the following: a) fever-provoked or unprovoked hemiclonic or generalized ; b) myoclonic seizures; c) other seizure types which could include focal seizures, absence seizures, atonic seizures, tonic seizures Normal development in the first year of life with subsequent slowing including plateauing or regression Generalized spike-wave activity on EEG and normal MRI or non-specific findings Those who does not meet all the specific criteria were labelled as Dravet borderline phenotype. Inclusion criteria i) Patients fitting into the case definition within the age group of 6 months to 18 years (paediatric age group). ii) Should have undergone genetic testing with MLPA (Multiplex Ligation dependent Probe Amplification) / NGS (Next Generation Sequencing) /SCN1A sequencing which is mandatory and part of the standard of care for diagnosis of DS. iii) For newly diagnosed patients (based on electro-clinical features) should agree to undergo genetic testing as part of their standard of care. iv) Should consent for formal neuropsychology, speech-language and occupation therapy assessment as part of standard of care. Exclusion criteria i) Absence of genetic test results or who do not consent for genetic testing to be conducted as per standard of care after pre-test counseling. ii) No formal neuropsychology, speech language, OT assessment done. iii) Significant perinatal insult defined as APGAR <6 at 5 minutes associated with neonatal encephalopathy or significant developmental delay as assessed on revised Denver developmental scale prior to seizure onset iv) Not meeting criteria for DS as mentioned above. Patients satisfying the clinical criteria of DS/DB, who have undergone genetic testing were followed up for a minimum of 1 year. Detailed history, neurological examination, neurocognitive and developmental assessment, electroencephalogram (EEG), neuroimaging and genetic testing were analysed. Developmental outcomes at last available followup were graded using DDST based on DA/CA * 100 with grades of mild moderate and severe for DQ grades of > 70%, 30-70%, <30% respectively. Statistical analysis Data was transferred to Excel sheets and analysed with SPSS software. Descriptive variables were analysed with Mean, standard deviation and Proportions. Qualitative variables were compared using Fisher exact test and quantitative variables using ANOVA. Result: We had a total of 3967 children with epilepsy (<18 years old) and presented to our facility during the time period 2015-2021. Among those, 132 patients were found to have clinical profile of dravet or dravet borderline. Among these, 62 patients had undergone genetic testing. After exclusion of those whose genetic reports were awaited, lost to follow up and who could not be included due to lack of 1 year follow up, a total of 49 patients were included for the study. Among the 49, 53.1% were males and 46.9% were females. 37 (75.5%) had positive genetic test, out of which 29 had SCN1A mutations. 14 were truncating (frameshift in 8, deletions in 2, duplication in 1, including intronic in 2) and 15 were missense mutations. 15 were pathogenic, 11 were likely pathogenic and 3 were promising VUS with phenotype matches. Sanger sequencing established denovo variants in 1 patient. A non significant propensity for typical DS was noted among children with truncating variants while DB phenotypes were more prevalent among children with missense variants. Multiple seizure types were also apparent among children with truncating variants and seizure freedom was more likely among children with missense variants although the differences were not statistically significant (p - 0.099) No significant differences were noted for other clinical or electrophysiological variables as listed below. 78.6% of missense mutations had complex febrile seizures compared to 64.3% of truncating mutations. The 1 patient who had consanguinity had truncating mutation. Among the 2 patients who had sibling affliction, 1 had missense mutation and 1 had truncating mutation. 14.3% of truncating mutations and 6.7% of missense mutations had ASD. 50% of truncating mutations and 33.3% of missense mutations had baseline developmental delay. 21.4% of truncating mutations had regression compared to 13.3% of missense mutations. 7.1% of truncating mutations had photosensitive myoclonus. 35.7% of missense mutations and 50% of truncating mutations had generalised IEDs. 26.7% of missense mutations and 14.3% of truncating mutations had marked activation of IEDs in sleep, 53.3% of missense mutations had continued activation in sleep compared to 78.6% of truncating mutations. Sleep was normal in 6.7% of missense mutations and none in truncating mutations. 20% of missense mutations and 21.4% of truncating mutations had slow for age posterior dominant rhythm.13.3% of missense mutations had poorly formed sleep architecture and 6.7% had absent sleep architecture whereas it was well formed in all truncating mutations. 64.3% of missense mutations had delayed development at follow up compared to 50% of truncating mutations. Among missense mutations, 44.4% had moderate developmental delay and 55.6% had severe developmental delay compared to 57.1% and 42.9% respectively in truncating mutations. Among missense mutations, 1 patient had worsening with phenytoin, 2 with oxcarbazepine, 1 with perampanel. Among truncating mutations, 1 had worsening with carbamazepine and 1 had with topiramate. 80% of missense mutations and 100% of truncating mutations had polytherapy. 60% of missense mutations and 71.4% of truncating mutations had seizure score > 5 (disabling seizures). Seizure freedom was noted in 26.6% with missense and none with truncating variants. Valproate, clobazam, levetiracetam and topiramate were the commonly used drugs in our cohort. Valproate was prescribed for 89.6% of the total population, Clobazam for 72.9%, levetiracetam for 50% and topiramate for 47.9%. There were no significant differences between the drug used and final neurodevelopmental outcome or seizure control. Discussion In our study we could not find any significant differences between missense and truncating mutations with respect to clinical phenotype, severity of seizures or developmental delay, EEG or MRI abnormality, treatment or prognosis. However there non significant trends were demonstrated towards higher proportion of children with truncating variants having typical DS, multiple seizure types and ASM resistant epilepsy was apparent in all as opposed to 4 children with missense variants who sere seizure free. Seizure outcome however did not translate into group differences with regard to developmental outcomes. In the study by Zuberi et al., there were no differences in the types of seizures among missense or truncating mutations, though the age of onset of seizures were earlier in truncating mutations with respect to myoclonic, atypical absence and prolonged seizures. However no differences in developmental outcome were seen between the two groups. (8) We did not find any significant differences with regard to age at onset of FS, febrile status or unprovoked seizures or different seizure subtypes between groups. In the study by Gertler et al., out of 137 patients, 96% had positive genetic test, out of which 36% were missense mutations and 54% were truncating mutations. Seizure onset, type of seizures, status epilepticus, neurocognitive outcome as well as pharmacoresponsiveness were not found to be significantly different between the two groups. (9) In the study by Ishii et al., they could not find any significant difference between the age of onset among missense and truncating mutations. (10) Our study establishes that all though truncating variants demonstrated a non significant trend towards more severe phenotypes the impact of severe missense variants in south India needs to be reiterated on seizure and developmental outcomes. Our results challenge the notion that truncating variants alone have a more severe impact on long term seizure and developmental outcomes among children with this developmental epileptic encephalopathy and SCN1A mediated epilepsy is a prototype DEE irrespective of the variant subtype. Conclusion: This is the first study from the subcontinent which has addressed the significance of variant subtypes among a cohort of children who met the clinical criteria for DS or DB phenotypes. There is no electroclinical or radiological parameter to differentiate between the phenotypes of missense vs truncating mutations. The severity of disease, seizure control, neurocognitive outcome does not vary between the two groupsalthough children with missense variants demonstrated a trend towards Dravet borderline phenotypes, lower likelihood of multiple seizure subtypes and higher proportion who were seizure free. This study waswas supported by Indian Council for Medical Research, India, vide grant no. 2018- 2670

Award ID: 308
An Ambispective Descriptive Study of COVID-19 Related Strokes Admitted in a Tertiary Care Center
Bidhan Mandal, Sunil K. Narayan, Ramkumar Sugumaran, Vivekanadan Pillai
Neurology, JIPMER, Pondicherry, India
E-mail: bdmandal123@gmail.com
Background and Aim: ABSTRACT: Aims To determine factors associated with poor outcome in patients who developed stroke following Covid19 infection. Material & Method: We conducted a cross sectional analysis of all stroke patient admitted in JIPMER during Covid19 pandemic. Diagnosis of Covid19 by RTPCR or Rapid antigen test. all relevant epidemiological / clinical /imaging & lab data were documented for each case including standard risk factors, type of stroke. Patient outcome were divided into 2 groups: Bad outcome (mRS>=3) & Good outcome (mRS <= 2). Continuous variables were described as mean (SD) if they were normally distributed or medians (interquartile range) if not normally distributed, and compared with outcome using Mann-Whitney test. Categorical variables were delineated as n (%) and compared by χ2 test and Fisher exact test. Results The Median age of the patients was 59 years (IQR 48.5-66), 27 (84.38%) were males & 5 (15.63%) were females. Diabetes, hypertension, coronary artery disease, smoking, alcohol, age & previous h/o lung disease was seen in 15 (46.88%), 17 (53.13%), 4 (12.5%), 13 (40.63%), 9 (28.13%), 4 (12.5%) respectively. No significant association of worse functional outcome with diabetes mellitus (11% vs 13%, p = 1.000), hypertension (11% vs 13%, p = 1.000), smoking (8% vs 16%, p = 0.219) & alcohol (55.56% vs 100%, p = 0.299). A poor outcome was significantly associated with covid19 severity (p = 0.012). A poor outcome (mRS >= 3) was associated with high Neutrophil-to-lymphocyte ratio (NLR) value (p = 0.028) at presentation & initial radiographic assessment of lung edema (RALE score) (9 vs 2, p = 0.0011). Conclusion: Initial RALE score & NLR ratio can be utilized as a prognostication tool in case of Covid 19 stroke patients. Key words: Covid19, stroke, RALE score, Neutrophil-to-lymphocyte ratio Background & Aims In COVID-19, both central and peripheral nervous systems may be affected (anosmia, myositis, Bell’s palsy encephalopathy, encephalomyelitis, stroke etc.)1,2. It can result in 3.2 to 7.8 fold increased risk of acute ischemic stroke (like other respiratory tract infections) 3. Approximately 2% patients with COVID-19 infection could present with ischemic stroke 4. Many mechanisms have been proposed for acute ischemic stroke (AIS) during COVID-19 infection which include the cytokine storm and activation of the innate immune system, embolic events propagated by pre-existing or new-onset arrhythmias, hypoxia-induced ischemia (secondary to severe pulmonary disease), thrombotic microangiopathy, endotheliopathy/endotheliitis, dysregulation of the renin-angiotensin-aldosterone system, direct cytotoxic effect on the nervous system related to angiotensin converting enzyme-2 (ACE-2) receptor uptake of SARS-CoV-2 virus, hypoxemia related to cardiorespiratory failure and multifactorial activation of coagulation.5We performed this study to identify risk factors, comorbidities, characteristics, and outcome in patients with ischemic stroke in Covid 19 positive patients. Aims of the study: Aim was to determine the factors associated with a poor outcome in stroke in Covid 19 Methodology: Study design: This was an ambispective cross sectional study conducted between March 2020 to March 2022. The study criteria is as follows a. Inclusion criteria: 1. COVID positive by RT-PCR or Antigen detection test 2. Stroke (infarct/haemorrhage/ cortical venous thrombosis) diagnosed clinically and confirmed radiologically within one month of COVID 19 infection. b. Exclusion criteria: Covid-negative Stroke patients We pooled consecutive patients hospitalized or evaluated in our hospital with stroke and a confirmed diagnosis of COVID-19 by oropharyngeal polymerase chain reaction (PCR) or IgG and/or IgM antibody in sera, using local commercial assays. Permission taken from our institutional ethics committee (IEC No JIP/IEC/2021/283). Consent taken telephonically from the patient whom we contacted by telephone. We did not do sample size calculations for this study as analyses were exploratory and hypothesis-generating. We extracted data from clinical notes/ discharge /summaries; blood results from Hospital Information System (HIS) and imaging data from Picture archiving and communication system (PACS). We determined the disability on discharge using the mRS which varies from 0 (no symptoms) to 6 (death). For ischemic strokes, the OCSP/TOAST classification had been taken either from the discharge summary or inferred from the clinical team’s documented assessment of likely stroke etiology. We collected follow up data (mRS at discharge and 90 days. mRS had been grouped into 2 (1st group with mRS >= 3 & 2nd group with mRS 0-2) We used the RALE score (radiographic assessment of lung edema) as per standard protocol, ranging from 0 (no abnormalities) to 48 (maximum abnormalities). We also used Neutrophil-to-lymphocyte ratio (NLR) to assess the inflammatory status of a subject Continuous variables were described as mean (SD) if they were normally distributed or medians (interquartile range) if not normally distributed, and compared using Mann-Whitney U test. Categorical variables were delineated as n (%) and compared by χ2 test and Fisher exact test. Stata v4 system used for statistical analysis. Result: From March 2020 to March 2022, we documented 32 patients from the HIS. The Median age of the patients was 59 years (IQR 48.5-66) of which 27 (84.38%) were males & 5 (15.63%) were females. Past H/o stroke was present in 5 patients in which 4 (12.50%) had ischemic stroke & 1 (3.13%) had intracerebral haemorrhage (ICH). Diabetes, hypertension, coronary artery disease, smoking, alcohol, age & previous h/o lung disease was seen in 15 (46.88%), 17 (53.13%), 4 (12.5%), 13 (40.63%), 9 (28.13%), 4 (12.5%) respectively. Among these 32 patients, 8 (25%) patients had critical Covid, 6 (18.75%) had severe Covid, 5 (15.63%) had moderate Covid and 19 (40.63%) had mild Covid. Total 14 patient (43.75%) had been dead among whom 10 patients had been dead during that very hospital admission & 4 patients had died within 3 months. maximum (7) death happened among patients with critical covid, 3 death happened among severe covid patients, 3 death happened among moderate covid patients, 1 death happened among mild covid patients. Median time from stroke symptoms to first imaging was 10 hrs. (IQR 6-24). Thirty (93.75%) patients had AIS & 2 (6.25%) had ICH. Among the AIS patients 22 (73.33%) had large vessel stroke among which 13 (43.33%) had middle cerebral artery stroke. 8 (25%) had small vessel stroke. The RALE score (n = 27) had a median value 5 with IQR 2-11 (min 1 & max 32); CRP (n = 14) median value 3 with IQR 1.3-9.1 (min0.7, max 30.3), D-dimer (n = 15) median value 2.1 IQR 0.95-5 (min 0.30, max 6.18). We didn’t find any statistically significant association of worse functional outcome (mRS >= 3) with diabetes mellitus (11% vs 13%, p = 1.000), hypertension (11% vs 13%, p = 1.000, smoking (8% vs 16%, p = 0.219) & alcohol (55.56% vs 100%, p 0.299). A worse functional outcome (mRS >= 3) was associated with high NLR value (p = 0.028) at presentation & initial RALE score (9 vs 2, p = 0.0011). High mRS score was associated with high CRP (3.75 vs 1.4, p = 0.1441) & high D-dimer (4.137 vs 0.628, p = 0.061) but was statistically insignificant. Conclusion: Few studies had been done on RALE score to assess risk of ARDS in Covid19.7,8. We used the first X-ray of the patient for a RALE score. Fatemeh Homayounieh et al. 9 had found higher RALE score was associated with increased mortality in Covid 19. NLR has been proved as an effective parameter to predict outcomes in a variety of conditions including different types of malignancies, as well as in cardiovascular and rheumatic diseases, Infections. Many studies has recognised it as an independent prognostic factor in Covid 19 patients. It can be easily derived from complete blood count. Grading has been done as per pulmcrit NLR ratio (1-3 Normal, 4-5 indeterminate, 6-8 Mild, 9-18 Moderate, >18 Severe).10 We performed this single center based cross sectional study to evaluate the demographic factors, risk factors, clinical features and lab data associated with Covid19 related strokes. We also tried to find any factor among the aforesaid which could be associated with the outcome. It had shown that 84.38% admitted patients were male which may be reflecting higher exposures of Covid q9 to men or negligence of local society towards women’s health). According to previous study 12, old patients with comorbidities have worse outcomes during Covid infection. Here we couldn’t find any significant association of any conventional risk factor (including age, gender & previous history of stroke, DM, HT, smoking, alcohol, CAD) predicting outcome of stroke with covid19 infection. In the previous studies 13, 14, mortality rate was higher among Covid related stroke. We also found 43.75% mortality in our study which is corroborative to other studies. Large vessel stroke is significantly higher & among them MCA was the commonest. Similar to our study, there are few studies 15, 16, 17 which showed higher incidence of large vessel stroke (MCA commonest) among covid related stroke. Poor outcome happened in patients with severe Covid with significant association. Previous studies found that both the NLR ratio 18,19 & Rale score 20 could be used to prognosticate COVID19 infection. In our study, we could see the initial RALE score & NLR ratio also had a positive association in determining the final outcome of Covid related stroke. Deaths relatively were more common in critical and severe covid 19 cases compared to mild Covid and unlike in common stroke, the deaths were not more common in the TACI type large infarct cases and dead patients did not have a higher proportion of PACIs. This paper gives us : 1) insight into strokes in Covid 19 patients admitted in South India tertiary referral centre 2) Traditional risk factors were not associated with poorer out come but severity of covid wasThere were some limitations in this study 1) it is a single center study. 2) Very sample size 3) unknown premorbid mRS IN case of deceased patients. 4) lack of comparison with stroke in non Covid19 patients. We plan to do comparison with non covid stroke patients in a post-hoc study. Conclusion. Initial RALE score & NLR ratio may be utilized as a prognostication tool in case of Covid 19 stroke patients. Covid19 severity had been associated with poor outcome of concurrent stroke.