

Abstract
Background
Given the increased risk of malnutrition in children with cleft lip and/or palate (CLP), determining their nutritional status is critical for preventing adverse surgical risks. However, no such disaggregated, national-level data are available in Indonesia. We aimed to determine the nutritional status of patients with clefts in Indonesia and to identify problems and solutions for malnutrition cases within the population.
Methods
In this cross-sectional study, we considered records of individuals who underwent primary surgery for CLP in Smile Train-sponsored facilities in Indonesia between 1 January 2016 and 31 December 2021 (n = 18 480). We only included children under the age of five with an evaluation date prior to admission date and excluded subjects with invalid data values. We classified their nutritional status by z-scores according to the World Health Organization Child Growth Standard (2006). Malnutrition cases cover four indicators – stunting, wasting, underweight, and overweight. We compared the prevalence for malnutrition cases in children under the age of five using national health survey data.
Results
We included 1899 records following data validation. The national prevalence of stunting (24.4%), wasting (12.5%), and overweight cases (12.9%) was high, while underweight cases (6.8%) were comparatively low. Statistical analyses showed significant differences in nutritional status based on length/height-for-age between girls and boys aged 0-5 months (P = 0.008) and 48-60 months (P = 0.001), and based on body mass index-for-age (P = 0.000) between girls and boys aged 0-5 months. Girls in different age groups exhibited a statistically significant difference in nutritional status based on length/height-for-age (P = 0.002) and weight-for-age (P = 0.017). Concurrent stunting and overweight were the most common forms of concurrent malnutrition (8.7%). We found a significant difference in the prevalence of underweight (P = 0.001) and overweight (P = 0.000) cases between children with CLP and those without CLP.
Conclusions
Our findings highlight the importance of nutritional interventions for children with orofacial clefts in Indonesia, and the importance of age and gender in their design and implementation. Further investigation is necessary to explore the risks of overweight and concurrent malnutrition among this population.
Indonesia is a country with a fairly high prevalence of children with congenital disorders (59.3 per 1000 live births) compared to other countries in Southeast Asia [1]. Cleft lip and/or palate (CLP) or orofacial cleft ranked second in the sentinel survey of congenital anomalies conducted between September 2014 and March 2018 in 28 hospitals of 18 provinces in Indonesia (20.4% of 956 congenital birth cases) [2]. Children with CLP are at risk of malnutrition since they tend to have difficulty latching and/or sucking effectively [3,4]. Moreover, children under-five are generally vulnerable to malnutrition [5]. Aside from the child's difficulty to breastfeed, mothers of infants with CLP may experience high levels of stress that can interfere with breast milk production and breastfeeding, potentially contributing to infant malnutrition [6,7].
Poor nutritional status is associated with a higher rate of adverse surgical outcomes [8]. A surgical intervention increases metabolism as the body responds to surgical injuries; in turn, adequate nutritional intake should support the wound healing process [9]. Poor preoperative nutritional status may compromise the safety at surgery and the healing process. Skilled assistance to mothers with feeding their infants is critical for mitigating the risk of poor feeding and malnutrition and ensure timely and safe cleft surgery [10].
Prior studies have examined the nutritional status of children with CLP using different growth indicators to identify malnutrition. Some have found a higher prevalence of underweight among children with CLP compared to age-matched peers without CLP [6,11]. A study in children <18 years of age with CLP from lower-level socioeconomic backgrounds found a high prevalence of stunting in this population [12]. Another study found that the prevalence of underweight and stunting in children with CLP was clinically higher compared to peers without CLP, although the difference was not statistically significant [13]. Across studies and settings, values for the prevalence of wasting among children with CLP have ranged from 3.9% to 68.2% [11,14,15]. To our knowledge, no studies have specifically investigated the prevalence of overweight in children with CLP.
Despite numerous studies suggesting a key role for nutrition in the management of CLP, data on nutritional status in CLP patients are still very limited. We previously reported that only six of 620 published studies on orofacial clefts between 2010 and 2019 investigated feeding interventions in lower middle-income countries (LMICs) [16], with only one providing information on the nutritional status of patients with cleft in Indonesia (along with other countries) [6]. However, the study did not conduct sub-national analyses, making it difficult to recognise Indonesia's barriers in addressing nutritional challenges faced by children with cleft. Therefore, we aimed to determine the nutritional status of children at cleft treatment centres across the provinces of Indonesia, and to discuss barriers and opportunities.
METHODS
Study design and participants
In this cross-sectional study, we included records of individuals who underwent primary surgery for orofacial clefts in Smile Train-sponsored facilities in Indonesia based on information uploaded by local cleft care providers into Smile Train’s online medical database between 1 January 2016 and 31 December 2021 (n = 18480). We checked the data for duplicate identification numbers and selected the most recent evaluation dates (n = 17064). We only included children under the age of five with an evaluation date (when subjects’ weight and length/height were measured) prior to admission date (admission for surgery) (n = 14110) to assess the children's nutritional status prior to intervention.
Statistical analyses
We analysed the children’s weight, length/height, age (chronological age in months at the time of anthropometric evaluation), sex, province of origin (province of residence), and province of primary surgery hospital (province of the hospital where the children received their primary cleft surgery).
We assessed nutritional status using growth indicators such as weight-for-age, length/height-for-age, and body mass index (BMI)-for-age, classified by z-scores according to the World Health Organization (WHO) 2006 Child Growth Standard [17]. In our study, malnutrition covered four indicators – stunting (severely and moderately stunted), wasting (severely and moderately wasted), underweight (severely and moderately underweight), and overweight (overweight and obese). We also examined concurrent malnutritional status, including concurrent stunting and overweight, concurrent stunting and underweight, concurrent wasting and underweight, and concurrent stunting, wasting, and underweight.
The variable data values of the children within the year and age range were validated using the WHO Anthro for personal computers 2010, version 3.2.2 (World Health Organization, Geneva, Switzerland) [18]. We excluded subjects with missing data values, which we defined as follows:
Non-availability of data values. Subjects with absent information on study variables were excluded.
-
Invalid data values – subjects with weight, length/height, or z-scores outside of the following range values:
Weight: minimum 0.9 kilograms, maximum 58 kilograms
Length/height: minimum 38 centimetres, maximum 150 centimetres
Length/height-for-age z-score: minimum -6 standard deviations (SDs), maximum 6 SDs
Weight-for-age z-score: minimum -6 SDs, maximum 5 SDs
BMI-for-age z-score: minimum -5 SDs, maximum 5 SDs
We conducted all analyses in Microsoft Excel 2016, version 16.0 (Microsoft Corporation, Redmond, Washington, USA) and IBM SPSS Statistics, version 26.0 (IBM Corporation, Armonk, New York, USA). We reported the prevalence of malnutrition as a percentage and categorised it according to the prevalence threshold for each indicator of malnutrition [19,20]. We used non-parametric tests to compare two or more groups on a nominal or ordinal dependent variable among children with CLP. We performed a Kruskal-Wallis H test to assess whether statistically significant differences in nutritional status existed based on each growth indicator among sex and age groups and conducted further pairwise comparisons using Dunn's procedure with a Bonferroni correction for multiple comparisons. Furthermore, we analysed the association of the prevalence of each concurrent malnutrition between sex and age groups using a χ2 test if all cells had expected counts greater than five. We otherwise used a Fisher exact test to evaluate association between sex groups and Fisher-Freeman-Halton exact test to evaluate association between age groups.
We also examined the prevalence of all forms of malnutrition cases among children under-five according to the national health survey (Study on Nutritional Status in Indonesia/SSGI 2021) for comparison [21]. To reduce risk of bias, we only included provinces with more than 40 study subjects. We used boxplots to identify potential outliers within the groups and the Shapiro-Wilk test to assess if the normality of data distribution. We performed an independent t-test if we found no outliers and if the data were normally distributed; otherwise, we used the Mann-Whitney U test.
Ethics
The Research Ethics Committee Universitas Padjadjaran (No.1026/UN6.KEP/ED/2021) approved the study prior to data collection. Smile Train partners gained consent from patients or their caregivers to collect and use their data for marketing, advertising, educational reasons, and for quality assessments and evaluations.
RESULTS
Based on the data validation process for subjects within the age range (n = 14 110), 2293 subjects (16.3%) had valid weight and length/height information from which z-scores could be calculated. A further 394 subjects (17.2%) had invalid weight-for-age, length/height-for-age, and/or BMI-for-age z-scores, leaving 1899 subjects with complete and valid data values for inclusion (Figure S1 in the Online Supplementary Document).
Our sample consisted of more boys than girls, with an overall median age of nine months (interquartile range (IQR) = 5.0-19.0). The children with CLP came from 26 of Indonesia’s 34 provinces, predominantly from the western part of Indonesia, with most originating from the West Java Province (27.6%). Most children (91.4%) underwent primary surgery in their province of origin (Figure 1).
Figure 1.
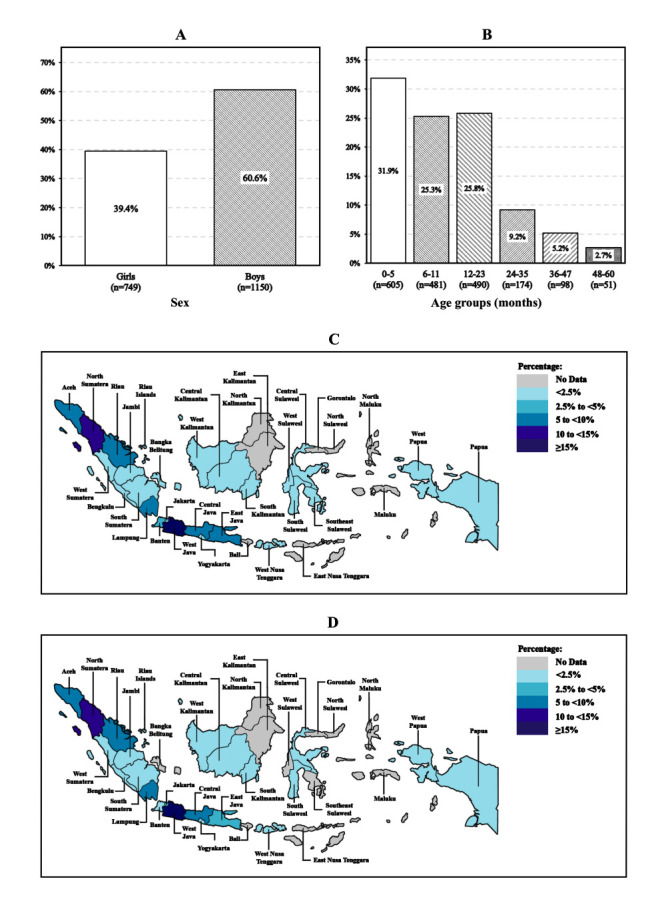
Frequency distribution of study subjects. Panel A. By sex. Panel B. By age groups. Panel C. By province of origin. Panel D. By province of primary surgery hospital.
Referring to the prevalence threshold for each form of malnutrition, we observed a high prevalence of stunting, wasting, and overweight among children with CLP and a low prevalence of underweight at the national level (see Figure 2 for representation based on children’s province of origin and Table S1 in the Online Supplementary Document for details on prevalence of nutritional status among children with CLP).
Figure 2.
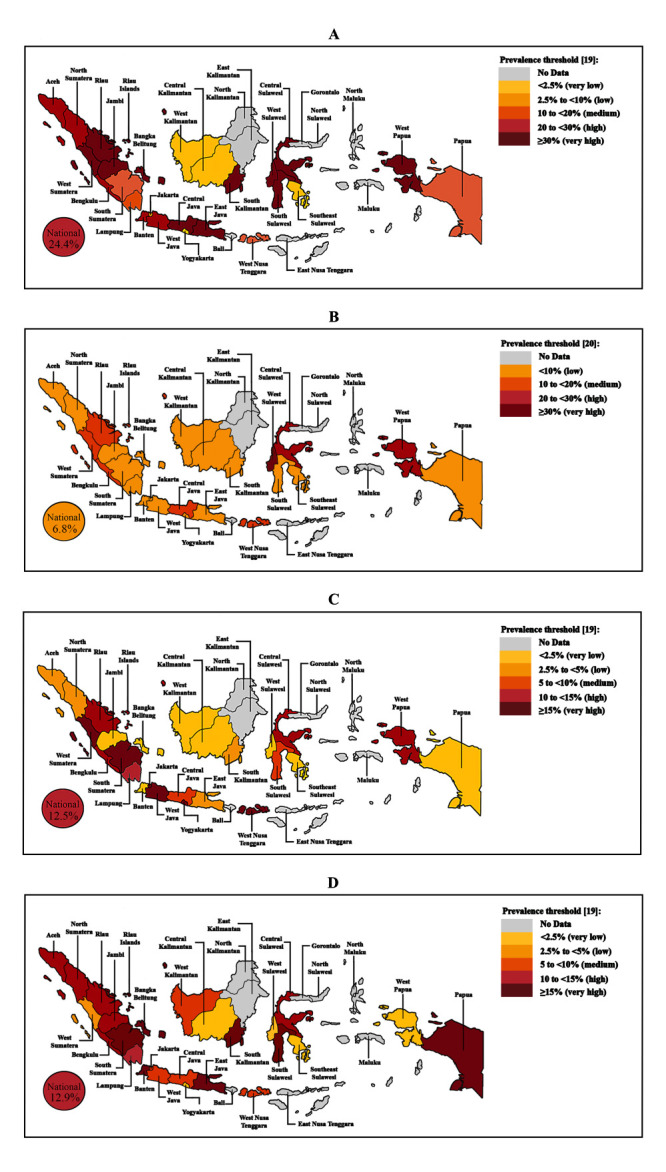
Geographical map of Indonesia presenting the prevalence of malnutrition cases among children under the age of five with CLP by province of origin. Panel A. Stunting cases. Panel B. Underweight cases. Panel C. Wasting cases. Panel D. Overweight cases.
We observed a statistically significant difference in nutritional status based on length/height-for-age (P = 0.008) and BMI-for-age (P < 0.001) between girls and boys aged 0-5 months and a significant difference was noted in nutritional status based on length/height-for-age between girls and boys aged 48-60 months (P = 0.001) (Figure 3). Furthermore, we found a statistically significant difference in nutritional status based on length/height-for-age (P = 0.002) and weight-for-age (P = 0.017) between different age groups in girls. The post hoc analysis, considering statistical significance at a P < 0.0083 level, showed significant differences in nutritional status among girls based on length/height-for-age between the 48-60 months and 12-23 months (P = 0.003), 48-60 months and 6-11 (P < 0.001), and 48-60 months and 0-5 months (P < 0.001) age groups. Additionally, we observed further statistically significant differences in nutritional status among girls based on weight-for-age between the 48-60 months and 0-5 months (P = 0.006) age groups.
Figure 3.
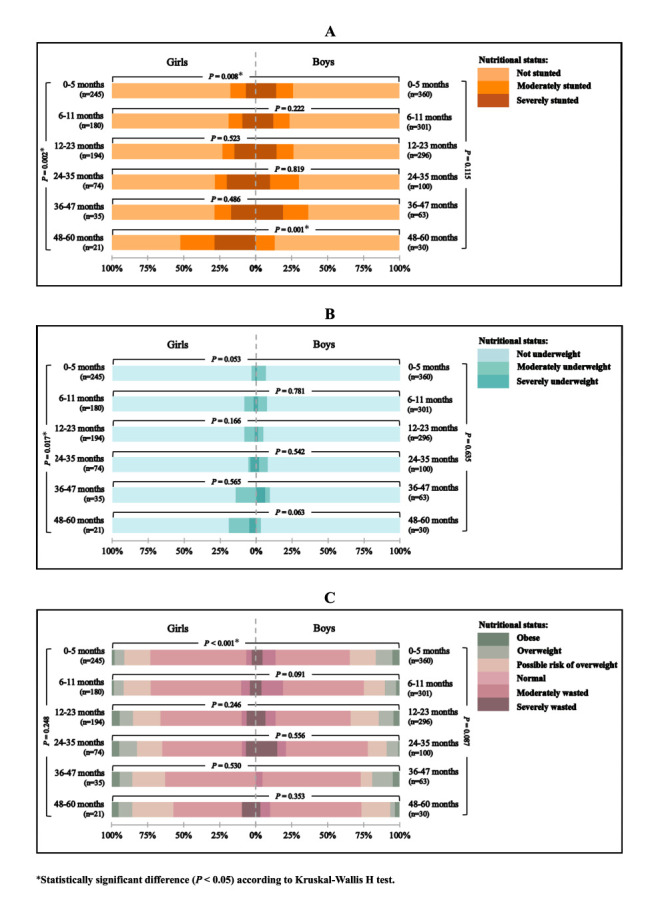
Comparison of nutritional status among children under the age of five with CLP between sex and age groups based on three growth indicators Panel A. Length/height-for-age. Panel B. Weight-for-age. Panel C. BMI-for-age. The left-hand bars represent the prevalence in girls and the right-hand bars represent the prevalence in boys. The horizontal brackets indicate the P-value of the statistical analysis between the sex category within the same age group, while the vertical brackets indicate the P-value of the statistical analysis between age groups within the same sex category.
Concurrent stunting and overweight were the most common forms of concurrent malnutrition (8.7%). We found a statistically significant association in the prevalence of concurrent stunting and overweight between girls and boys aged 0-5 months (P = 0.003) and a statistically significant association between the age groups in the prevalence of concurrent stunting and overweight (P = 0.001), concurrent stunting and underweight (P = 0.035), and concurrent stunting, wasting, and underweight (P = 0.011) among girls (Figure 4 and Table S2 in the Online Supplementary Document).
Figure 4.
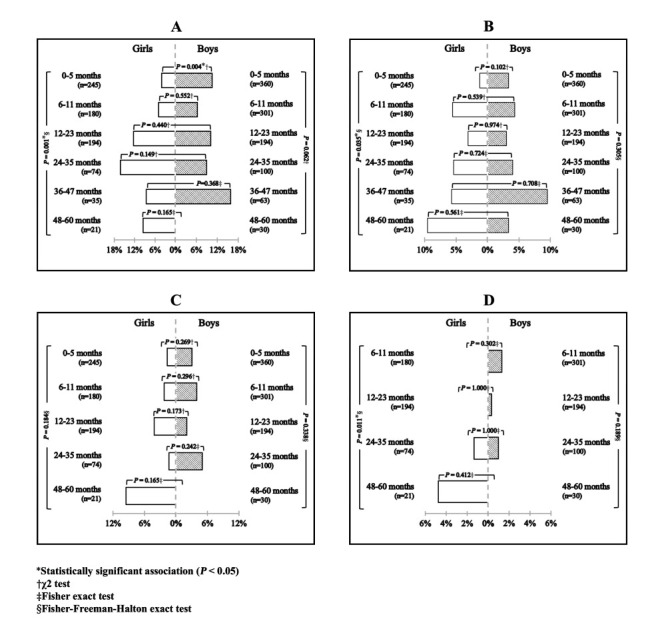
Comparison of the prevalence of concurrent malnutrition among children under-five with CLP between sex and age groups. Panel A. Concurrent stunting and overweight. Panel B. Concurrent stunting and underweight. Panel C. Concurrent wasting and underweight. Panel D. Concurrent stunting, wasting, and underweight. The left-hand bars represent the prevalence in girls and the right-hand bars represent the prevalence in boys. The horizontal brackets indicate the P-value of the statistical analysis between the sex category within the same age group, while the vertical brackets indicate the P-value of the statistical analysis between age groups within the same sex category. Age groups with no subjects in both sex categories is excluded from the graphical representation.
Regarding the comparison of prevalence of malnutrition cases among children under five with CLP and in the national data [19] (Figure 5), we only included 11 provinces (Aceh, North Sumatera, Riau, Lampung, Jakarta, West Java, Central Java, East Java, Banten, West Nusa Tenggara, and Central Sulawesi) due to an absence of the minimum size of study subjects in the remaining province. There was a statistically significant difference in the prevalence of underweight (P = 0.001) and overweight (P < 0.001) between children under-five with CLP and without CLP.
Figure 5.
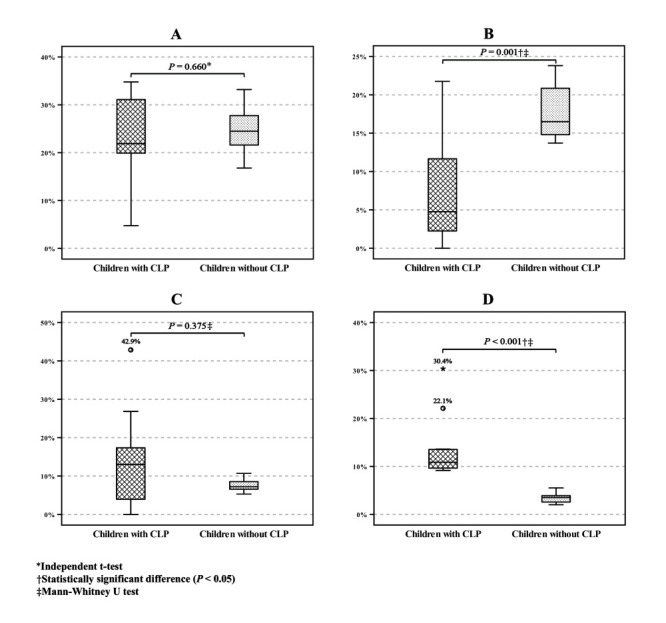
Comparison of the prevalence of malnutrition cases between children under the age of five with CLP and those without CLP in 11 provinces in Indonesia. Panel A. Stunting cases. Panel B. Underweight cases. Panel C. Wasting cases. Panel D. Overweight cases. The horizontal brackets indicate the P-value of the statistical analysis between the two groups. CLP – cleft lip and/or palate.
DISCUSSION
Nutritional interventions for children with orofacial clefts have received little attention in Indonesia, where there is no available national disaggregated data on the feeding and nutritional needs of this population. Our analysis of anthropometric data collected prior to cleft surgeries in Indonesian health facilities over a five-year-period showed a high prevalence of stunting, wasting, and overweight in children with CLP and highlighted the urgent need for integrating nutrition care in the management of children with CLP.
We found that stunting cases, corresponding to chronic malnutrition, had the highest prevalence rate (24.4%) compared to other forms of malnutrition on a national scale. The rate is similar when compared to peers without clefts (24.4%) in SSGI 2021 [21]. Furthermore, we found no statistically difference in the prevalence of stunting between children with CLP and those without CLP across eleven provinces in Indonesia. Similarly, two case-control studies conducted in India [13] and Nigeria [22] (countries with a high prevalence of stunting in the general population) found no differences between children with cleft and without cleft.
Moreover, when examining the study subjects across different sex and age groups, we found a statistically significant difference in nutritional status based on length-for-age between boys and girls among the youngest age group (0-5 months), and a higher prevalence of stunting cases in boys than in girls within this particular group of children. Several studies have provided evidence supporting the notion that boys are at a higher risk of stunting [23,24], and this vulnerability can manifest as early as during the prenatal period [25]. This increased risk is attributed to their increased susceptibility to infections, particularly prevalent in lower socioeconomic families [25,26]. Nevertheless, a substantial increase in the number of stunting cases among girls was observed at the age of 48-60 months, leading to a significant difference in stunting prevalence between girls and boys. These disparities may be attributed to gendered cultural norms that influence feeding patterns, potentially resulting in higher stunting rates in girls. For instance, Ng et al. [27] discovered that the proportion of boys in Indonesia with adequate meal frequency was higher than girls. Similarly, another study analysing the 2005-2006 National Family Health Survey (NFHS-3) in India found that girls were breastfed for a shorter duration than boys [28]. Other factors such as parental diet, family socioeconomic level, and peer influences could also explain these findings [29]. Future research should investigate the association of these factors with sex differences in the prevalence of stunting among children with CLP to provide a deeper understanding and aid in formulating targeted interventions to address the underlying causes of disparities.
The national prevalence of underweight (6.8%) among children with CLP in the current study is considerably lower than peers without clefts in SSGI 2021 (17.0%). We found a significant difference in underweight prevalence between children with and without CLP, in contrast with findings of Babalola et al. [22]. The development of various techniques and tools designed to aid in feeding children with CLP [30], the availability of diverse professional support services for feeding consultations, and the increased awareness, effort, and success of mothers in nurturing and feeding these children [31-33] may be related to this observed low figure of underweight prevalence among children with CLP.
Although we observed a higher prevalence of underweight cases in boys than in girls, we found no significant variation in nutritional status based on weight-for-age between boys and girls within the same age group. However, we discovered a significant difference of nutritional status in this indicator between girls aged 0-5 months and those aged 48-60 months, with the higher prevalence of underweight was observed in the latter age group. Delage et al. [6] reported a higher prevalence of underweight among children with CLP aged 48-60 months compared to children aged 0-5 months, with a difference of 6.7%. Notably, children included in this study underwent anthropometric evaluations before surgery to assess their nutritional status prior to surgical intervention, which indicates that those children aged 48-60 months had been living with CLP for a longer duration compared to children aged 0-5 months. Lazarus et al [34] discovered that children who underwent cleft repair surgery after one year of age had a 1.5 times higher likelihood of becoming underweight than those who underwent it at a younger age. Delay in cleft repair surgery leads to prolonged feeding difficulties in children, particularly in children with cleft palate [35].
We identified a considerably higher prevalence of wasting (12.5%) and overweight (12.9%) among children with CLP at the national level compared to their peers in the national health survey (wasting: 7.1%, overweight: 3.8%) [21]. Notably, the comparison between children with and without CLP indicates a significant difference in the prevalence of overweight, while no significant difference is found for wasting, corroborating findings from previous studies [22].
This study does not show any significant differences in the nutritional status based on BMI-for-age between age groups in either girls or boys with CLP. Although boys exhibit a higher prevalence of wasting and overweight compared to girls, the significant difference is only evident between boys and girls aged 0-5 months. Interestingly, the prevalence of overweight cases in the youngest age group of boys is twice that of girls. This may be attributed to the higher prevalence of stunting in boys within this age group, as stunted children are more susceptible to becoming overweight [36].
Since children may suffer from multiple forms of malnutrition, we also examined the prevalence of concurrent malnutrition cases among children with CLP. We identified concurrent stunting and overweight as the most common form of concurrent malnutrition, affecting 8.7% of the study subjects, exceeding those observed among children under the age of five in Indonesia (5.6%) [37]. Concerns regarding overweight have arisen with the discovery of high prevalence of stunting among children with CLP, supported by several studies indicating a potential link between stunting and overweight, resulting in a risk of double burden of malnutrition [36,38,39]. Children with stunting may experience an increase in BMI when their food intake increases or becomes excessive, as weight gain tends to outpace height catch-up [40]. Moreover, children with CLP may have higher susceptibility on becoming overweight when they already stunted at birth. Previous studies confirmed that maternal nutritional status, such as overweight and micronutrient deficiencies are risk factors for having a child with clefts and that obese mothers tend to have obese babies [41-43]. It seems important to further study the link of nutritional status of mothers and the risk of overweight among babies with CLP.
Currently, limited attention has been given to studies examining overweight among children with CLP, with previous research primarily concentrating on the risk of undernutrition due to the feeding challenges experienced by these children. However, the finding of lower prevalence of underweight among study subjects in our study raises the question of whether current efforts to provide feeding care for children with clefts have indeed succeeded in reducing the prevalence of underweight but inadvertently led to the emergence of a new concern–a higher prevalence of overweight.
We also found that all other forms of concurrent malnutrition are also present among children with CLP. The analysis of the prevalence of concurrent malnutrition between sexes and age groups tends to align with the significance observed in single malnutrition forms. Multiple indicators of malnutrition are associated with an increased mortality risk [44]. Therefore, considering that children with CLP require surgical intervention to improve their quality of life, it becomes crucial to assess all indicators of malnutrition to avoid adverse surgical outcomes, including the most severe, mortality.
Apart from characteristics such as sex and age, we also collected geographical information on children with CLP. Our study did not rely on the national database registry, but rather on surgical records obtained from a humanitarian organisation specialising in cleft care, leading to significant differences in sample sizes across various provinces. We provided an overview of the distribution of malnutrition cases based on the children's province of origin as a reference for further research in the form of a geographical map (Figure 2). However, this map should be interpreted with caution and in reference to the distribution of subjects (Figure 1, panel C), as the high prevalence of malnutrition cases in certain provinces may be attributed to the low sample size.
In view of these geographic characteristics, most children with CLP underwent their primary surgery in the same province as their origin, suggesting that the presence of health care providers in the residency increases the likelihood of receiving CLP treatments. This finding is supported by a three-year survey study conducted by Massenburg et al. [45] in intercontinental low- and middle-income countries (LMICs), where patient travel costs were identified as the most commonly reported barrier to accessing CLP treatment.
Despite the concerns raised by this study regarding the prevalence of malnutrition among children with CLP, there is likely a noteworthy proportion of children who do not experience malnutrition according to various growth indicators (Table S1 in the Online Supplementary Document). Specifically, more than half (58.7%) of the children were not affected by any form of malnutrition. There has been a considerable decline in the prevalence of stunting cases among children under the age of five over the past decades globally, but also in Indonesia specifically [46]. We hope that a similar positive trend will occur for other forms of malnutrition, including in children with CLP, thereby contributing to the achievement of the second goal of the Sustainable Development Goals (SDGs) – zero hunger [47].
Limitations
We did not assess socioeconomic status, which can significantly influence the nutritional status of children. Moreover, our subjects were patients presenting for primary surgery in Smile Train-sponsored facilities, meaning we did not include children who were not identified or those operated on in other facilities, potentially underestimating the true extent of the health care challenge. Moreover, subtle methodological differences in data collection in comparison to the control sample from national data may potentially limit our ability to directly compare the results. Likewise, more than 1% from the initial data sets had invalid z-scores, raising doubts about the quality of the data with valid z-scores. As we were unable to control the standardisation of anthropometric measurement and data input by local cleft care providers in the various facilities, we cannot exclude the possibility that z-scores value may be biased by incorrect dates of birth and anthropometric measurements.
CONCLUSIONS
Our study highlights the importance of nutritional intervention for children with orofacial clefts, particularly in Indonesia, and the relevance of age and in designing and implementing these interventions. Further research should explore the risks of both overweight and concurrent malnutrition in these population, including a thorough examination of factors that influence the nutritional status of children, including genetics (maternal nutrition and family health behaviour), economics (income, food availability, and security), physical (access to food, maternal knowledge, and education), social (culture and diet pattern), and health services (access and use of health facilities).
Additional material
Acknowledgements
We would like to thank all Smile Train partners in Indonesia who contributed to collecting the data for this study.
Data availability: Data described in the article, code book, and analytic code will be made available upon request pending application and approval from the corresponding author.
Footnotes
Funding: This project was conducted under joint research collaboration between Universitas Padjadjaran (Indonesia) and Utah State University (USA) as an implementation of Memorandum of Understanding (No. 163/UN6.RKT/MoU-LN/2022) funded by Smile Train research grant (GR-000028614).
Authorship contributions: All authors conceptualised the paper. AR and ES conducted the analysis, interpreted the data, and prepared the first draft of the manuscript, which was critically revised by all other authors. All authors read and approved the final manuscript.
Disclosure of interest: The authors completed the ICMJE Disclosure of Interest Form (available upon request from the corresponding author) and disclose no relevant interests.
REFERENCES
- 1.Christianson A, Howson CP, Modell B. March of dimes: Global report on birth defects, the hidden toll of dying and disabled children. New York: March of Dimes Birth Defects Foundation; 2005. [Google Scholar]
- 2.Ministry of Healthcare, Republic of Indonesia. [InfoDATIN: Congenital anomalies]. Available: https://pusdatin.kemkes.go.id/download.php?file=download%2Fpusdatin%2Finfodatin%2Finfodatin-kelainan-bawaan.pdf. Accessed: 12 April 2022.
- 3.Escher PJ, Zavala H, Lee D, Roby BB, Chinnadurai S.Malnutrition as a risk factor in cleft lip and palate surgery. Laryngoscope. 2021;131:E2060-E2065. 10.1002/lary.29209 [DOI] [PubMed] [Google Scholar]
- 4.Mossey PA, Little J, Munger RG, Dixon MJ, Shaw WC.Cleft lip and palate. Lancet. 2009;374:1773-85. 10.1016/S0140-6736(09)60695-4 [DOI] [PubMed] [Google Scholar]
- 5.Gebre A, Reddy PS, Mulugeta A, Sedik Y, Kahssay M.Prevalence of malnutrition and associated factors among under-five children in pastoral communities of Afar Regional State, Northeast Ethiopia: a community-based cross-sectional study. J Nutr Metab. 2019;2019:9187609. 10.1155/2019/9187609 [DOI] [PMC free article] [PubMed] [Google Scholar]
- 6.Delage B, Kerac M, Stieber E, Sheeran P.Prevalence of malnutrition among children at primary cleft surgery: A cross-sectional analysis of a global database. J Glob Health. 2022;12:04012. 10.7189/jogh.12.04012 [DOI] [PMC free article] [PubMed] [Google Scholar]
- 7.Boztepe H, Çınar S, Özgür Md FF.Parenting stress in turkish mothers of infants with cleft lip and/or palate. Cleft Palate Craniofac J. 2020;57:753-61. 10.1177/1055665619898592 [DOI] [PubMed] [Google Scholar]
- 8.Ford KL, Prado CM, Weimann A, Schuetz P, Lobo DN.Unresolved issues in perioperative nutrition: A narrative review. Clin Nutr. 2022;41:1578-90. 10.1016/j.clnu.2022.05.015 [DOI] [PubMed] [Google Scholar]
- 9.Burden S, Todd C, Hill J, Lal S.Pre-operative nutrition support in patients undergoing gastrointestinal surgery. Cochrane Database Syst Rev. 2012;11:CD008879. 10.1002/14651858.CD008879.pub2 [DOI] [PubMed] [Google Scholar]
- 10.Boyce JO, Reilly S, Skeat J, Cahir P.ABM clinical protocol #17: Guidelines for breastfeeding infants with cleft lip, cleft palate, or cleft lip and palate-revised 2019. Breastfeed Med. 2019;14:437-44. 10.1089/bfm.2019.29132.job [DOI] [PubMed] [Google Scholar]
- 11.McKinney CM, Bijlani K, Faino A, Evans KN, Kassuhn M, Griffin JL, et al. A cross-sectional study of the nutritional status of infants with orofacial clefts in the first 6 months of life. J Pediatr. 2023;255:181-9.e3. 10.1016/j.jpeds.2022.11.030 [DOI] [PubMed] [Google Scholar]
- 12.Chaya BF, Chalhoub R, Jaafar R, Nahhas N, Abu-Sittah G.Prevalence of stunting in Syrian refugee children with cleft lip and/or cleft palate in time of crisis: A call for intervention. Cleft Palate Craniofac J. 2020;57:1166-70. 10.1177/1055665620930450 [DOI] [PubMed] [Google Scholar]
- 13.Shashidar V, Dhanwadkar SS, Kumari ANB, Navale RA.The prevalence of malnutrition in children with cleft lip and cleft palate: a case-control study. Int J Contemp Pediatrics. 2019;6:445-8. 10.18203/2349-3291.ijcp20190448 [DOI] [Google Scholar]
- 14.Li N, Zhang K, Chen X, Cui J, Han X, Zhai D, et al. Evaluation of growth status of children with non-syndromic oral clefts. J Clin Pediatr Dent. 2023;47:59-63. [DOI] [PubMed] [Google Scholar]
- 15.Tungotyo M, Atwine D, Nanjebe D, Hodges A, Situma M.The prevalence and factors associated with malnutrition among infants with cleft palate and/or lip at a hospital in Uganda: a cross-sectional study. BMC Pediatr. 2017;17:17. 10.1186/s12887-016-0775-7 [DOI] [PMC free article] [PubMed] [Google Scholar]
- 16.Sarilita E, Setiawan AS, Mossey PA.Orofacial clefts in low- and middle-income countries: A scoping review of quality and quantity of research based on literature between 2010-2019. Orthod Craniofac Res. 2021;24:421-9. 10.1111/ocr.12458 [DOI] [PubMed] [Google Scholar]
- 17.World Health Organization. Training course on child growth assessment. Geneva: World Health Organization; 2008. [Google Scholar]
- 18.World Health Organization. WHO Anthro for personal computers version 3.2.2. Software for assessing growth and development of the world's children. Geneva: World Health Organization; 2010. [Google Scholar]
- 19.de Onis M, Borghi E, Arimond M, Webb P, Croft T, Saha K, et al. Prevalence thresholds for wasting, overweight and stunting in children under 5 years. Public Health Nutr. 2019;22:175-9. 10.1017/S1368980018002434 [DOI] [PMC free article] [PubMed] [Google Scholar]
- 20.Physical status: the use and interpretation of anthropometry. Report of a WHO Expert Committee. World Health Organ Tech Rep Ser. 1995;854:1-452. [PubMed] [Google Scholar]
- 21.Ministry of Health, Republic of Indonesia. [Pocket book of the results of the study on nutritional status in Indonesia (SSGI) at national, provincial, and district/city levels in 2021]. Jakarta: Ministry of Health, Republic of Indonesia; 2021. Indonesian. [Google Scholar]
- 22.Babalola O, Olabanji J, Oladele A, Olatunya O, Idowu F.Malnutrition among children with non-syndromic cleft lip and palate: A case-control study in Ile – Ife, Nigeria. Br J Med Med Res. 2016;16:1-7. 10.9734/BJMMR/2016/26168 [DOI] [Google Scholar]
- 23.Garenne M, Thurstans S, Briend A, Dolan C, Khara T, Myatt M, et al. Changing sex differences in undernutrition of African children: findings from demographic and health surveys. J Biosoc Sci. 2022;54:847-57. 10.1017/S0021932021000468 [DOI] [PubMed] [Google Scholar]
- 24.Torlesse H, Cronin AA, Sebayang SK, Nandy R.Determinants of stunting in Indonesian children: evidence from a cross-sectional survey indicate a prominent role for the water, sanitation and hygiene sector in stunting reduction. BMC Public Health. 2016;16:669. 10.1186/s12889-016-3339-8 [DOI] [PMC free article] [PubMed] [Google Scholar]
- 25.Thurstans S, Opondo C, Seal A, Wells JC, Khara T, Dolan C, et al. Understanding sex differences in childhood undernutrition: A narrative review. Nutrients. 2022;14:948. 10.3390/nu14050948 [DOI] [PMC free article] [PubMed] [Google Scholar]
- 26.Thompson AL.Greater male vulnerability to stunting? Evaluating sex differences in growth, pathways and biocultural mechanisms. Ann Hum Biol. 2021;48:466-73. 10.1080/03014460.2021.1998622 [DOI] [PMC free article] [PubMed] [Google Scholar]
- 27.Ng CS, Dibley MJ, Agho KE.Complementary feeding indicators and determinants of poor feeding practices in Indonesia: a secondary analysis of 2007 Demographic and Health Survey data. Public Health Nutr. 2012;15:827-39. 10.1017/S1368980011002485 [DOI] [PubMed] [Google Scholar]
- 28.Fledderjohann J, Agrawal S, Vellakkal S, Basu S, Campbell O, Doyle P, et al. Do girls have a nutritional disadvantage compared with boys? Statistical models of breastfeeding and food consumption inequalities among Indian siblings. PLoS One. 2014;9:e107172. 10.1371/journal.pone.0107172 [DOI] [PMC free article] [PubMed] [Google Scholar]
- 29.Keller KL, Kling SMR, Fuchs B, Pearce AL, Reigh NA, Masterson T, et al. A biopsychosocial model of sex differences in children’s eating behaviors. Nutrients. 2019;11:682. 10.3390/nu11030682 [DOI] [PMC free article] [PubMed] [Google Scholar]
- 30.Devi ES, Sai Sankar AJ, Manoj Kumar MG, Sujatha B.Maiden morsel - feeding in cleft lip and palate infants. J Int Soc Prev Community Dent. 2012;2:31-7. 10.4103/2231-0762.109350 [DOI] [PMC free article] [PubMed] [Google Scholar]
- 31.Wijekoon P, Herath T, Mahendran R.Awareness of feeding, growth and development among mothers of infants with cleft lip and/or palate. Heliyon. 2019;5:e02900. 10.1016/j.heliyon.2019.e02900 [DOI] [PMC free article] [PubMed] [Google Scholar]
- 32.Garcez LW, Giugliani ERJ.Population-based study on the practice of breastfeeding in children born with cleft lip and palate. Cleft Palate Craniofac J. 2005;42:687-93. 10.1597/04-108r1.1 [DOI] [PubMed] [Google Scholar]
- 33.María CA, María MC, Emilia CG.Maternal perception of breastfeeding in children with unilateral cleft lip and palate: A qualitative interpretative analysis. Int Breastfeed J. 2022;17:88. 10.1186/s13006-022-00528-y [DOI] [PMC free article] [PubMed] [Google Scholar]
- 34.Lazarus DD, Hudson DA, Fleming AN, Goddard EA, Fernandes DB.Are children with clefts underweight for age at the time of primary surgery? Plast Reconstr Surg. 1999;103:1624-9. 10.1097/00006534-199905000-00008 [DOI] [PubMed] [Google Scholar]
- 35.Martin V, Greatrex-White S.An evaluation of factors influencing feeding in babies with a cleft palate with and without a cleft lip. J Child Health Care. 2014;18:72-83. 10.1177/1367493512473853 [DOI] [PubMed] [Google Scholar]
- 36.Muhammad HFL.Obesity as the sequel of childhood stunting: ghrelin and GHSR gene polymorphism explained. Acta Med Indones. 2018;50:159-64. [PubMed] [Google Scholar]
- 37.Ciptanurani C, Chen HJ.Household structure and concurrent stunting and overweight among young children in Indonesia. Public Health Nutr. 2021;24:2629-39. 10.1017/S1368980021001385 [DOI] [PMC free article] [PubMed] [Google Scholar]
- 38.Popkin BM, Richards MK, Montiero CA.Stunting is associated with overweight in children of four nations that are undergoing the nutrition transition. J Nutr. 1996;126:3009-16. 10.1093/jn/126.12.3009 [DOI] [PubMed] [Google Scholar]
- 39.El Taguri A, Besmar F, Abdel Monem A, Betilmal I, Ricour C, Rolland-Cachera MF.Stunting is a major risk factor for overweight: results from national surveys in 5 Arab countries. East Mediterr Health J. 2009;15:549-62. 10.26719/2009.15.3.549 [DOI] [PubMed] [Google Scholar]
- 40.Minh Do L, Lissner L, Ascher H.Overweight, stunting, and concurrent overweight and stunting observed over 3 years in Vietnamese children. Glob Health Action. 2018;11:1517932. 10.1080/16549716.2018.1517932 [DOI] [PMC free article] [PubMed] [Google Scholar]
- 41.Munger RG, Kuppuswamy R, Murthy J, Balakrishnan K, Thangavel G, Sambandam S, et al. Maternal vitamin B(12) status and risk of cleft lip and cleft palate birth defects in Tamil Nadu State, India. Cleft Palate Craniofac J. 2021;58:567-76. 10.1177/1055665621998394 [DOI] [PubMed] [Google Scholar]
- 42.McKinney CM, Chowchuen B, Pitiphat W, Derouen T, Pisek A, Godfrey K.Micronutrients and oral clefts: a case-control study. J Dent Res. 2013;92:1089-94. 10.1177/0022034513507452 [DOI] [PMC free article] [PubMed] [Google Scholar]
- 43.Zhou Y, Sinnathamby V, Yu Y, Sikora L, Johnson CY, Mossey P, et al. Folate intake, markers of folate status and oral clefts: An updated set of systematic reviews and meta-analyses. Birth Defects Res. 2020;112:1699-719. 10.1002/bdr2.1827 [DOI] [PubMed] [Google Scholar]
- 44.McDonald CM, Olofin I, Flaxman S, Fawzi WW, Spiegelman D, Caulfield LE, et al. The effect of multiple anthropometric deficits on child mortality: meta-analysis of individual data in 10 prospective studies from developing countries. Am J Clin Nutr. 2013;97:896-901. 10.3945/ajcn.112.047639 [DOI] [PubMed] [Google Scholar]
- 45.Massenburg BB, Jenny H, Saluja S, Meara J, Shrime M, Alonso N.Barriers to cleft lip and palate repair around the world. J Craniofac Surg. 2016;27:1741-5. 10.1097/SCS.0000000000003038 [DOI] [PubMed] [Google Scholar]
- 46.United Nations Children’s Fund, World Health Organization, International Bank for Reconstruction and Development/The World Bank. Levels and trends in child malnutrition: UNICEF/WHO/The World Bank Group joint child malnutrition estimates: Key findings of the 2021 edition. Geneva: World Health Organization; 2021. [Google Scholar]
- 47.Sustainable development goal 2: Zero hunger. Available: https://www.un.org/sustainabledevelopment/hunger/. Accessed: 23 June 2023.
Associated Data
This section collects any data citations, data availability statements, or supplementary materials included in this article.