

Abstract
Contemporary approaches to instance segmentation in cell science use 2D or 3D convolutional networks depending on the experiment and data structures. However, limitations in microscopy systems or efforts to prevent phototoxicity commonly require recording sub-optimally sampled data that greatly reduces the utility of such 3D data, especially in crowded sample space with significant axial overlap between objects. In such regimes, 2D segmentations are both more reliable for cell morphology and easier to annotate. In this work, we propose the Projection Enhancement Network (PEN), a novel convolutional module which processes the sub-sampled 3D data and produces a 2D RGB semantic compression, and is trained in conjunction with an instance segmentation network of choice to produce 2D segmentations. Our approach combines augmentation to increase cell density using a low-density cell image dataset to train PEN, and curated datasets to evaluate PEN. We show that with PEN, the learned semantic representation in CellPose encodes depth and greatly improves segmentation performance in comparison to maximum intensity projection images as input, but does not similarly aid segmentation in region-based networks like Mask-RCNN. Finally, we dissect the segmentation strength against cell density of PEN with CellPose on disseminated cells from side-by-side spheroids. We present PEN as a data-driven solution to form compressed representations of 3D data that improve 2D segmentations from instance segmentation networks.
Introduction
Automated computational methods are crucial for high-throughput analyses of microscopy images, where structures of interest are tagged through staining, endogenous expression of fluorophores, or identified through contrast methods. The subsequent image processing, however, often requires expensive expert-level identification1, 2. In the domain of cell-science, instance segmentation, or the pixel-wise identification of each unique occurrence of an object in an image, is essential to capture vital morphological and biological insights, and has led to a deeper understanding of cell-heterogeneity3, the spatial-organization of sub-cellular components4, 5, and phenotype transitions in cancer6, 7, to name a few. Deep Neural Networks (DNN) and computer vision methods have been instramental to accomplish these tasks.
Many biomedical image analyses utilize convolutional neural networks for the identification of objects of interest in their images, in part due to their ability to learn and extract important features in the local receptive fields of stacked convolutions8, 9. Many of such applications take advantage of two particular architectures, including region-based networks, which propose object regions in an image for downstream segmentation, and U-Net based architectures, which contain an encoder-decoder style network that extracts features and spatial information to construct object segmentations10.
While many imaging modalities are able to acquire 3D spatial data, several challenges exist in fully-realizing its utility. First, researchers are often limited in 3D resolution due to toxicity or bleaching effects during imaging. To address the issue, computational algorithms have been proposed to infer a high-resolution 3D image from a sub-optimally sampled 3D image stack. The traditional method utilizes deconvolution of the spatially anisotropic point-spread-function with interpolation to overcome the insufficient axial resolution, at the expense of errors in the deconvolution method and additional parameters to hand-tune11, 12. More recently, state-of-the-art resolution enhancing deep learning techniques have been proposed and proven highly effective for both medical13, 14 and microscopy data15–17.
When high resolution 3D data is available, it often demands significant overhead in computational time and memory requirements for instance segmentation. Therefore, the majority of current methods do not use an end-to-end approach on 3D data, and instead charge the deep learning networks to only perform semantic segmentation, pixel-wise classification on 2D image slices, and later processed downstream by seeded watershed10, 18 or other traditional segmentation techniques19, 20. When axial resolution is high enough, a different strategy may be to use 2D instance segmentation networks to label a 3D image using all available 2D slices21.
Finally, in training of cell-based DNNs, few public sources of annotated datasets for 3D imaging modalities are available in part due to the tedious nature of annotating such data slice-by-slice. While promising semi-supervised methods have been considered to cut the necessary manual labor costs of annotating data22, they may introduce unintended bias23.
Due to all these constraints, it is desirable to achieve accurate cell segmentation on 3D image stacks that are sparsely sampled along the axial (z) dimension. The task is particularly challenging at high cell densities. 2D instance segmentation networks have far less parameters involved and offer an end-to-end solution to acquire 2D segmentations of objects. Moreover, there are an abundance of large, readily available labeled 2D cell images through Cell Image Library, Image Data Resource, and Kaggle which can be used to easily train 2D networks. At the single cell level, 2D images also encode most of the morphological quantities that provide accurate phenotype classification7.
Given the advantages of utilizing 2D images, it is imperative to recognize the limitations of simple dimensional-reduction approaches. The widely used maximum intensity projection (MIP), for instance, does not provide depth features in order to maintain contextual information, and therefore, spatial context is lost. In segmentation tasks, such as that shown in Figure 1B, MIP introduces spurious overlapping objects that are occluded and results in under-counting and poor segmentation. Other forms of projections, including standard deviation, sum, and mean projections can each introduce their own artifacts into the compressed representation. Instead, many researchers have used color and depth image pairs to overcome the loss of 3D spatial cues to perform 2D instance segmentation24–26.
Figure 1.

The Projection-Enhancement Network (PEN). (A) Architecture of PEN to encode 3D axial data into a 2D output image; A Z-stack 3D image is passed as input to PEN, which is operated on by 5 different scales of conv blocks. Note, the kernel size of the second conv block in each branch pools the axial features to a single dimension. The outputs of each branch are 3 × H × W, which are then stacked together, and operated on by a final conv block to produce a single RGB image of equal horizontal and vertical resolution as the input. (B) A typical workflow example that used maximum-intensity projection (MIP) of the input Z-stack for a compressed representation that was passed into a 2D instance segmentation network that predicts object masks. (C) Our proposed workflow diagram of data in the full model. The 3D data is passed to PEN, which passes its 2D RGB output to the 2D instance segmentation network of choice that produces the 2D predicted elements, such as instance masks.
In order to assist cell segmentation in 3D images that are sparsely sampled along the axial dimension, we develop the projection-enhancement network (PEN). PEN is a fully convolutional module designed to encode spatial information of 3D microscopy images into compressed 2D representations. We show that in contrast to MIP methods, the enhanced projection from PEN results in significant gains in detection and segmentations in high-density cells in 3D cultures. We show that functionally, PEN learns to encode depth, or becomes a low-high pass filter depending on the training setup. We highlight the segmentation ability of PEN in cancer cells disseminating from spheroids. Considering these results, we present PEN as an effective tool to decrease critical computation time and provide a method to spatially resolve 3D distributed objects in microscopy images for downstream analyses.
Methods
PEN Architecture
Utilizing the limited spatial information available in 3D image stacks with low axial resolution to produce robust 2D object segmentations, we propose PEN as a data-driven module to optimally reduce a gray scale image stack to a 2D RGB image. Our module is inspired by the Inception module27. As a module, PEN is placed in front of the 2D instance segmentation network of choice and is trained concurrently to maximize the learning objectives of the instance segmentation network, as shown in Figure 1C. A requisite of the module design included forming a shallow network to limit the overhead in terms of memory and computation time. In this work, we have optimized PEN for use with 2D cell segmentation tasks. Cells distributed in 3D may take any orientation and vary in shape and spatial distribution. These challenges lead us to select an architecture of a wide network, which performs independent operations at multiple scales that are concatenated at the output step.
Specifically, PEN consists of 3D convolutions distributed in separate branches, as shown in Figure 1A. In each branch, a single convolutional kernel of size is applied to the 3D image of axial size without padding in the axial dimension, and forms 3 feature maps. Following all convolutions, the feature maps undergo ReLU activation, then batch normalization. A subsequent convolution with kernel size of (1, 1, ) is applied to pool the axial features. The axial dimension is then squeezed out, and the semantic image in each branch becomes a 2D image with RGB channels. The outputs of the branches are then stacked, and a final 3D convolution is applied with kernel sizes of (1, 1, ) and 3 output channels. The convolution acts to pool each branch image separately into each output color channel, followed by non-linear ReLU activation and batch-normalization. The third spatial dimension is then squeezed out, leaving a 2D RGB-color image that is rescaled and normalized to be fed to the 2D segmentation network of choice. The final output is therefore a compressed representation of the 3D image stack into a 2D RGB image. See Supplementary S4 for additional details of model training.
Implementation
We first pair PEN with a modified CellPose network to investigate the impact of the module. CellPose is a 2D U-Net architecture that predicts horizontal and vertical flows along with probability maps for cell/background and cell edges for each 2D test image. To resolve multiple cells that overlap when projected on a 2D plane, we modify CellPose to predict output channels, where is a tunable integer parameter we set to 3 for this work (see also Supplementary S1). For each annotated cell, we assign its label to one of the output channels as ground-truth. The output channel assignment is determined by k-means classification of the axial positions of the annotated cells in the training image. Therefore, the depths of cells are monotonically but non-linearly mapped to the output channels (see also Supplementary S1).
As a comparison, we also pair PEN with Mask-RCNN (PEN+MaskRCNN). Mask-RCNN is a DNN that consists in part of a Res-Net feature pyramid network which feeds to a region proposal network (RPN) that proposes bounding-box regions to later be segmented. Since the RPN may propose overlapping bounding boxes, it may allow for a single 2D pixel to belong to more than one object. Therefore, we did not modify the output structures of Mask-RCNN.
Training of segmentation networks require a large amount of annotated data that has similar characteristics, such as the resolution, cell size and spatial distribution, to the data of interest. Where such data is not available, augmentations can be used to achieve satisfactory performance. The training data utilized here consists of MDA-MB-231 cells recorded with confocal microscopy. As shown in Figure 2A, the gray-scale images are recorded at a low axial resolution of , whereas the x-y plane resolution is 0.538 μm/pixel. As shown in Figure 2B, morphological features of cells are almost completely lost in the axial dimension. The resolution discrepancy associated with the imaging setup, which is often the preferred choice given the photon budget, makes it particularly desirable to perform segmentation based on information in the x-y plane.
Figure 2.

3D image data for training. (A) MDA-MB-231 GFP cells are embedded in 3D collagen matrices and imaged with confocal microscopy at a low axial resolution of , resulting in as few as two image slices per cell. (B) MIPs taken over each coordinate axis, where the sub-sampling in the axial dimension results in visible uncertainty in cell boundaries and morphologies in the X- and Y-projections. (C) Linear depth projections of cell image z-stacks; [top] training image of size 256 × 256 pixels shows 4 cells distributed in 3D with no augmentations applied, and [bottom] same training image with augmentation applied to increase local cell density. See Supplementary S2 for depth projection information. Scale-bars = 30 μm.
To enable PEN and the attached 2D segmentation networks to learn to segment axially overlapping cells, we prepare annotated training images through an augmentation strategy. First, we experimentally obtain confocal images of low cell densities (see Supplementary S4). The confocal stacks cover an axial range of 120 μm, at steps of 10 μm, where cells infrequently overlap when projected on the x-y plane (Figure 2C top). This makes it easy to annotate cells automatically using simple contrast-based segmentation and manually correct for errors. We then artificially increase the cell density during network training through a copying scheme described in Supplementary S3. This process created an annotated dataset with three times higher cell density (Figure 2C bottom). We find that such data augmentation is crucial for PEN to properly encode axial positioning, given our initial training set (Supplementary Figure 1).
Results
We first pair PEN with CellPose (PEN+CellPose) to assess the module’s effectiveness for improving 2D segmentation. As shown in Figure 3C–D, CellPose alone cannot distinguish cells that are overlapping using maximum-projections as inputs but does correctly identify individual segmentations of cells when PEN is trained in conjunction, as shown in Figure 3E–F. Next, to investigate the impact of the attached network architecture on the windfall of PEN, we compare to PEN paired with Mask-RCNN (PEN+Mask-RCNN). As shown in Figure 3G–J, the addition of PEN does not qualitatively improve the segmentation ability of Mask-RCNN compared to training with MIP inputs. This is consistent with previous reports showing Mask-RCNN often struggles in cases of overlapping instances28, as proposed regions in Mask-RCNN during inference are reduced using non-maximum suppression to prevent multiple detections of the same instance.
Figure 3.

Comparison of algorithm predictions of cell masks and bounding boxes over two example images. (A-B) Ground-truth object outlines of expert labeled MDA-MB-231 cells are shown in random colors over a MIP image. (C-D) Instance segmentation and bounding box predictions made by MIP+CellPose, (E-F) PEN+CellPose, (G-H) MIP+Mask-RCNN, and (I-J) PEN+Mask-RCNN. Each predicted object is randomly colorized. Scale-bars = 10 μm.
To quantitatively evaluate the performance of different network configurations, we systematically compare four metrics that have been introduced previously21. The results are shown in Table 1. Specifically, we compute the Jaccard Index, Precision, Recall, and a Quality metric which measures the segmentation quality (see also Supplementary S4). First, consistent with previous reports, CellPose outperforms Mask-RCNN on the Jaccard Index and has improved segmentation quality21. Comparing the addition of PEN to each network, on a low-density cell image dataset with > 4,000 annotated cells where fewer than 0.6% of cells displayed any axial overlap with another cell, the training scheme of CellPose using 2D MIP inputs (MIP+CellPose) slightly outperforms PEN+CellPose on most metrics. However, when compared to a dataset consisting of high-density cell images where 36.8% of cells had axial overlap with another cell, PEN+CellPose greatly outperforms MIP+CellPose on recall, which measures the ability of the network to detect and segment cells in an image with an intersection over union threshold of 50%. The poor performance noted in precision is a result of a high frequency of false-positives. That is, PEN+CellPose is prone to multiple detections on the same cell, as a result of activation in multiple channels of the output probability maps. On Mask-RCNN, the addition of PEN slightly improves most metrics over both datasets with the consistent exception of the segmentation quality, compared to MIP inputs. However, the performance boost of PEN in Mask-RCNN is less appreciable in comparison to its application in CellPose, particularly in recall on the high-density dataset.
Table 1.
Assessment of instance segmentation networks with the Projection-Enhancement Network (PEN). Performance of CellPose, a U-Net style network, and Mask-RCNN, a region-based network, were evaluated when trained on MIPs or in conjunction with PEN. Models were evaluated on a low-density cell dataset () with fewer than 0.6% of cells overlapping axially at an average of just 7.2% intersection over union in the MIP, and a high-density cell dataset () where 36.8% of cells were overlapping axially at an average 12.7% intersection over union. Metrics are measured at a minimum intersection over union of 50% for true-positive detections. See Supplementary S4 for details regarding metrics.
| Low-Density |
High-Density |
|||||||
|---|---|---|---|---|---|---|---|---|
| Model | Jaccard | Precision | Recall | Quality | Jaccard | Precision | Recall | Quality |
|
| ||||||||
| PEN+CellPose | 0.523 | 0.574 | 0.854 | 0.807 | 0.518 | 0.616 | 0.766 | 0.782 |
| MIP+CellPose | 0.656 | 0.729 | 0.869 | 0.853 | 0.432 | 0.731 | 0.514 | 0.727 |
| PEN+Mask-RCNN | 0.591 | 0.700 | 0.791 | 0.744 | 0.525 | 0.875 | 0.568 | 0.673 |
| MIP+Mask-RCNN | 0.588 | 0.731 | 0.751 | 0.759 | 0.398 | 0.750 | 0.460 | 0.700 |
We further compare our PEN+CellPose model to the double U-Net (DUNet) architecture29. DUNet is a convolutional neural network, whose single-encoder layers are connected to two, independent decoders. The decoders predict cell distances and neighbor distances that are used for a post-processing watershed algorithm. DUNet is the state-of-the-art in many cell segmenting and tracking challenges30. For evaluative purposes, we used the best performing pretrained DUNet model, trained on 3D Fluo-C3DL-MDA231 dataset31, and took MIPs of the resulting 3D detected objects. Using a high-resolution imaging example with significant axial cell-overlap (Figure 4A–B), we show that PEN+CellPose detects all four cells in the image (Figure 4C), but misidentifies the challenging protrusions as separate objects. However, DUNet fails to distinguish axially overlapping cells despite significant separation in 3D, resulting in poor segmentation of MIPs (Figure 4D–E). In contrast, we find DUNet has strong performance on simulated ellipsoids (Supplementary Figure 2). In all cases, PEN+CellPose quantitatively outperforms DUNet in identifying cells and ellipsoids in 3D image stacks (Supplementary Table 2).
Figure 4.
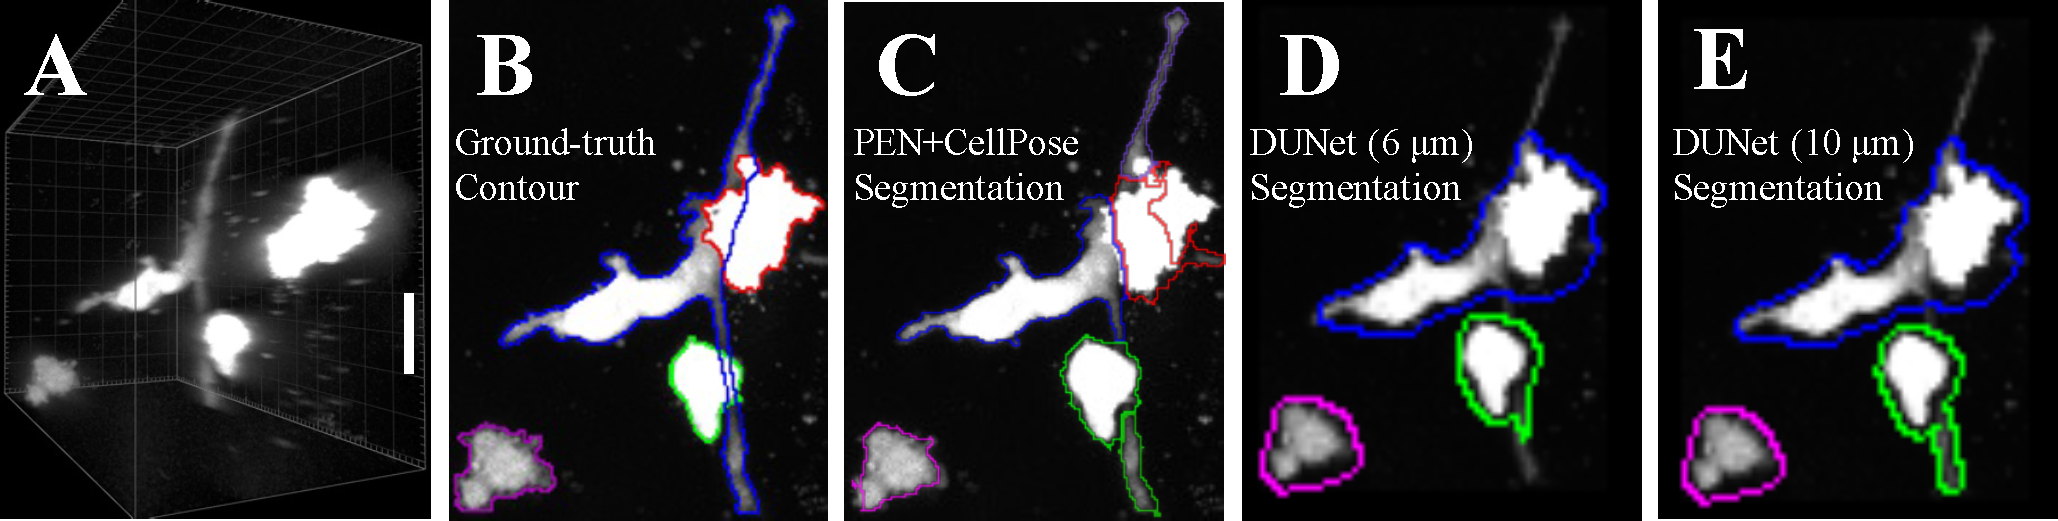
Comparison of PEN+CellPose and DUNet for generating 2D segmented projections from confocal image stacks of breast cancer cells in a 3D culture. (A) High resolution (0.5 μm axial resolution) confocal imaging of GFP-labeled MDA-MD-231 cells embedded in 3D collagen matrix. (B) 2D projection of the confocal image stack with expert-labeled ground-truth outlines showing segmented cells. (C) 2D projection with outlines showing segmented cells by PEN+CellPose. The image stack has been sub-sampled to 10 μm axial resolution before applying PEN+CellPose. (D-E) 2D projection with outlines showing segmented cells by DUNet. The image stack has been sub-sampled to 6 μm axial resolution in (D) and 10 μm in (E) before applying DUNet. The DUNet was pretrained with axial resolution of 6 μm as described previously31.
PEN maps a 3D gray scale image stack to a compressed 2D RGB representation, and the mapping algorithm is learned by training PEN in conjunction with a downstream network. To understand the dependence of PEN on its paired network, we compare the output of PEN when it has been trained with CellPose and Mask-RCNN respectively. Figure 5B shows the output of PEN when trained in conjunction with CellPose, evaluated on a test image stack of low cell density as input. The coloration corresponds to an approximate object depth where cells with lower-to-higher axial positions are mapped to red-to-green-to-blue color channels. This verifies that PEN offers a data-driven approach to color code depth from a 3D image. Inspired by this finding, we further compare PEN to a linear depth embedding algorithm in Supplementary S2 and show that PEN outperforms the linear depth embedding over all metrics analyzed in this work, as seen in Supplementary Table 1. The depth-encoded image from PEN explains why the module’s addition to CellPose boosts its performance in the high-density dataset in comparison to training with the max-projection images, as shown in Figure 5A. Interestingly, we find that when trained with Mask-RCNN, PEN does not similarly encode depth, as shown in Figure 5C. Instead, we find that PEN acts as a low-pass filter, and only maintains activations in one color channel. The blurry low-passed image from PEN demystifies why the quality of segmentations in Mask-RCNN are slightly worse, but makes cells in the image easier to detect and improves precision, recall, and the Jaccard metric.
Figure 5.

Outputs of the Projection-Enhancement Network (PEN) after successful training. (Left) A reference MIP image of MDA-MB-231 GFP cells distributed within a 3D image stack, (Top) the output of PEN when trained in conjunction with CellPose, and (Bottom) the output of PEN when trained in conjunction with Mask-RCNN. Scale-bars = 50 μm.
Following successful training with augmented data (Figure 2), we test if PEN+CellPose can handle experimental 3D images with high cell densities and low axial resolution. To this end, we create a sample of two cancer cell spheroids seeded next to each other in 3D collagen matrix (Figure 6 top). After 1 day of cell invasion into the matrix, we image the sample with an x-y-z tile scan that covers a volume of 3020 × 1492 × 120 μm3. The resolution in the x-y plane is 0.538 μm/pixel, and the resolution in the axial direction is 10 μm/pixel (see also Supplementary S4). Visually (Figure 6 bottom), the disseminated cells are identifiable but display significant overlap in the 2D projection. The cells within the spheroid boundary are, however, difficult to distinguish even by an experienced researcher. We apply the trained PEN+CellPose model to the 3D image stack. The segmented cells are randomly colored and plotted over the original data (gray). PEN+CellPose identified 1037 cells associated with the spheroids on the left, and 667 cells associated with the spheroids on the right. Cells disseminated from the spheroids are well segmented. Their elongated shape and various types of protrusions, such as fan-shaped lamellipodia and finger-shaped filopodia, are well preserved. Not surprisingly, the model performs poorly in regions deep within the spheroids. Therefore, we conclude that PEN enables 2D instance segmentation networks to quantify the 3D invasion of tumor spheroids where the imaging covers a large volume under low axial resolution.
Figure 6.

PEN+CellPose instance segmentation of a 3D system of disseminated cells from side-by-side MDA-MB-231 GFP spheroids. (Top) A MIP image of two MDA-MB-231 GFP spheroids separated by ≈1 mm that were gelled in 1.5 mg/mL collagen at 37°C and imaged immediately. (Center) The same spheroids were imaged after 22 hours of invasion, and an overlay of the instance segmentation is performed by PEN+CellPose and shown on top of the gray-scale MIP. Over 1700 unique, randomly colored, detections are shown in the lower image. (Lower Insets) Zoomed sections of each spheroid illustrate the effect of crowding on PEN+CellPose performance. Top and Center image scale-bars = 500 μm, inset scale-bars = 100 μm.
After illustrating the application and performance of PEN for spheroid invasion, we investigate the importance of architectural components to the success of PEN through an ablation study, as shown in Table 2. We first examined the contributions of the smallest () and largest () convolutional kernel sizes. We find that removal of either kernel does not effect the performance after retraining compared to the base PEN+CellPose model, indicating that the successful axial encoding seen in Figure 5B results from the intermediate kernel sizes, in agreement with the fact that most cells in the training set typically span several slices. However, we expect that including the range of kernel sizes allows PEN to remain robust to new datasets with different axial resolution.
Table 2.
Ablation study of the PEN + CellPose (base) instance segmentation network. To evaluate the effects of ablation, each model was retrained from an initialized set of random weights. We evaluated removal of the and kernel sizes, thereby removing an individual branch of PEN shown in Figure 1A. The subsequent convolution in each branch was replaced with a max-pooling operation in the axial dimension in the Branch Max model. The final convolution in PEN was replaced with a max-pooling operation in Collect Max model. Finally, the ground-truth assignment strategy to the available channels of our modified CellPose algorithm was set to randomly assign cell labels to channels in the Random GT model, and to a single channel in the model. All models were evaluated on a low-density cell dataset with fewer than 0.5% of cells overlapping axially at an average of just 7.2% intersection over union in the 2D projection, and a high-density cell dataset where 36.8% of cells were overlapping axially at an average 12.7% intersection over union. Metrics are measured at a minimum intersection over union of 50% for true-positive detections. See Supplementary S4 for details regarding metrics.
| Model | Low-Density |
High-Density |
||||||
|---|---|---|---|---|---|---|---|---|
| Jaccard | Precision | Recall | Quality | Jaccard | Precision | Recall | Quality | |
|
| ||||||||
| Base | 0.523 | 0.574 | 0.854 | 0.807 | 0.518 | 0.616 | 0.766 | 0.782 |
| − K = 1 | 0.502 | 0.546 | 0.864 | 8103 | 0.518 | 0.610 | 0.775 | 0.782 |
| − K = 11 | 0.489 | 0.527 | 0.871 | 0.812 | 0.449 | 0.512 | 0.784 | 0.762 |
| Branch Max | 0.5202 | 0.564 | 0.870 | 0.818 | 0.4785 | 0.600 | 0.703 | 0.746 |
| Collect Max | 0.485 | 0.520 | 0.877 | 0.816 | 0.5298 | 0.619 | 0.802 | 0.771 |
| Random GT | 0.009 | 0.023 | 0.014 | 0.686 | 0.0759 | 0.125 | 0.162 | 0.592 |
| 0.6578 | 0.734 | 0.863 | 0.840 | 0.480 | 0.811 | 0.541 | 0.710 | |
Next, we investigate replacement of the secondary convolutional block in each branch of PEN with a max-pooling operation over the axial dimension (Branch Max). This alteration makes the network more shallow with fewer parameters to learn. We observed similar performance on the low-density dataset, and a slight decrease in all metrics on the high-density dataset compared to the base model. We speculate that the max-pooling operation makes the network over-reliant on the initial convolution of each branch to learn to incorporate the axial information to the output projection.
We then explore an alternative method to combine the spatial information learned in each branch of PEN by replacing the final convolutional block with a max-pooling operation (Collect Max). We find that the this model slightly outperforms the base model on recall over both datasets. Here, we choose to keep the convolution despite the comparable performance of the max-pooling layer to maximize the expressive ability of the module, since the pooling operation can be learned by the convolution.
Finally, we investigate the ground-truth assignment strategy used to assign annotated cells to the output channels discussed in Supplementary S1. In the base PEN+CellPose model, cells are assigned to ground truth output channels based on their z-position, compared to the Random GT model where cells are randomly assigned to channels, and the model where cells are assigned a single output channel. We find that random assignment results in very poor performance across all metrics of both datasets. Additionally, by not including multiple output channels, we increase the performance of the network on the low-density dataset as a result of fewer false-positives, but yields a dramatically decreased performance in recall on the high-density dataset as the network fails to detect superposed objects. We conclude that multiple output channels are vital to the performance of PEN, and that an assignment strategy based on cell position allows PEN to learn and pass axial information to the downstream network.
Discussion
Biomedical research routinely produces 3D image stacks that cover a large volume but have a low axial resolution as limited by practical considerations such as photo damaging, and temporal resolution32, 33. To facilitate cell segmentation in such datasets, here we introduce the Project-Enhancement Network (PEN). PEN is a shallow, multiscale, convolutional neural network that encodes a 3D image stack to a 2D RGB color image, which can be subsequently passed to a 2D segmentation algorithm, as shown in Figure 1. We show that when paired with state-of-the-art DNNs of 2D segmentation, PEN enables accurate detection of cells densely populated in 3D image stacks of low axial resolutions, as illustrated in the examples in Figure 3.
In the training of PEN we take a strategy that leverages data augmentation, which avoids tedious manual labeling to generate annotated data34. We find the strategy very effective, and can be easily automated by first segmenting low density cell images, then augmenting to artificial high density images, as in the example of Figure 2. Employing this training strategy, we show that PEN+CellPose network can simultaneously detect over one thousand breast cancer cells disseminating from tumor spheroids, as seen in Figure 6.
We find that the performance of PEN depends on the downstream network it is paired with. In this work, we compared the performance of PEN in conjunction with two leading DNNs in cell-science, CellPose and Mask-RCNN21, 35, as computed in Table 1. Significantly, we found that Mask-RCNN did not result in improved performance when built with PEN. A major structural difference in region-based CNNs compared to U-Net style networks is the extraction of regions for segmentation, here through a RPN in Mask-RCNN. To make the algorithm more efficient, the developers of the RPN in Mask-RCNN chose 3 size-scales and 3 aspect-ratios for the k-anchor boxes proposed within each sliding window35. While the network is therefore robust against translations, random orientations and high variance in morphology make many cell-image datasets difficult to determine best size and aspect ratio parameters. In contrast, the efficacy of PEN is purely data-driven and does not restrict object orientation or scale. Furthermore, the RPN has its own loss function to minimize, whereas PEN is only subject to the learning objectives of the instance segmentation network it is attached to and the data that is used as training. On one hand, no additional loss function is a feature of PEN, making it light-weight and a plug-and-play module. However, on the other hand, no direct learning objective makes PEN susceptible to learn inconsistent or poor feature embeddings as a result of underlying patterns in the data. Collectively, we recommend integrating PEN with UNet-based downstream networks like CellPose. This pairing generally surpasses the performance of PEN combined with region proposal networks like MaskRCNN when segmenting multicellular bioimages.
Our results shed light on the explainability of DNNs36, as visualized in Figure 5. In the PEN+CellPose configuration, we show that after training, PEN learns to become a nonlinear depth encoder. This makes it possible for the 2D CellPose to detect overlapping cells on a 2D plane using the depth-encoding color information. In the PEN+MaskRCNN configuration, however, PEN learns to become a low-pass filter. We speculate that the non-maximum suppression used in region-proposal networks to filter out multiple detections of objects with significant intersection-over-union prevents Mask-RCNN from detecting overlapping cells in any 2D projected image. However, the learned embedding helps to improve the segmentation of the single detected object, as edges are more easily distinguished in the low-pass image. Therefore, we find that after training, PEN turns an input image into a semantic embedding that represents the best image transformation to maximize the learning objectives of the neural network it is attached to.
Through a systematic ablation study in Table 2, we find the performance of PEN+CellPose critically depends on the assignment strategy of ground-truth annotations to multiple predicted channels. The modifications of CellPose in this work, particularly expanding the predicted maps to multiple channels corresponding to object depth in the 3D image stack, are vital to detect overlapping cells in 3D. Indeed, reducing from 3 to 1 seriously deteriorates the segmentation performance. It is interesting for future studies to further explore the optimal that balance the computational cost and segmentation power.
We notice that our current method relies on training sets obtained by taking advantage of augmentation. We chose this strategy to minimize user efforts in annotation, with the underlying assumption that cells are uniformly distributed in the image stack. However, the approximation may break down in cases where cells are concentrated in just a few z-stacks. Future work should use newer, attention-based transformer encoder architectures which would allow PEN to pay attention to relevant slices in the stack that contain objects. This could make the model robust for varying axial distributions of cells in the stack and produce a per-image embedding, rather than a fixed depth-to-color embedding. For more information, we quantify this limitation in PEN+CellPose within Supplementary S6. Our results indicate that PEN+CellPose efficiently segments cell-like ellipsoids at varying axial resolutions and densities, highlighting the power of the algorithm. However, the performance starts to deteriorate when axial distances of cells are less than one cell length.
In conclusion, we propose PEN as a plug-and-play module that provides a data-driven approach to compress a 3D image stack into a 2D RGB representation as inputs for 2D instance segmentation networks. We highlight PEN’s utility in the detection of disseminated cells from cell-dense spheroids and in settings of significant cell-cell overlap. Our result is a deep-learning solution for instance segmentation in a data regime often overlooked in the field. We envision PEN to be a useful tool for a wide range of applications such as in research of cancer and developmental biology.
Supplementary Material
Acknowledgements
This work is supported by DOD award W81XWH-20-1-0444 (BC190068), and the National Institute of General Medical Sciences award 1R35GM138179.
Footnotes
Competing interests
The authors declare no competing interests.
Data and code availability
The data and code used in this study can be accessed at the following public repositories:
Training (subset) and validation. https://figshare.com/articles/dataset/subset_training_validation/21153250/1
Curated high density dataset. https://figshare.com/articles/dataset/curated_high_density_dataset/21153241/1
Spheroid confocal stack. https://figshare.com/articles/dataset/MDA-MB-231_Spheroid_Z-stack/21153232/1
All source code developed in this work and trained models are available at https://github.com/eddy6081/PEN
References
- 1.Roberts B et al. Systematic gene tagging using crispr/cas9 in human stem cells to illuminate cell organization. Mol. biology cell 28, 2854–2874 (2017). [DOI] [PMC free article] [PubMed] [Google Scholar]
- 2.Ounkomol C, Seshamani S, Maleckar MM, Collman F & Johnson GR Label-free prediction of three-dimensional fluorescence images from transmitted-light microscopy. Nat. methods 15, 917–920 (2018). [DOI] [PMC free article] [PubMed] [Google Scholar]
- 3.Viana MP et al. Robust integrated intracellular organization of the human ips cell: where, how much, and how variable. bioRxiv DOI: 10.1101/2020.12.08.415562 (2021). https://www.biorxiv.org/content/early/2021/01/13/2020.12.08.415562.full.pdf. [DOI]
- 4.Gerbin KA et al. Cell states beyond transcriptomics: integrating structural organization and gene expression in hipsc-derived cardiomyocytes. Cell Syst. 12, 670–687 (2021). [DOI] [PubMed] [Google Scholar]
- 5.Donovan-Maiye RM et al. A deep generative model of 3d single-cell organization. PLoS computational biology 18, e1009155 (2022). [DOI] [PMC free article] [PubMed] [Google Scholar]
- 6.Wang W, Poe D, Yang Y, Hyatt T & Xing J Epithelial-to-mesenchymal transition proceeds through directional destabilization of multidimensional attractor. Elife 11, e74866 (2022). [DOI] [PMC free article] [PubMed] [Google Scholar]
- 7.Eddy CZ et al. Morphodynamics facilitate cancer cells to navigate 3d extracellular matrix. Sci. reports 11, 1–10 (2021). [DOI] [PMC free article] [PubMed] [Google Scholar]
- 8.Sarvamangala D & Kulkarni RV Convolutional neural networks in medical image understanding: a survey. Evol. intelligence 1–22 (2021). [DOI] [PMC free article] [PubMed] [Google Scholar]
- 9.Araujo A, Norris W & Sim J Computing receptive fields of convolutional neural networks. Distill DOI: 10.23915/distill.00021 (2019). Https://distill.pub/2019/computing-receptive-fields. [DOI] [Google Scholar]
- 10.Kar A et al. Benchmarking of deep learning algorithms for 3d instance segmentation of confocal image datasets. PLoS computational biology 18, e1009879 (2022). [DOI] [PMC free article] [PubMed] [Google Scholar]
- 11.Dusch E, Dorval T, Vincent N, Wachsmuth M & Genovesio A Three-dimensional point spread function model for line-scanning confocal microscope with high-aperture objective. J. microscopy 228, 132–138 (2007). [DOI] [PubMed] [Google Scholar]
- 12.Elhayek A, Welk M & Weickert J Simultaneous interpolation and deconvolution model for the 3-d reconstruction of cell images. In Joint Pattern Recognition Symposium, 316–325 (Springer, 2011). [Google Scholar]
- 13.de Leeuw den Bouter M. et al. Deep learning-based single image super-resolution for low-field mr brain images. Sci. Reports 12, 1–10 (2022). [DOI] [PMC free article] [PubMed] [Google Scholar]
- 14.Vaidyanathan A et al. Deep learning for the fully automated segmentation of the inner ear on mri. Sci. reports 11, 1–14 (2021). [DOI] [PMC free article] [PubMed] [Google Scholar]
- 15.Weigert M et al. Content-aware image restoration: pushing the limits of fluorescence microscopy. Nat. methods 15, 1090–1097 (2018). [DOI] [PubMed] [Google Scholar]
- 16.Zhang H et al. High-throughput, high-resolution deep learning microscopy based on registration-free generative adversarial network. Biomed. optics express 10, 1044–1063 (2019). [DOI] [PMC free article] [PubMed] [Google Scholar]
- 17.Wang H et al. Deep learning enables cross-modality super-resolution in fluorescence microscopy. Nat. methods 16, 103–110 (2019). [DOI] [PMC free article] [PubMed] [Google Scholar]
- 18.Fernandez R et al. Imaging plant growth in 4d: robust tissue reconstruction and lineaging at cell resolution. Nat. methods 7, 547–553 (2010). [DOI] [PubMed] [Google Scholar]
- 19.Wolny A et al. Accurate and versatile 3d segmentation of plant tissues at cellular resolution. Elife 9, e57613 (2020). [DOI] [PMC free article] [PubMed] [Google Scholar]
- 20.Wang A et al. A novel deep learning-based 3d cell segmentation framework for future image-based disease detection. Sci. reports 12, 1–15 (2022). [DOI] [PMC free article] [PubMed] [Google Scholar]
- 21.Stringer C, Wang T, Michaelos M & Pachitariu M Cellpose: a generalist algorithm for cellular segmentation. Nat. methods 18, 100–106 (2021). [DOI] [PubMed] [Google Scholar]
- 22.Çiçek Ö, Abdulkadir A, Lienkamp SS, Brox T & Ronneberger O 3d u-net: learning dense volumetric segmentation from sparse annotation. In International conference on medical image computing and computer-assisted intervention, 424–432 (Springer, 2016). [Google Scholar]
- 23.Chapelle O, Scholkopf B & Zien A Semi-supervised learning (chapelle o. et al., eds.; 2006)[book reviews; ]. IEEE Transactions on Neural Networks 20, 542–542 (2009). [Google Scholar]
- 24.Silberman N, Sontag D & Fergus R Instance segmentation of indoor scenes using a coverage loss. In European conference on computer vision, 616–631 (Springer, 2014). [Google Scholar]
- 25.Gupta S, Girshick R, Arbeláez P & Malik J Learning rich features from rgb-d images for object detection and segmentation. In European conference on computer vision, 345–360 (Springer, 2014). [Google Scholar]
- 26.Gupta S, Arbeláez P, Girshick R & Malik J Aligning 3d models to rgb-d images of cluttered scenes. In Proceedings of the IEEE conference on computer vision and pattern recognition, 4731–4740 (2015). [Google Scholar]
- 27.Szegedy C et al. Going deeper with convolutions. In Proceedings of the IEEE conference on computer vision and pattern recognition, 1–9 (2015). [Google Scholar]
- 28.Suh S et al. Weighted mask r-cnn for improving adjacent boundary segmentation. J. Sensors 2021 (2021). [Google Scholar]
- 29.Scherr T, Löffler K, Böhland M & Mikut R Cell segmentation and tracking using cnn-based distance predictions and a graph-based matching strategy. PLoS One 15, e0243219 (2020). [DOI] [PMC free article] [PubMed] [Google Scholar]
- 30.Cell segmentation benchmarks. https://paperswithcode.com/task/cell-segmentation. Accessed: 2023-07-30. [Google Scholar]
- 31.Cell tracking challenge 3d datasets. http://celltrackingchallenge.net/3d-datasets/. Accessed: 2023-07-29. [Google Scholar]
- 32.Jonkman J, Brown CM, Wright GD, Anderson KI & North AJ Tutorial: guidance for quantitative confocal microscopy. Nat. protocols 15, 1585–1611 (2020). [DOI] [PubMed] [Google Scholar]
- 33.Schneckenburger H & Richter V Challenges in 3d live cell imaging. In Photonics, vol. 8, 275 (MDPI, 2021). [Google Scholar]
- 34.Shorten C & Khoshgoftaar TM A survey on image data augmentation for deep learning. J. big data 6, 1–48 (2019). [DOI] [PMC free article] [PubMed] [Google Scholar]
- 35.Abdulla W Mask r-cnn for object detection and instance segmentation on keras and tensorflow. https://github.com/matterport/Mask_RCNN (2017). [Google Scholar]
- 36.Tjoa E & Guan C A survey on explainable artificial intelligence (xai): Toward medical xai. IEEE transactions on neural networks learning systems 32, 4793–4813 (2020). [DOI] [PubMed] [Google Scholar]
Associated Data
This section collects any data citations, data availability statements, or supplementary materials included in this article.
Supplementary Materials
Data Availability Statement
The data and code used in this study can be accessed at the following public repositories:
Training (subset) and validation. https://figshare.com/articles/dataset/subset_training_validation/21153250/1
Curated high density dataset. https://figshare.com/articles/dataset/curated_high_density_dataset/21153241/1
Spheroid confocal stack. https://figshare.com/articles/dataset/MDA-MB-231_Spheroid_Z-stack/21153232/1
All source code developed in this work and trained models are available at https://github.com/eddy6081/PEN