

Summary
This paper proposed a method based on heart rate variability (HRV) for evaluating the accuracy of wearable devices in measuring heart rate. HRV refers to the variation in time intervals between successive heartbeats, widely used in many fields such as clinical and sports fields. Wearable devices such as Electrocardiogram (ECG) electrode patches have gained popularity due to their portability and ease of use. However, they can be prone to measurement interference caused by environmental noise, human respiration, etc. The proposed method consists of four main components: selection of “gold standard measurement devices”, identification of HRV measurement metrics, construction of an HRV evaluation framework, and quantification of measurement errors. The method is validated through simulated experiments using ECG patches. The evaluation framework and quantification model established in this method have significant implications in establishment of industry standards and diagnosis of diseases in clinical practice.
Subject areas: Physics, Biological sciences, Materials science
Graphical abstract
Highlights
-
•
Proposing an HRV-based method for evaluating the measurement accuracy of wearable devices
-
•
Verifying the proposed method by simulation using electrocardiogram electrode patches
-
•
Developing an HRV assessment framework that reflects the current industry standard
-
•
The proposed method is of great significance in industry calibration and clinical practice
Physics; Biological sciences; Materials science
Introduction
Background
The autonomous nerve system (ANS) regulates various physiological functions, such as circulation, respiration, digestion, sweating, thermoregulation, and metabolism, and is associated with various types of diseases.1 Heart rate variability (HRV), which is the fluctuation of the RR interval (RRI) in electrocardiogram (ECG), has been widely adopted for autonomous evaluation. The HRV is a phenomenon in which there is fluctuation in the RRI, reflecting the activities of the ANS.2
HRV is a non-invasive indicator that measures the variation in time between heartbeat cycles. It has gained significant attention in recent years as an important tool for functional status monitoring in medical and sports science fields. To measure HRV, the change of RRI over a period of time is usually analyzed, providing valuable insights into the cardiovascular system’s function and autonomic regulation.3
The clinical relevance of HRV was first recognized in 1965 by Hon and Lee, who reported that changes in the fascicular septum could be detected prior to the occurrence of fetal distress (fetal hypoxia), even when the heart rate had not changed.4 In the following decade, Sayers and others focused on identifying circadian rhythms controlling heart rate signals,3 while Ewing and colleagues designed simple clinical trials to detect autonomic neuropathy in patients with diabetes using short-term RRI differences.5 In 1977, Wolf et al. demonstrated for the first time the association between decreased HRV and increased mortality.6 In 1981, Akselrod et al. pioneered the introduction of power spectral analysis for quantitatively assessing cardiovascular control of heartbeats via frequency-domain analysis of heart rate fluctuations.7 These analyses help to understand the autonomic context of RRI fluctuations in heart rate recordings. By the late 1980s, the clinical importance of HRV had been established as a strong and independent predictor of mortality in acute myocardial infarction and other cardiovascular diseases.8 Today, HRV is recognized as a valuable tool for monitoring autonomic nervous system function and for predicting morbidity and mortality in various health conditions, including cardiovascular disease, diabetes, sleep disorders, and more.
In recent decades, the important relationship between the autonomic nervous system and cardiovascular disease-related mortality has been recognized.5,6,7,8 Experimental evidence suggests that susceptibility to lethal arrhythmias is associated with signs of increased sympathetic activity or decreased vagal activity, prompting efforts to develop quantitative markers of autonomic activity. HRV is one of the most promising markers of this type and is rapidly gaining popularity due to the simplicity of its derivation. Initially, HRV was used only to evaluate and observe diseases related to the cardiovascular system to predict and provide effective information regarding these diseases. Over time, researchers began to explore the application of HRV to other diseases. In recent years, HRV has been widely used in sudden infant death syndrome,9,10,11 depression,12,13,14 diabetes,15,16,17 aging,18,19,20 anorexia nervosa,21,22,23 anxiety, panic,24,25,26,27 and other autonomic nervous system dysfunction diseases and related factors. With the advent of new digital, high-frequency, full-time, multi-channel ECG recorders, HRV has the potential to provide new and valuable information on physiological and pathological conditions to enhance disease risk stratification capabilities. As such, HRV continues to be an essential tool for monitoring autonomic nervous system function and predicting morbidity and mortality in various health conditions, making it a crucial component of modern healthcare research.
With the growing interest in HRV and its potential applications, the number of research studies and clinical reports on HRV is rapidly increasing. However, there are variations in research methods and interpretations of HRV among different publishers, making it necessary to standardize HRV research. To address this issue, the European Heart Association and the North American Heart Rate Electrophysiology Association established a task force and released a working guideline on HRV research in 1996.28 In 2002, the Russian Ministry of Health Clinical Diagnostic Instrument Committee and the New Medical Technology Committee also released recommendations for HRV analysis under different ECG systems.3 In 2014, the Cardiovascular Professional Committee of the Chinese Pathophysiological Society issued an announcement urging for the standardization of HRV detection,3 advocating for collaboration with other countries, adopting correct HRV analysis approaches, and improving public understanding of autonomic nerves. These efforts are crucial to ensure that HRV research can be performed consistently and effectively across different countries and institutions, ultimately promoting the integration of HRV into clinical practice and advancing our understanding of autonomic nervous system function in health and disease.
Currently, there are limited methods proposed for evaluating the accuracy of device measurements. In one study, 51 consecutive patients with a history of paroxysmal supraventricular tachyarrhythmia (SVT) or paroxysmal palpitations were enrolled to assess the accuracy of three types of devices for measuring heart rate (HR) using “5 bpm accuracy”.29 Another study evaluated the accuracy of two pulse plethysmography (PPG) based commercially available HR monitors during exercise by comparing HR estimation against values from the reference electrocardiogram (ECG) signal.30 Besides, Kroll et al. evaluated the accuracy of heart rate monitoring by a personal fitness tracker (PFT) among hospital inpatients.31 This study compared the accuracy of heart rate recordings with gold standard measurements derived from continuous ECG monitoring. Most of these methods use bpm to evaluate the accuracy of the devices and rarely evaluate them from the perspective of HRV. However, our proposed method first uses “3 bpm” accuracy to screen the “gold standard” needed in the experiment in the field of ECG patches. We then build an evaluation framework based on HRV and quantify the errors of ECG patch devices. This is a pioneering study in the current research field.
Commonly used analysis approaches and indicators for HRV
Time-domain analysis, frequency-domain analysis, and nonlinear analysis are three common methods for analyzing HRV.4 Detailed descriptions of commonly utilized analysis methods and the corresponding calculations HRV within three domains were provided in many researches, like.32,33,34,35 Of these, time-domain and frequency-domain analyses are more commonly used in clinical practice and research. Time-domain analysis involves the calculation of statistical indices from a series of RR intervals, including measures such as mean heart rate, standard deviation of RR intervals, and root-mean-square of successive differences. Frequency-domain analysis, on the other hand, is based on the assumption that heart rate fluctuations can be decomposed into different frequency bands. This method involves the use of power spectral density estimates to quantify the strength of the low-frequency (LF) and high-frequency (HF) components of HRV, which reflect sympathetic and parasympathetic activity, respectively. Nonlinear analyses, while less common, involve more complex mathematical models that can capture the complexity of physiological systems, such as fractal scaling exponents and entropy measures. These techniques have shown promise in providing further insights into the autonomic regulation of heart rate and have potential applications in various health conditions.
In this method, 14 HRV indicators were selected from conventional HRV indices to reduce redundant information, decrease processing time, improve generalizability, and enhance interpretability (see Table 1 for specific indicator descriptions). Our selection criteria were as follows.
-
1.
In the time domain, the maximum and minimum values of RRI data are redundant with the mean value, so only the mean value indicator, MeanRRI, was used.
-
2.
Percentage indicators were not included in the analysis since our method primarily uses percentage differences for evaluation.
-
3.
During experimentation, we observed that the frequency value at which the power spectral density reaches its peak in each frequency domain is not related to experimental personnel, noise, or other factors. Therefore, it is not applicable.
Table 1.
Terminology Explanation
| Type | Terminology | Explanations | |
|---|---|---|---|
| HRV Indicators |
Time Domain | MeanRRI | Mean RRI |
| SDNN | RRI Standard Deviation | ||
| RMSSD | Adjacent RRI | ||
| SDSD | The standard deviation of the difference between adjacent RRI | ||
| NN50 | The number of adjacent RRI that differ by more than 50ms | ||
| Frequency domain | VLFofPower | Power in the very low frequency range | |
| LFofPower | Power in the low frequency range | ||
| HFofPower | Power in the high frequency range | ||
| Non-Linear Indicators |
IE | Information entropy in the RRI | |
| SE | Sample entropy for RRI | ||
| BE | Basic scale entropy of RRI | ||
| GE | Measuring the probability of generating a new subsequence | ||
| SD1 | The length of the semi-minor axis of the scatterplot | ||
| SD2 | The length of the semi-major axis of the scatterplot | ||
| Experimental Terminology | 3bpm | The difference between the output heart rate value of the inspected equipment and the Polar heart rate value should be within +/−3 bpm. | |
| 3bpm accuracy | The sum of all the data points within 3 bpm of the target heart rate across all groups divided by the total number of data points collected across all groups | ||
| GWN | Gaussian white noise | ||
| SNR | Signal-to-noise ratios | ||
| Others | HRV | Heart rate variability | |
| HR | Heart rate | ||
| ECG | Electrocardiogram | ||
| RRI | R-R Interval | ||
| LF | Low frequency | ||
| HF | High frequency | ||
| LF/HF | The ratio of the relative proportion of low frequency to high frequency interval power | ||
| pNN50 | The number of NN50 intervals divided by the total number of RRI | ||
Terminology explanation
All terminology and their explanations used in this article are presented in Table 1.
Application of HRV
Heart rate is a non-invasive and easily collected indicator, commonly obtained through the use of heart rate belts or ECG electrode patch. As such, HRV indicators derived from heart rate data analysis have found extensive application in sports science, medicine, and other relevant fields.
Cardiovascular disease
Coronary heart disease
Coronary heart disease patients exhibit a decrease in HRV, and the extent of this decrease is positively correlated with disease severity. Patients with higher disease severity typically exhibit greater HRV reductions.36 HRV is considered to reflect sympathetic overregulation or parasympathetic underregulation of heart rate and has been identified as a strong mortality predictor in CHD patients.37 Consequently, several studies have attempted to include HRV as a risk factor for coronary heart disease, demonstrating that it significantly improves the predictive value of myocardial ischemia.38
Myocardial infarction
HRV has demonstrated predictive value for the occurrence of malignant ventricular arrhythmias following myocardial infarction and serves as an early warning indicator for mortality risk in affected patients. Specifically, a decrease in HRV after acute myocardial infarction is associated with an increased incidence of malignant ventricular arrhythmias,39 particularly in cases of anterior myocardial infarction where HRV indicators such as ASDNN, RMSSD, SDANN, and SDNN are significantly lower compared to non-anterior myocardial infarction cases.40
Other cardiovascular diseases
Patients with other cardiovascular conditions, such as essential hypertension and arrhythmia, exhibit changes in HRV indicators compared to normal individuals. The extent of these changes is believed to be linked to activity levels within the sympathetic and parasympathetic nervous systems. As a result, HRV has emerged as a valuable predictive and diagnostic tool for these conditions. All in all, HRV indicators are widely used to predict the prognosis of diverse cardiovascular diseases, including mortality risk assessment, high-risk group identification, and prevention of sudden cardiac death.
Measuring stress levels
HRV indicators are utilized to measure stress levels, with the Beefski stress index (SI) being a commonly employed parameter. SI is a geometric HRV measure that reflects the impact of stress on the cardiovascular system. Higher SI values correspond to reduced variability and increased sympathetic cardiac activation rates.
Sports training monitoring
Given the close association between HRV indicators and physical function levels, reduced time-domain (RMSSD, SDNN) and frequency-domain (LF, HF) HRV indicators are observed during exercise-induced fatigue.41 As such, HRV is commonly employed to assess exercise training intensity and load, as well as to monitor for signs of fatigue accumulation resulting from over-exertion.
Other areas
HRV metrics are also utilized in several related fields. For instance, real-time HRV analysis is employed during anesthesia procedures to enable prompt monitoring of drug effects, assessment of anesthesia depth, prediction of cardiovascular instability risk, and prevention of anesthesia accidents.42 Additionally, HRV serves as a monitoring and diagnostic indicator for driver fatigue in the field of vehicle driving.43
Issues with the application of HRV
HRV is a non-invasive and continuous measure that contains a wealth of information, making it a widely used indicator for evaluating physiological functions, particularly those of the autonomic nervous system. HRV has demonstrated positive results in numerous fields, such as medicine and sports science. While its application potential is promising, certain issues must be addressed before it can be more readily applied in practical settings.
Data collection
Collection method
At present, there is no unified standard or requirement for heart rate data collection methods. The two main approaches currently employed include long-term monitoring of continuous 24-h ECG data and short-term monitoring of continuous 5-min ECG data.44 For short-term recordings, frequency-domain analysis is preferred over time-domain analysis, with recording durations recommended to be at least 10 times the wavelength of the low-frequency range under investigation to ensure signal stability. To assess the high-frequency component of HRV, approximately 1 min of recording is required, while approximately 2 min of recording are needed to evaluate the low-frequency component. In order to establish standardized protocols across studies investigating short-term HRV, a systematic 5-min recording approach is recommended.28
Compared to the short-term method, long-term heart rate data collection involves a larger quantity of data, complicated screening and elimination of abnormal data, and challenging analysis and calculation processes. However, it is less susceptible to the influence of abnormal data. The short-term method, on the other hand, features a shorter collection time and simpler data processing, but even a small amount of abnormal data can significantly impact the resulting indicators. Therefore, the selection of an appropriate heart rate data collection method should consider the specific context in which it will be utilized. For extended evaluations of bodily function, the long-term method is preferred, whereas for analyzing data over shorter periods (e.g., during exercise), the short-term method is generally sufficient.
HRV fluctuation
HRV is in a fluctuating state. HRV reflects the working status of autonomic nerves and can be used to track diseases related to autonomic nervous activity, such as coronary heart disease, diabetes, heart failure, and high blood pressure.15,16,17,18,19,20,21,22,23 Changes in HRV may reflect the health status of the human body. However, the change of HRV is greatly affected by the state of daily life. Low HRV may cause stress, mood swings, or poor sleep quality.24,25,26,27 In addition, smoking, alcohol consumption, and some medications may lower HRV. HRV decrement does not mean the occurrence of a certain disease necessarily. The value of HRV will increase through strengthening exercise and ensuring regular work and rest.41,45 Therefore, HRV values tend to be in a fluctuating state causing certain problems when used to measure diseases. It is best to carry out a long-term measurement on the patient during the measurement. If the measurement data continues to decline for a long time, the possibility of illness is extremely high.
Acquisition factors
During HRV data collection, numerous factors may impact the resulting measurements, including body position and breathing rate. Studies have found that HRV is lowest in the supine position and highest in the standing position, with SDNN, RMSSD, NN50, and pNN50 values being higher in the supine position compared to sitting or standing positions. Frequency-domain analysis has revealed a greater LF/HF ratio in the standing position, indicating heightened sympathetic nervous system activity during standing position relative to parasympathetic activity during supine position.46 Additionally, respiration plays a significant role in heart rate oscillations such that changes in respiratory rate can affect HRV measurements. Research has demonstrated that guiding participants to breathe uniformly at a rate of six times per minute, with each breath lasting 10 s, leads to significant increases in time-domain indicators (SDNN, RMSSD, and pNN50) as well as frequency-domain indicators (LF, HF, and LF/HF).45 Therefore, it is best to ensure that patients are measured in a consistent state (e.g., supine resting position) to minimize the influence of these confounding factors.
Equipment used for HRV measurements can also play a significant role in the resulting data. The level of measurement noise can vary between devices, such that even if the same patient is measured at the same time, variations in anti-interference ability may occur due to the manufacturing process or other factors. Currently, there is no standardized method for assessing these differences and accounting for them in HRV analysis.
Individual differences
The difference of HRV value varies across individuals, affected by age, gender, and other factors. Also, the degree of normal and healthy variation is different for each person. A cohort study of 167,548 individuals (aged 6 months to 93 years) concluded that HRV strongly declined with age until approximately 60 and then remained stable.47 As an example, the average RMSSD for people under 20 years of age was 59.6 (SD = 52.9) while it was 22.3(SD = 18.7) for people between 50 and 60 years of age. The study also reported consistently higher HRV in women than men across age groups, with women’s average RMSSD of 30.3(SD = 29.0) and men’s average RMSSD of 26.2 (SD = 25.9).47 Therefore, different people have their own health standards. The determination of the standards of appropriate HRV requires long-term measurement of individuals.
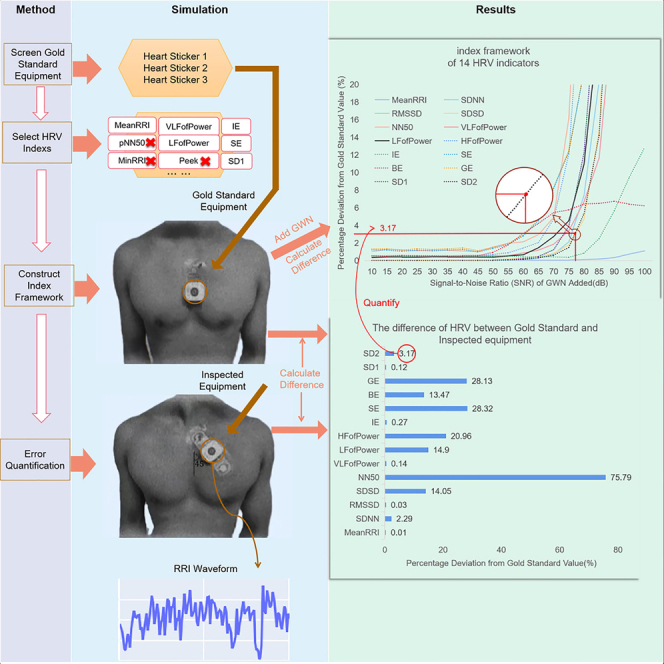
Therefore, the importance of HRV in practical applications is self-evident. Nowadays, there are various types of ECG measurement devices available on the market, but there is no standard for evaluating their measurement accuracy. Based on this, this paper proposes a method for quantifying the measurement error of ECG devices, with the aim of providing a reference for calibrating ECG measurement devices. Figure 1 shows the method framework, which uses Gaussian white noise to simulate measurement noise and quantifies the measurement noise using its signal-to-noise ratio. In order to minimize experimental errors and ensure the reliability of the experiment, we selected 10 volunteers with good health status, similar ages, and balanced gender ratios for signal acquisition in the experiment, as shown in Table 2. In addition, to avoid experimental contingency, we selected three ECG devices as the gold standard, as shown in Figure 1.
Figure 1.

The process of selecting the “gold standard” ECG electrode patches
Table 2.
Demographic characteristics of the experimental participants
| Number | Health status | Age range(mean ± SD) | Gender |
|---|---|---|---|
| 01–10 | healthy population | 28.34 ± 3.18 | 6 females,4males |
Results
Power spectral density analysis
The power spectrum is a critical tool for analyzing the frequency domain distribution of signal power. The three indicators VLFofPower, LFofPower, and HFofPower represented the power spectral density area’s concentration of signals in the very low frequency (0.003–0.04 Hz intercept frequency), low frequency (0.04–0.15 Hz intercept frequency), and high frequency (0.15–0.4 Hz intercept frequency) ranges, respectively. By measuring 30 groups of RRI signals of volunteers with three ECG electrode patches, we were able to obtain HRV values and analyze the concentration areas of ECG signals using these three indicators, as shown in Figure 2. Our results demonstrated that effective signal values obtained from ECG measurement data are primarily concentrated in the extremely low frequency region. Therefore, if a measured device shows significant differences in the VLFofPower index, it indicates low measurement accuracy. Similarly, if the measurement accuracy in the other two frequency bands is low, this suggests weak anti-interference ability, i.e., the noise is mainly present in this frequency band. To evaluate the measurement accuracy of devices under evaluation, we will introduce an evaluation method in the following sections.
Figure 2.

Values of HRV frequency domain indicators of HRVij, which denotes the HRV values measured from the jth ECG electrode patch on the ith volunteer, with a total of 30 data sets shown in the figure
Indicator assessment framework
In our study, we calculated the values of 14 HRV indicators from the obtained 5-min RRI signal. To test the impact of GWN on the HRV indicators, we added GWN with different SNR levels (ranging from 0 dB to 100 dB, in increments of 5 dB) to the original RRI signal and recalculated the values of each indicator with GWN. The specific implementation process is described in method details section.
We constructed an index evaluation framework (Figures 3A–3N)) that represents current industry standards. As we added GWN with varying SNR levels to the RRI signal, we observed a continuous change in the interference to the indicator values, with a general trend of increasing interference as the SNR decreased. To aid in observing the changes in each index value with noise, Figure 4 illustrates the variations in all 14 index values as the noise level increases. From Figures 5A and 5B, it is evident that different indicators exhibit varying sensitivity levels to noise, making it difficult to compare and analyze the various indices using raw data. To address this issue, we normalized the percentage differences in each indicator at each SNR level, enabling us to better analyze each indicator without altering the index framework’s structure. Figure 4 presents the results of this normalization approach using a heatmap.
Figure 3.

Framework and error quantification of 14-indicator
Figure 4.

Heat map of 14-indicator evaluation framework
Figure 5.

The flowchart of the construction process of the index evaluation framework
Based on the 14-indicator evaluation framework, we observed:
The differences in all HRV indicators increased gradually as the SNR decreased, indicating that the indicators were impacted by noise and that they indirectly reflected changes in ECG signals to a certain extent; among the time-domain indicators, MeanRRI exhibited the weakest sensitivity and was less affected by added noise. This is likely due to its representation of the average value of the RR interval, making it less sensitive to changes compared to other time-domain indicators such as standard deviation and variance. On the other hand, frequency domain indicators were found to be more sensitive to noise interference. Additionally, several entropy-based nonlinear indices like IE exhibited low sensitivity to noise, indicating strong anti-interference ability. By utilizing these specific indices, it is possible to preliminarily evaluate whether there are factors beyond noise interference contributing to the measurement error of the evaluated equipment. Therefore, if the measurement error of these particular indicators for the evaluated equipment is large, it may suggest that the source of the error is not solely attributable to noise inside or outside the equipment.
Quantification of inspected equipment’s measurement noise
The quantification results obtained using the approach described in method details section are presented in Figure 3. The measurement data obtained from the inspected equipment and gold standard data exhibited a percentage difference (Figure 6B). The corresponding percentage difference for each index value can be found in the indicator evaluation framework described previously. GWN was utilized to quantify the interference experienced during wearable device measurements, with the corresponding SNR being used as a quantitative measure. Figure 3 displays the quantitative values of differences under the 14 indicators in the indicator frame (a)-(n) using red dots. As ECG equipment is used to measure body health requiring high accuracy, the trend of change in the indicator evaluation framework is not static due to the randomness of GWN and individual indicator specificity. Therefore, it is advisable to set a small SNR level when quantifying the degree of interference experienced by the inspected equipment. This helps ensure accurate evaluation of the measurement precision of the evaluated device. Thus, the SNR of GWN was used to represent the measurement error of each HRV index for the inspected equipment.
Figure 6.

The overall structure of our method
Validation results and analysis of the method
In order to validate the feasibility of the proposed method, we conducted comparative analysis on the quantitative results using box plots. Figure 7 shows the validation results on the SDSD metric.Box plots are commonly used for comparing multiple sets of data. It can be seen that there is a certain difference between the values obtained by the device under test and the “gold standard” device on the 10 volunteers, which is also evident from Fig 6(d). The measurement error of the device under test in the SDSD index can be quantified as approximately 25 dB. To verify the feasibility of this quantification method and the accuracy of the evaluation framework, we added GWN with a SNR of 25 dB to the RRI sequence data measured by the “gold standard” device and obtained the corresponding HRV values. The obtained data was similar to that measured by the device under test, thus demonstrating the reliability of using SNR ratio values to quantify errors and verifying the feasibility and reliability of our proposed method.
Figure 7.

The results of the method validation
GoldData represents the HRV values obtained by the “gold standard” device on the 10 volunteers, TestData represents the HRV values measured by the inspected equipment, and GoldData+25dB represents the HRV values after adding GWN with an SNR of 25 dB to the “gold standard” data.
Frequency domain analysis
The power spectrum provides insight into the frequency distribution of a signal, and in the case of ECG signals, they are predominantly concentrated in the extremely low frequency range (as shown in Figure 2). On the other hand, the error observed in the inspected equipment is mainly concentrated in the high frequency region of 0.15–0.4 Hz (as seen in Figure 6B). Given that the normal breathing rate of humans falls within the range of 0.26–0.33 Hz, it is plausible that this error is caused by interference from breathing patterns, this also indirectly confirms the reliability of the proposed method.
Discussion
Method application
Calibration reference
The fourteen indicators exhibit a consistent trend where the SNR of GWN increases as the difference between the size of the indicators and the size of the gold standard data indicators gradually decreases, as shown in Figure 3. The presence of noise leads to errors in the measurement of wearable devices, which are reflected in various HRV indicators. The proposed industry-level evaluation framework and quantitative model offer a reliable reference for the calibration of industry standard committees. The committee can evaluate the equipment using the indicator evaluation framework. For instance, the SNR value of GWN at the abrupt change in the fourteen indicators can serve as the threshold value, which can be compared with the quantitative values of the 14 indicators of the inspected equipment. If the value is greater than this threshold, the equipment is considered not up to standard. Furthermore, the standards committee can incorporate professional knowledge along with this evaluation framework to establish measurement standards.
Application in clinical settings
Our proposed evaluation framework of 14 indicators and the method to assess the measurement accuracy of equipment under these indicators provide a reliable means of comparing and selecting potential equipment for various disease measurements. For instance, an ECG electrode patch device with accurate SDNN index measurement could potentially be used to predict the survival rate of acute myocardial infarction (AMI) patients. This framework enables healthcare professionals to make informed decisions when choosing suitable equipment for specific medical applications.
Limitations of the study
This article proposes a method for evaluating the accuracy of wearable devices using white noise to simulate the interference that these devices might encounter in real-world scenarios. Some key points to note are:
The “gold standard” device used in this study was selected by screening with the Polar heart rate monitor, which was utilized to verify the feasibility of our proposed method. It is important to note that when selecting a gold standard for practical application, careful consideration must be given to ensure that the selected device is appropriate and accurate for the intended purpose.
This paper presents an evaluation framework for industry-level HRV indicators and a quantitative model of wearable device measurement noise. Based on this framework, we propose a method for judging the suitability of wearable devices for clinical practice. This framework can serve as a calibration reference for industry standards committees and assist in developing more professional and accurate evaluation standards for wearable devices. However, further research is needed to introduce more and representative empirical data to provide more accurate industry standards; if other types of interference more accurately simulate the conditions that wearable devices might encounter in real-world scenarios, they can be added to the RRI signal instead of GWN to improve the accuracy of evaluating wearable devices. By selecting appropriate types of interference, we can further refine the evaluation framework and enhance the reliability of measurements; This article evaluated the accuracy of 14 HRV indicators using the proposed approaches. However, further work is necessary to expand the range of HRV indicators and assess their accuracy using the methods proposed in this paper.
This paper mainly focuses on establishing an evaluation method for ECG electrode patches. However, it is also possible to apply this method in other fields. By exploring the potential applications of this approach in a broader range of fields, we can expand its scope and enhance its practical utility.
STAR★Methods
Key resources table
| REAGENT or RESOURCE | SOURCE | IDENTIFIER |
|---|---|---|
| Software and algorithms | ||
| Python 3.8.5 | Guido van Rossum | https://www.python.org/downloads/windows/ |
| Matlab 2015a | MathWorks | https://pan.baidu.com/s/1qB1mtlBq2Lj3dRSAQ7t0XQ (password: yu5p) |
| Origin 2019 | OriginLab | https://pan.baidu.com/s/19BZ3TpWwmdUzrA7dWUrD5g (password: 9y14) |
| MedCalc | MedCalc Software Ltd | https://www.medcalc.org/ |
| Other | ||
| Sequence data, analyses, and resources to RRI | This paper | https://www.greatteam.org.cn/details.html?id=186 |
Resource availability
Lead contact
Zhiyong Huang, zyhuang@cqu.edu.cn, School of Microelectronics and Communication Engineering, Chongqing University, Chongqing 400044, China.
Materials availability
Materials are available upon request to Dr. Huang at zyhuang@cqu.edu.cn.
Experimental model and subject details
For the ease of experimentation, we utilized 5-minute RRI signals for the trials. To minimize errors resulting from the various factors outlined in Section 1.5 and ensure successful completion of the entire experiment, we carried out preparatory work as follows: a total of 10 volunteers were selected who were in a good state of rest and work, and the basic statistical characteristics of the participants are shown in Table 2;Polar H10 was used as the screening device to select three ECG electrode patch devices (ECG electrode patch 1, ECG electrode patch 2, ECG electrode patch 3) as the 'gold standard' devices; we collected stable 5-minute RRI timing data from the volunteers and calculated the values of 14 HRV indicators in a state of rest. In this paper, 14 linear and nonlinear indicators are used for calculation: MeanRRI, SDNN, RMSSD, SDSD, NN50, VLFofPower, LFofPower, HFofPower, IE, SE, BE, GE, SD1, SD2.
All experiments were completed in MATLAB R2015a platform and Python3.8. The protocol was approved by the Ethics Committee of Shenzhen Institute of Advanced Technology,Chinese Academy of Sciences (SIAT-IRB-210715-H0568).
Method details
Wearable devices are a common method for collecting HRV data, but the measurement is susceptible to various factors that can vary across devices. To address this issue, we propose a novel approach that assesses the degree of variability in HRV indicators obtained via different analysis methods across wearable devices. A comprehensive understanding of the extent to which various HRV indicators may be influenced by these factors is crucial for selecting appropriate indicators in clinical practice.
This paper contributes to the field in several key ways:
-
1.
We propose a quantitative model for assessing the degree of interference associated with wearable devices in exercise scenarios, enabling us to better understand and quantify its impact on HRV measurements.
-
2.
We develop an evaluation framework for HRV indicators that reflects the current industry standard. Through this framework, we analyze the sensitivity of 14 different HRV indicators to noise and other sources of signal interference.
-
3.
We propose a novel reference method for assessing the appropriateness of wearable devices for clinical settings, which can assist practitioners in selecting the most suitable devices for their patients.
To further explain the evaluation method proposed in this paper, we conducted experimental simulations as shown in Figure 6. The entire experiment was conducted indoors under conditions that meet the requirements set forth in GB/T 18883-2020 for temperature, humidity, and air quality limits. Lighting conditions should comply with the illuminance requirements specified by the equipment or system used. Other environmental conditions should also meet the requirements stipulated in GB/T 34311-2017.
Polor H10
Polar has always been at the forefront of heart rate monitor technology with medical-grade accuracy, and is therefore widely used as a comparison standard for various heart rate measurement devices. The Polar H10 was known as the most accurate heart rate sensor ever made, with official proof that its measurement results are nearly identical to those of an electrocardiogram,48 using ECG-based measurement technology with a sampling frequency of 500Hz and a measurement range of 30-240 bpm. This experiment aims to establish an evaluation method that represents the electrocardiogram industry, so we need a "gold standard" device that represents the high level of the electrocardiogram industry. In this experiment, we selected the high-precision Polar H10 as the screening device, using the "3 bpm accuracy" as the screening criterion.
Screen “gold standard” equipment
Multiple sets of experiments were conducted on 10 volunteers using several commercially available ECG electrode patches. During the experiment, each volunteer wore both an ECG electrode patch and a Polar heart rate monitor. The volunteers lifted their arms to a horizontal position and remained still for 30 seconds to 1 minute before observing and recording the heart rate value reported by the devices. With time-axis alignment, the output heart rate values of the ECG electrode patches were compared one by one with those of the Polar device, resulting in n sets of data. The "3 bpm accuracy" between the two values was calculated and expressed as a percentage. The results obtained from the 10 volunteers were averaged to determine the final accuracy of the ECG electrode patches, and only those with an accuracy greater than or equal to 95% were selected as the "gold standard" devices. Figure 1 illustrates the process of selecting the "gold standard" ECG electrode patches.
Construct index framework
During actual measurements, measurement interference or noise can be caused by various factors, such as the ECG equipment and the patient's physical state. The aim of this paper is to assess the interference of various HRV indicators. To achieve this, we formulated an evaluation framework based on a gold standard and analyzed the variation of measurement errors for various HRV indicators under different noise environments. Gaussian white noise (GWN) - which is considered as the time derivative of Brownian motion - is commonly used to simulate interference in wearable devices. GWN is known to be an independent Gaussian distribution process with zero mean and infinite variance at different times.49 It plays a significant role in many applications, from testing communication and control systems to identifying physical and biological systems.50 In our study, we added GWN with different signal-to-noise ratios (SNR) to the RRI gold standard data to simulate interference in wearable devices. We obtained the changes in each HRV index under different SNR levels ranging from 10 dB to 100 dB with 5 dB steps.
The proposed evaluation framework for the ECG electrode patch industry mainly reflects the changes in HRV values measured by "gold standard" devices under different SNR. To obtain a more accurate evaluation framework, we selected three "gold standard" devices and measured them on 10 volunteers to obtain 30 sets of 5-min RRI signals and to avoid errors caused by individual differences. We obtained the change curves of various HRV indices before and after adding GWN with different SNR to each set of data. We then averaged the results and obtained the final evaluation framework for 14 HRV indicators. Note that to avoid random errors, we randomly generated 50 sets of noise signals at each SNR level and added them to each set of RRI signals. The average HRV value was calculated for each set of RRI data at each SNR level. Figure 5 shows the construction process of the evaluation framework for the 14 HRV indicators. A 3D bar chart (Figure 5A) is used to represent the changes in HRV values obtained by adding noise to a set of RRI data and the changes without noise. As the SNR decreases, the changes in HRV values become more apparent. In addition, Figure 5B shows the final evaluation framework for the 14 HRV indicators obtained from the experiment, which also presents the same trend. The formulas for calculating and normalizing the percentage difference are shown as equations (1) and (2), respectively.:
| (1) |
| (2) |
Where X' represents the normalized value, X represents the original value, Xmin represents the minimum value, and Xmax represents the maximum value.
Error quantification
In the process of constructing our model, we developed an index evaluation framework to assess HRV indices and their deviation from the original data. To account for the inherent measurement errors in wearable devices caused by natural factors, we simulated these errors as GWN. By comparing ECG signals for each HRV index against gold standard data, we were able to quantify the measurement error using the corresponding SNR of the GWN. This approach allowed us to accurately measure and evaluate the magnitude of the noise, which is an important factor in assessing HRV indices and their potential impact on clinical outcomes.
In our experiment, we utilized a "gold standard" device to quantify the measurement error of the device under inspection. Both the gold standard device and the device under inspection were used to measure 14 HRV indices on a single participant. The difference percentage between the measurement results obtained by both devices was calculated for each HRV index, and a corresponding point was identified in the framework for that particular index. The SNR value associated with this point was then utilized as the quantification value for the measurement error. Figure 6 illustrates the process of quantifying the inaccurate measurements made by the device under inspection, while Figure 6B provides the percentage difference data obtained from measuring the 14 HRV indices using the device under inspection relative to the gold standard device. For each index, there is a corresponding point in its respective framework that can be used to quantify the measurement error at the same difference percentage. Figure 6A shows the quantification result for the SD2 index.
Quantification and statistical analysis
In order to demonstrate the feasibility of the proposed method, we conducted the following verification steps:
-
1.
We simultaneously obtained 5-min RRI sequences from a “gold standard” device and the the inspected equipment on 10 volunteers, and calculated the corresponding HRV values;
-
2.
In accordance with the evaluation framework shown in Figure 3, we added noise with corresponding SNR value(quantitative value) to the "gold standard" RRI sequences at each corresponding HRV index, for which HRV values were then calculated.
-
3.
We compared the HRV values measured by the inspected device with the "gold standard" HRV values from the 10 volunteers, as well as the HRV values calculated after adding noise under each HRV index.
Figure 7 presents the results obtained using the above method for the SDSD index, where box plots are used for comparison and analysis, verifying the feasibility and reliability of our proposed method.
Acknowledgments
This work is supported by National Key Research and Development Program of China (No. 2020YFC2007200).
Author contributions
XL, DZ, and ZH designed the study, XL, YS, XH, MW, JL, and ZH designed and conducted the experiments, ZR and ZH analyzed data, XL, YS, XH, and ZH wrote the first draft of the manuscript and all authors contributed to multiple versions of the manuscript.
Declaration of interests
The authors declare that they have no known competing financial interests or personal relationships that could have appeared to influence the work reported in this paper.
Inclusion and diversity
We worked to ensure gender balance in the recruitment of human subjects.
Published: October 4, 2023
Data and code availability
Data and code are available upon request to Dr. Huang at zyhuang@cqu.edu.cn.
References
- 1.Wehrwein E.A., Orer H.S., Barman S.M. In: Compr Physiol. 1st ed. Terjung R., editor. Wiley; 2016. Overview of the Anatomy, Physiology, and Pharmacology of the Autonomic Nervous System; pp. 1239–1278. [DOI] [PubMed] [Google Scholar]
- 2.Fujiwara K., Miyatani S., Goda A., Miyajima M., Sasano T., Kano M. Autoencoder-Based Extrasystole Detection and Modification of RRI Data for Precise Heart Rate Variability Analysis. Sensors. 2021;21:3235. doi: 10.3390/s21093235. [DOI] [PMC free article] [PubMed] [Google Scholar]
- 3.Bayevsky R.M., Ivanov G.G., Chireykin L.V., Gavrilushkin A., Dovgalevsky P., Kukushkin U., Fleishmann A. HRV Analysis under the usage of different electrocardiography systems (Methodical recommendations) Committee of Clinic Diagnostic Apparatus and the Committee of New Medical Techniques of Ministry of Health of Russia. 2002;4:2–67. [Google Scholar]
- 4.Dreifus L.S., Agarwal J.B., Botvinick E.H., Ferdinand K.C., Fisch C., Fisher J.D., Kennedy J., Kerber R.E., Lambert C.R., Okike O.N., et al. Heart rate variability for risk stratification of life-threatening arrhythmias. J. Am. Coll. Cardiol. 1993;22:948–950. doi: 10.1016/0735-1097(93)90217-O. [DOI] [PubMed] [Google Scholar]
- 5.Lown B., Verrier R.L., Lown B., Verrier R.L. Neural Activity and Ventricular Fibrillation. N. Engl. J. Med. 1976;294:1165–1170. doi: 10.1056/NEJM197605202942107. [DOI] [PubMed] [Google Scholar]
- 6.Corr P.B. Mechanisms Controlling Cardiac Autonomic Function and Their Relation to arrhythmogenesis. The Heart and Cardiovascular System. 1986 [Google Scholar]
- 7.Schwartz P.J. Sympathetic nervous system and cardiac arrhythmia. Cardiac Electrophysiology from Cell to Bedside. 1990:330–343. [Google Scholar]
- 8.Anderson K.P. Vagal Control of the Heart: Experimental Basis and Clinical Implications. Crit. Care Med. 1995;23:1795–1796. doi: 10.1097/00003246-199510000-00042. [DOI] [Google Scholar]
- 9.Harper R.M., Leake B., Hoppenbrouwers T., Sterman M.B., Mcginty D.J., Hodgman J. Polygraphic Studies of Normal Infants and Infants at Risk for the Sudden Infant Death Syndrome: Heart Rate and Variability as a Function of State. Pediatr. Res. 1978;12:778–785. doi: 10.1203/00006450-197807000-00008. [DOI] [PubMed] [Google Scholar]
- 10.Radouco-Thomas C., Singhal R., Garcin F. Round table on: Research on mental disorders and substance abuse disorders (alcoholism and other pharmacodependences) Prog. Neuro-Psychopharmacol. Biol. Psychiatry. 1982;6:689. doi: 10.1016/S0278-5846(82)80170-X. [DOI] [PubMed] [Google Scholar]
- 11.Rosenstock E., Cassuto Y., Zmora E. Heart rate variability in the neonate and infant: analytical methods, physiological and clinical observations. Acta Paediatr. 2007;88:477–482. doi: 10.1111/j.1651-2227.1999.tb00158.x. [DOI] [PubMed] [Google Scholar]
- 12.Carney R.M., Blumenthal J.A., Stein P.K., Watkins L., Catellier D., Berkman L.F., Czajkowski S.M., O’Connor C., Stone P.H., Freedland K.E. Depression, Heart Rate Variability, and Acute Myocardial Infarction. Circulation. 2001;104:2024–2028. doi: 10.1161/hc4201.097834. [DOI] [PubMed] [Google Scholar]
- 13.Kemp A.H., Quintana D.S. The relationship between mental and physical health: Insights from the study of heart rate variability. Int. J. Psychophysiol. 2013;89:288–296. doi: 10.1016/j.ijpsycho.2013.06.018. [DOI] [PubMed] [Google Scholar]
- 14.Licht C.M.M., de Geus E.J.C., Zitman F.G., Hoogendijk W.J.G., van Dyck R., Penninx B.W.J.H. Association Between Major Depressive Disorder and Heart Rate Variability in the Netherlands Study of Depression and Anxiety (NESDA) Arch. Gen. Psychiatr. 2008;65:1358–1367. doi: 10.1001/archpsyc.65.12.1358. [DOI] [PubMed] [Google Scholar]
- 15.Malpas S.C., Maling T.J. Heart-rate variability and cardiac autonomic function in diabetes. Diabetes. 1990;39:1177–1181. doi: 10.2337/diabetes.39.10.1177. [DOI] [PubMed] [Google Scholar]
- 16.Singh J.P., Larson M.G., O’Donnell C.J., Wilson P.F., Tsuji H., Lloyd-Jones D.M., Levy D. Association of hyperglycemia with reduced heart rate variability (The Framingham Heart Study) Am. J. Cardiol. 2000;86:309–312. doi: 10.1016/S0002-9149(00)00920-6. [DOI] [PubMed] [Google Scholar]
- 17.Liao D., Carnethon M., Evans G.W., Cascio W.E., Heiss G. Lower Heart Rate Variability Is Associated With the Development of Coronary Heart Disease in Individuals With Diabetes. Diabetes. 2002;51:3524–3531. doi: 10.2337/diabetes.51.12.3524. [DOI] [PubMed] [Google Scholar]
- 18.Jandackova V.K., Scholes S., Britton A., Steptoe A. Are Changes in Heart Rate Variability in Middle-Aged and Older People Normative or Caused by Pathological Conditions? Findings From a Large Population-Based Longitudinal Cohort Study. JAHA. 2016;5 doi: 10.1161/JAHA.115.002365. [DOI] [PMC free article] [PubMed] [Google Scholar]
- 19.Soares-Miranda L., Sattelmair J., Chaves P., Duncan G.E., Siscovick D.S., Stein P.K., Mozaffarian D. Physical Activity and Heart Rate Variability in Older Adults: The Cardiovascular Health Study. Circulation. 2014;129:2100–2110. doi: 10.1161/CIRCULATIONAHA.113.005361. [DOI] [PMC free article] [PubMed] [Google Scholar]
- 20.Stein P.K., Barzilay J.I., Chaves P.H.M., Domitrovich P.P., Gottdiener J.S. Heart rate variability and its changes over 5 years in older adults. Age Ageing. 2009;38:212–218. doi: 10.1093/ageing/afn292. [DOI] [PMC free article] [PubMed] [Google Scholar]
- 21.Galetta F., Franzoni F., Prattichizzo F., Rolla M., Santoro G., Pentimone F. Heart rate variability and left ventricular diastolic function in anorexia nervosa. J. Adolesc. Health. 2003;32:416–421. doi: 10.1016/S1054-139X(03)00048-X. [DOI] [PubMed] [Google Scholar]
- 22.Petretta M., Bonaduce D., Scalfi L., de Filippo E., Marciano F., Migaux M.L., Themistoclakis S., Ianniciello A., Contaldo F. Heart rate variability as a measure of autonomic nervous system function in anorexia nervosa. Clin. Cardiol. 1997;20:219–224. doi: 10.1002/clc.4960200307. [DOI] [PMC free article] [PubMed] [Google Scholar]
- 23.Mazurak N., Enck P., Muth E., Teufel M., Zipfel S. Heart rate variability as a measure of cardiac autonomic function in anorexia nervosa: A review of the literature. Eur. Eat Disord. Rev. 2011;19:87–99. doi: 10.1002/erv.1081. [DOI] [PubMed] [Google Scholar]
- 24.Chalmers J.A., Quintana D.S., Abbott M.J.A., Kemp A.H. Anxiety Disorders are Associated with Reduced Heart Rate Variability: A Meta-Analysis. Front. Psychiatr. 2014;5:80. doi: 10.3389/fpsyt.2014.00080. [DOI] [PMC free article] [PubMed] [Google Scholar]
- 25.Cohen H., Benjamin J., Geva A.B., Matar M.A., Kaplan Z., Kotler M. Autonomic dysregulation in panic disorder and in post-traumatic stress disorder: application of power spectrum analysis of heart rate variability at rest and in response to recollection of trauma or panic attacks. Psychiatr. Res. 2000;96:1–13. doi: 10.1016/S0165-1781(00)00195-5. [DOI] [PubMed] [Google Scholar]
- 26.Friedman B.H., Thayer J.F. Autonomic balance revisited: Panic anxiety and heart rate variability. J. Psychosom. Res. 1998;44:133–151. doi: 10.1016/S0022-3999(97)00202-X. [DOI] [PubMed] [Google Scholar]
- 27.Yeragani V.K., Pohl R., Berger R., Balon R., Ramesh C., Glitz D., Srinivasan K., Weinberg P. Decreased heart rate variability in panic disorder patients: A study of power-spectral analysis of heart rate. Psychiatr. Res. 1993;46:89–103. doi: 10.1016/0165-1781(93)90011-5. [DOI] [PubMed] [Google Scholar]
- 28.Malik M. Heart Rate Variability.: Standards of Measurement, Physiological Interpretation, and Clinical Use: Task Force of The European Society of Cardiology and the North American Society for Pacing and Electrophysiology. Ann. Noninvasive Electrocardiol. 1996;1:151–181. doi: 10.1111/j.1542-474X.1996.tb00275.x. [DOI] [Google Scholar]
- 29.Hwang J., Kim J., Choi K.J., Cho M.S., Nam G.B., Kim Y.H. Assessing Accuracy of Wrist-Worn Wearable Devices in Measurement of Paroxysmal Supraventricular Tachycardia Heart Rate. Korean Circ. J. 2019;49:437–445. doi: 10.4070/kcj.2018.0323. [DOI] [PMC free article] [PubMed] [Google Scholar]
- 30.Parak J., Korhonen I. 2014 36th Annual International Conference of the IEEE Engineering in Medicine and Biology Society. IEEE; 2014. Evaluation of wearable consumer heart rate monitors based on photopletysmography; pp. 3670–3673. [DOI] [PubMed] [Google Scholar]
- 31.Kroll R.R., Boyd J.G., Maslove D.M. Accuracy of a Wrist-Worn Wearable Device for Monitoring Heart Rates in Hospital Inpatients: A Prospective Observational Study. J. Med. Internet Res. 2016;18:e253. doi: 10.2196/jmir.6025. [DOI] [PMC free article] [PubMed] [Google Scholar]
- 32.Chakrabarty A., Das N., Das D. In: Advances in Computational Intelligence. Vol 509. Advances in Intelligent Systems and Computing. Sahana S.K., Saha S.K., editors. Springer Singapore; 2017. Assessment of Values of Time-Domain and Frequency-Domain Parameters for ECG Signals Through HRV Analysis Using Symlets for Arrhythmia Prediction; pp. 439–447. [DOI] [Google Scholar]
- 33.Electrophysiology T.F. Heart Rate Variability: Standards of Measurement, Physiological Interpretation, and Clinical Use. Circulation. 1996;93:1043–1065. doi: 10.1161/01.CIR.93.5.1043. [DOI] [PubMed] [Google Scholar]
- 34.Fernandes de Godoy M. Nonlinear Analysis of Heart Rate Variability: A ComprehensiveReview: de Godoy MF et al. Nonlinearity and Heart Rate Variability. J. Cardiol. 2016;3:528–533. doi: 10.17554/j.issn.2309-6861.2016.03.101-4. [DOI] [Google Scholar]
- 35.Lake D.E., Richman J.S., Griffin M.P., Moorman J.R. Sample entropy analysis of neonatal heart rate variability. Am. J. Physiol. Regul. Integr. Comp. Physiol. 2002;283:R789–R797. doi: 10.1152/ajpregu.00069.2002. [DOI] [PubMed] [Google Scholar]
- 36.Janszky I., Ericson M., Lekander M., Blom M., Buhlin K., Georgiades A., Ahnve S. Inflammatory markers and heart rate variability in women with coronary heart disease. J. Intern. Med. 2004;256:421–428. doi: 10.1111/j.1365-2796.2004.01403.x. [DOI] [PubMed] [Google Scholar]
- 37.Taylor C.B. Depression, heart rate related variables and cardiovascular disease. Int. J. Psychophysiol. 2010;78:80–88. doi: 10.1016/j.ijpsycho.2010.04.006. [DOI] [PubMed] [Google Scholar]
- 38.Goldenberg I., Goldkorn R., Shlomo N., Einhorn M., Levitan J., Kuperstein R., Klempfner R., Johnson B. Heart Rate Variability for Risk Assessment of Myocardial Ischemia in Patients Without Known Coronary Artery Disease: The HRV-DETECT (Heart Rate Variability for the Detection of Myocardial Ischemia) Study. JAHA. 2019;8 doi: 10.1161/JAHA.119.014540. [DOI] [PMC free article] [PubMed] [Google Scholar]
- 39.Liu X., Xiang L., Tong G. Predictive values of heart rate variability, deceleration and acceleration capacity of heart rate in post-infarction patients with LVEF ≥35. Ann. Noninvasive Electrocardiol. 2020;25 doi: 10.1111/anec.12771. [DOI] [PMC free article] [PubMed] [Google Scholar]
- 40.Lakusic N., Mahovic D., Kruzliak P., Cerkez Habek J., Novak M., Cerovec D. Changes in Heart Rate Variability after Coronary Artery Bypass Grafting and Clinical Importance of These Findings. BioMed Res. Int. 2015;2015:680515–680517. doi: 10.1155/2015/680515. [DOI] [PMC free article] [PubMed] [Google Scholar]
- 41.Fazackerley L.A., Fell J.W., Kitic C.M. The effect of an ultra-endurance running race on heart rate variability. Eur. J. Appl. Physiol. 2019;119:2001–2009. doi: 10.1007/s00421-019-04187-6. [DOI] [PubMed] [Google Scholar]
- 42.Hasegawa G., Hirata N., Yoshikawa Y., Yamakage M. Differential effects of remimazolam and propofol on heart rate variability during anesthesia induction. J. Anesth. 2022;36:239–245. doi: 10.1007/s00540-022-03037-8. [DOI] [PubMed] [Google Scholar]
- 43.Buendia R., Forcolin F., Karlsson J., Arne Sjöqvist B., Anund A., Candefjord S. Deriving heart rate variability indices from cardiac monitoring—An indicator of driver sleepiness. Traffic Inj. Prev. 2019;20:249–254. doi: 10.1080/15389588.2018.1548766. [DOI] [PubMed] [Google Scholar]
- 44.Germán-Salló Z., Germán-Salló M. Non-linear Methods in HRV Analysis. Procedia Technol. 2016;22:645–651. doi: 10.1016/j.protcy.2016.01.134. [DOI] [Google Scholar]
- 45.Tavares B.S., de Paula Vidigal G., Garner D.M., Raimundo R.D., de Abreu L.C., Valenti V.E. Effects of guided breath exercise on complex behaviour of heart rate dynamics. Clin. Physiol. Funct. Imag. 2017;37:622–629. doi: 10.1111/cpf.12347. [DOI] [PubMed] [Google Scholar]
- 46.Schmitt L., Regnard J., Millet G.P. Monitoring Fatigue Status with HRV Measures in Elite Athletes: An Avenue Beyond RMSSD? Front. Physiol. 2015;6:343. doi: 10.3389/fphys.2015.00343. [DOI] [PMC free article] [PubMed] [Google Scholar]
- 47.Tegegne B.S., Man T., van Roon A.M., Riese H., Snieder H. Determinants of heart rate variability in the general population: The Lifelines Cohort Study. Heart Rhythm. 2018;15:1552–1558. doi: 10.1016/j.hrthm.2018.05.006. [DOI] [PubMed] [Google Scholar]
- 48.Polar H10 - the King in Heart Rate Monitors. 2021. http://www.zhihu.com/tardis/bd/art/339437314?source_id=1001 [Google Scholar]
- 49.Surantha N., Lesmana T.F., Isa S.M. Sleep stage classification using extreme learning machine and particle swarm optimization for healthcare big data. J. Big Data. 2021;8:14. doi: 10.1186/s40537-020-00406-6. [DOI] [Google Scholar]
- 50.Suryawan H.P. 2016. Gaussian White Noise Analysis and its Application to Feynman Path Integral; p. 030001. [DOI] [Google Scholar]
Associated Data
This section collects any data citations, data availability statements, or supplementary materials included in this article.
Data Availability Statement
Data and code are available upon request to Dr. Huang at zyhuang@cqu.edu.cn.