

Abstract
Background
Malaria, a major cause of mortality worldwide is linked to a web of determinants ranging from individual to contextual factors. This calls for examining the magnitude of the effect of clustering within malaria data. Regrettably, researchers usually ignore cluster variation on the risk of malaria and also apply final survey weights in multilevel modelling instead of multilevel weights. This most likely produces biased estimates, misleads inference and lowers study power. The objective of this study was to determine the complete sources of cluster variation on the risk of under-five malaria and risk factors associated with under-five malaria in Uganda.
Methods
This study applied a multilevel-weighted mixed effects logistic regression model to account for both individual and contextual factors.
Results
Every additional year in a child’s age was positively associated with malaria infection (AOR = 1.42; 95% CI 1.33–1.52). Children whose mothers had at least a secondary school education were less likely to suffer from malaria infection (AOR = 0.53; 95% CI 0.30–0.95) as well as those who dwelled in households in the two highest wealth quintiles (AOR = 0.42; 95% CI 0.27–0.64). An increase in altitude by 1 m was negatively associated with malaria infection (AOR = 0.98; 95% CI 0.97–0.99). About 77% of the total variation in the positive testing for malaria was attributable to differences between enumeration areas (ICC = 0.77; p < 0.001).
Conclusions
Interventions towards reducing the burden of under-five malaria should be prioritized to improve individual-level characteristics compared to household-level features. Enumeration area (EA) specific interventions may be more effective compared to household specific interventions.
Keywords: Cluster variation, Mixed-effects model, Multi-level weighting, Under-five malaria, Uganda
Background
Malaria, a major cause of mortality worldwide [1] is caused by protozoa of the genus Plasmodium [2]. Within the two years of the start of COVID-19 pandemic, malaria endemic countries, Uganda inclusive, reported more than 101 million cases [3]. Uganda emerges as one of the six countries that account for more than half of all malaria cases worldwide [4] where children under five years of age are the most vulnerable group [5].
Malaria is linked to a web of determinants ranging from individual to contextual [6–9]. Hence, it’s vital to take advantage of the opportunity provided by malaria data, to critically examine the magnitude of the effect of clustering of data points [10].
Issues that researchers usually overlook while modelling multilevel data based on complex survey design are; use of final survey weights (single level weights that are only appropriate for single level analysis) instead of multilevel weights or level-specific weights [11] and ignoring cluster variation on the risk of study outcomes/diseases [12]. This most likely produces biased estimates, misleads inference and lowers study power. Besides, it is critical to consider several metrics like ICC as it was the case of this study, to identify risk factors of disease and derive appropriate public health interventions while analysing data from multilevel study designs [13]. Failure to do so can lead to inappropriate interventions for prevention and control of diseases like malaria and associated adverse consequences. Although some studies based on a multilevel design have adjusted for clustering in the data, a number of them have not considered determining the complete sources of cluster variation on malaria which may be an important statistic to guide critical levels of public health interventions and future study designs [14, 15].
The objective of this study was, therefore, to determine the complete source of cluster variation on the risk of malaria, and to identify risk factors associated with under-five malaria in Uganda.
Methods
Data source and study population
This study made use of secondary data based on a two-stage cluster and stratified sampling technique from the Uganda Malaria Indicator Survey (UMIS) of 2018/19. The first stage of sampling involved selecting sample points (clusters) from the sampling frames. A total of 320 clusters were selected with probability proportional to size from the enumeration areas (EAs) covered in the 2014 National Population and Housing Census (NPHC). The second stage of sampling involved systematic selection of households. Twenty-eight households were selected from each EA, for a total sample size of 8,878 households. The primary objective of the 2018–19 UMIS is to provide up-to-date estimates of basic demographic and health indicators related to malaria. Specifically, the 2018/19 UMIS collected information on vector control interventions such as mosquito nets and indoor residual spraying of insecticides, on intermittent preventive treatment of malaria in pregnant women, on care-seeking and treatment of fever in children, and malaria knowledge, behaviour, and practices. All women age 15–49 who were either permanent residents of the selected households or visitors who stayed in the household the night before the survey were eligible to be interviewed. After a parent’s or guardian’s consent was obtained, children age 0–59 months were tested for anaemia and malaria infection. The study population consisted of 7,632 children less than 5 years of age who were tested for anaemia and malaria infection by a team of two health technicians, respectively [16]. The selection of the final study sample is as shown in Fig. 1.
Fig. 1.

Flow chart showing selection of the study participants
Analysis model
The dataset was first explored for preparation purposes. Before any analysis was conducted, the data were sorted, some variables recoded while other variables and some observations that were not of interest to the research problem were eliminated. Categorical variables were represented as counts and percentages. Collinearity was assessed among independent variables using a correlation matrix. Variables with correlation coefficient of 0.4 and above were not included in the same model. The survey design estimation command (svy) in Stata 15.0 (StataCorp, College Station, TX) was used to conduct descriptive analysis, accounting for the level weights. The level of statistical significance was p < 0.05 for all analyses. Overall, four multivariable models were considered; the first model neither adjusted for weighting nor cluster variation in the risk of under-five malaria; the second model only adjusted for cluster variation; the third model only adjusted for weighting; and the forth model adjusted for both weighting and cluster variation. A model was, therefore, considered to best fit the data if it had lower design factor (deft) values in general. Lower deft values are associated with lower loss of precision of model estimates [17]. The design factor (deft) was calculated as follows:
where; is the design effect. is the intra-class correlation for the variable in question. is the size of the cluster.
To assess the association between malaria infection in under-five children and individual, household, and enumeration area factors, a multilevel-weighted mixed effects logistic regression model (chosen among the four compared models as the best model) was specified to account for contextual within-household and within-EA correlations [18–20]. The model is represented as below:
where; is the natural logarithm. is the probability of testing positive for malaria for the ith under 5-year-old child in household and EA .
is the mean log-odds of malaria across household and EA.
is a level 1 covariate for the ith child in household and EA .
represents the slope associated with which represents the relationship between the level 1 covariates and the log-odds of malaria.
is the random effect for EA .
is the household random effect.
Bivariate multilevel weighted-mixed effects logistic regression was conducted, using each of the individual, household, and community level risk factors as predictors and malaria test result as the outcome. Individual predictors with p < 0.20 were considered for inclusion in the multivariable multilevel logistic regression models. The multivariable analysis was conducted in a sequential process resulting into several models. Model 0 (the null model) was fitted to decompose the total variance of malaria risk between the cluster and level-1 covariates. It only included the random intercept to assess EA and household contribution to malaria risk before adding explanatory variables. The null model established the degree of variance at the cluster level in order to validate the use of multilevel modeling. Model 1 contains individual (level-1) variables; model 2 has household (level-2) variables in addition to variables in model 1; model 3 includes EA (level-3) variables in addition to variables in model 2. Model 3 was selected as the final model that was used to identify factors associated with malaria risk in under-five children since it was the most complete among the three models. To measure the extent to which individuals within the same group are more similar to each other than they are to individuals in different groups, intra-class correlation coefficient (ICC) was used [21]. A higher proportion of the ICC was linked to a higher general contextual effect [22]. The formula for the ICC is presented as below:
where is the cluster or area level variance and is a scalar that corresponds to the individual level variance. When the contribution to the overall ICC of a level(s) was very low (< 10%) its effect was considered insignificant and hence, the random effects component(s) at the specific level(s) was considered insignificant.
Weighting
Since the sample for this study is a two-stage stratified cluster sample, level weights were calculated separately, based on sampling probabilities for each sampling stage and cluster. In this study, level weights were estimated using a framework for approximating level weights in Malaria Indicator Surveys (MIS) proposed by the Demographic Health Survey program [11]. The framework required data that is included in the publicly available UMIS datasets and final report.
Results
Characteristics of children aged 0–59 months
Overall, children were evenly distributed by sex. On average, children were aged 29.2 (SD = 17.3) months. Slightly more children were anaemic 3939 (51.6%). A higher proportion of households were headed by males 5478 (71.8%) and in the two lowest wealth quintiles 4,385 (57.5%) with at least five members 5880 (77.1%). Most households did not have electricity 4921 (64.5%), had at least one bed net 6666 (87.4%), but had not sprayed their dwellings within the last 12 months of the survey 6601 (86.5%) and were in rural areas 5516 (72.3%). Finally, most mothers had attained at least primary level of education 5002 (78.7%). The rest of the results are presented in Table 1.
Table 1.
Distribution of under-five children by selected background characteristics
| Background characteristics | Category | Count | Percent |
|---|---|---|---|
| Sex of child | Male | 3,870 | 50.7 |
| Female | 3,762 | 49.3 | |
| Age of child | < 1 | 1,502 | 19.7 |
| 1 | 1,441 | 18.9 | |
| 2 | 1,502 | 19.7 | |
| 3 | 1,608 | 21.1 | |
| 4 | 1,579 | 20.7 | |
| Anaemia status | Not anaemic | 3,691 | 48.4 |
| Anaemic | 3,939 | 51.6 | |
| Sex of HH head | Male | 5,478 | 71.8 |
| Female | 2,152 | 28.2 | |
| Wealth index | Poor | 4,385 | 57.5 |
| Middle | 1,227 | 16.1 | |
| Rich | 2,018 | 26.5 | |
| Has electricity | No | 4,921 | 64.5 |
| Yes | 2,709 | 35.5 | |
| Has bed net | No | 964 | 12.6 |
| Yes | 6,666 | 87.4 | |
| HH size | Below 5 | 1,750 | 22.9 |
| 5 & above | 5,880 | 77.1 | |
| Residence | Urban | 1,453 | 19.0 |
| Rural | 5,516 | 72.3 | |
| Refugee | 661 | 8.7 | |
| HH sprayed | No | 6,601 | 86.5 |
| Yes | 989 | 13.0 | |
| Don’t know | 40 | 0.5 | |
| Mother’s education | No education | 1,354 | 21.3 |
| Primary | 3,647 | 57.4 | |
| Secondary & above | 1,355 | 21.3 |
Regional variation in prevalence of malaria among the under-five children
Malaria prevalence showed great variability across regions. Of the 15 statistical regions in Uganda, five of them had malaria prevalence above the national average of 21.1%. Prevalence was highest in the West Nile region (42.6%), followed by Karamoja region (41.5%), Busoga region (39.3%), Acholi region (31.7%) and Lango region (22.7%) as shown in Fig. 2.
Fig. 2.
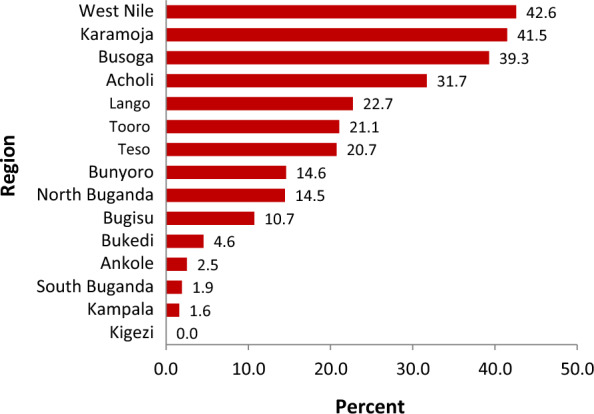
Weighted regional ranking of prevalence of under-five malaria
Factors associated with malaria risk in under-five children
Table 2 shows results of the multivariable multilevel-weighted mixed effects logistic regression modelling at various levels. It is by this model that risk factors of under-five malaria were determined. At the individual level, every additional year in a child’s age was associated with 42% higher odds of malaria infection (AOR = 1.42; 95% CI 1.33–1.52). Also, children whose mothers had at least a secondary school education had about 47% lower odds of malaria infection compared to those whose mothers were uneducated (AOR = 0.53; 95% CI 0.30–0.95).
Table 2.
Factors associated with prevalence and risk of malaria in under-five children
| Variable | Model 1 (Individual level) | Model 2 (HH level) | Model 3 (EA level) | ||||||
|---|---|---|---|---|---|---|---|---|---|
| AOR | (95% CI) | AOR | (95% CI) | AOR | (95% CI) | ||||
| Sex of child | |||||||||
| Female | 1.02 | 0.83 | 1.24 | 1.00 | 0.82 | 1.22 | 0.98 | 0.80 | 1.21 |
| Age of child | 1.40** | 1.31 | 1.50 | 1.41** | 1.32 | 1.51 | 1.42** | 1.33 | 1.52 |
| Mother's education | |||||||||
| Primary | 0.93 | 0.67 | 1.28 | 0.94 | 0.67 | 1.30 | 0.94 | 0.66 | 1.33 |
| Secondary and above | 0.50* | 0.29 | 0.86 | 0.59* | 0.33 | 1.02 | 0.53* | 0.30 | 0.95 |
| Has bed net | |||||||||
| Yes | 0.81 | 0.60 | 1.09 | 0.82 | 0.60 | 1.11 | 0.77 | 0.56 | 1.06 |
| Wealth Index | |||||||||
| Middle | – | – | – | 1.00 | 0.68 | 1.46 | 1.03 | 0.70 | 1.52 |
| Rich | – | – | – | 0.41** | 0.27 | 0.62 | 0.42** | 0.27 | 0.64 |
| HH sprayed | |||||||||
| Yes | – | – | – | 1.07 | 0.55 | 2.09 | 1.05 | 0.53 | 2.08 |
| Don’t know | – | – | – | 1.38 | 0.40 | 4.70 | 1.37 | 0.42 | 4.42 |
| Cluster altitude | – | – | – | – | – | – | 0.98** | 0.97 | 0.99 |
AOR: Adjusted odds ratio, CI: Confidence interval, EA: Enumeration area, HH: Household
**p < 0.001, *p < 0.05
At household level, children who dwelled in households in the two highest wealth quintiles had lower odds of malaria infection compared to those in the two lowest wealth quintiles (AOR = 0.42; 95% CI 0.27–0.64). At enumeration area level, an increase in altitude by 1 m was associated with slightly lower odds of under-five malaria infection (AOR = 0.98; 95% CI 0.97–0.99).
The ‘sex of child’ variable was maintained in the final model regardless of its statistical insignificance because of its biological importance. Variables ‘has bed net’ and ‘HH sprayed’ were maintained because of their relational importance to the research problem, according to previous research literature.
Measure of sources of cluster variation in the risk of malaria
Figure 3 shows the proportional contribution of ICC across levels of the nested data and the error term. This informed the choice of the random effect term that was included in the mixed effects models. That is, EA.
Fig. 3.
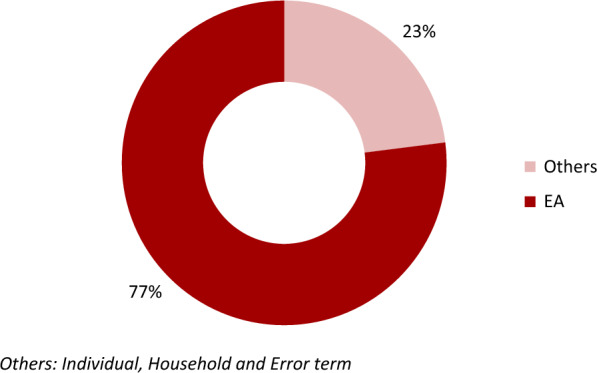
Proportional contribution of ICC by the hierarchical levels of the data
The EA random effect estimate for measuring variation in Table 3 shows significant variation in under-five risk of malaria. The random effect of Model-0 (null model) shows that there was statistically significant variation in the odds of a positive test for malaria across EAs (variance = 11.16; 95% CI 8.55–14.56). The ICC value for a positive malaria test between EAs (ICC = 0.77; p < 0.001) indicates that 77% of the total variance in the positive testing for malaria was attributable to differences between EAs. Hence variation in the risk of under-five malaria was mainly attributed to EAs compared to households. In addition, moving from Model-0 to Model-3, area variance reduced by 29.6% (from 11.16 to 7.86). Area variance steadily reduced as more fixed effects were added into the model. The percentage reduction in area variance in each model equates the percent of variance contributed by fixed effects at the specific level.
Table 3.
Measures of EA level variations in the risk of under-five malaria
| Random effects | Model-0 | Model-1 | Model-2 | Model-3 |
|---|---|---|---|---|
| Estimate (95% CI) | Estimate (95% CI) | Estimate (95% CI) | Estimate (95% CI) | |
| Area variance | 11.16** | 11.56** | 10.66** | 7.86** |
| (8.55–14.56) | (8.74–15.27) | (8.02–14.17) | (5.82–10.61) | |
| ICC | 0.77** | 0.44** | 0.29** | 0.18** |
CI: Confidence interval, ICC Intra-class correlation coefficient
**p < 0.001
Moreover, the variation across EAs remained statistically significant throughout the three models (1, 2, and 3). The ICC values showed heterogeneity between EAs. The ICC values in models 1, 2 and 3 indicate that; 44% was attributable to EAs differences after adjusting for individual factors, 29% after adjusting for household factors and 18% after adjusting for EA factors as indicated in Table 3.
Discussion
Identifying risk factors of malaria is critical in designing interventions and evaluating existing ones. This study did not find any sex difference among children under-five years of age with malaria. These results are consistent with similar studies based on multilevel analysis in Ethiopia [23] and Nigeria [24]. In addition, according to this study’s findings, children with educated mothers were less likely to have malaria compared to those whose mothers were uneducated. These results are similar to previous findings where prevalence of under-five malaria drastically decreases with increase in a mother’s education [25] since education has previously been associated with use of malaria prevention measures like mosquito nets [16] as educated mothers are more prone to using these preventive measures.
At the household level, wealth index was significantly associated with malaria parasitemia. These finding are in agreement with previous studies [25, 26]. This is partly due to the fact that a household’s economic status that can be represented by wealth index affects other factors like housing conditions which in turn have an effect on malaria prevalence in the affected households [16]. Also, the nature of residence like in this study, has been found to be significantly associated with under-five malaria infection like it is the case with other studies [26, 27].
Determining sources of cluster variation is important in designing future study designs and identifying effective and efficient levels at which interventions should be designed. The study presented a significantly higher ICC at EA level compared to other levels. Computing the ICC to estimate power and sample sizes is problematic given the difficulty in estimating variances a priori. Therefore, the ICC is typically estimated using the values reported in previous research [28]. Hence the calculated ICC and deft from this study can be used in computation of power and effective sample size in future studies of MIS and other similar surveys based on complex designs like Demographic and Health Survey (DHS), Multiple Indicator Cluster Survey (MICS) and Performance Monitoring for Action (PMA) surveys.
Ideally, more units should be samples at EA level compared to household level for future designs of studies based of multi-stage (specifically two-stage) sampling since ICC at EA level was higher than that at household level. These results are consistent with a study [28] that found out that as a general rule of thumb, increasing the sample size at the highest level that is, sampling more groups will do more to increase power than increasing the number of individuals in the groups. However, the problem is that increasing sample size at higher levels is more difficult and costly than increasing the sample within each group. Thus, the increases in study power may come at a substantial cost.
ICC is used in equations along with the cluster size and the number of clusters to calculate the effective sample size (ESS) which is the sample size in clustered samples as compared with the number of subjects actually enrolled in the study. As an example, proper accounting for correlation among subjects in a cluster almost always results in a net loss of power, requiring increased total subject recruitment. Increasing the number of clusters enhances power more efficiently than does increasing the number of subjects within a cluster [29].
In addition, ICC guides level-based interventions. The higher this proportion, the higher is the general contextual effect [22]. As an example, when the ICC value is lower at a specific level, then interventions need not to be done at that level but at a level where ICC is higher as it is the case of the study findings. High values of ICC therefore inform intervention to be done at specific levels [30]. This study similarly suggested interventions based at a level with higher ICC value. Instead of household-specific interventions, this study recommends EA-specific interventions.
Study strength and limitations
The multilevel design of the MIS that allows contextual analysis was the strength of this study. The limitations were parasitaemia was diagnosed using rapid diagnostic test (RDT) which is not the gold standard. However, both microscopy (gold standard) and RDT have always yielded very close results. Also, given that the data resulted from a cross-sectional design, causal relationship between explanatory variables and under-five parasitaemia could not be guaranteed. This was a drawback concerning the prediction capability of the final model. Also, although some variables deemed important in analysis were not among the collected data, the variables available in the data were sufficient to address the study objective. Another limitation was potential recall bias because household and children characteristics were purely based on self-report by survey respondents. The potential bias was however minimal since response was only required about events from the most recent past and by eligible respondents.
Conclusions
Individual or child characteristics were more significantly associated to malaria risk compared to household and EA characteristics. Even after accounting for individual, household and EA level fixed effects; variation remained significant at EA level hence, cluster variation was substantial at EA level. Interventions towards reducing the burden of under-five malaria should be prioritized to improve individual-level characteristics compared to household-level features. This is because more variables were significant at child-level compared to household-level. Also, EA-specific interventions towards malaria control may be more effective compared to household level interventions.
Acknowledgements
The authors would like to thank the Demographic Health Survey (DHS) Program for providing access to their dataset.
Abbreviations
- AAS
Academy of Sciences Alliance
- AESA
Accelerating Excellence in Science in Africa
- AOR
Adjusted odds ratio
- CI
Confidence interval
- COVID-19
Coronavirus disease of 2019
- deff
Design effect
- deft
Design factor
- DELTAS
Developing Excellence in Leadership, Training and Science
- DHS
Demographic and Health Survey
- EA
Enumeration area
- ESS
Effective sample size
- HH
Household
- ICC
Intraclass Correlation Coefficient
- ICF
Inner City Fund
- MICS
Multiple Indicator Cluster Survey
- MIS
Malaria Indicator Surveys
- NEPAD
New Partnership for Africa’s Development Planning and Coordinating
- NMCD
National Malaria Control Division
- NPHC
National Population and Housing Census
- PMA
Performance Monitoring for Action
- RDT
Rapid diagnostic test
- SD
Standard deviation
- SSACAB
Sub-Saharan African Consortium for Advanced Biostatistics
- TX
Texas
- UBOS
Uganda Bureau of Statistics
- UK
United Kingdom
- UMIS
Uganda Malaria Indicator Survey
- WHO
World Health Organization
Author contributions
CN–Conceptualized the manuscript, analysed the results and wrote the initial draft of the manuscript. FM and ADM–Conceptualized the methods and analysis. JMS–Provided extensive inputs.
Funding
This work was supported through the DELTAS Africa Initiative Grant No. 107754/Z/15/Z-DELTAS Africa SSACAB. The DELTAS Africa Initiative is an independent funding scheme of the African Academy of Sciences (AAS)’s Alliance for Accelerating Excellence in Science in Africa (AESA) and supported by the New Partnership for Africa’s Development Planning and Coordinating Agency (NEPAD Agency) with funding from the Wellcome Trust (Grant No. 107754/Z/15/Z) and the UK government. The views expressed in this publication are those of the author(s) and not necessarily those of AAS, NEPAD Agency, Wellcome Trust or the UK government.
Availability of data and materials
The datasets analysed during the current study are publicly available in the Demographic Health Survey repository, https://dhsprogram.com/data/dataset/Uganda_MIS_2018.cfm.
Declarations
Ethics approval and concert for participate
Ethics approval was not required since secondary data were analysed which are non-identifiable publicly available data. The UMIS data were non-identifiable and treated without making any effort to identify any individual woman interviewed in the survey. The author confirms that all methods were carried out in accordance with relevant guidelines and regulations.
Consent for publication
Not applicable.
Competing interests
The authors declare no competing interests.
Footnotes
Publisher's Note
Springer Nature remains neutral with regard to jurisdictional claims in published maps and institutional affiliations.
References
- 1.Talapko J, Škrlec I, Alebić T, Jukić M, Včev A. Malaria: The Past and the Present. Microorganisms. 2019;7:179. doi: 10.3390/microorganisms7060179. [DOI] [PMC free article] [PubMed] [Google Scholar]
- 2.Crutcher JM, Hoffman SL. Malaria. In: Baron S, editor. Medical Microbiology. 4th edn. Galveston (TX): University of Texas Medical Branch at Galveston; 1996. Chapter 83. [PubMed]
- 3.WHO. World malaria report 2021. Geneva, World Health Organization, 2021. https://www.who.int/teams/global-malaria-programme/reports/world-malaria-report-2021. Accessed 15 Jan 2022.
- 4.WHO. World malaria report 2019. Geneva, World Health Organization, 2019. https://www.who.int/teams/global-malaria-programme/reports/world-malaria-report-2019. Accessed 20 Jan 2022.
- 5.Mpimbaza A, Walemwa R, Kapisi J, Sserwanga A, Namuganga JF, Kisambara Y, et al. The age-specific incidence of hospitalized paediatric malaria in Uganda. BMC Infect Dis. 2020;20:503. doi: 10.1186/s12879-020-05215-z. [DOI] [PMC free article] [PubMed] [Google Scholar]
- 6.Afoakwah C, Deng X, Onur I. Malaria infection among children under-five: the use of large-scale interventions in Ghana. BMC Public Health. 2018;18:536. doi: 10.1186/s12889-018-5428-3. [DOI] [PMC free article] [PubMed] [Google Scholar]
- 7.Chilanga E, Collin-Vézina D, MacIntosh H, Mitchell C, Cheney K. Prevalence and determinants of malaria infection among children of local farmers in Central Malawi. Malar J. 2020;19:308. doi: 10.1186/s12936-020-03382-7. [DOI] [PMC free article] [PubMed] [Google Scholar]
- 8.Endo N, Eltahir EAB. Environmental determinants of malaria transmission in African villages. Malar J. 2016;15:578. doi: 10.1186/s12936-016-1633-7. [DOI] [PMC free article] [PubMed] [Google Scholar]
- 9.Guerra M, de Sousa B, Ndong-Mabale N, Berzosa P, Arez AP. Malaria determining risk factors at the household level in two rural villages of mainland Equatorial Guinea. Malar J. 2018;17:203. doi: 10.1186/s12936-018-2354-x. [DOI] [PMC free article] [PubMed] [Google Scholar]
- 10.Heisig JP, Schaeffer M, Giesecke J. The costs of simplicity: why multilevel models may benefit from accounting for cross-cluster differences in the effects of controls. Am Soc Rev. 2017;82:796–827. doi: 10.1177/0003122417717901. [DOI] [Google Scholar]
- 11.Elkasabi M, Ren R, Pullum TW. Multilevel modeling using DHS surveys: a framework to approximate level-weights - DHS Methodological Reports 27. 2020. https://dhsprogram.com/pubs/pdf/MR27/MR27.pdf. Accessed 20 Sep 2021.
- 12.Aalen OO, Valberg M, Grotmol T, Tretli S. Understanding variation in disease risk: the elusive concept of frailty. Int J Epidemiol. 2015;44:1408–1421. doi: 10.1093/ije/dyu192. [DOI] [PMC free article] [PubMed] [Google Scholar]
- 13.Aarts E, Verhage M, Veenvliet JV, Dolan CV, van der Sluis S. A solution to dependency: using multilevel analysis to accommodate nested data. Nat Neurosci. 2014;17:491–496. doi: 10.1038/nn.3648. [DOI] [PubMed] [Google Scholar]
- 14.Hansen MH, Hurwitz WN. The problem of non-response in sample surveys. J Am Stat Assoc. 1946;41:517–529. doi: 10.1080/01621459.1946.10501894. [DOI] [PubMed] [Google Scholar]
- 15.Roberts D, Matthews G. Risk factors of malaria in children under the age of five years old in Uganda. Malar J. 2016;15:246. doi: 10.1186/s12936-016-1290-x. [DOI] [PMC free article] [PubMed] [Google Scholar]
- 16.NMCD, UBOS, ICF. Uganda Malaria Indicator Survey 2018. Kampala, Uganda, Rockville, USA. 2020. https://dhsprogram.com/pubs/pdf/ATR21/ATR21.pdf. Accessed 10 Oct 2021.
- 17.Sturgis P. Analysing complex survey data: clustering, stratification and weights. Social Research Update, University of Surrey, Issue 43. 2004. https://sru.soc.surrey.ac.uk/SRU43.html (2004). Accessed 22 Feb 2020.
- 18.Adam NS, Twabi HS, Manda SO. A simulation study for evaluating the performance of clustering measures in multilevel logistic regression. BMC Med Res Methodol. 2021;21:245. doi: 10.1186/s12874-021-01417-4. [DOI] [PMC free article] [PubMed] [Google Scholar]
- 19.Lucas SR. An inconvenient dataset: bias and inappropriate inference with the multilevel model. Qual Quant. 2014;48:1619–1649. doi: 10.1007/s11135-013-9865-x. [DOI] [PMC free article] [PubMed] [Google Scholar]
- 20.Speidel M, Drechsler J, Sakshaug JW. Biases in multilevel analyses caused by cluster-specific fixed-effects imputation. Behav Res. 2018;50:1824–1840. doi: 10.3758/s13428-017-0951-1. [DOI] [PubMed] [Google Scholar]
- 21.Merlo J, Chaix B, Yang M, Lynch J, Råstam L. A brief conceptual tutorial of multilevel analysis in social epidemiology: linking the statistical concept of clustering to the idea of contextual phenomenon. J Epidemiol Community Health. 2005;59:443–449. doi: 10.1136/jech.2004.023473. [DOI] [PMC free article] [PubMed] [Google Scholar]
- 22.Austin PC, Merlo J. Intermediate and advanced topics in multilevel logistic regression analysis. Stat Med. 2017;36:3257–3277. doi: 10.1002/sim.7336. [DOI] [PMC free article] [PubMed] [Google Scholar]
- 23.Zewude BT, Debusho LK, Diriba TA. Multilevel logistic regression modelling to quantify variation in malaria prevalence in Ethiopia. PLoS ONE. 2022;17:e0273147. doi: 10.1371/journal.pone.0273147. [DOI] [PMC free article] [PubMed] [Google Scholar]
- 24.Ugwu CLJ, Zewotir TT. Using mixed effects logistic regression models for complex survey data on malaria rapid diagnostic test results. Malar J. 2018;17:453. doi: 10.1186/s12936-018-2604-y. [DOI] [PMC free article] [PubMed] [Google Scholar]
- 25.Ssempiira J, Nambuusi B, Kissa J, Agaba B, Makumbi F, Kasasa S, et al. Geostatistical modelling of malaria indicator survey data to assess the effects of interventions on the geographical distribution of malaria prevalence in children less than 5 years in Uganda. PLoS ONE. 2017;12:e0174948. doi: 10.1371/journal.pone.0174948. [DOI] [PMC free article] [PubMed] [Google Scholar]
- 26.Shayo FK, Nakamura K, Al-Sobaihi S, Seino K. Is the source of domestic water associated with the risk of malaria infection? Spatial variability and a mixed-effects multilevel analysis. Int J Infect Dis. 2021;104:224–231. doi: 10.1016/j.ijid.2020.12.062. [DOI] [PubMed] [Google Scholar]
- 27.Yusuf OB, Adeoye BW, Oladepo OO, Peters DH, Bishai D. Poverty and fever vulnerability in Nigeria: a multilevel analysis. Malar J. 2010;9:235. doi: 10.1186/1475-2875-9-235. [DOI] [PMC free article] [PubMed] [Google Scholar]
- 28.Scherbaum CA, Ferreter JM. Estimating statistical power and required sample sizes for organizational research using multilevel modeling. Organ Res Methods. 2009;12:347–367. doi: 10.1177/1094428107308906. [DOI] [Google Scholar]
- 29.Killip S, Mahfoud Z, Pearce K. What is an intracluster correlation coefficient? Crucial concepts for primary care researchers. Ann Fam Med. 2004;2:204–208. doi: 10.1370/afm.141. [DOI] [PMC free article] [PubMed] [Google Scholar]
- 30.Ngnie-Teta I, Receveur O, Kuate-Defo B. Risk factors for moderate to severe anemia among children in Benin and Mali: insights from a multilevel analysis. Food Nutr Bull. 2007;28:76–89. doi: 10.1177/156482650702800109. [DOI] [PubMed] [Google Scholar]
Associated Data
This section collects any data citations, data availability statements, or supplementary materials included in this article.
Data Availability Statement
The datasets analysed during the current study are publicly available in the Demographic Health Survey repository, https://dhsprogram.com/data/dataset/Uganda_MIS_2018.cfm.