

Abstract
Advances in computational tools for atomic model building are leading to accurate models of large molecular assemblies seen in electron microscopy, often at challenging resolutions of 3–4 Å. We describe new methods in the UCSF ChimeraX molecular modeling package that take advantage of machine‐learning structure predictions, provide likelihood‐based fitting in maps, and compute per‐residue scores to identify modeling errors. Additional model‐building tools assist analysis of mutations, post‐translational modifications, and interactions with ligands. We present the latest ChimeraX model‐building capabilities, including several community‐developed extensions. ChimeraX is available free of charge for noncommercial use at https://www.rbvi.ucsf.edu/chimerax.
Keywords: AlphaFold, atomic model building, ChimeraX, cryo‐electron microscopy, protein structure prediction, refinement
1. INTRODUCTION
The past few years have seen tremendous advances in cryogenic electron microscopy (cryo‐EM) methods and accordingly, in the number and complexity of the resulting atomic structures, as well as the achievable level of resolution. This progress can be ascribed not only to new imaging technologies, but also to enhanced capabilities for the storage, processing, and analysis of such large and complex data (Callaway, 2020; Chiu et al., 2021). Similarly, cryo‐electron tomography (cryo‐ET) has become an increasingly powerful technique for studying multiple levels of structural organization from macromolecular assemblies to organelles to whole cells and multicellular structures (Hong et al., 2023; Lakshminarasimhan, 1986). Integrative methods coupling cryoelectron data with crosslinking, structure prediction, and other techniques have further enabled generating 3D models of biological structures with unprecedented detail (Flacht et al., 2023; Fontana et al., 2022).
UCSF ChimeraX is a program for the interactive visualization and analysis of molecular structures and associated data (density maps, sequences, and sequence alignments, etc.) as well as volumetric data at scales beyond the atomic level (cryo‐ET, light microscopy, and medical imaging). UCSF ChimeraX has been described broadly in previous publications (Goddard et al., 2018; Pettersen et al., 2020). ChimeraX and its predecessor UCSF Chimera are used extensively by the cryo‐EM community, as they contain numerous tools for map processing, fitting, and segmentation, in addition to easy interactive threshold adjustment, cropping, and zoning. ChimeraX contains substantially all of the legacy Chimera capabilities, but has far surpassed it in several areas, including better handling of large data, ambient‐occlusion lighting, completely new tools for analysis and building, and implementation with modern toolkits to extend the life of the program (Goddard et al., 2018; Pettersen et al., 2020).
In addition to its many built‐in capabilities, ChimeraX provides a rich set of tools to extend its functionality through incorporation of external software “bundles.” A bundle is an extension to ChimeraX that provides additional capabilities including commands and associated user interfaces, all of which are seamlessly integrated within ChimeraX's intrinsic commands, menus, and interfaces. These extensions, often contributed by outside developers, are typically distributed through the ChimeraX Toolshed (Goddard et al., 2018; Pettersen et al., 2020; essentially a free App Store) which allows ChimeraX users to install them with a single mouse click. Of the 29 extensions currently available in the Toolshed, seven are described in the sections below and illustrate the breadth of functionality that can be added to the “base” ChimeraX application (Table 1). The Toolshed can be accessed from the ChimeraX menu “Tools / More Tools.”
TABLE 1.
ChimeraX extensions described in this paper. The developer who implemented the extension is listed and the first column cites the publication of the extension or original algorithm.
| Extension | Description | Developer | Institution |
|---|---|---|---|
| SEQCROW (Schaefer et al., 2021) | Structure editing and quantum chemistry utilities | A. J. Schaefer | University of Georgia |
| ISOLDE (Croll, 2018) | Interactive model building/real‐space refinement | Tristan Croll | Altos Labs |
| StarMap (Lugmayr et al., 2023) | Automatic Rosetta refinement via ChimeraX | Wolfgang Lugmayr | University Medical Center Hamburg‐Eppendorf |
| QScore (Pintilie et al., 2020) | Atom‐by‐atom validation of model fit | Tristan Croll | Altos Labs |
| StrudelScore (Istrate et al., 2021) | Map‐model validation | Andrei Istrate | EMBL‐EBI |
| XMAS (Lagerwaard et al., 2022) | Analyze/visualize cross‐linking mass spectrometry data | Ilse Lagerwaard | Utrecht University |
| ArtiaX (Ermel et al., 2022) | Visualization and editing of cryo‐ET particle lists | Utz H. Ermel | Goethe University Frankfurt |
ChimeraX is actively developed, and for this latest update, we have chosen to focus on recently added features for atomic‐structure prediction, building, modification, and assessment, both in the context of the burgeoning field of cryo‐EM as mentioned above, and within a broader set of molecular modeling applications apart from structure determination (analysis of ligand‐receptor interactions, etc.).
2. CHIMERAX TOOLS TO SUPPORT CRYO‐EM MODEL BUILDING
ChimeraX can assist many stages of building atomic models in cryo‐EM maps, from finding starting models to fitting, refinement, validation, and visualization. Here we survey these capabilities, including several contributed by researchers outside the core development team. These tools interoperate using common data structures and user interface conventions, substantially streamlining the workflow as compared to transferring data files between separate software packages.
2.1. Protein structure prediction
2.1.1. AlphaFold
Building atomic coordinates into a cryo‐EM map usually starts with an approximate model such as a previously solved structure of a homologous protein or a computationally predicted structure. AlphaFold structure prediction (Jumper et al., 2021) can produce starting protein models, albeit not as accurate as from experiment (Terwilliger et al., 2023), but suitable for subsequent refinement in a cryo‐EM map. ChimeraX has tools to run new AlphaFold predictions, find existing predictions in the EBI AlphaFold Database (Varadi et al., 2022), and plot error metrics for evaluating model quality.
As an example, consider the human insulin receptor with bound insulin (Figure 1). ChimeraX can fetch a precomputed prediction of the receptor from the database using the AlphaFold tool with a sequence specified as UniProt INSR_HUMAN or P06213, or using the ChimeraX alphafold fetch command. The AlphaFold database contains over 200 million predictions of protein sequences from UniProtKB (UniProt Consortium, 2023; version UniProt 2021_04).
FIGURE 1.
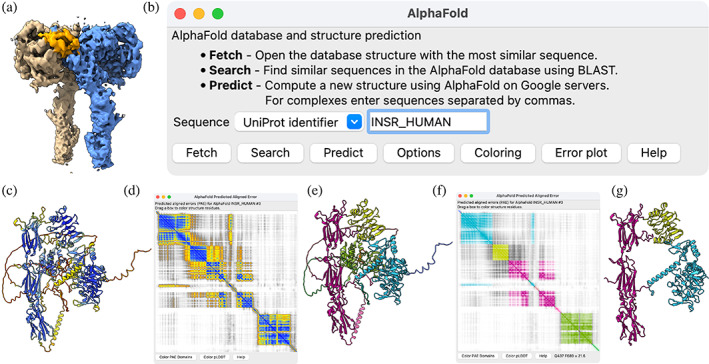
AlphaFold Database prediction of the human insulin receptor. (a) cryo‐EM map of insulin receptor dimer (EMDB 34281; Kim et al., 2022, 4.2 Å resolution) with insulin receptor monomers in brown and blue and insulin in orange. (b) ChimeraX AlphaFold tool user interface. (c) Human insulin receptor monomer prediction from the AlphaFold Database colored by pLDDT from blue (high confidence) to yellow to red (low confidence) does not match the experimental confirmation. (d) Predicted aligned error (PAE) plot with blue representing small errors (<5 Å), and yellow (10 Å), orange (15 Å), and gray (> 20 Å) representing larger estimated errors. (e) Structure colored by PAE domain, green cytoplasmic, pink transmembrane, purple fibronectin, and yellow and blue extracellular. (f) PAE plot colored by PAE domain. (g) Structure as in (e) except with the disordered and unobserved (in cryo‐EM, see text) parts removed.
AlphaFold calculates a predicted local distance difference test (pLDDT) score for each residue, indicating confidence that the residue C‐alpha atom is correctly located relative to nearby residues (Figure 1C). The database contains only monomer predictions, whereas the EMDB map represents a dimer. Further, the prediction includes cytoplasmic, transmembrane, and extracellular portions while only the extracellular region is observed in the cryo‐EM map. The ChimeraX Log includes a link to click to show the corresponding sequence and annotations from UniProt in a separate panel, with crosstalk to the structure for easy highlighting of annotated segments.
For evaluating packing, AlphaFold calculates a second type of confidence score called predicted aligned error (PAE) for every pair of residues. The value for residues numbered M and N estimates the positional error (in Å) of residue N when residue M is aligned with the true structure. ChimeraX plots PAE values as a 2D heat map (Figure 1D). ChimeraX can also compute “PAE domains,” sets of residues that are confidently positioned relative to each other according to PAE, using a graph clustering method developed by Tristan Croll (Croll TI PAE Graph Clustering Algorithm, n.d.). PAE domains can be assigned unique colors in the structure and the plot (Figure 1E, F).
2.1.2. Running AlphaFold Multimer
The AlphaFold Database contains monomer (single‐chain) predictions only. The human insulin receptor in the cryo‐EM study is dimeric, includes two bound insulin molecules, and differs in sequence from UniProt P06213 at three positions. A new AlphaFold prediction (monomer or multimer) can be run on Google Colab (Anon Google Colaboratory, n.d.) servers using a free Google account by pasting the desired sequence(s) into the ChimeraX AlphaFold tool. ChimeraX uses ColabFold (Mirdita et al., 2022), an optimized version that runs several times faster than standard AlphaFold. Multimer structure prediction does not improve the domain packing (Figure 2).
FIGURE 2.
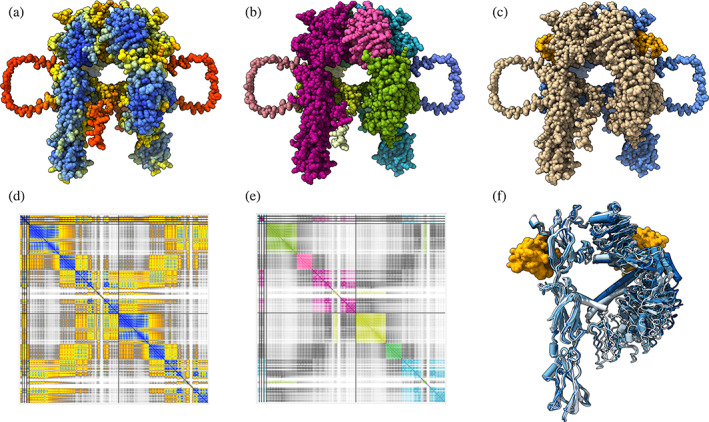
AlphaFold prediction of dimeric insulin receptor. (a) AlphaFold 2.3 prediction of dimeric human insulin receptor with two insulin molecules, colored: by pLDDT score; (b) by PAE domains; (c) with receptor chains tan and blue, insulin orange. (d) PAE plot colored by PAE. (e) PAE plot colored by PAE domain. (f) Superposition of five predictions showing only one monomer. All five predictions are similar to one another.
AlphaFold predicts an ensemble of five structures using five neural networks trained with slightly different protocols. ChimeraX automatically shows the structure with the highest average pLLDT, but all five are available and can be aligned with the ChimeraX Matchmaker tool or command. The five structures have similar conformations (Figure 2F).
A maximum total sequence length of about 2000 residues can be predicted using a free Google Colab account. AlphaFold runs out of graphics processor (GPU) memory for larger sequences using a free account (NVidia T4 GPU, 16 GB memory). The insulin receptor dimer with bound insulin totals 1906 amino acids and takes about 8 h to predict with a free account, while the monomer takes 1.5 h and insulin alone (51 residues) takes 5 min. For larger structures, Google Colab offers NVidia A100 GPUs with 40 GB memory for about US$1/hour. Runtime increases approximately as the square of the sequence length, so a 3300‐residue prediction would take approximately 24 h, the maximum time allowed by Google Colab.
Although the packing of domains in AlphaFold predictions is often wrong, the conformations of the individual domains can be very accurate. In Figure 3A, the PAE domains from the Alphafold prediction of the receptor monomer are individually aligned to the final cryo‐EM structure, giving an overall C‐alpha RMSD of 1.7 Å. Figure 3B shows the cryo‐EM structure colored by C‐alpha distance to the aligned predicted domains. The three fibronectin domains that make the stalk of the receptor are a single PAE domain but were split into two pieces in this alignment.
FIGURE 3.
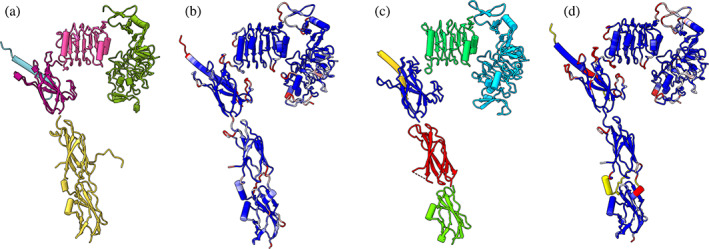
AlphaFold and ESMFold domains aligned to cryo‐EM final structure. (a) Insulin receptor domains from AlphaFold prediction individually aligned to final cryo‐EM structure (PDB 8guy, not shown) for one insulin receptor monomer. (b) Final cryo‐EM structure colored by C‐alpha distance from AlphaFold domains (blue = 1 Å, white = 2 Å, red = 3 Å). (c) ESMFold individually predicted domains aligned to cryo‐EM structure. (d) Final cryo‐EM structure colored by C‐alpha distance from ESMFold domains.
The AlphaFold PAE score shows insulin confidently positioned against one of the fibronectin domains of the receptor. The insulin is part of the same PAE domain as the receptor fibronectin domain. ChimeraX can depict the confidence at the interface between insulin and its receptor as lines colored by PAE value (Figure 4A). However, the cryo‐EM final structure shows the insulin bound in a different location. The insulin receptor is known to bind four insulin molecules at two different interfaces; the AlphaFold prediction has placed the insulin at an experimentally observed binding site (Figure 4D), but not the correct one for this cryo‐EM map. This highlights an all too common problem with AlphaFold: it usually produces only one conformation for an assembly, with no options to direct it toward alternative arrangements. While AlphaFold can use template structures, they seldom change the predicted conformation.
FIGURE 4.

AlphaFold predicts an insulin binding site not observed in the cryo‐EM map of the human structure. (a) Contacts <5 Å between insulin and receptor third fibronectin domain in the AlphaFold prediction shown as colored lines (dark blue: PAE 0, light blue: PAE 5, yellow: PAE 10) have high confidence. (b) AlphaFold dimer prediction with insulin bound to the side of the third fibronectin domain. (c) Final cryo‐EM structure (PDB 8guy) with insulin bound to top of third fibronectin domain. (d) Structure of mouse insulin receptor with two insulin binding locations (PDB 7sl7), the upper binding location matching the human cryo‐EM data. (e) Superposition of AlphaFold prediction (orange and tan) with mouse structure (yellow and pink) of lower insulin binding location.
2.1.3. Searching the AlphaFold Database
ChimeraX can search the AlphaFold Database for sequence similarity to a query using a BLAST (Altschul et al., 1990) web service. The database has over 200 million entries and the search takes about 10 min. A list of top hits (default 100) is returned, and one or more can be chosen to fetch from the database. Searching for inexact matches is useful for obtaining alternate conformations when the exact desired sequence is not in the database or its prediction is of low confidence or in an undesired conformational state. ChimeraX also offers a (several seconds) faster search that returns only the single top hit from the database. When AlphaFold predicts a close sequence with high confidence, the prediction can be used as a template in conventional homology modeling with Modeller (Webb & Sali, 2016). ChimeraX Modeller tools are described below.
2.1.4. ESMFold
Starting atomic models can also be obtained by using the ChimeraX ESMFold tool to run new predictions with the Evolutionary Scale Modeling method ESMFold (Lin et al., 2023) or to search the 600‐million‐sequence ESM Metagenomic Atlas of precomputed models. ESMFold is significantly faster than AlphaFold, taking about 30 seconds for a 400‐residue prediction compared to 20 min for AlphaFold; it employs a large language AI model and uses only the query sequence, whereas AlphaFold generates a deep sequence alignment. Like AlphaFold, ESMFold provides pLLDT and PAE confidence scores. ESMFold only predicts single‐chain proteins. ChimeraX uses a free server provided by Meta that has a maximum sequence length of 400 and sometimes fails or times out for sequences even half that length. The database of precomputed ESMFold models includes sequences of up to 1000 residues. Using ESMFold to predict the individual domains of the insulin receptor produced accurate results with 1–3 Å C‐alpha RMSD to the final cryo‐EM structure (Figure 3D).
2.1.5. Modeller
ChimeraX runs Modeller (Webb & Sali, 2016) as a web service. Users do not need to install Modeller, but they must obtain an academic license key from the Modeller developers before using the associated tools.
The Modeller Comparative tool in ChimeraX requires an atomic structure of a similar protein to use as a template, as well as a target‐template sequence alignment, where the target is the sequence of the structure to predict. Often both can be obtained simply by using the BLAST Protein tool in ChimeraX to search the PDB database by the sequence of the target. In contrast to AlphaFold, comparative modeling gives the user explicit control over which template(s) will be used, potentially only those with the desired conformational state, for example, an activated or closed form of the protein, if available. The Modeller Comparative tool also allows modeling multiprotein complexes, if there is a suitable multiprotein template with the same stoichiometry.
The Model Loops tool in ChimeraX runs Modeller loop refinement, which does not use a template. It is used to fill in missing segments of experimental structures (e.g., disordered regions) and/or to generate alternative conformations of loops already present in a solved or predicted structure.
2.2. Fitting models into maps
Returning to the example system, the five domains of the AlphaFold‐predicted receptor monomer can be fit into the cryo‐EM map using the Local EM Fitting tool in ChimeraX. This tool is part of an extension called PhenixUI that serves as a front‐end for Phenix (Liebschner et al., 2019); it uses Phenix emplace_local (Millán et al., 2023; Read et al., 2023). For each domain, the user marks a search region in the map by placing a sphere that is about twice the diameter of the domain. For optimal fitting, two half‐maps are used by the algorithm to ascertain noise levels. This method of fitting places the domains very accurately (Figure 5): four domains are placed within 1 Å translation and 2° rotation of their position in the final cryo‐EM structure, and the fifth, a single helix, is rotated 5°.
FIGURE 5.

Insulin and the five PAE domains of the AlphaFold‐predicted insulin receptor monomer fitted separately into the map to assemble an initial model.
The Local EM Fitting tool can find incorrect locations for the small protein insulin if the region to search is misplaced. An alternative approach is to explore many possible placements interactively by moving the structure with the mouse and using the ChimeraX Fit in Map tool to rigidly optimize correlation with the map. With Fit in Map optimization, insulin is placed with a C‐alpha RMSD of 1 Å relative to the final cryo‐EM structure. Fit in Map requires an approximately correct initial position and performs gradient ascent optimization, whereas the Local EM Fitting tool searches within a sphere and does not require an initial placement of the model.
2.3. Building ligands and solvent
Small‐molecule ligands may be important components of cryo‐EM complexes, for example, the inhibitor of topoisomerase in Figure 6. There are several ways to add ligands to a model in ChimeraX. The ChimeraX Build Structure tool (described in more detail below) allows fetching modeled small‐molecule structures from web resources such as PubChem3D (Bolton et al., 2011) and the PDB Chemical Components Dictionary (Westbrook et al., 2015), making atom‐by‐atom modifications, and building peptides and double‐helical nucleotides from sequence input alone. The Structure Editing and Quantum Chemistry Utilities (SEQCROW; Schaefer et al., 2021) extension to ChimeraX enables simple interactive building of ligands from a library of chemical motifs, or by drawing a 2D structure diagram which SEQCROW converts to 3D coordinates. At higher cryo‐EM map resolutions, bound water molecules can be resolved. The ChimeraX Water Placement tool (also part of the PhenixUI extension mentioned above) can place waters in density around macromolecules and allows the user to interactively accept or delete specific waters.
FIGURE 6.

Assessing model fit to map. (a) Atomic model surface depiction of topoisomerase (blue) bound to DNA (green and brown) with cyanotriazole inhibitor (yellow), PDB 8gcc. (b) Thin slab of 2.94 Å map (EMD 29930) showing atomic model side chains. (c) Sharpened cryo‐EM map colored by local resolution calculated by Phenix local_resolution (Anon Creating a local resolution map with local_resolution, n.d.). (d) QScore ChimeraX extension. (e) Strudel‐ Score ChimeraX extension.
2.4. Model refinement
To refine an initial model in a cryo‐EM map, the Interactive Structure Optimization by Local Direct Exploration (ISOLDE) package (Croll, 2018) provides a suite of ChimeraX tools to identify and fix structure errors utilizing real‐time molecular dynamics and validation. The wide‐ranging capabilities of ISOLDE are described in another article in this issue.
The StarMap ChimeraX extension (Lugmayr et al., 2023) provides a simple user interface to run automated structure refinement in cryo‐EM maps using Rosetta (Leman et al., 2020). It also enables validation with the Rosetta MEDIC package (Reggiano et al., 2023) and assessing model agreement with the map, taking into account local resolution.
2.5. Model assessment
Assessment whether atomic models match the cryo‐EM map is most useful at resolutions better than 4 Å since lower resolutions do not readily distinguish side chains. Figure 6 illustrates using the QScore and StrudelScore extensions to evaluate residue fits in a map of a topoisomerase bound to DNA and a cyanotriazole inhibitor (Rao et al., 2023).
2.5.1. QScore
QScore (Pintilie et al., 2020) approximates the atomic model density by placing Gaussians at atom positions and correlates this predicted density to what is observed in the map. To score individual amino acids, nucleic acids, and ligands, it compares density that is closer to the assessed atoms than to any other atom. The Gaussian width is chosen to match very high‐resolution maps (<1.5 Å), so the score that is considered a good fit depends on the map resolution. This measure is the most widely used per‐residue map fit score and is reported by the EM Databank and Protein Databank validation reports. The ChimeraX extension can compute it for 1000 residues in 10 seconds and plot the scores. Clicking on a residue in the plot shows the corresponding residue and nearby map contour surface in the 3D graphics window.
2.5.2. StrudelScore
StrudelScore (Istrate et al., 2021) also measures the correlation of expected side‐chain density to the observed density, but instead of a theoretical expected density, it uses an average density across all EM Databank entries for each commonly observed rotamer of each of the 20 standard amino acids, a total of about 150 rotamers. Different template densities are derived from EMDB data for several ranges of resolution from 2 to 4 Å in bins 0.3 Å wide. The ChimeraX Strudel Score tool plots the per‐residue correlation scores. Clicking within the plot shows the residue and nearby density, and can also show the empirical average EMDB density that is expected. Strudel scores are computed by a command‐line Python program that uses ChimeraX and takes several hours for 1000 residues.
2.5.3. Local map resolution
The resolution of cryo‐EM maps often varies significantly across the structure, with flexible regions resulting in lower resolutions. ChimeraX can color the map surface based on local resolution estimated from the cryo‐EM half‐maps using its Surface Color tool. Figure 6C reveals that core regions of the complex are at higher resolution than the 2.94 Å reported by the EMDB for this map, and peripheral regions can be as low as 6 Å resolution. Neither the ChimeraX QScore or StrudelScore extensions account for variable resolution across a structure, so residues with poorer scores will usually be found in the lower‐resolution regions. Future improvements that score residues based on local resolution would aid identifying structure errors.
3. MODELING USING ADDITIONAL EXPERIMENTAL DATA
ChimeraX supports visualization and analysis of a wide range of model‐building experimental data beyond single‐particle cryo‐EM. ChimeraX extensions focusing on mass spectroscopy crosslinking data and electron tomography illustrate how labs using diverse structural data can leverage ChimeraX capabilities.
3.1. Crosslink analysis: XMAS
The Crosslink Mapping and Analysis (XMAS) tool (Lagerwaard et al., 2022) maps sequences of crosslinked peptides to structures to determine constraints on molecular assemblies. These can be visualized as pseudobonds in molecular assembly models in ChimeraX. XMAS provides capabilities to handle ambiguous constraints in homo‐multimers and for use with integrative modeling packages such as DisVis (van Zundert et al., 2017) and HADDOCK (van Zundert et al., 2016).
3.2. Analysis of electron tomography particle lists: ArtiaX
Molecular structures derived from electron tomography of cells where the molecules are functioning in their native context have reached high resolutions, for example 3.2 Å for ribosome translation intermediates, and thus aid understanding in vivo mechanisms such as the anticancer drug homoharringtonine (Xing et al., 2023). The ArtiaX extension (Ermel et al., 2022) in ChimeraX enables visualizing the distribution of polysomes (multiple ribosomes translating one mRNA) and their conformational states in untreated and drug‐treated states, Figure 7.
FIGURE 7.

Spatial arrangement of ribosomes seen in untreated cells and cells treated with anticancer drug homoharringtonine, with colors indicating the ribosome conformational state (Figure 4 of Xing et al., 2023). Ribosomes are more dispersed in drug‐treated cells.
4. GENERAL ATOMIC STRUCTURE BUILDING
Here, we describe ChimeraX tools for building and modifying atomic structures independent of experimental data, as well as preparing them for computational pipelines involving other software, such as molecular docking or dynamics simulations.
The structure prediction and ligand‐building methods mentioned in previous sections also apply outside the context of experimental structure determination.
4.1. Build Structure
The Build Structure tool allows creating structures from scratch or making small modifications to existing structures. The “Start Structure” section of the tool offers a variety of ways to start building a structure. Small‐molecule structures can be fetched using web resources such as PubChem3D (Bolton et al., 2011), the PDB Chemical Components Dictionary (Westbrook et al., 2015), and translators for IUPAC names (Lowe et al., 2011) and SMILES strings (Oellien, n.d.). There are command equivalents for all functions in the Build Structure tool; for instance, the command to fetch resveratrol from PubChem3D would be “open pubchem:445154”.
To build a peptide, the user enters an amino acid sequence. The user is then prompted for the φ/ψ (backbone) angles and a rotamer library for building the side chains, with choices: Dunbrack (default; Shapovalov & Dunbrack Jr, 2011), Dynameomics (Scouras & Daggett, 2011), Richardson (common‐atom; Lovell et al., 2000), and Richardson (mode). Sidechains will be added from N‐ to C‐terminus using the most prevalent rotamer that does not clash with the currently generated structure.
To build a nucleic acid double helix, the user specifies the sequence of one strand, the chemical type (RNA, DNA, or RNA/DNA hybrid), and conformation (A‐ or B‐form). Only regular double helices are generated, although strand deletion or bond rotations can be performed on the result (Figure 8).
FIGURE 8.

B‐form DNA generated by ChimeraX drawn with simplified nucleotide representations and colored by residue type: A, red; C, yellow; G, green; T, blue.
Finally, one can build a completely new structure or modify an existing structure one atom at a time. A new structure can be started by placing a single helium atom at the center of view or specified (x, y, z) coordinates, then using the “Modify Structure” section to change its element type, number of bonds, and bond geometry. With each change, bond valences are automatically filled with hydrogens. In turn, modifying one or more of the hydrogens allows progressively creating any structure desired. By default, rings will automatically be created if newly placed hydrogens are sufficiently close to an existing atom. Also, as a convenience, various ring and fused‐ring structures are provided as optional starting points instead of a single atom. The Modify Structure section is also useful for making simple modifications to larger structures, such as phosphorylating or methylating protein residues, and for deleting any unwanted atoms and bonds.
Other sections of Build Structure facilitate other common modifications. “Adjust Bonds” allows adding/deleting bonds and adjusting bond lengths. Users can add all possible bonds between selected atoms or just “reasonable” bonds where the atoms are approximately a covalent bond length apart. The latter allows deleting all bonds from part or all of a molecule and adding back just the reasonable ones in a single step to get a well‐connected structure.
The “Adjust Torsions” and “Adjust Angles” sections allow adjusting non‐ring torsion angles and bond angles. Adjust Angles are not limited to bond angles; the angle between any three atoms can be adjusted, as long as the first and third atoms are not connected, or are connected only through the central atom.
The “Join Models” section allows joining proteins/peptides by forming a C → N bond with specified length and ω/φ angles. Finally, “Invert” swaps the positions of two substituents of an atom, potentially inverting a chiral center.
4.2. Rotamers
The Rotamers tool is used to mutate an amino acid to a different residue type or to examine alternative rotameric side chain conformations of the existing type (Figure 9). As with Build Structure, all functions of the Rotamers tool are available as commands.
FIGURE 9.
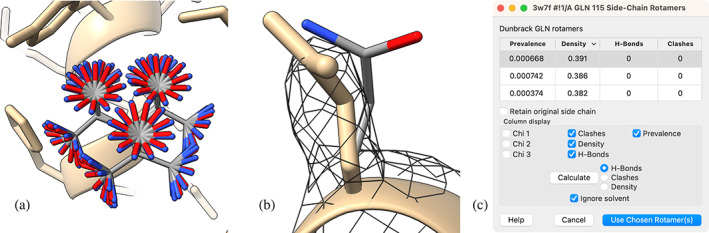
(a) Rotamers from the Dunbrack backbone‐dependent rotamer library (Shapovalov & Dunbrack Jr, 2011) for glutamine 115 in chain A of dehydrosqualene synthase (PDB 3w7f). (b) Single rotamer with highest correlation to experimental density and no clashes (thin, element‐colored) along with experimentally placed side chain (thick, monocolored). (c) Rotamers table.
The Rotamers tool works in two stages. An initial dialog requires choosing a rotamer library (same choices as for peptide building in Build Structure) and residue type. Approving those settings brings up a separate “rotamer list” dialog for each of the currently selected amino acid residues. A rotamer list is a sortable table of the rotamers for that residue type, with columns giving the side chain torsion values and the rotamer's prevalence given the backbone conformation at that position (Figure 9C). A “Calculate” button in the dialog allows computing and adding columns for the numbers of hydrogen bonds and clashes the rotamers form with the local environment, and/or their agreement with a density map (if present).
Choosing rows in the list shows only those rotamers in the main graphics window. If the dialog is canceled, then no rotamers are applied and the residue retains its type and original side chain. If the dialog is approved, then the residue is mutated as needed and the side chain is changed to the rotamers chosen in the table. If multiple rotamers were chosen, then alternate atom locations are used, with occupancy values proportional to rotamer prevalence.
4.3. Dock Prep
Deposited experimental structures are often unsuitable as direct input to computational pipelines such as docking screens or molecular dynamics simulations. For example, programs may mishandle alternate atom locations or fail to recognize modified or truncated residues. They may also need information not included in the structure file such as hydrogen atoms and atomic partial charges.
The Dock Prep tool handles the otherwise onerous and error‐prone chore of preparing a structure for use as input to further computations. All functions of Dock Prep have command equivalents, which facilitates scripting their repeated use.
The Dock Prep tool offers seven operations for structure preparation, each of which is optional. The first is to delete all solvent. The second is to delete any ions that are not part of a coordination complex. The third is to delete alternate atomic locations except for the ones currently in use (the Altloc Explorer tool allows switching among the available alternate locations).
The fourth operation is to convert certain modified amino and nucleic acid residues to their standard equivalents. These residues contain bromine or selenium to assist in phase determination during x‐ray crystallography. Conversion removes that atom or changes it to a different element as needed to generate the corresponding natural residue. For example, selenomethionine (MSE) is converted to methionine (MET).
The fifth operation works on residues with incomplete sidechains. The options here are to either repair the sidechain using a rotamer library (similar to the peptide building function in the Build Structure tool) or mutate the residue to ALA or GLY.
The sixth operation is to add hydrogens. Hydrogens are added for protonation states reasonable for each functional group at physiological pH (regardless of the local environment). This step also adds oxygen to the carboxyl‐terminus if needed. ChimeraX has fairly sophisticated atom‐typing based on the IDATM algorithm (Meng & Lewis, 1991), and can therefore not only correctly protonate standard residues, but most nonstandard residues/structures as well.
The seventh possible operation is to add partial charges to the atoms. This step requires that the hydrogen atoms be present in the structure. For “standard” residues (water, standard amino/nucleic acids, certain lipids, and a few common variants and capping groups), the charges are taken from the recommended force field versions in the AmberTools package (Wang et al., 2006) or from the Amber parameter database (Anon AMBER parameter database, n.d.). For nonstandard residues, charges are computed using the Antechamber program from the AmberTools package.
The resulting structure can be written in any atomic output format ChimeraX supports, but as a convenience, the Dock Prep tool includes the option to save a file in Sybyl Mol2 format, which is particularly convenient for docking screens since it includes partial charges.
5. CONCLUSIONS
Advances in methods for atomic model building are automating many steps of the process. Developments such as AlphaFold structure prediction, robust fitting in maps accounting for noise and variable resolution in Phenix, and refinement pipelines built on Rosetta are reducing the researcher time needed to create a model while improving the accuracy. ChimeraX provides user interfaces to these new methods together with 3D visualization and a wide range of basic interactive tools needed to solve and analyze molecular assemblies. Specialized methods developed by many different research groups contribute to a final model. ChimeraX is easily extended by biology researchers using the Python programming language. Integrating user interfaces for the many steps in model building within the ChimeraX framework simplifies the task by removing the need to transfer intermediate results between separate programs, and the diverse capabilities provided by ChimeraX for visualizing structures help to reduce errors and facilitate insights by minimizing tedious steps in model building. ChimeraX is available for macOS, Windows, and Linux. ChimeraX downloads, complete user documentation, and tutorials are available from https://www.rbvi.ucsf.edu/chimerax, and contributed extensions are available from ChimeraX menu Tools / More Tools… and on the ChimeraX Toolshed web site https://cxtoolshed.rbvi.ucsf.edu.
AUTHOR CONTRIBUTIONS
Elaine C. Meng: Validation; Visualization; Writing—original draft; Writing—review & editing. Thomas D. Goddard: Software; Visualization; Writing—original draft; Writing—review & editing. Eric F. Pettersen: Software; Visualization; Writing—original draft; Writing—review & editing. Greg S. Couch: Software. Zach J. Pearson: Software. John H. Morris: Funding acquisition; Project administration; Writing—review & editing. Thomas E. Ferrin: Funding acquisition; Writing—review & editing; Project administration.
CONFLICT OF INTEREST STATEMENT
The authors declare no conflicts of interest.
ACKNOWLEDGMENTS
We thank the community developers of ChimeraX extensions mentioned in the text: Tristan Croll (ISOLDE and QScore), Tony Schaefer (SEQCROW), Randy Read (Local EM Fitting), Wolfgang Lugamayr (StarMap), Andrei Istrate (StrudelScore), Utz Ermel (ArtiaX), and Ilse Lagerwaard (XMAS). ChimeraX development is funded by NIH grant R01 GM129325, NIH grant R24 GM141254, by the NIAID Office of Cyber Infrastructure and Computational Biology, and Chan Zuckerberg Initiative grant EOSS4‐0000000439.
Meng EC, Goddard TD, Pettersen EF, Couch GS, Pearson ZJ, Morris JH, et al. UCSF ChimeraX: Tools for structure building and analysis. Protein Science. 2023;32(11):e4792. 10.1002/pro.4792
Review Editor: Nir Ben‐Tal
REFERENCES
- Altschul SF, Gish W, Miller W, Myers EW, Lipman DJ. Basic local alignment search tool. J Mol Biol. 1990;215:403–410. [DOI] [PubMed] [Google Scholar]
- Anon AMBER parameter database . Available from: http://amber.manchester.ac.uk
- Anon Creating a local resolution map with local_resolution . Available from: https://phenix-online.org/documentation/reference/local_resolution.html
- Anon Google Colaboratory . Available from: https://colab.research.google.com/?utm_source=scs-index
- Bolton EE, Chen J, Kim S, Han L, He S, Shi W, et al. PubChem3D: a new resource for scientists. J Chem. 2011;3:32. [DOI] [PMC free article] [PubMed] [Google Scholar]
- Callaway E. “It opens up a whole new universe”: revolutionary microscopy technique sees individual atoms for first time. Nature. 2020;582:156–157. [DOI] [PubMed] [Google Scholar]
- Chiu W, Schmid MF, Pintilie GD, Lawson CL. Evolution of standardization and dissemination of cryo‐EM structures and data jointly by the community, PDB, and EMDB. J Biol Chem. 2021;296:100560. [DOI] [PMC free article] [PubMed] [Google Scholar]
- Croll TI. ISOLDE: a physically realistic environment for model building into low‐resolution electron‐density maps. Acta Crystallogr D Struct Biol. 2018;74:519–530. [DOI] [PMC free article] [PubMed] [Google Scholar]
- Croll TI PAE Graph Clustering Algorithm . (unpublished).
- Ermel UH, Arghittu SM, Frangakis AS. ArtiaX: an electron tomography toolbox for the interactive handling of sub‐tomograms in UCSF ChimeraX. Protein Sci. 2022;31:e4472. [DOI] [PMC free article] [PubMed] [Google Scholar]
- Flacht L, Lunelli M, Kaszuba K, Chen ZA, Reilly FJO, Rappsilber J, et al. Integrative structural analysis of the type III secretion system needle complex from Shigella flexneri . Protein Sci. 2023;32:e4595. [DOI] [PMC free article] [PubMed] [Google Scholar]
- Fontana P, Dong Y, Pi X, Tong AB, Hecksel CW, Wang L, et al. Structure of cytoplasmic ring of nuclear pore complex by integrative cryo‐EM and AlphaFold. Science. 2022;376:eabm9326. [DOI] [PMC free article] [PubMed] [Google Scholar]
- Goddard TD, Huang CC, Meng EC, Pettersen EF, Couch GS, Morris JH, et al. UCSF ChimeraX: meeting modern challenges in visualization and analysis. Protein Sci. 2018;27:14–25. [DOI] [PMC free article] [PubMed] [Google Scholar]
- Hong Y, Song Y, Zhang Z, Li S. Cryo‐electron tomography: the resolution revolution and a surge of in situ Virological discoveries. Annu Rev Biophys. 2023;52:339–360. [DOI] [PubMed] [Google Scholar]
- Istrate A, Wang Z, Murshudov GN, Patwardhan A, Kleywegt GJ. 3D‐Strudel—a novel model‐dependent map‐feature validation method for high‐resolution cryo‐EM structures. bioRxiv. [Internet]: 2021.12.16.472999. Available from: 2021. 10.1101/2021.12.16.472999 [DOI]
- Jumper J, Evans R, Pritzel A, Green T, Figurnov M, Ronneberger O, et al. Highly accurate protein structure prediction with AlphaFold. Nature. 2021;596:583–589. [DOI] [PMC free article] [PubMed] [Google Scholar]
- Kim J, Yunn N‐O, Park M, Kim J, Park S, Kim Y, et al. Functional selectivity of insulin receptor revealed by aptamer‐trapped receptor structures. Nat Commun. 2022;13:6500. [DOI] [PMC free article] [PubMed] [Google Scholar]
- Lagerwaard IM, Albanese P, Jankevics A, Scheltema RA. Xlink Mapping and AnalySis (XMAS)—Smooth Integrative Modeling in ChimeraX. bioRxiv [Internet]: 2022.04.21.489026. Available from: 2022. 10.1101/2022.04.21.489026 [DOI]
- Lakshminarasimhan A. An excellent and inexpensive substitute for immersion oil in microscopy. Stain Technol. 1986;61:122–123. [DOI] [PubMed] [Google Scholar]
- Leman JK, Weitzner BD, Lewis SM, Adolf‐Bryfogle J, Alam N, Alford RF, et al. Macromolecular modeling and design in Rosetta: recent methods and frameworks. Nat Methods. 2020;17:665–680. [DOI] [PMC free article] [PubMed] [Google Scholar]
- Liebschner D, Afonine PV, Baker ML, Bunkóczi G, Chen VB, Croll TI, et al. Macromolecular structure determination using x‐rays, neutrons and electrons: recent developments in Phenix. Acta Crystallogr D Struct Biol. 2019;75:861–877. [DOI] [PMC free article] [PubMed] [Google Scholar]
- Lin Z, Akin H, Rao R, Hie B, Zhu Z, Lu W, et al. Evolutionary‐scale prediction of atomic‐level protein structure with a language model. Science. 2023;379:1123–1130. [DOI] [PubMed] [Google Scholar]
- Lovell SC, Word JM, Richardson JS, Richardson DC. The penultimate rotamer library. Proteins. 2000;40:389–408. [PubMed] [Google Scholar]
- Lowe DM, Corbett PT, Murray‐Rust P, Glen RC. Chemical name to structure: OPSIN, an open source solution. J Chem Inf Model. 2011;51:739–753. [DOI] [PubMed] [Google Scholar]
- Lugmayr W, Kotov V, Goessweiner‐Mohr N, Wald J, DiMaio F, Marlovits TC. StarMap: a user‐friendly workflow for Rosetta‐driven molecular structure refinement. Nat Protoc. 2023;18:239–264. [DOI] [PubMed] [Google Scholar]
- Meng EC, Lewis RA. Determination of molecular topology and atomic hybridization states from heavy atom coordinates. J Comput Chem. 1991;12:891–898. [Google Scholar]
- Millán C, McCoy AJ, Terwilliger TC, Read RJ. Likelihood‐based docking of models into cryo‐EM maps. Acta Crystallogr D Struct Biol. 2023;79:281–289. [DOI] [PMC free article] [PubMed] [Google Scholar]
- Mirdita M, Schütze K, Moriwaki Y, Heo L, Ovchinnikov S, Steinegger M. ColabFold: making protein folding accessible to all. Nat Methods. 2022;19:679–682. [DOI] [PMC free article] [PubMed] [Google Scholar]
- Oellien F. Online SMILES Translator. Available from: https://cactus.nci.nih.gov/translate/
- Pettersen EF, Goddard TD, Huang CC, Meng EC, Couch GS, Croll TI, et al. UCSF ChimeraX: structure visualization for researchers, educators, and developers. Protein Sci. 2020;30:70–82. [DOI] [PMC free article] [PubMed] [Google Scholar]
- Pintilie G, Zhang K, Su Z, Li S, Schmid MF, Chiu W. Measurement of atom resolvability in cryo‐EM maps with Q‐scores. Nat Methods. 2020;17:328–334. [DOI] [PMC free article] [PubMed] [Google Scholar]
- Rao SPS, Gould MK, Noeske J, Saldivia M, Jumani RS, Ng PS, et al. Cyanotriazoles are selective topoisomerase II poisons that rapidly cure trypanosome infections. Science. 2023;380:1349–1356. [DOI] [PubMed] [Google Scholar]
- Read RJ, Millán C, McCoy AJ, Terwilliger TC. Likelihood‐based signal and noise analysis for docking of models into cryo‐EM maps. Acta Crystallogr D Struct Biol. 2023;79:271–280. [DOI] [PMC free article] [PubMed] [Google Scholar]
- Reggiano G, Lugmayr W, Farrell D, Marlovits TC, DiMaio F. Residue‐level error detection in cryoelectron microscopy models. Structure. 2023;31:860–869.e4. [DOI] [PMC free article] [PubMed] [Google Scholar]
- Schaefer AJ, Ingman VM, Wheeler SE. SEQCROW: a ChimeraX bundle to facilitate quantum chemical applications to complex molecular systems. J Comput Chem. 2021;42:1750–1754. 10.1002/jcc.26700 [DOI] [PubMed] [Google Scholar]
- Scouras AD, Daggett V. The Dynameomics rotamer library: amino acid side chain conformations and dynamics from comprehensive molecular dynamics simulations in water. Protein Sci. 2011;20:341–352. [DOI] [PMC free article] [PubMed] [Google Scholar]
- Shapovalov MV, Dunbrack RL Jr. A smoothed backbone‐dependent rotamer library for proteins derived from adaptive kernel density estimates and regressions. Structure. 2011;19:844–858. [DOI] [PMC free article] [PubMed] [Google Scholar]
- Terwilliger TC, Liebschner D, Croll TI, Williams CJ, McCoy AJ, Poon BK, et al. AlphaFold predictions are valuable hypotheses, and accelerate but do not replace experimental structure determination. bioRxiv [Internet]: 2022.11.21.517405. Available from: 2023. 10.1101/2022.11.21.517405 [DOI] [PMC free article] [PubMed]
- UniProt Consortium . UniProt: the universal protein knowledgebase in 2023. Nucleic Acids Res. 2023;51:D523–D531. [DOI] [PMC free article] [PubMed] [Google Scholar]
- van Zundert GCP, Rodrigues JPGLM, Trellet M, Schmitz C, Kastritis PL, Karaca E, et al. The HADDOCK2.2 web server: user‐friendly integrative modeling of biomolecular complexes. J Mol Biol. 2016;428:720–725. [DOI] [PubMed] [Google Scholar]
- van Zundert GCP, Trellet M, Schaarschmidt J, Kurkcuoglu Z, David M, Verlato M, et al. The DisVis and PowerFit web servers: explorative and integrative modeling of biomolecular complexes. J Mol Biol. 2017;429:399–407. [DOI] [PubMed] [Google Scholar]
- Varadi M, Anyango S, Deshpande M, Nair S, Natassia C, Yordanova G, et al. AlphaFold protein structure database: massively expanding the structural coverage of protein‐sequence space with high‐accuracy models. Nucleic Acids Res. 2022;50:D439–D444. [DOI] [PMC free article] [PubMed] [Google Scholar]
- Wang J, Wang W, Kollman PA, Case DA. Automatic atom type and bond type perception in molecular mechanical calculations. J Mol Graph Model. 2006;25:247–260. [DOI] [PubMed] [Google Scholar]
- Webb B, Sali A. Comparative protein structure modeling using MODELLER. Curr Protoc Bioinformatics. 2016;54:5.6.1–5.6.37. [DOI] [PMC free article] [PubMed] [Google Scholar]
- Westbrook JD, Shao C, Feng Z, Zhuravleva M, Velankar S, Young J. The chemical component dictionary: complete descriptions of constituent molecules in experimentally determined 3D macromolecules in the protein data Bank. Bioinformatics. 2015;31:1274–1278. [DOI] [PMC free article] [PubMed] [Google Scholar]
- Xing H, Taniguchi R, Khusainov I, Kreysing JP, Welsch S, Turoňová B, et al. Translation dynamics in human cells visualized at high resolution reveal cancer drug action. Science. 2023;381:70–75. [DOI] [PubMed] [Google Scholar]