

Abstract
C3 glomerulopathy (C3G) is a rare complement-mediated disease. Treatments are not yet available and factors predictive of renal survival such as age, renal function and proteinuria are not specific to C3G. The prognostic value of biomarkers of complement activation, which are pathognomonic of the diseases, remain unknown. In a large cohort of 165 patients from the French National registry, we retrospectively assess the prognostic value of C3, soluble C5b-9 (sC5b-9), C3 nephritic factor, and rare disease-predicting variants in complement genes in predicting clinical outcome of patients.
By multivariate analysis age (adult onset), renal failure (defined by eGFR <60ml/min) and presence of rare disease-predicting variants in complement genes predicted risk of progression to end stage kidney disease (ESKD). Moreover, by multivariate analysis, normal C3/high sC5b-9 levels or low C3/normal sC5b-9 levels remains independently associated with a worse renal prognosis, with the relative risk being 3.7 and 8 times higher, respectively. Subgroup analysis indicated that the complement biomarker profiles independently correlated to renal prognosis in patients with adult onset but not pediatric onset. In this subgroup, we showed that profiles of biomarkers C3 and/or sC5b-9 correlated with intra glomerular inflammation and may explain renal outcomes. In children, only the presence of rare disease-predicting variant correlates with renal survival. In adult population, we propose a three-point C3G prognostic score based on biomarkers profiles at risk, eGFR at presentation and genetic findings, which stratifies adult patients into subgroups that require close monitoring and more aggressive therapy.
Keywords: C3 glomerulopathy, C3, sC5b-9, biomarker
INTRODUCTION
C3 glomerulopathy (C3G) is an ultra-rare kidney disease characterized by the predominant deposition of C3 cleavage fragments in the renal glomerulus due to the uncontrolled activation of C3 and C5 convertases of the complement alternative pathway (AP)1. In the majority of C3G patients, convertase overactivity is the result of acquired abnormalities, the most common of which are C3 nephritic factors (C3Nefs). These autoantibodies bind to neoepitopes on the C3 convertase, C3bBb, stabilizing it against the activity of complement regulators, thereby prolonging its C3-cleaving action2,3. To a lesser extent, complement overactivation also results from other auto-antibodies that target factor H (FH), C3b or factor B (FB)4,5 or from variants in complement genes, such as C3, CFH or CFI2,3,6. The clinical features and outcomes of C3G are extremely heterogeneous. In some patients, the disease is stable for decades while in others rapidly progressive glomerulonephritis leads to end-stage kidney disease (ESKD) in only a few years1. Despite recent important advances in our understanding of the underlying pathophysiology, predicting these differences in outcome remains difficult. Nonspecific clinical factors common to all glomerulopathies such as age, renal function and proteinuria at onset are associated with renal outcome7–10. To the contrary, biomarkers of C3 and C5 convertase activation such as a low C3 level, which is found in 50–70% of patients, or a high soluble C5b-9 level (sC5b-9), which is found in 40–60%, have yet to be identified as predictive factors of renal survival7–10. In an experimental model of C3G, mice homozygous for the targeted deletion of Cfh show overactivity of both C3 convertase and C5 convertase11,12. Intriguingly, with the additional loss of properdin, the sole positive regulator of AP, as seen in the Cfh−/−Cfp−/−mouse, C3 convertase activity increases but C5 convertase activity does not – and there is an increase in glomerular inflammation and progression to end stage renal disease13. This observation suggests that equilibrium between activation of both C3 and C5 convertase may adversely impact prognosis.
In this study, we analyzed a large cohort of children and adult patients from the French national registry using C3 and sC5b-9 levels at disease onset as measures of C3 and C5 convertase activity and show for the first time that complement biomarkers strongly and independently predict renal survival in adults. Correlation of biomarkers and kidney biopsy finding highlight the contribution of complement activation to renal prognosis.
METHODS
Study population
Patients referred to the Laboratory of Immunology (European Hospital Georges Pompidou) for complement exploration in the context of C3G glomerulopathy between 2002–18 were eligible for inclusion in this study if they met the following criteria: 1) C3G on biopsy of native kidney; 2) negativity for hepatitis B or C serology, antinuclear antigen autoantibodies, anti- double-stranded DNA antibodies, hemopathy, monoclonal gammopathy or cryoglobulinemia 3) complement assays with C3 and sC5b-9 levels at the time of kidney biopsy (Figure 1). The diagnosis of C3G was made by immunofluorescence following consensus recommendations, with bright diffuse predominant C3 glomerular staining of at least two orders of magnitude greater than any other immune reactant (i.e. Ig)14. We considered the time of first diagnostic biopsy to be baseline for all patients. Estimated glomerular filtration rate (eGFR) was calculated using the CKD Epidemiology Collaboration (CKD EPI) creatinine equation15. For children, Estimated glomerular filtration rate (eGFR) was calculated using schwartz formula. Impaired renal function was defined by an estimated Glomerular Filtration Rate (eGFR) value of 60 mL/min/m or less. Nephrotic range proteinuria was defined using KDIGO guidelines by urinary protein excretion of 3.5/day or more or a urine protein-to-creatinine ratio of 3 g/g and 3+ on urine dipstick in children16. The local ethics committee approved the study and all patients gave written informed consent.
Figure 1: Patients’ recruitment.

Flowchart of inclusion of patients within the population of the French C3 Glomerulopathy registry (n=402). A total of 165 patients were eligible for enrollment in the study, based on the availability of C3 and sC5b-9 level at the time of kidney biopsy.
Assays for complement component and complement genes analysis
EDTA plasma samples were obtained from all patients. Plasma protein concentrations of C3, C4 were measured by nephelometry (Dade Behring, Deerfield, IL, USA). Soluble C5b-9 level determination was done using the MicroVue sC5b-9 Plus EIA Assay (Quidel, San Diego, CA), according to manufacturer instructions. Soluble C5b-9 was considered elevated if > mean+4SD of 80 healthy donors (460ng/mL). Anti-Factor H antibodies and C3Nef and C5Nef were screened as previously described described17,18. Direct sequencing of all CFH, CFI, CD46 and C3 exons was completed in 143/165 (87%) patients with available DNA, as previously described18. Only rare variants in complement gene defined by MAF <0.1% (minor allele frequency) were reported here. Variants were classified as pathogenic or of undetermined significance (VUS) using criteria presented in supplementary methods.
Pathological study
The kidney biopsy report was used to collect relevant variables, including GN patterns on light microscopy (membranoproliferative glomerulonephritis MPGN, mesangial proliferative GN, diffuse endocapillary proliferative GN). For endocapillary hypercellularity, we used a scale of 0=none, 1=1–25%, 2=26–50%, and 3= >50% to grade involvement of sampled glomeruli. For crescent formation, we gave the percentage of glomeruli with cellular crescent formation. For interstitial inflammation, we gave the percentage of interstitial infiltration in non-scarred area. For interstitial fibrosis/tubular atrophy (IFTA), we used a scale of 0= <10%, 1=10–25%, 2= 26–50%, and 3=>50% based on percentage of involved tubulointerstitial area. Global glomerulosclerosis was assigned a score of 0 to 3 based on percentage involvement (0, 1 <25%, 2 26–50%, 3 >50%).
Statistical Analyses
Statistical analyses were performed using the Mann-Whitney and Kruskal-Wallis tests, as appropriate, for comparison of continuous variables and using Chi-square or Fisher’s exact tests for comparison of categorical variables. Renal survival was determined using Log Rank test. P-values below 0.05 were considered significant. Modeling for predictors of ESKD was conducted using Cox proportional hazards methods.
We used Cox proportional hazards models over the entire duration of follow-up. The time of the first diagnostic biopsy was considered the start of follow-up. We first fitted univariate models for initial analyses and included variables with univariate p-values below 0.1 in multivariate models. Univariate models were evaluated on the following variables collected at the time of biopsy: age, gender, creatinine, eGFR and proteinuria, C3 and sC5b-9 levels, presence of a complement-associated gene variant or C3NeF, and use of immunosuppressive therapy. For C3/sC5b9 status, the reference level for Cox models was set to Normal C3/normal sC5b-9 level.
RESULTS
Clinical features and laboratory evaluation at the time of kidney biopsy and renal survival of C3G patients
One-hundred sixty-five patients including 64 (42%) children and 101 (58%) adults were enrolled in this study (Figure 1). Median time (IQR) between disease onset and kidney biopsy was 0.2 years (0–1). At the time of kidney biopsy, median age (IQR) was 20 years (10–39). Median proteinuria (IQR) was 3.1g/day (1.95–7.2) with nephrotic range proteinuria in 52% of patients. Median eGFR was 65ml/min/1.73m2. Seventy-one of 151 (47%) patients had eGFR below 60ml/min/1.73m2 (Table 1). Compared to patients with adult onset, patients with onset as a child were more frequently female and tend to have a better eGFR at diagnosis (Table 1).
Table 1:
Clinical and immunological features of 165 patients with C3 Glomerulopathy including 64 children and 101 adults
| Nb | All patients 165 |
Children 64 |
Adults 101 |
||
|---|---|---|---|---|---|
| Clinical data at diagnosis | |||||
| Sex (% of male) | 165 | 82 (50%) | 25 (39%) | 57 (56%) | 0.01 |
| Age (years) | 165 | 20 [10–39] | 8[6–11] | 33[21–54] | <0.0001 |
| Proteinuira g/day | 96 | 3,1 [1.9–6.4] | 3[1.6–5.4] | 3.5[2.3–6.6] | 0.72 |
| Nephrotic range proteinuria | 143 | 67 (47%) | 23/56 (41%) | 34/85 (40%) | 0.13 |
| Estimated GFR (ml/min/1.73 m2) | 151 | 65 [28–100] | 80 [40–100] | 56 [28–100] | 0.11 |
| Stage 3–5 CKD n (%) | 151 | 71 (47%) | 25/61 (41%) | 46/90 (51%) | 0.22 |
| Immunological data at diagnosis | |||||
| C3 (660 to 1250 mg/L) | 165 | 557 [257–879] | 443[192–847] | 578[311–1680] | 0.08 |
| Low C3 (<660 mg/L) (%) | 165 | 97 (59%) | 40/64 (63%) | 57/101 (56%) | 0.51 |
| Soluble C5b-9 (ng/mL) | 165 | 482 [310–849] | 488[323–868] | 482[289–847] | 0.72 |
| High sC5b-9 (>460ng/mL) (%) | 165 | 84 (51%) | 33 (52%) | 51 (50%) | 0.99 |
| C4 (93 to 380 mg/L) | 154 | 226[169–286] | 222[151–274] | 234[179–296] | 0.42 |
| Factor H level (% of normal) | 144 | 105 [82–124] | 104[82–126} | 105[83–123] | 0.85 |
| Factor H (<65% of the normal) (%) | 142 | 6 (6%) | 1/50 (2%) | 5/92 (5%) | 0.33 |
| Factor I level (% of the normal) | 142 | 109[95–124] | 114[99–130] | 105[92–120] | 0.12 |
| Low Factor I (<) (%) | 142 | 4 (3%) | 2/50 (4%) | 2/92 (2%) | 0.52 |
| C3NeF n (%) | 161 | 90 (56%) | 50/64 (78%) | 40/99 (40%) | <0.0001 |
| C5NeF n (%) | 92 | 35 (38%) | 20/43 (47%) | 15/51 (29%) | 0.13 |
| Anti-FH auto-antibodies n (%) | 154 | 22 (14%) | 11/56 (19%) | 11/98 (11%) | 0.15 |
| rare/pathogenic variant | 140 | 26 (19%) | 9/53 (17%) | 17/87 (20%) | 0.82 |
| Follow-up | |||||
| Median Follow-up (months) | 162 | 47 [19–82] | 60 [20–99] | 36[16–75] | 0.02 |
| ESKD n (%) | 162 | 46 (28%) | 11/62 (18%) | 35/100 (35%) | 0.02 |
| Duration of evolution until ESKD (months) | 22 [9–77] | 30[18–88] | 21[6–66] | 0.33 | |
Abbreviations:, CKD, chronic kidney disease, ESKD, end stage kidney disease; eGFR, Estimated Glomerular Filtration Rate, FH, factor H, sC5b9: soluble C5b9
Results are expressed as median plus interquartile (IQR).
Immunological data of patients are provided in Table 1. Median time between disease onset and first complement screening (time of kidney biopsy) was 0.2 (0–1) year. C3 levels (<660mg/L) were low in 97 (59%) patients with a median C3 level (IQR) of 557 (257–879) mg/L. Soluble C5b-9 levels were increased in 84 (51%) patients with a median sC5b-9 level of 482 (310–849). C4 levels were within the normal range in all patients except 2. By hemolytic assay, C3NeFs and C5NeFs were positive in 90 of 161 (56%) and 35 of 92 (38%) tested patients, respectively. Anti-factor H were identified in 22 of 154 (14%) tested patients. Rare disease-predicting variants in complement genes C3, CFH and CFI were found in 26 of 140 (19%) tested patients including 4 patients with familial history of glomerulopathy; 17 patients carried known pathogenic variants and 9 patients carried rare variants of undetermined significance (VUS) (Table S1). Differences of immunological features between adults and children are detailed in table 1. C3 level tended to be lower and proportion of patients positive for C3NeF significantly higher in children than adults (p= 0.08 and <0.0001 respectively).
Clinical and immunological characteristics of patients according to C3 and sC5b-9 levels
Patients were subdivided into one of four groups based on C3 and sC5b-9 levels: patients with low C3/normal sC5b9 (n=34 (20.6%)), patients with low C3/high sC5b (n=63 (38.2%), patients with normal C3/normal sC5b-9 levels (n=47 (28.5%)), and patients with normal C3/high sC5b-9 (n=21 (12.7%)) (Table S2). In children and adults, proportion of patients belonging to in each group of biomarkers was comparable (Table 2 and 3).
Table 2:
Clinical data at diagnosis and outcomes of 64 children based on biomarkers of convertases activity
| Low C3 normal sC5b-9 |
low C3 high sC5B-9 |
Normal C3 normal sC5b-9 |
Normal C3 High sC5b-9 |
p value | |
|---|---|---|---|---|---|
| Patients (Nb) | 14 (21.8%) | 26 (40.6%) | 17 (26.5%) | 7 (10.9%) | 0.001 |
| Clinical data at diagnosis | |||||
| Sex (% of male) | 6/14 (43%) | 10/26 (38%) | 8/17 (47%) | 1/7 (14%) | 0.50 |
| Age (years) | 6[3.5–10] | 9[6–13] | 7 [5–10] | 8[7–11] | 0.09 |
| Proteinuira (g/day) | 3[1.7–4.8] | 3.8[0.9–10.5] | 2.5[1.6–3] | 2.3 [1.5–4.8] | 0.76 |
| Nephrotic range proteinuria | 5/11 (45%) | 13/24 (54%) | 4/14 (29%) | 2/7 (29%) | 0.38 |
| Estimated GFR (ml/min/1.73 m2) | 73 [44–100] | 100 [50–100] | 80 [15–100] | 20 [10–100] | 0.28 |
| Stage 3–5 CKD n (%) | 7/14 (50%) | 6/23 (26%) | 7/17 (41%) | 5/7 (71%) | 0.15 |
| Immunological data at diagnosis | |||||
| C3 level (660 to 1250 mg/L) | 311 [173–469] | 257[103–379] | 989 [739–1015] | 902 [816–1260] | <0.0001 |
| Low C3 level (<660 mg/L) (%) | 100% | 100% | 0 (0%) | 0 (0%) | <0.0001 |
| Soluble C5b-9 (ng/mL) | 368 [273–409] | 1006[627–1716] | 251 [222–379] | 618 [542–798] | <0.0001 |
| High sC5b-9 (>460ng/mL) (%) | 0 (0%) | 100% | 0% | 100% | <0.0001 |
| C4 level (93 to 380 mg/L) | 178 [123–267] | 202[140–280] | 222[157–268] | 265[233–360] | 0.15 |
| Factor H level (% of normal) | 88 [69–128] | 97 [82–117) | 104 [81–123] | 121 [115–142] | 0.12 |
| Factor I level (% of the normal) | 112 [96–132] | 114 [94–130] | 105 [99–114] | 129 [124–147] | 0.10 |
| C3NeF n (%) | 12/14 (86%) | 21/26 (81%) | 13/17 (76%) | 4/7 (57%) | 0.49 |
| C3NeF % of stabilisation | 81 [46–152] | 83 [45–105] | 68 [30–141] | 121 [115–130] | 0.38 |
| C5NeF n (%) | 5/10 (50%) | 9/18 (50%) | 3/12 (25%) | 3/3 (100%) | 0.12 |
| Anti-FH auto-antibodies n (%) | 2/11 (18%) | 4/24 (17%) | 2/15 (13%) | 3/6 (50%) | 0.26 |
| Variant in complement gene n (%) | 2/11 (18%) | 4/24 (17%) | 3/12 (25%) | 0/6 (0%) | 0.62 |
| First line therapy | |||||
| Immunosuppressive treatment n (%) | 10/12(83%) | 23/24 (96%) | 16/16 (100%) | 5/7 (71%) | 0.08 |
| Monoclonal anti-C5 n (%) | 0/10 (0%) | 6/23 (26%) | 1/16 (6%) | 1/5 (20%) | 0.16 |
| Follow-up | |||||
| Median Follow-up (months) | 38 [14–69] | 77 [48–104] | 34 [19–85] | 89 [18–105] | 0.14 |
| ESKD n (%) | 4/14 (29%) | 4/25 (16%) | 2/17 (12%) | 1/7 (14%) | 0.64 |
| Duration of evolution until ESKD (months) | 20 [12–40] | 84 [34–96] | 67 [30–106] | 18 | 0.25 |
Abbreviations: CKD, chronic kidney disease stage, FH, factor H, sC5b9: soluble C5b9, IQR, interquartile, ESKD, end stage kidney disease; eGFR, estimated Glomerular Filtration Rate, MPGN, membranoproliferative glomerulonephritis.
Table 3:
Clinical data at diagnosis and outcomes of 101 adults based on biomarkers of convertases activity
| Low C3 normal sC5b-9 |
low C3 high sC5B-9 |
Normal C3 normal sC5b-9 |
Normal C3 High sC5b-9 |
p value | |
|---|---|---|---|---|---|
| Patients (Nb) | 20 (19.8%) | 37 (36.6%) | 30 (29.7%) | 14 (13.8%) | 0.0008 |
| Clinical data at diagnosis | |||||
| Sex (% of male) | 9/20 (45%) | 22/37 (59%) | 18/30 (60%) | 8/14 (57%) | 0.71 |
| Age (years) | 33[21–48] | 25[20–42] | 39 [25–64] | 41[24–62] | 0.04 |
| Proteinuira (g/day) | 3[2.5–6.2] | 4.4 [2.3–7.6] | 3.3[2.2–6.7] | 3.5 [1.2–9.1] | 0.85 |
| Nephrotic range proteinuria | 8/18 (44%) | 18/32 (56%) | 12/27 (44%) | 5/10 (50%) | 0.79 |
| Estimated GFR (ml/min per 1.73 m2) | 42 [17–100] | 86 [36–100] | 64 [32–98] | 31 [17–58] | 0.08 |
| Stage 3–5 CKD n (%) | 11/26 (42%) | 12/30 (40%) | 14/29 (48%) | 9/12 (75%) | 0.20 |
| Immunological data at diagnosis | |||||
| C3 level (660 to 1250 mg/L) | 463 [213–576] | 314 [182–475] | 913 [722–1015] | 1034 [777–1250] | <0.0001 |
| Low C3 level (<660 mg/L) (%) | 100% | 100% | 0 (0%) | 0 (0%) | <0.0001 |
| Soluble C5b-9 (ng/mL) | 273 [234–390] | 964[783–1803] | 317 [220–399] | 630 [502–682] | <0.0001 |
| High sC5b-9 (>460ng/mL) (%) | 0 (0%) | 100% | 0% | 100% | <0.0001 |
| C4 level (93 to 380 mg/L) | 221 [149–269] | 215[179–280] | 264[196–317] | 254[191–334] | 0.15 |
| Factor H level (% of normal) | 105 [67–115] | 103 [78–124) | 106 [89–124] | 114 [101–138] | 0.43 |
| Factor I level (% of the normal) | 98 [92–111] | 104 [86–125] | 109 [93–120] | 119 [97–140] | 0.096 |
| C3NeF n (%) | 12/20 (60%) | 22/36(61%) | 3/30 (10%) | 3/13 (23%) | <0.0001 |
| % of stabilisation | 60 [33–92] | 49 [33–81] | 26 [26–26] | 36 [21–456] | 0.52 |
| C5NeF n (%) | 2/10 (20%) | 11/23 (48%) | 0/13 (0%) | 2/5 (40%) | 0.02 |
| Anti-FH auto-antibodies n (%) | 4/19 (21%) | 3/36 (8%) | 0/29 (0%) | 1/14 (7%) | 0.08 |
| Rare/pathogenic variant n (%) | 2/18 (11%) | 5/32 (16%) | 6/23 (26%) | 4/14 (29%) | 0.15 |
| First line therapy | |||||
| Immunosuppressive treatment n (%) | 9/15 (60%) | 23/31 (74%) | 9/21 (43%) | 7/12 (58%) | 0.11 |
| Monoclonal anti-C5 n (%) | 4/9(44%) | 5/23 (22%) | 1/9 (11%) | 1/7 (14%) | 0.34 |
| Follow-up | |||||
| Median Follow-up (months) | 48 [8–72] | 51 [22–89] | 30 [12–70] | 21 [3–40] | 0.13 |
| ESKD n (%) | 11/19 (58%) | 13/37 (35%) | 4/30 (13%) | 7/14 (50%) | 0.004 |
| Duration of evolution until ESKD (months) | 26 [1–76] | 44[18–89] | 37 [14–99] | 3 [1–20] | 0.059 |
Abbreviations: CKD, chronic kidney disease stage, FH, factor H, sC5b9: soluble C5b9, IQR, interquartile, ESKD, end stage kidney disease; eGFR, estimated Glomerular Filtration Rate, MPGN, membranoproliferative glomerulonephritis.
Clinical and immunological characteristics of children and adults according to the profiles of biomarkers are provided in Table 2 and Table 3 respectively (Table S2 for all patients). In children, clinical and immunological features were similar between the four groups of patients (table 2). In adults, age, eGFR (tendance), proportion of patients with C3NeF/C5Nef and renal outcomes was different among the 4 groups. Adults with low C3/high sC5b-9 were younger (p=0.04), estimated GFR tended to be worser in patients with normal C3/high sC5b-9 (p=0.08). Proportion of patients with C3Nef was significantly high in adults with low C3 level (p<0.0001) and that of patients positive for C5Nef significantly higher in the 2 groups of patients with high sC5b-9 (p=0.04). At last follow up, percentage of adults reaching ESKD was significantly higher among patients with normal C3/high sC5b-9 or low C3/normal sC5b-9 (p=0.04). The percentage of patients with genetic abnormalities were similar among the 4 groups of patients (Table 2 and 3). In children, among patients with low C3 levels, C3 level was comparable in patients with high sC5b-9 than normal sC5b-9 level (p=0.31) (Figure 2A). Soluble C5b-9 levels significantly differed among the 4 groups of patients (Figure 2C). In adults, among patients with low C3 level, C3 level tended to be lower in patients with high sC5b-9 level (p=0.08) (figure 2B). In adults, among patients with high sC5b-9 level, sC5b-9 was significantly higher in patients with low C3 level (p=0.0003) (Figure 2D).
Figure 2: Biomarkers of complement activation, C3 and sC5b-9 levels in C3 Glomerulopathy patients with onset as a child or as an adult.

Four groups of patients were identified using C3 and sC5b-9 levels including patients with low C3 and high sC5b9 levels, low C3 and normal sC5b-9 levels, patients with normal C3 and normal sC5b-9 levels and patients with normal C3 and high sC5b-9 levels.
Treatments and renal outcomes
As first line therapy, 104 of 138 (75%) patients with available data received immunosuppressive therapy, including anti-complement therapy (Eculizumab) in 19 (18%). In adults and children, there was no difference among the 4 groups of patients regarding first line therapeutic strategies (Table 4 and 5).
Table 4:
First line therapy in children
| low C3 | low C3 | Normal C3 | Normal C3 | P value | |
|---|---|---|---|---|---|
| normal sC5b-9 | high sC5B-9 | normal sC5b-9 | high sC5b-9 | ||
| First line therapy | |||||
| No treatment | 2/12 (17%) | 1/23 (4%) | 1/17 (6%) | 2/7 (29%) | 0.22 |
| Immunosuppresive treatment n (%) | 10/12 (83%) | 22/23 (96%) | 16/17 (94%) | 5/7 (71%) | 0.22 |
| Corticosteroids alone n (%) | 4/12 (33%) | 10/23 (43%) | 9/16 (56%) | 2/5 (40%) | 0.67 |
| Rituximab-based regimen n (%) | 3/12 (25%) | 2/23 (7%) | 0/16 (0%) | 0/5 (0%) | 0.11 |
| Cyclophosphamid-based regimen | 1/12 (8%) | 0/23(0%) | 1/16 (6%) | 0/5 (0%) | 0.53 |
| Mycofenolate mofetil-based regimen n (%) | 2/12 (17%) | 5/23 (22%) | 5/16 (31%) | 2/5 (40%) | 0.68 |
| Monoclonal anti-C5 n (%) | 0/12 (0%) | 6/23 (26%) | 1/16 (6%) | 1/5 (20%) | 0.13 |
| Second line therapy | 3/12 (25%) | 11/23 (48%) | 4/16 (25%) | 1/5 (20%) | 0.33 |
| Monoclonal anti-C5 n (%) | 3/3 (100%) | 8/11 (73%) | 1/16 (6%) | 0/1 | 0.0005 |
| Others n (%) | 0 (0%) | 3/11(27%) | 3/16 (19%) | 1/1 | 0.24 |
Table 5:
fisrt line therapy in adults
| low C3 | low C3 | Normal C3 | Normal C3 | P value | |
|---|---|---|---|---|---|
| normal sC5b-9 | high sC5B-9 | normal sC5b-9 | high sC5b-9 | ||
| First line therapy | |||||
| No treatment | 6/15 (40%) | 8/32 (25%) | 9/20 (45%) | 5/12 (42%) | 0.44 |
| Immunosuppresive treatment n (%) | 9/15 (40%) | 24/32 (75%) | 11/20 (55%) | 7/12 (58%) | 0.44 |
| Corticosteroids alone n (%) | 1/9 (11%) | 6/23 (26%) | 3/11 (27%) | 4/7 (57%) | 0.23 |
| Rituximab-based regimen n (%) | 1/9 (11%) | 3/23 (13%) | 0/11 (0%) | 2/7 (29%) | 0.34 |
| Cyclophosphamid-based regimen | 1/9 (11%) | 0/23 (0%) | 1/11 9%) | 0/7 (0%) | 0.36 |
| Mycofenolate mofetil-based regimen n (%) | 3/9 (33%) | 9/23 (39%) | 6/11 (55%) | 0/7 (0%) | 0.12 |
| Monoclonal anti-C5 n (%) | 3/9 (33%) | 5/23 (22%) | 1/10 (10%) | 1/7 (14%) | 0.61 |
| Second line therapy | 1/9 (11%) | 4/23 (17%) | 2/10 (20%) | 0/7 (0%) | 0.63 |
| Monoclonal anti-C5 n (%) | 1/1 | 2/4 | 0/2 | - | |
| Others n (%) | 0 | 2/4 | 2/2 | - |
Renal outcome at follow up was available for 163 patients. Median follow up (IQR), censored for ESKD achievement was 47 (19–82) months. At last follow up, 46/163 (28%) patients had progressed to ESKD, including 11 children and 35 adults (Table 1). Percentage of patients reaching ESKD was significantly higher in adults than children.
Median renal survival of all patients was 144 months (Figure S1A), significantly better in children than adults (figure 3A). Renal survival was not different when stratified by C3 levels only (normal or low) in all patients, adults or children (Figure S1B–D) or sC5b-9 levels (normal or high) (Figure S1E–G). Percentage of patients reaching ESKD was significantly higher in patients with low C3/normal sC5b-9 level (15/33 (45%) or normal C3/high sC5b-9 level (8/21 (38%) compared to patients low C3/high sC5b-9 17/62 (27%) or normal C3/normal sC5b-9 (6/47 (13%)) (p=0.009) (Table 2) with median renal survival ranging from 76 to 144 months, and being better in patients with normal C3/normal sC5b-9 or low C3/high sC5b-9 levels (p=0.01) (Figure S2). In children, renal survivals were comparable among the four groups (figure 3B) whereas they were significantly different in adults according to the profiles of biomarkers (p=0.029) (figure 3C).
Figure 3: Renal survival of patients with C3 glomerulopathy according to complement activation biomarkers profiles.
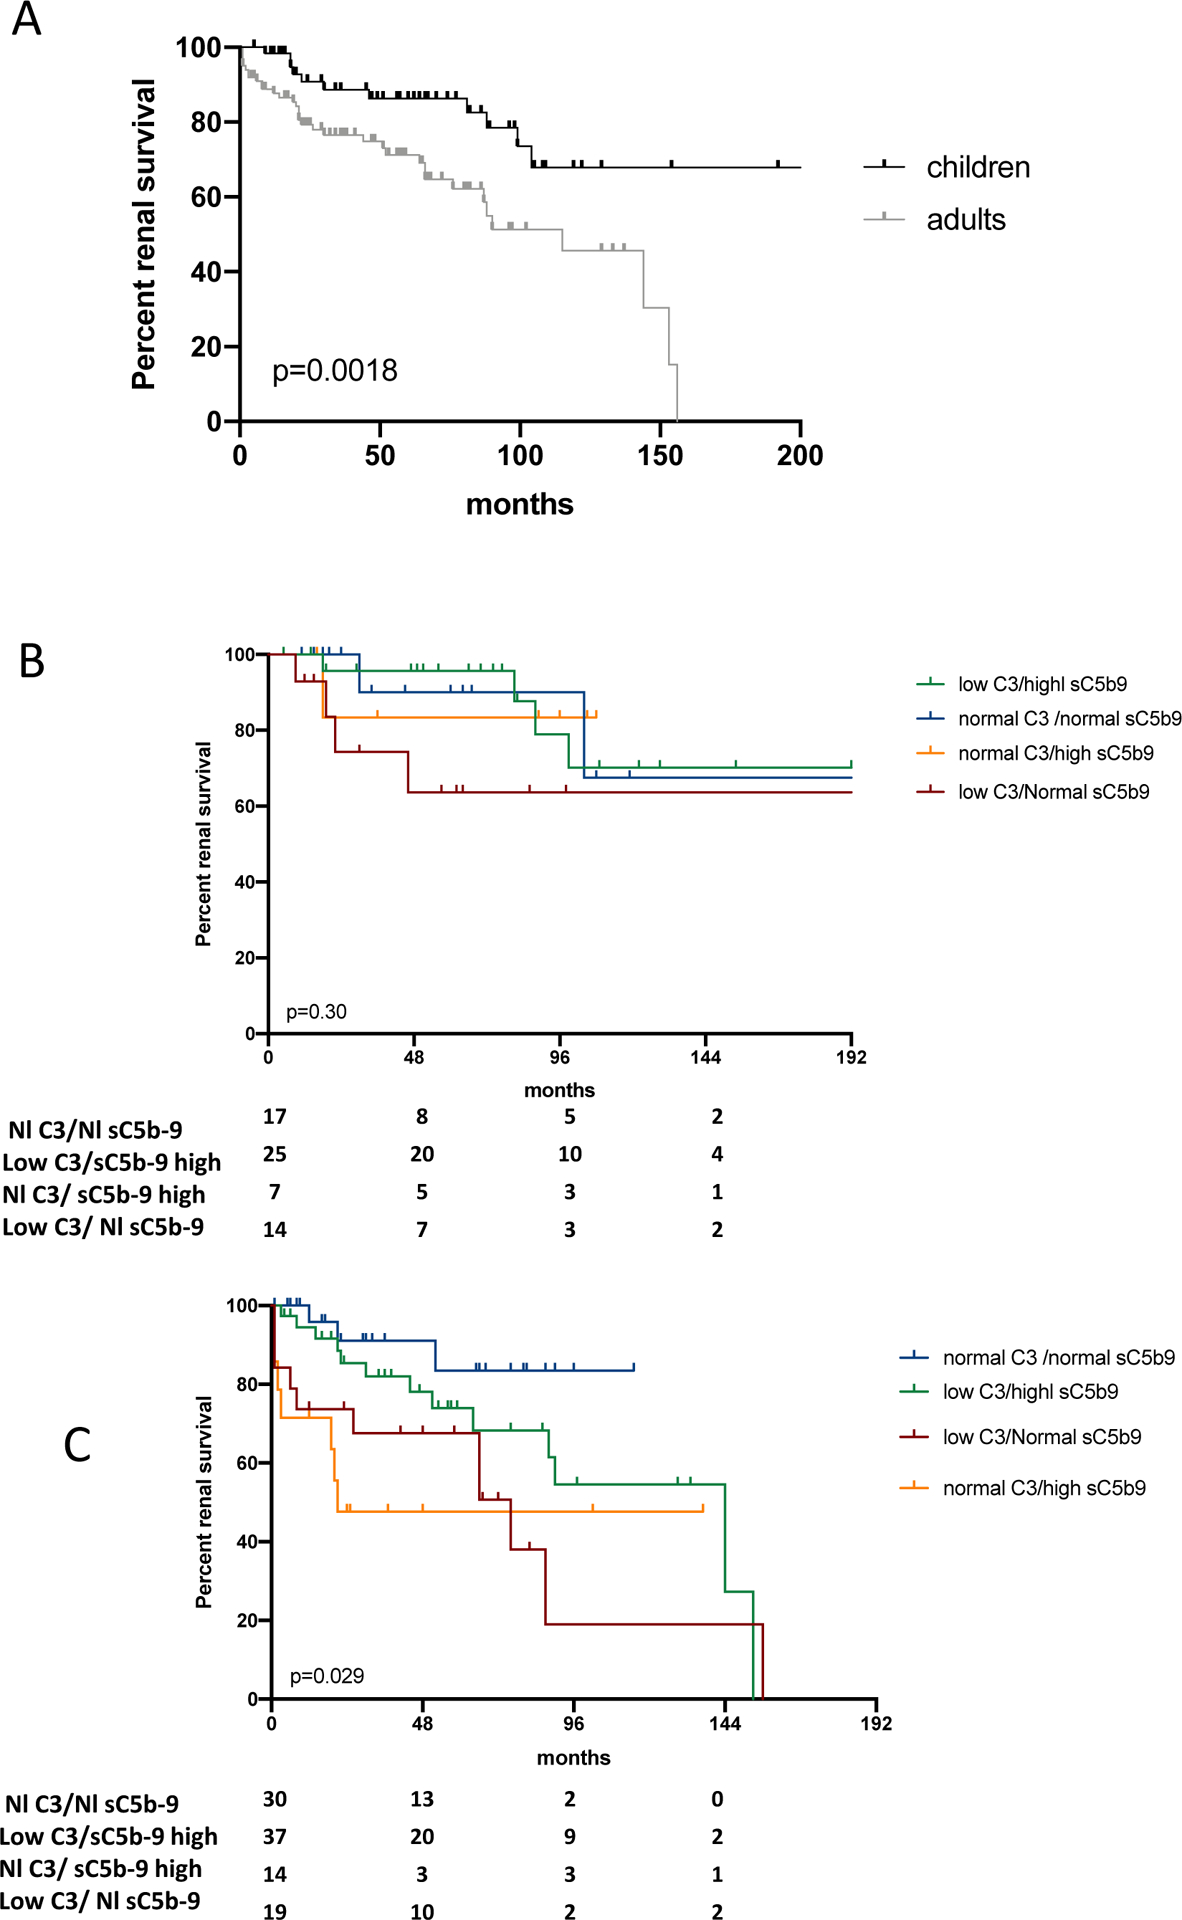
A- Kaplan-Meier patient survival analysis of patients with C3 glomerulopathy comparing patients according to age at diagnosis. Renal survival of patients with disease onset as a child was significantly better that those with disease onset as an adult (p=0.0018). B) Kaplan-Meier patient survival analysis comparing children patients with C3 glomerulopathy according to the 4 profiles of complement activation biomarkers. In children, renal survivals of patients with low C3/high sC5b-9, low C3/normal sC5b-9 or normal C3/high sC5b-9 were comparable to renal survival of patients with normal C3/normal sC5b-9 (p=0.96; p=0.96; p=0.19 respectively). Renal survival of children with low C3/high sC5b-9 tended to be better than patients with low C3/normal sC5b-9 (p=0.09) and was significantly better than patients with normal C3/high sC5b-9 (p=0.02). C) Kaplan-Meier patient survival analysis comparing adults patients with C3 glomerulopathy according to the 4 profiles of complement activation biomarkers. In adult only, renal survival between adults with normal C3/normal sC5b-9 was similar to that of patients with low C3/high sC5b-9 (p=0.18). Renal survival of patients with low C3/normal sC5b-9 or normal C3/high sC5b-9 were significantly lower compared to patients with normal C3/normal sC5b-9 (p=0.005 and p=0.02 respectively). Renal survival of patients with low C3/high sC5b-9 levels was similar to that of patients with low C3/normal sC5b-9 (p=0.17) and was significantly better than that of patients with normal C3/high sC5b-9 (p=0.036).
Predictive factors of ESKD: Impact of biomarkers of complement activation on renal outcome.
Univariate and multivariate analyses predicting factors of renal survival were analysed by univariate and multivariate model in the whole cohort (Figure S3) and in children or adults separately. In the whole cohort, pediatric onset was associated with lower risk for ESKD. Compared to patients with normal C3/normal sC5b-9 levels, normal C3/high sC5b-9 level (OR 3.12; 95% CI, 1.1 to 9 ; p=0.036) and low C3/normal sC5b-9 (OR 3.46; 95% CI, 1.3 to 9 ;p=0.01) were predictive of ESKD. Positivity of C3Nef tended to be associated with better outcomes (Figure S3A). By multivariate analysis, pediatric onset estimated GFR<60ml/min/1.73m2 (HR 6.03; p<0.0001), presence of a rare disease-predicting variant (HR 5.61; p<0.0001), normal C3/high sC5b-9 (HR 3.74, p=0.033) and low C3/normal sC5b-9 (HR 8.05, p p<0.0001) remained independently associated with higher risk of progression to ESKD (Figure S3B).
Subgroup multivariate analysis by age of onset showed that the presence of a rare disease-predicting variant tended to be the sole prognostic factor associated with ESKD in children (Table 6 and Figure 4A), while in adults, normal C3/high sC5b-9 level (HR 5.47, 95%CI 1.3–23; p=0.02), low C3/normal sC5b-9 (HR 9.42, 95%CI 2.1–42; p=0.0033), rare disease-predicting variant (HR 6.17; 95%CI2.3–17; p=0.0003), eGFR<60ml/min (HR 8.13, 95%CI 2.7–24; p=0.00017) remained independently associated with a higher risk of progression to ESKD. Low C3/high sC5b-9 level tend to be associated with higher risk of progression to ESKD (HR 3.91, 95%CI 0.95–16; p=0.06) (Table 7 and figure 4b–C).
Table 6 :
univariate analysis in children
| annotation | nb | n.event | H.R. | 95%C.I. | p-value |
|---|---|---|---|---|---|
| Male | 64 | 11 | 0,657 | 0.17–2.5 | 0,54 |
| eGFR<60ml/min/1,73m2 | 61 | 11 | 2,15 | 0.63–7.4 | 0,22 |
| nephrotic range proteinuria | 56 | 10 | 1,06 | 0.31–3.7 | 0,92 |
| Pu > 1.5/day | 48 | 7 | 0,659 | 0.078–5.6 | 0,7 |
| Immunosuppressors | 59 | 11 | 0,843 | 0.11–6.6 | 0,87 |
| C3NeF | 64 | 11 | 2,09 | 0.27–16 | 0,48 |
| Rare/pathogenic variant | 53 | 11 | 3,22 | 0.98–11 | 0,054 |
| C3C5status : Low C3 High C5b9 | 64 | 11 | 1,02 | 0.19–5.6 | 0,98 |
| C3C5status : Low C3 Normal C5b9 | 64 | 11 | 3,14 | 0.57–17 | 0,19 |
| C3C5status : Normal C3 High C5b9 | 64 | 11 | 0,925 | 0.083–10 | 0,95 |
Abbreviations: eGFR, estimated glomerular filtration rate; Pu, proteinuria,
Nb, number of patients with available information, n.event, number of patients reaching ESKD, H.R, Hazard Ratio;
Figure 4: Forest plot of the hazard for End Stage renal Disease progression.


A) Univariate models adjusted for sex gender (male), age at onset, onset <16 years old, renal failure (eGFR<60ml/min) at onset, level of proteinuria, nephrotic range proteinuria, immunosuppressive therapy, level of C3 or sC5b-9, presence of C3NeF or rare variant in complement genes factor H, factor I or C3 and presence of biomarkers of complement activation. B) Multivariate model adjusted for age onset (<16 y), renal failure at onset, C3NeF, rare variant in complement genes and presence of complement activation biomarkers.
Table 7:
Univariate and multivariate analysis in C3G patients with adult onset
| n | n.event | H.R. | 95%C.I. | p-value | |
|---|---|---|---|---|---|
| UNIVARIATE ANALYSIS | |||||
| Male | 101 | 35 | 0,52 | 0.26–1.1 | 0,069 |
| eGFR<60ml/min/1.73m2 | 90 | 31 | 9,5 | 3.3–28 | 0,000037 |
| nephrotic range proteinuria | 85 | 29 | 1,26 | 0.59–2.7 | 0,55 |
| Pu > 1.5/day | 78 | 28 | 1,3 | 0.44–3.8 | 0,63 |
| Immunosuppressors | 78 | 29 | 0,795 | 0.36–1.7 | 0,57 |
| C3NeF | 99 | 33 | 0,614 | 0.29–1.3 | 0,2 |
| rare/pathogenic variant | 87 | 33 | 2,54 | 1.2–5.4 | 0,017 |
| C3C5status : Low C3 High sC5b-9 | 101 | 35 | 1,94 | 0.63–6 | 0,25 |
| C3C5status : Low C3 Normal sC5b-9 | 101 | 35 | 3,48 | 1.1–11 | 0,037 |
| C3C5status : Normal C3 High sC5b-9 | 101 | 35 | 4,79 | 1.4–16 | 0,013 |
| MULTIVARIATE ANALYSIS | |||||
| eGFR<60ml/min/1.73m2 | 78 | 29 | 8.13 | 2.7–24 | 1.7e-04 |
| C3C5 status: Low C3 High sC5b-9 | 78 | 29 | 3.91 | 0.95–16 | 0.06 |
| C3C5 status: Low C3 Normal sC5b-9 | 78 | 29 | 9.42 | 2.1–42 | 3.3e-03 |
| C3C5 status: Normal C3 High sC5b-9 | 78 | 29 | 5.47 | 1.3–23 | 0.02 |
| rare/pathogenic variant | 78 | 29 | 6.17 | 2.3–17 | 3.4e-04 |
| Male | 78 | 29 | 0.738 | 0.34–1.6 | 0.45 |
Abbreviations: eGFR, estimated glomerular filtration rate; Pu, proteinuria,
Nb, number of patients with available information, n.event, number of patients reaching ESKD, H.R, Hazard Ratio.
Correlations between biomarkers of complement activation and kidney lesions
Acute lesions (i.e. % crescents) or chronic lesions (i.e. % sclerosed glomeruli, % IFTA) on kidney biopsy have been correlated with renal prognosis in C3G10,19. In the present study, complement biomarkers correlated with renal prognosis in adults. We retrospectively analyzed kidney reports from 79/101 adult patients with complete available data and found that the percentage of globally sclerotic glomeruli and IFTA fibrosis were similar among the four groups (Table 8). By light microscopy, MPGN was more frequent in patients with low C3/high sC5b-9 (p=0.05), and mesangial proliferative glomerulonephritis was more frequent in patients with normal C3 levels (p=0.004). Endocapillary proliferation was more pronounced in patients with low C3 level (p=0.04) and crescents were more frequent in patients with low C3/normal sC5b-9 or normal C3/high sC5b-9 (p=0.0026). Presence of interstitial inflammation tend to be more frequent in patients normal C3/high sC5b-9 or low C3/normal sC5b-9 (p=0.056). Concomitant thrombotic microangiopathy lesions were rare but tended to be more frequent in patients with normal C3/high sC5b-9. In this last group, lesions of acute tubular necrosis tend to be more frequent than in the others 3 groups (p=0.07). In children, except for the presence of acute tubular necrosis that was more frequent in the group of children with normal C3/high sC5b-9, there were no significant histological differences among children based on their complement biomarker profiles (Table S3).
Table 8:
Main histological finding in 79 adult C3G patients according to complement biomarkers groups
| Low C3 | low C3 | Normal C3 | Normal C3 | p value | |
|---|---|---|---|---|---|
| normal sC5b-9 | high sC5B-9 | normal sC5b-9 | High sC5b-9 | ||
| Number of patient (%) | 13 (16%) | 30 (38%) | 26 (33%) | 10 (13%) | |
| Main pattern by Light microscopy | |||||
| Mesangial proliferative GN (% of pt) | 1/13 (8%) | 0/30 (0%) | 11/26 (42%) | 3/10 (30%) | 0.004 |
| Diffuse endocapillary proliferative GN (% of pt) | 2/13 (15%) | 6/30 (20%) | 2/26 (8%) | 0/10 (0%) | 0.31 |
| Membranoproliferative morphology * | 6/13 (46%) | 23/30 (77%) | 12/26 (46%) | 4/10 (40%) | 0.05 |
| Lesions by light microscopy | |||||
| Global sclerosis (estimated % of glomeruli) | 27 (0–72) | 6 (0–66) | 5 (0–50) | 13 (0–58) | 0.53 |
| Endocapillary hypercellularity (mean of glomeruli) | 1.3 | 1.48 | 0.69 | 0.7 | 0.04 |
| Cellular or fibrocellular crescents (% of patients) | 8/13 (62%) | 6/30 (20%) | 2/26 (8%) | 3/10 (30%) | 0.0026 |
| % of glomeruli with cellular crescent | 12 (10–24) | 22 (18–47) | 14 (3–25) | 13 (10–20) | 0.21 |
| mesangial proliferation (% of pt) | 8/13 (62%) | 25/30 (83%) | 17/26 (65%) | 7/10 (70%) | 0.76 |
| mesangial hypertrophy (% of pt) | 9/13 (69%) | 25/30 (83%) | 21/26 (81%) | 7/10 (70%) | 0.66 |
| mesangial interposition (% of pt) | 8/13 (62%) | 24/30 (80%) | 14/26 (54%) | 5/10 (50%) | 0.14 |
| Podocytopathy (% of pt) | 4/12 (33%) | 11/29(38%) | 11/23 (48%) | 5/10 (50%) | 0.69 |
| Acute tubular necrosis (% of pt) | 3/12 (25%) | 7/22 (32%) | 4/25 (16%) | 6/10 (60%) | 0.07 |
| Tubular atrophy/Interstitial fibrosis (estimated (%) | 1 | 1.067 | 1.04 | 1.33 | 0.84 |
| Interstitial inflammation (% of pt) | 8/12 (67%) | 12/30 (40%) | 7/24 (29%) | 7/10 (70%) | 0.056 |
| TMA lesions (% of pt) | 0 (0%) | 0 (0%) | 2/26 (8%) | 2/10 (20%) | 0.06 |
| Arteriolosclerosis/arteriolar hyalinosis (% of patient) | 3/12 (25%) | 12/28 (43%) | 9/25 (36%) | 6/10 (60%) | 0.38 |
Abbreviations: GN, glomerulonephritis, pt, patient; TMA, thrombotic microangiopathy
Data presented are percentage of total groups, unless otherwise noted as mean estimated or calculated percentages of sampled glomeruli or tubulointerstitial area.
Stratification of the risk for progression to ESKD in adult patients
By multivariate analysis, 3 different risk factors at the time of diagnosis predicted progression to ESKD in adults: eGFR<60ml/min, rare predicting-disease variants, complement biomarker profile at risk (low C3/normal sC5b-9 or normal C3/high sC5b-9). We attributed one point per risk factor to calculate a risk score for progression to ESKD for each adult patient ranging from 0 to 3. Renal survival curves for the five groups are shown in Figure 5 and stratify patients with no risk (score = 0, median renal survival undefined), intermediate risk (score = 1 median renal survival of 115 months), and high risk (score = 2 and 3, median renal survival of 21 months and 3 months respectively) (p<0.0001) (Figure 5).
Figure 5: Renal survival of adult patients according to C3G Progression Risk Score.

Kaplan-Meier patient renal survival analysis comparing C3G patients risk score of progression to end stage kidney disease of 0 to 3.
DISCUSSION
C3G is a highly complex, complement-mediated disease with very heterogeneous outcomes. Although our understanding of the underlying pathophysiology has advanced tremendously over the past decade, prognosticating outcome at the time of disease onset has not been possible. Here we show for the first time that, in patients with adult onset, the combination of two simple biomarkers of complement, C3 and sC5b-9, can be used to identify a sub-group of C3 patients at higher risk for poor renal outcomes. In addition, biomarkers correlated with histological renal lesions, highlighting the contribution of complement activation in driving kidney pathology and therefore renal prognosis. Using complement biomarkers, clinical parameters (onset of disease as an adult and eGFR<60ml/min at presentation) and genetic findings (the presence of rare variants in complement genes), we propose an easy-to-calculate outcomes score that stratifies patients into groups with low, intermediate and high risk of progression to ESKD. These disease-specific prognostic factors are relevant as heretofore the only prognostic factors were not specific for C3G.
C3G is mediated by uncontrolled activity of the alternative pathway of complement7,8. Multiple biomarkers of complement activation have been studied in this context with many groups reporting abnormal levels of C3 and sC5b-9 in 60–70% and 45–65% of patients, respectively8–10,18,20. While C3 and sC5b-9 levels reflect C3 and C5 convertase activity and are valuable in discriminating DDD from C3GN18,20, the prognostic value of these two biomarkers in predicting clinical course has not been demonstrated. We confirm that C3 levels alone do not identify patients with higher risk of progression to ESKD. However the combination of both C3 and sC5b-9 levels at disease onset predicts renal outcome especially in patients with adult-onset disease. In our series, approximately two-thirds of patients had biomarkers of complement activation, either low C3/high sC5b-9, low C3/normal sC5b-9 or normal C3/high sC5b-9. By multivariate analysis, the risk of ESKD was significantly increased in patients with low C3 level/normal sC5b-9 or normal C3/high sC5b-9 level. In 2017, Iatropoulos et al proposed a clustering of patients with both C3G and Immune complex membranoproliferative glomerulonephritis. Interestingly, patients of cluster 1 had significantly lower C3 level and higher sC5b-9 level than others clusters. Surprisingly, median renal survival of patients from this cluster was excellent21. Our results confirmed that patients with low C3/high sC5b-9 level are not at highest risk of progression to ESKD. Our results could suggest that, more than the degree of convertases activation, the equilibrium between both convertases activity, grouped (normal C3/normal sC5b-9 or low C3/high sC5b-9) or dissociated (normal C3/high sC5b-9 or low C3/normal sC5b-9), independently correlate with renal outcomes. Another hypothesis would be to consider that, in patients with low C3 level, high sC5b-9reflects C5 convertase activity but also the capacity to regulate the terminal pathway.
Importantly, correlation between biomarkers of complement activation and the risk for progression to ESKD was observed only in patients with adult onset disease. Of note, in this subgroup of patients, we showed a correlation between complement biomarkers profiles and histological features, with higher degrees of acute intra-glomerular lesions (i.e. endocapillary, extracapillary proliferation) or interstitial inflammation in patients, suggesting that complement C3 and/or C5 convertase over-activation drives acute glomerular and tubule-interstitial injuries. To the contrary, chronic lesions such as the percentage of global glomerulosclerosis or IFTA did not differ between patient groups.
In children, the presence of rare predicting disease variants in complement genes tend to be the sole factor predicting the risk of progression to ESKD. Except from acute tubular lesions, the presence of acute and chronic kidney lesions was similar across the groups of children. This apparent discrepancy between short and long term kidney outcomes has been illustrated in another acquired kidney disease, IgA nephropathy, and has made it difficult to identify reliable clinical and histologic predictors of disease progression in children. Our result in children with C3G suggests that except in case of underlying genetic abnormalities, whatever the consequences of the complement activation, the juvenile kidney is better able to adapt to complement attack. Indeed, despite often presenting with more severe disease, children more commonly undergo clinical remission.
In 2019, a KDIGO controversies conference recommended treating moderate C3G with prednisone and mycophenolate mofetil and severe C3G with methylprednisolone pulse dosing and other anti-cellular immune suppressants, noting however that this approach has only limited success with rapidly progressive disease22. Moderate disease in that publication was defined as proteinuria over 500 mg/24 h despite supportive therapy and moderate inflammation on biopsy; severe disease was defined as proteinuria over 2 gm/24 h and severe inflammation represented by marked endo- or extra-capillary proliferation with or without crescent formation despite immunosuppression and supportive therapy. Based on our data, we propose a non-invasive clinico-immunological score based on age, eGFR, C3 and sC5b-9 levels at onset of disease, and the presence of genetic variants in complement genes. We believe this disease stratification strategy will identify those patients at high risk of progression and therefore most likely to benefit from intensive and prolonged therapy.
Although this study is the first to formally identify complement biomarkers and genetics as prognostic factors for outcome, our study has limitations. Its retrospective nature hampered standardized complement exploration for all patients, a limitation that can be addressed in a prospective study to validate the prognosis score. Correlation between biomarkers and kidney lesions was performed using pathological reports of patients and ideally all kidney biopsies should be reassessed by two independent pathologists. Finally, we observed that in patients with low C3 level or high sC5b-9 level, frequency of positive C3Nef or C5Nef respectively, was significantly higher suggesting that complement abnormalities may contribute to determine the profile of C3/sC5b-9 biomarkers. However, the presence of the same rare variant in 2 patients can be associated with the same or different profiles of biomarkers suggesting that other factors may contribute to determine the final activity of C3/C5 convertase. More deeply functional data are needed to better determine the mechanisms of complement activation associated with specific profile of complement biomarkers.
In conclusion, by analyzing a large cohort of patients with C3G, we have shown that C3 and sC5b-9 levels together, when measured at disease onset as indices of C3 and C5 convertase activity, strongly and independently predict renal survival in patients aged over 18. As a clinical tool, we therefore propose an easy-to-calculate four-point outcomes score that uses C3 and sC5b-9 levels, age at onset of disease, eGFR at presentation and genetic findings to predict renal outcome. At one extreme, patients with low risk (score, 0) have a renal survival of at least 10 years; at the other extreme, patients with high risk (score 3) with a median renal survival of only 3 months. By stratifying patients in this manner, it is possible to identify those patients who require very close monitoring and more aggressive immunosuppressive therapy. Our results also suggest that in the era of new complement inhibitors, we need to consider how the balance of convertase activity is impacted to ensure that direct targeting of either C3 or C5 convertase activity does not have unexpected and perhaps deleterious effects.
Supplementary Material
Figure S1: Repartition of complement abnormalities (C3NeF, C5Nef, anti Factor H antibody and rare predicting-disease variant).
Figure S2: Renal survival curve of C3G patients according to complement biomarkers, C3 and sC5b-9 levels.
Figure S3: renal survival of C3G patients from whole cohort according to the 4 profiles of complement biomarkers
Figure S4: Forest plot of the hazard for End Stage renal Disease progression of all C3G patients
Table S1: genetic analysis of complement genes
Table S2: Clinical data at diagnosis and outcomes of 165 children based on biomarkers of convertases activity
Table S3: histological finding in 59 children with C3G according to complement biomarkers groups
TRANSLATIONAL STATEMENT.
This retrospective study based on C3 and sC5b-9 level highlights the prognosis value of these complement biomarkers of complement C3 and C5 convertase, in a large cohort of C3G patients, especially in patients with adult onset. In this subgroup of patients, we identified two profiles of biomarkers, low C3/normal sC5b-9 level and normal C3/high sC5b-9 level, independently correlated with renal survival allowing defining a prognosis score based on biomarker, rare disease-predicting variant in complement gene and renal function at diagnosis. This easy tool may help clinicians for identifying patients at higher risk of progression to ESKD that may require more aggressive therapy.
ACKNOWLEDGMENTS
This work was supported in part by the EU FP7 grant 2012-305608 (EURenOmics), KIDNEEDS research grant 2019, ANR research grant (ANR-20-CE17-COMSIGN), STEM Chateaubriand Fellowship, and NIH Grant R01 DK110023.
We thank clinicians who referred patients: Pr Choukroun (Centre Hospitalier Universitaire d’Amiens, Department of Nephrology, Amiens, France); Pr Bridoux (Centre Hospitalier universitaire de Poitiers, service de Néphrologie, Poitiers, France) ; Pr Sophie Caillard (centre hospitalier universitaire de Strasbourg, department of Nephrology, ; strasbourg, France) ; Dr Gobert (Centre Hospitalier d’Avignon, Department of Nephrology, Avignon, France), Dr Sophie Taque (Centre Hospitalier Universitaire de, Department of Pediatry, Rennes, France) ; Dr Matignon (Centre Hospitalier universitaire de Mondor, department of Nephrology, creteil, France) ; Pr Dominique Guerrot (Centre Hospitalo-Universitaire de Rouen, Department of Nephrology, Rouen, France), Dr Nobili (Centre Hospitalier de Besançon, service de néphrologie pédiatrique, Besançon, France;
DISCLOSURE
VFB has received personal fees from Alexion Pharmaceuticals, Biocryps, Roche, and Apellis for invited lectures and/or board membership and is the recipient of a research grant from Alexion Pharmaceuticals.
BIBLIOGRAPHY
- 1.Smith RJH, Appel GB, Blom AM, et al. C3 glomerulopathy - understanding a rare complement-driven renal disease. Nat Rev Nephrol. 2019;15(3):129–143. doi: 10.1038/s41581-018-0107-2 [DOI] [PMC free article] [PubMed] [Google Scholar]
- 2.Marinozzi MC, Chauvet S, Le Quintrec M, et al. C5 nephritic factors drive the biological phenotype of C3 glomerulopathies. Kidney Int. 2017;92(5):1232–1241. doi: 10.1016/j.kint.2017.04.017 [DOI] [PubMed] [Google Scholar]
- 3.Iatropoulos P, Noris M, Mele C, et al. Complement gene variants determine the risk of immunoglobulin-associated MPGN and C3 glomerulopathy and predict long-term renal outcome. Mol Immunol. 2016;71:131–142. doi: 10.1016/j.molimm.2016.01.010 [DOI] [PubMed] [Google Scholar]
- 4.Blanc C, Togarsimalemath SK, Chauvet S, et al. Anti-factor H autoantibodies in C3 glomerulopathies and in atypical hemolytic uremic syndrome: one target, two diseases. J Immunol Baltim Md 1950. 2015;194(11):5129–5138. doi: 10.4049/jimmunol.1402770 [DOI] [PubMed] [Google Scholar]
- 5.Goodship THJ, Pappworth IY, Toth T, et al. Factor H autoantibodies in membranoproliferative glomerulonephritis. Mol Immunol. 2012;52(3–4):200–206. doi: 10.1016/j.molimm.2012.05.009 [DOI] [PubMed] [Google Scholar]
- 6.Sethi S, Fervenza FC, Zhang Y, et al. Proliferative glomerulonephritis secondary to dysfunction of the alternative pathway of complement. Clin J Am Soc Nephrol CJASN. 2011;6(5):1009–1017. doi: 10.2215/CJN.07110810 [DOI] [PMC free article] [PubMed] [Google Scholar]
- 7.Servais A, Noël LH, Roumenina LT, et al. Acquired and genetic complement abnormalities play a critical role in dense deposit disease and other C3 glomerulopathies. Kidney Int. 2012;82(4):454–464. doi: 10.1038/ki.2012.63 [DOI] [PubMed] [Google Scholar]
- 8.Iatropoulos P, Noris M, Mele C, et al. Complement gene variants determine the risk of immunoglobulin-associated MPGN and C3 glomerulopathy and predict long-term renal outcome. Mol Immunol. 2016;71:131–142. doi: 10.1016/j.molimm.2016.01.010 [DOI] [PubMed] [Google Scholar]
- 9.Bomback AS, Santoriello D, Avasare RS, et al. C3 glomerulonephritis and dense deposit disease share a similar disease course in a large United States cohort of patients with C3 glomerulopathy. Kidney Int. 2018;93(4):977–985. doi: 10.1016/j.kint.2017.10.022 [DOI] [PubMed] [Google Scholar]
- 10.Medjeral-Thomas NR, O’Shaughnessy MM, O’Regan JA, et al. C3 glomerulopathy: clinicopathologic features and predictors of outcome. Clin J Am Soc Nephrol CJASN. 2014;9(1):46–53. doi: 10.2215/CJN.04700513 [DOI] [PMC free article] [PubMed] [Google Scholar]
- 11.Pickering MC, Cook HT, Warren J, et al. Uncontrolled C3 activation causes membranoproliferative glomerulonephritis in mice deficient in complement factor H. Nat Genet. 2002;31(4):424–428. doi: 10.1038/ng912 [DOI] [PubMed] [Google Scholar]
- 12.Pickering MC, Warren J, Rose KL, et al. Prevention of C5 activation ameliorates spontaneous and experimental glomerulonephritis in factor H-deficient mice. Proc Natl Acad Sci U S A. 2006;103(25):9649–9654. doi: 10.1073/pnas.0601094103 [DOI] [PMC free article] [PubMed] [Google Scholar]
- 13.Ruseva MM, Vernon KA, Lesher AM, et al. Loss of properdin exacerbates C3 glomerulopathy resulting from factor H deficiency. J Am Soc Nephrol JASN. 2013;24(1):43–52. doi: 10.1681/ASN.2012060571 [DOI] [PMC free article] [PubMed] [Google Scholar]
- 14.Pickering MC, D’Agati VD, Nester CM, et al. C3 glomerulopathy: consensus report. Kidney Int. 2013;84(6):1079–1089. doi: 10.1038/ki.2013.377 [DOI] [PMC free article] [PubMed] [Google Scholar]
- 15.Levey AS, Bosch JP, Lewis JB, Greene T, Rogers N, Roth D. A more accurate method to estimate glomerular filtration rate from serum creatinine: a new prediction equation. Modification of Diet in Renal Disease Study Group. Ann Intern Med. 1999;130(6):461–470. [DOI] [PubMed] [Google Scholar]
- 16.Radhakrishnan J, Cattran DC. The KDIGO practice guideline on glomerulonephritis: reading between the (guide)lines--application to the individual patient. Kidney Int. 2012;82(8):840–856. doi: 10.1038/ki.2012.280 [DOI] [PubMed] [Google Scholar]
- 17.Blanc C, Togarsimalemath SK, Chauvet S, et al. Anti-factor H autoantibodies in C3 glomerulopathies and in atypical hemolytic uremic syndrome: one target, two diseases. J Immunol Baltim Md 1950. 2015;194(11):5129–5138. doi: 10.4049/jimmunol.1402770 [DOI] [PubMed] [Google Scholar]
- 18.Marinozzi MC, Chauvet S, Le Quintrec M, et al. C5 nephritic factors drive the biological phenotype of C3 glomerulopathies. Kidney Int. 2017;92(5):1232–1241. doi: 10.1016/j.kint.2017.04.017 [DOI] [PubMed] [Google Scholar]
- 19.Bomback AS, Santoriello D, Avasare RS, et al. C3 glomerulonephritis and dense deposit disease share a similar disease course in a large United States cohort of patients with C3 glomerulopathy. Kidney Int. 2018;93(4):977–985. doi: 10.1016/j.kint.2017.10.022 [DOI] [PubMed] [Google Scholar]
- 20.Zhang Y, Nester CM, Martin B, et al. Defining the complement biomarker profile of C3 glomerulopathy. Clin J Am Soc Nephrol CJASN. 2014;9(11):1876–1882. doi: 10.2215/CJN.01820214 [DOI] [PMC free article] [PubMed] [Google Scholar]
- 21.Iatropoulos P, Daina E, Curreri M, et al. Cluster Analysis Identifies Distinct Pathogenetic Patterns in C3 Glomerulopathies/Immune Complex-Mediated Membranoproliferative GN. J Am Soc Nephrol JASN. 2018;29(1):283–294. doi: 10.1681/ASN.2017030258 [DOI] [PMC free article] [PubMed] [Google Scholar]
- 22.Floege J, Barbour SJ, Cattran DC, et al. Management and treatment of glomerular diseases (part 1): conclusions from a Kidney Disease: Improving Global Outcomes (KDIGO) Controversies Conference. Kidney Int. 2019;95(2):268–280. doi: 10.1016/j.kint.2018.10.018 [DOI] [PubMed] [Google Scholar]
Associated Data
This section collects any data citations, data availability statements, or supplementary materials included in this article.
Supplementary Materials
Figure S1: Repartition of complement abnormalities (C3NeF, C5Nef, anti Factor H antibody and rare predicting-disease variant).
Figure S2: Renal survival curve of C3G patients according to complement biomarkers, C3 and sC5b-9 levels.
Figure S3: renal survival of C3G patients from whole cohort according to the 4 profiles of complement biomarkers
Figure S4: Forest plot of the hazard for End Stage renal Disease progression of all C3G patients
Table S1: genetic analysis of complement genes
Table S2: Clinical data at diagnosis and outcomes of 165 children based on biomarkers of convertases activity
Table S3: histological finding in 59 children with C3G according to complement biomarkers groups