

SUMMARY
Little is known about how microbiota regulate innate-like γδ T cells or how these restrict their effector functions within mucosal barriers, where microbiota provide chronic stimulation. Here, we show that microbiota-mediated regulation of γδ17 cells is binary, where microbiota instruct in situ interleukin-17 (IL-17) production and concomitant expression of the inhibitory receptor programmed cell death protein 1 (PD-1). Microbiota-driven expression of PD-1 and IL-17 and preferential adoption of a PD-1high phenotype are conserved for γδ17 cells across multiple mucosal barriers. Importantly, microbiota-driven PD-1 inhibits in situ IL-17 production by mucosa-resident γδ17 effectors, linking microbiota to their simultaneous activation and suppression. We further show the dynamic nature of this microbiota-driven module and define an inflammation-associated activation state for γδ17 cells marked by augmented PD-1, IL-17, and lipid uptake, thus linking the microbiota to dynamic subset-specific activation and metabolic remodeling to support γδ17 effector functions in a microbiota-dense tissue environment.
Graphical abstract

In brief
Huang et al. show that microbiota instruct γδ17 cells to express PD-1 and IL-17, establishing a binary module where the former inhibits the latter. This module, and lipid uptake by γδ17 cells, is augmented to support in situ γδ17 responses to tissue inflammation.
INTRODUCTION
Dedicated subsets of interferon γ (IFN-γ)-producing (γδIFN-γ) or interleukin-17 (IL-17)-producing (γδ17) γδ T cells are established in the thymus1–7 and further sculpted in the periphery by tissue-specific cues.8–17 Among these cues, intestinal microbiota may be particularly outstanding because they contribute a diversity of signals, potentially activating γδ T cells or shaping their responses to pathogens and tissue insults.8,9,17–24
In the intestine, the influence of microbiota is best described for γδ T cells in the intestinal epithelial layer (IEL-γδ), where microbiota induce expression of antimicrobials,8 the activation marker CD69,25 and responses of IEL-γδ To intestinal damage.26 Whether microbiota instruct similar responses in γδ T cells resident in the intestinal lamina propria (LP) or act on both γδ T cell subsets similarly is unknown. While evidence suggests that microbiota can impact LP-resident γδ T cells, data are conflicting regarding the nature of this regulation. One report found that microbiota expand LP-resident IL-1R+ γδ17 cells and enhance their IL-17 production, although this response is mouse strain specific.22 Another report concluded that microbiota’s influence on IL-17 production is exclusive to intestinal inflammation,27 while a contrasting report concluded that microbiota instead suppress IL-17 production.28 Altogether, regulatory networks for γδ T cells stemming from the microbiota are poorly understood, and identification of these—particularly those that act in a subset-specific fashion—is a pressing issue because γδIFN-γ and γδ17 subsets are thought to play distinct roles in intestinal health, disease, and defense against enteric infection.19,29–31
Here, we identify a subset-specific, microbiota-dependent regulatory module for γδ17 cells in which microbiota drive IL-17 and expression of the inhibitory receptor programmed cell death protein 1 (PD-1). While microbiota-driven PD-1 antagonizes natural IL-17 production by endogenous γδ17 effectors, a PD-1high phenotype does not preclude upregulation of γδ17 effector functions, which are significantly enhanced in response to intestinal inflammation. Inflammation-associated activation of γδ17 cells is concomitant with augmented lipid uptake, indicating that metabolism and microbiota-driven responses are dynamically regulated and subset specific for intestine-resident γδ T cells.
RESULTS
Colon-resident γδ17 cells are distinguished by a PD-1high phenotype
To identify subset-specific regulatory modules stemming from microbiota, we reasoned that these would have disparate effects on the basal activation state of IEL or LP populations. We first tested the activation markers CD69 and CD44 but found expression largely overlapping between IEL- and LP-γδ T cells (Figure S1). We next tested PD-1, whose expression is well described for activated αβ T cells,32–34 but the drivers for PD-1 expressed by γδ T cells are unknown. Interestingly, PD-1 expression by IEL- and LP-γδ T cells was markedly distinct, where PD-1 was exclusive to the LP compartment and exclusive to IL-17-producing effectors (Figures 1A–1E and S1).
Figure 1. PD-1 expression among colon-resident γδ T cells is specific to the γδ17 subset.

(A and B) Phorbol 12-myristate 13-acetate (PMA) + ionomycin stimulated IEL-γδ evaluated for PD-1 and co-expression of either IL-17 (A) or IFNγ (B). (C and D) LP-γδ analyzed as in (A) and (B).
(E) Percentage of PD-1+ cells among IL-17+ or IFNγ+ LP-γδ (shaded gates in C and D).
(F) LP-γδ subset by PD-1 and CD44: PD-1+CD44high (I), PD-1−CD44mid (II), and PD-1−CD44high (III).
(G) Absolute number of the indicated population in (F). Each data point represents one mouse, and data are combined from three independent experiments.
(H–J) Representative plot gated on the indicated LP-γδ population analyzed for IL-17 and IFNγ (H) and the percentages of IL-17+ (I) and IFNγ+ (J) in the indicated LP-γδ population.(K–M) Representative plot gated on the indicated LP-γδ population from Il17a-EGFP mice analyzed for GFP(IL-17)+ (K) and percentage (L) and number (M) of GFP(IL-17)+ cells in the indicated population.
Each data point represents one mouse. Data in (G), (I), and (J) are combined from three independent experiments. Data in (L) and (M) are combined from five independent experiments. Data in (A)–(G) are representative of more than 10 independent experiments. Error bars represent mean ± SD. *p < 0.05, **p < 0.01, ***p < 0.001, ****p < 0.0001 (one-way ANOVA with Tukey’s post hoc test). See also Figure S1.
Given our results indicating that more than 80% of IL-17-producing effectors were PD-1+, we considered the possibility that PD-1 upregulation may be a dominant response of the γδ17 subset (Figure 1E). To test this, we attempted to use standard markers to distinguish γδIFN-γ (CD44low/midCD27+CCR6−) and γδ17 subsets (CD44highCD27−CCR6+)1,2 but found no CCR6+ or CD27+ γδ T cells in the colon LP (Figure S1). That LP-resident γδ T cells fail to express these lineage-discriminating molecules has been suggested before,2,25 and it is possible that CCR6 and CD27 are sensitive to enzymatic cleavage during the isolation procedure. These unknowns notwithstanding, because conventional markers failed but PD-1 expression was robust (Figure S1), we implemented a strategy using PD-1 and CD44 together and found that this resolved colon LP γδ T cells into three populations: PD-1+CD44high, PD-1−CD44mid, and a minor PD-1−CD44high population (populations I, II, and III, respectively, with similar results in male and female mice; Figures 1F, 1G, and S1).
PD-1+CD44high populations were γδ17 cells because these expressed RORγt, and 30%–70% produced IL-17 upon stimulation (Figures 1H, 1I, and S1). None produced IFNγ (Figure 1J). By contrast, IFNγ (but not IL-17) was observed among the PD-1−CD44mid population, all of which were RORγt− (Figures 1H–1J and S1). Gene expression analysis confirmed that Il17a and Il17f were exclusive to PD-1+CD44high populations, whereas IFNγ was enriched in PD-1−CD44mid populations (Figure S1). The minor PD-1−CD44high population was a mix of RORγt+ and RORγt− cells and both types of effectors (Figures 1H–1J and S1).
We extended these analyses to Il17a-EGFP mice, where endogenous γδ17 effectors actively producing IL-17 can be visualized without the need for exogenous stimulation.11 Indeed, natural IL-17 production was most abundant among PD-1+CD44high populations, and these were by far the dominant populations of endogenous γδ17 effectors, with numbers 20- to 100-fold greater than those among PD-1neg populations (Figures 1K–1M).
By these characteristics, the vast majority of γδ17 cells in the colon LP are readily distinguished by a PD-1+CD44high phenotype. By contrast, the majority of γδIFN-γ T cells are distinguished by a PD-1−CD44mid phenotype. That CD44 expression by IFN-γ-producing and IL-17-producing effectors was partially overlapping (Figures 1F, 1H–1J, and S1) underscores the requirement for PD-1 to fully distinguish γδIFN-γ (PD-1−) and γδ17 subsets (PD-1+) within the colon LP. Additionally, the absence of RORγt and IL-17 from among IELs (Figures 1A and S1) indicated that γδ17 cells did not reside in the epithelial compartment of the colon, which would explain our observation that IEL-γδ was exclusively PD-1−.
Investigation of the basis for subset-specific PD-1 expression among colon LP γδ T cells indicated that specificity was not due to enhanced tonic signaling via the T cell receptor (based on Nur77 expression35), nor was it strictly a monoclonal response because PD-1+CD44high populations included Vγ4 and Vγ6 subsets (Vγ1/2−Vγ4−), which are known to comprise the bulk γδ17 population in various tissues14,36,37 (Figure S1). Furthermore, expression on γδ17 cells was not an inherent virtue of IL-17 production alone because, in comparison with other types of IL-17+ T cell effectors, IL-17-producing γδ T cells had the highest frequency of PD-1+ and expressed the most PD-1 protein (Figure S1).
Mucosal barrier-resident γδ17 cells preferentially adopt a PD-1high phenotype
Interestingly, the lungs and female genital tract (FGT) also contained robust populations of PD-1+CD44high γδ T cells, all of which were RORγt+ (Figure S2; Table S1). Also, IL-17-producing effectors in the lungs and FGT were preferentially PD-1high (Table S1), supporting the hypothesis that the PD-1high phenotype was common for γδ17 cells in several different mucosal barrier tissues.
Divergent from these commonalities was a clear tissue-specific influence on whether PD-1 was exclusive to the γδ17 subset. In this respect, the lungs contained PD-1+ cells that aligned with the γδIFN-γ subset because these failed to express CD44, RORγt, or IL-17 (Figure S2). All PD-1-expressing γδ T cells in the lungs excluded intravenous labeling with CD45 antibody, confirming their residence in lung tissue (Figure S2). That γδIFN-γ cells expressed PD-1 in the lungs and not other mucosal barriers suggested the influence of tissue-specific factors on PD-1 expression. To test this hypothesis, we evaluated lymphoid tissues, including lymph nodes (mesenteric and skin draining), spleen, and thymus. In stark contrast to mucosal barriers, lymph nodes and spleen had few PD-1+CD44high populations, and most IL-17-producers were actually PD-1− (Figure S2; Table S1). Instead, PD-1 expression in lymph nodes and spleen was preferential to CD27+ cells of the γδIFN-γ subset (Figure S2). The thymus was an exception among lymphoid tissues because more than 90% of thymic γδ T cells were PD-1+ (Figure S2; Table S1), a finding consistent with previous reports.38,39 Taken together, these results support a model where extrathymic, tissue-specific cues govern PD-1 expression on either subset. For the γδ17 subset, residence in mucosal barriers preferentially drove these to express PD-1. Furthermore, in some mucosal barriers, such as the colon, PD-1 expression was exclusive to the γδ17 subset.
PD-1 expression by γδ17 cells requires sustained stimulation from the intestinal microbiota
Given these results, we focused on the intestine to identify tissue-specific cues underpinning subset-specific PD-1 expression. Interestingly, expression in the intestine was not by default because most γδ17 cells in the proximal small intestine were PD-1−/low, and the abundance of PD-1+CD44high populations and the overall MFI (mean fluorescence intensity) for PD-1 along the intestine’s length suggested that PD-1 was driven by region-specific factors that peaked in the colon (Figure S2; Table S2). We thus tested the requirements for colonic microbiota by administering antibiotics to 10-week-old mice. Indeed, antibiotic treatment induced remarkable remodeling of γδ T cell populations, resulting in a more than 3-fold decline in PD-1+CD44high γδ T cells, and those few that remained nevertheless had significantly diminished PD-1 protein (in males and females; Figures 2A–2D and S2). The decline in PD-1 was specific to this protein because antibiotic treatment had no effect onCD44. Importantly, these changes were not due to a decline in γδ17 cells because RORγt+ populations were of normal abundance in antibiotic-treated mice, and it was clear that these had reduced PD-1 more than 5-fold (Figures 2E and 2F). Taken together, these results indicate that PD-1 expression by colon-resident γδ17 cells was not permanent but instead sustained in a microbiota-dependent fashion.
Figure 2. Microbiota sustain PD-1 on γδ17 cells to restrict natural IL-17 production by endogenous γδ17 effectors.

(A) Colon LP γδ T cells from control or antibiotic (Abx)-treated mice.
(B–D) PD-1+CD44high γδ T cells from control and Abx-treated mice evaluated for MFI of PD-1 (B) and CD44 (C) and the relative abundance of the indicated population from control and Abx-treated mice (D).
(E and F) PD-1 and RORγt expression (E) and the MFI of PD-1 (F) expressed by total RORγt+ γδ T cells from control and Abx-treated mice.
(G–J) Representative plot (G) and percentage of GFP(IL-17)+ cells (H) and the absolute cell number (I) and MFI (J) of GFP(IL-17)+ cells from control (ctrl) or Abx-treated Il17a-GFP mice.
(K–N) Colon LP γδ T cells from mice of the indicated treatment groups were stimulated with PMA + ionomycin and analyzed for IL-17 production as in (G)–(J).
(O–R) Representative plots of GFP(IL-17)+ cells among the indicated population from Il17a-GFP mice treated with the isotype (iso) ctrl (O) or anti-PD-1 (P) and the absolute number of GFP(IL-17)+ cells from PD-1+CD44high (Q) and PD-1−CD44high (R) γδ T cells (gated populations in O and P) from Il17a-GFP mice from the indicated treatment group.
Each data point represents one mouse and data in (H)–(J), (L)–(N), and (Q)–(R) are combined from two independent experiments. Error bars represent mean ± SD. *p < 0.05, **p < 0.01, ****p < 0.0001; n.s., not significant (unpaired Student’s t test). See also Figures S2 and S3 and Table S1.
Investigation of the microbiota-driven signals underpinning PD-1 upregulation indicated that no single pathway had a dominant role, since neither IL-1β signals, T cell receptor (TCR) signals, or the microbe segmented filamentous bacteria, had significant impact on the response (Figure S2). Taken together with our results showing that PD-1 was expressed by the majority of γδ17 cells in the colon suggests that the basis for this response was highly conserved and likely driven by a diversity of signals stemming from the microbiota.
Microbiota-driven PD-1 inhibits IL-17 production by endogenous γδ17 effectors
Given that PD-1’s inhibitory function is well characterized for αβ T cells dependent on antigen presentation,34 we set out to determine PD-1’s function in γδ17 cells, where we found that PD-1 expression was dependent on microbiota. A natural hypothesis would be that microbiota-driven PD-1 restrained other microbiota-driven responses. However, the nature of such responses was unclear, and previous reports yielded conflicting results.22,27,28 To begin to resolve these conflicts so that we could test PD-1’s inhibitory function, we tested whether microbiota were required for endogenous γδ17 effectors because these were PD-1high and naturally produced IL-17 without exogenous stimulation (Figure 1M). Indeed, endogenous γδ17 effectors were reduced 10-fold in antibiotic-treated mice, and those that remained had significantly diminished GFP(IL-17), indicating that natural IL-17 production was upregulated in a microbiota-dependent fashion (Figures 2G–2J). Unlike natural IL-17, IL-17 produced upon exogenous stimulation was unchanged, indicating that microbiota had the most significant impact on effector functions acting in situ in the tissue environment (Figures 2K–2N). Likewise, lung- and FGT-resident γδ17 cells expressed natural IL-17 and PD-1 in a microbiota-dependent fashion, indicating that this binary module of expression was conserved across multiple mucosal barriers (Figure S3).
Having established that microbiota induced PD-1 and natural IL-17, we tested whether PD-1 was inhibitory for endogenous γδ17 effectors. We administered anti-PD-1 for 3 days and indeed found that this short-term PD-1 blockade increased the abundance of endogenous GFP(IL-17)+ effectors, with specific action on those in the PD-1+ population (Figures 2O–2R). Importantly, PD-1 blockade did not globally disrupt total γδ T cell populations or alter the abundance of GFP(IL-17)+ CD4 T cells, indicating that this treatment did not broadly perturb homeostasis or act indiscriminately on IL-17-producing effectors (Figure S4). Taken together, these results indicate that PD-1 inhibition restricted in situ IL-17 production by colon-resident γδ17 effectors. Because PD-1 and IL-17 were upregulated in a microbiota-dependent fashion, these molecules together establish a microbiota-dependent regulatory module for γδ17 cells, where the former suppresses the latter.
Inflammation-induced activation of γδ17 cells exaggerates PD-1 and IL-17
We hypothesized that unique expression modalities for PD-1 and IL-17 would be induced by intestinal inflammation because this pathology is influenced by microbiota.40 We tested this in dextran sodium sulfate (DSS)-induced colitis, which is known to engage IL-17 production by γδ17 cells.30 We also leveraged our findings showing subset-specific expression of PD-1 to determine whether DSS-colitis induced expansion or otherwise altered any γδ T cell subset.
Although γδ17 cells are thought to be engaged early (day 3) in DSS colitis,18,30 we found no apparent changes until mice exhibited significant body weight loss (day 7), where PD-1+ γδ17 cells enhanced PD-1 levels an average of 2-fold higher than that of the steady state (Figures 3A, 3B, and 3D). While we had not anticipated PD-1 to increase in this already PD-1high population, this outcome suggested that exaggerated PD-1 was indicative of engagement and activation of γδ17 cells. Consistent with this hypothesis, PD-1-exaggerated γδ17 cells had enhanced IL-17 production upon stimulation, suggesting that effector functions and PD-1 were upregulated in response to DSS colitis (Figures 3D and 3F). Other than these changes, we found no differences in the percentage of IL-17+ or abundance of PD-1+ or PD-1− γδ T cell populations, suggesting that intestinal inflammation did not remodel the pre-existing ratios between γδ T cell subsets or destabilize subset-specific expression of PD-1 (Figures 3A–3C and 3E). Additionally, there were no changes in the abundance or intensity of IFN-γ- or IL-17-producing functions of PD-1− γδ T cells (Table S3), suggesting that augmented effector functions in response to DSS colitis were most robust in PD-1+ γδ17 cells. Taken together, these findings suggest that enhanced capacity of IL-17 production and exaggerated PD-1 were a subset-specific response of PD-1+ γδ17 cells in DSS colitis.
Figure 3. Inflammation-associated activation of γδ17 cells exaggerates PD-1 and IL-17-production.

(A–F) Colon LP γδ T cells from ctrl (A) or DSS-treated mice (B) and percentage of PD-1+CD44high populations (C) and their MFI of PD-1 (D) on the indicated day. Data in (D) are normalized to the average MFI for PD-1 expressed by ctrl samples analyzed on the same day. Also shown are the percentage of IL-17+ (E) and the relative MFI for IL-17 protein (F) among PMA + ionomycin-stimulated PD-1+CD44high γδ T cells in samples described in (C) and (D). Each data point represents one mouse, and data are combined from two independent experiments.
(G–J) Ctrl or DSS-treated (day 7) Il17a-GFP mice analyzed for GFP(IL-17)+ (plot is gated on PD-1+CD44high γδ T cells) (G), percentage of GFP(IL-17)+ among PD-1+CD44high γδ T cells (H), the MFI for GFP(IL-17) (I), and the MFI of PD-1 among GFP− and GFP(IL-17)+ populations among PD-1+CD44high γδ T cells for the indicated treatment group.
Each data point represents one mouse, and data are representative of two independent experiments. Error bars represent mean ± SD. *p < 0.05, **p < 0.01, ****p < 0.0001; n.s., not significant (unpaired Student’s t test (C–I) and one-way ANOVA with Tukey’s post hoc test (J)). See also Figure S4 and Table S3.
We extended these analyses to Mucin-2-deficient mice (Muc2−/−), which spontaneously develop chronic colitis.41–43 In agreement with responses to DSS colitis, γδ17 cells in colitic Muc2−/− mice had exaggerated PD-1 and remarkably enhanced IL-17 production (Figure S4). That these augmentations were shared by Muc2−/− mice and DSS colitis indicates that dynamic modulation of PD-1 and γδ17 effector functions was an activation response of γδ17 cells in intestinal inflammation.
Mutual upregulation of effector and inhibitory modules suggested that inflammation-induced exaggeration of PD-1 was not altogether prohibitive for concomitantly enhanced effector functions. To rigorously test this hypothesis, we evaluated in situ IL-17 production during DSS colitis. While the abundance of endogenous γδ17 effectors was unchanged, these produced significantly more IL-17, with a 2-fold increase in the MFI of GFP(IL-17) (Figures 3G–3I). Importantly, these functionally enhanced effectors also exaggerated PD-1, which was intriguing given that GFP(IL-17)+ effectors already expressed more PD-1 than the bulk PD-1+ γδ17 population (Figure 3J). Thus, inflammation-associated exaggeration of PD-1 did not preclude concomitant upregulation of IL-17-producing effector functions.
Importantly, results from both antibiotic-treated and germ-free mice indicated that augmentation of PD-1 in DSS-colitis was microbiota-dependent, suggesting this microbiota-driven module was conserved for both steady-state and inflammation (Figure S4). Altogether, these results suggest that microbiota-driven exaggeration of PD-1 and enhanced IL-17 production are defining characteristics of an inflammation-induced activation state of colon-resident γδ17 cells.
Augmented lipid metabolism is a subset-specific response of γδ17 cells in intestinal inflammation
We next set out to define the cell-intrinsic changes that supported inflammation-associated activation. We first evaluated TCR signaling in DSS colitis and found that the percentage of γδ17 cells expressing Nur77(GFP) and their MFI for Nur77(GFP) were enhanced, suggesting that inflammation-associated activation was linked to upregulated TCR signaling (Figures 4A–4C). Interestingly, Nur77(GFP) in γδIFN-γ cells was unchanged, suggesting that DSS-colitis augmented TCR signaling in γδ T cells in a subset-specific fashion (Figures 4D–4F).
Figure 4. Dynamic metabolic rewiring of γδ17 cells upon inflammation-associated activation enhances their lipid uptake in the colon LP.
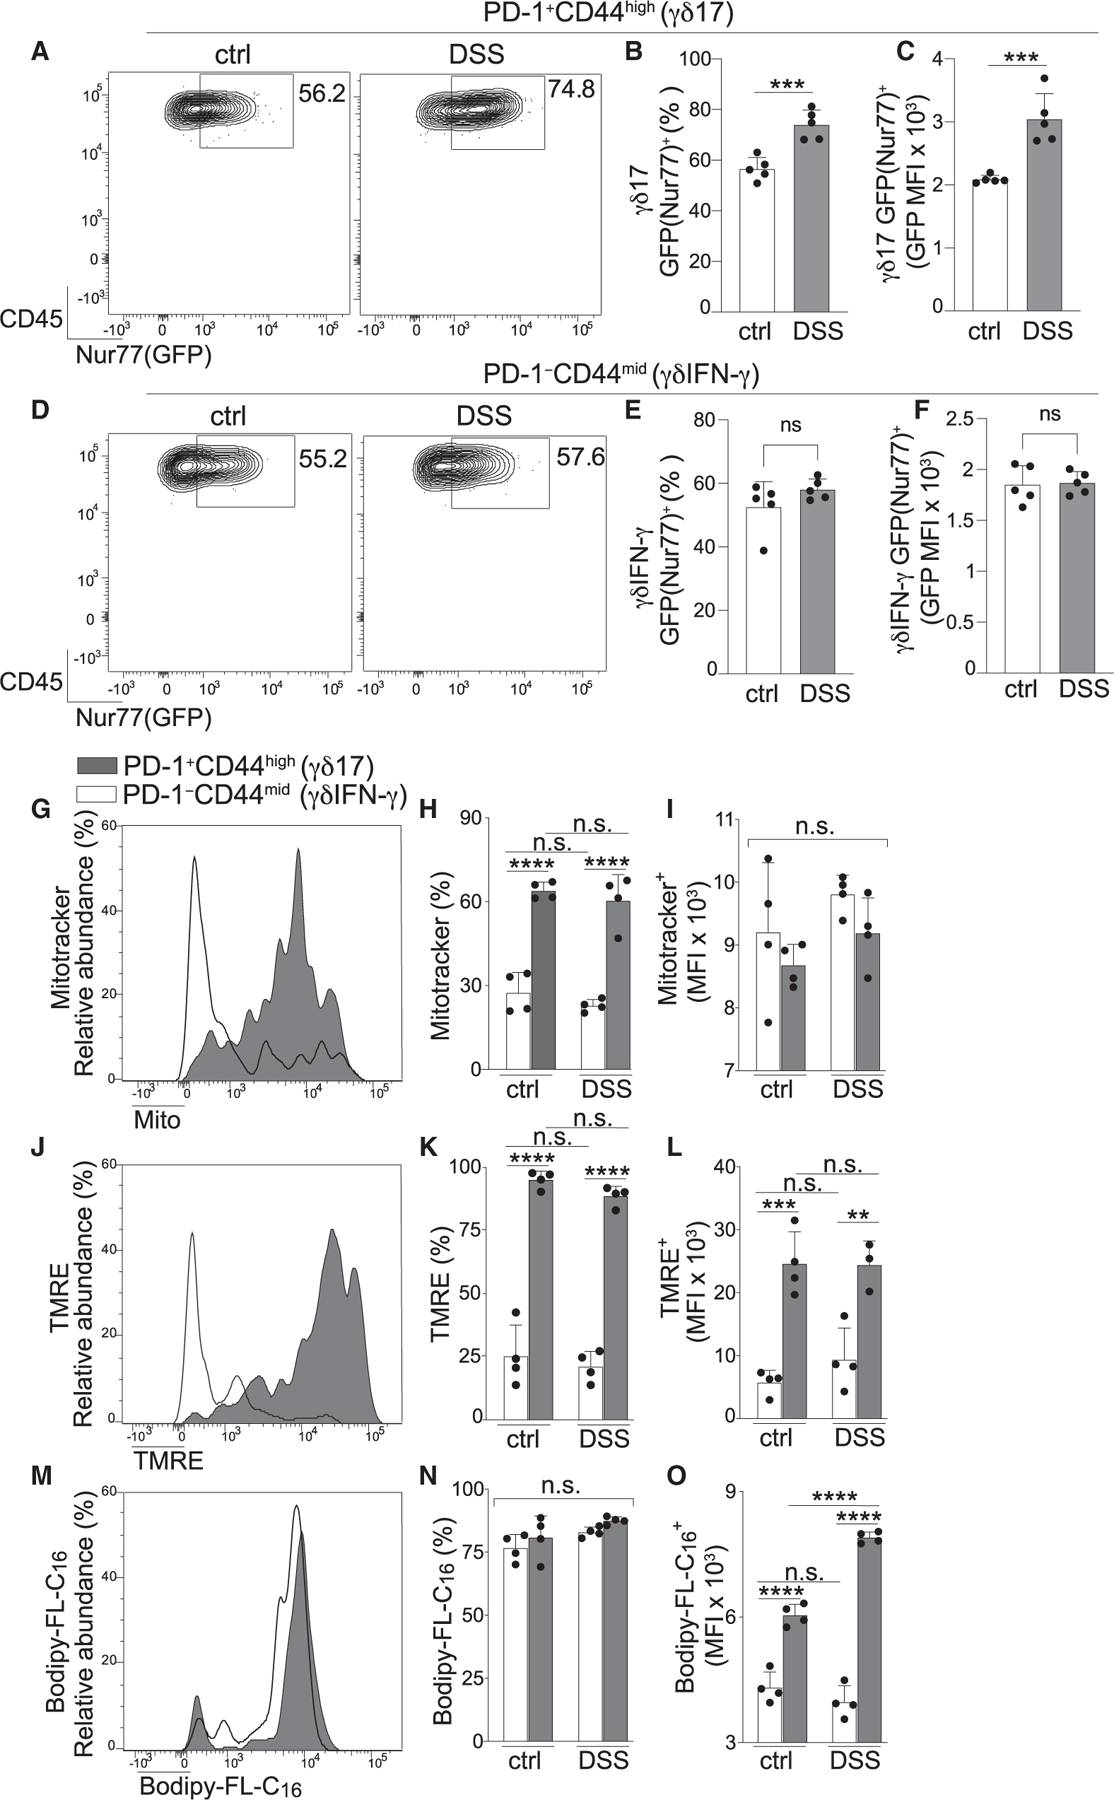
(A–F) Ctrl and DSS-treated mice evaluated for Nur77(GFP) among PD-1+CD44high (γδ17) (A–C) and PD-1−CD44mid (γδIFN-γ) subsets (D–F) and Nur77(GFP) expression (A and D), percentage (B and E), and MFI of Nur77(GFP)+ populations (C and F) from either γδ17 or γδIFN-γ subsets from the indicated treatment group.
(G–O) γδ17 and γδIFN-γ subsets from ctrl and DSS-treated mice were evaluated for metabolic parameters.
(G–I) MitoTracker staining evaluating mitochondrial content/mass (G), percentage (H), and MitoTracker MFI (I) of MitoTracker+ cells in the indicated subset from each treatment group.
(J–L) Mitochondrial activity measured by tetramethylrhodamine (TMRE) staining as in (G)–(I).
(M–O) Lipid uptake evaluated by labeled palmitate (BODIPY-FL-C16) as in (G)–(I).
Each data point represents one mouse, and data are representative of two independent experiments. Error bars represent mean ± SD. **p < 0.001, ***p < 0.005, ****p < 0.0001; n.s., not significant (unpaired Student’s t test (B–F) and one-way ANOVA with Tukey’s post hoc test (H–O)). See also Figure S4.
We next tested whether augmented TCR signals and inflammation-associated activation were associated with metabolic rewiring. We assessed γδ17 and γδIFN-γ cells for their mitochondrial content and activity using MitoTracker and tetramethylrhodamine (TMRE), respectively. There were remarkable subset-specific distinctions at steady state, with the percentage of cells staining positive for these analytes 2– to 4-fold higher among the γδ17 population (Figures 4G, 4H, 4J, and 4K). These results are consistent with reports outlining subset-specific distinctions for mitochondrion-related metabolism in non-intestinal tissues or tumors,14,16,44,45 and support the conclusion that γδ17 cells have superior mitochondrial content/activity in the colon, a tissue where they are naturally PD-1high. Results in antibiotic-treated mice suggested that mitochondrial content/activity was independent of microbiota, albeit these analyses were obfuscated by the inability to clearly distinguish γδIFN-γ and γδ17 subsets in antibiotic-treated mice because of PD-1 downregulation in the latter (Figure S4). Subset-specific differences in mitochondrion-related metabolism were persistent and static during DSS colitis, with no changes for any parameter tested (Figures 4H, 4I, 4K, and 4L). Taken together, these data suggest that, although colon-resident γδ17 cells are highly enriched for mitochondrial content/activity, cellular activation in DSS colitis did not destabilize or enhance this pre-established metabolic trait.
Last, we analyzed metabolic capacity for lipid uptake, which has been shown to be a preferential function of γδ17 cells isolated from lymphoid tissues.14,16 Lipid uptake was robust for both subsets, with similar percentages of cells demonstrating a high capacity to take up labeled palmitate (BODIPY-FL-C16) (Figures 4M and 4N). While uptake was not subset specific, the MFI of BODIPY-FL-C16 was higher in γδ17 cells, an attribute that persisted in antibiotic-treated mice, although gating of γδ T cell subsets was obfuscated in this setting, as described above (Figure S4). Intriguingly, in contrast to the static nature of mitochondrion-related metabolism, lipid uptake by γδ17 cells was enhanced during DSS colitis, suggesting that inflammation-associated activation of γδ17 cells in the colon was concomitant with augmented lipid metabolism. This metabolic response did not occur in the γδIFN-γ subset, supporting the conclusion that enhanced lipid uptake in DSS colitis was an acute, subset-specific response of γδ17 cells (Figure 4O). That lipid uptake and TCR signaling were selectively enhanced suggests that altered dynamics of lipid homeostasis support augmented IL-17 production and cellular activation of γδ17 cells in response to intestinal inflammation.
DISCUSSION
γδ T cells are sculpted in the thymus and by environmental cues,3,8–16,46,47 and while an impact of microbiota is not unexpected, the nature of this regulation has been difficult to pinpoint for the γδ17 subset, perhaps because previous investigations focused on cytokines produced upon exogenous stimulation.27,28 By instead focusing on in situ IL-17 production, we identified a binary module for microbiota-mediated regulation where IL-17 effector functions and the inhibitory module, PD-1, were mutually upregulated in a microbiota-dependent fashion. The interplay between microbiota-induced PD-1 and IL-17, dynamics of the microbes that upregulate these modules, and likely also microbiota-derived short-chain fatty acids (28) together sculpt γδ17 cells in the intestine and other mucosal barriers.
Mechanisms underpinning PD-1 expression have focused on αβ T cells, which in some settings become “exhausted,” where the PD-1high phenotype is linked to their dysfunction.34,48 The PD-1high phenotype of exhausted αβ T cells is thought permanent because of remodeling of the PD-1-encoding locus.32,33,49 PD-1 expressed by follicular T helper cells is also permanent and critical for their function in germinal centers.34,50,51 The impermanence of the PD-1high phenotype of mucosal γδ17 cells is thus a stark contrast to PD-1+ αβ T cells, suggesting distinct regulatory mechanisms that control modifications of the PD-1-encoding locus. Like mucosal barriers, skin also contains PD-1+ γδ17 cells,11 implicating these and PD-1-inducing microbiota in various tissue outcomes during PD-1 blockade and autoimmunity associated with PD-1 deficiency.34,52 Indeed, while this manuscript was in revision, two reports found PD-1+ γδ17 cells among tumor infiltrates in mice, raising the possibility that γδ17 cells could be modulated by anti-PD-1 immunotherapy.53,54 This therapy may also act on γδIFN-γ cells because we found many PD-1+ γδIFN-γ cells in lymph nodes and lungs, and in humans, PD-1+, IFNγ-producing γδ T cells were identified in breast tissue and peripheral blood.55–58 PD-1’s mode of action on either γδ T subset should become clear when these cells are evaluated in environments where they receive physiological cues, including those originating from microbiota.
Our findings demonstrate the dynamic nature of TCR signaling, IL-17, PD-1, and lipid metabolism in response to intestinal inflammation. These augmentations were specific to γδ17 cells and define characteristics of inflammation-associated activation of these effectors. These acute remodeling events are likely fundamental to the innate-like abilities of γδ17 cells, and if conserved across tissues and disease states, these findings open doors to therapies that modulate γδ signaling via TCR or PD-1 modalities. Indeed, recombinant PD-L1 improves outcomes in mouse models of colitis,59 suggesting that the inhibitory PD-1 module on γδ17 cells is a therapeutic target during intestinal inflammation. Other therapeutic modalities centered around modulating bioavailable lipids or lipid metabolism are also attractive new possibilities.
Limitations of the study
While short-term anti-PD-1 was used to address the functional role of PD-1 signaling in γδ17 cells, it remains possible that the impact on this population was indirect. The physiological role of PD-1 expression on γδ17 cells in steady-state, colitis, and other settings needs further functional assessment of impact and significance; a clear answer to these questions would require cell-specific deletion of PD-1 on γδ17 cells. A technical limitation exists in that there are no commercially available antibodies to test the full repertoire of Vγ chains, and thus we cannot formally know the Vγ composition of PD-1+ γδ17 cells. Another technical limitation exists in antibiotic-treated mice, where downregulation of PD-1 obfuscates the gating strategy used to distinguish γδ T cell populations in the colon LP.
STAR★METHODS
RESOURCE AVAILABILITY
Lead contact
Further information and requests for resources and reagents should be directed to and will be fulfilled by the lead contact, Gianna Hammer (gianna.hammer@path.utah.edu).
Materials availability
This study did not generate new unique reagents.
Data and code availability
All data reported in this paper will be shared by the lead contact upon request.
This paper does not report original code.
Any additional information required to reanalyze the data reported in this paper is available from the lead contact upon request.
EXPERIMENTAL MODELS AND SUBJECT DETAILS
Mice
Both male and female mice were used for all experiments. Il17a-GFP mice (C57BL/6-Il17atm1Bcgen/J, stock #018472) and Nur77-GFP mice (C57BL/6-Tg(Nr4a1-EGFP/cre)820Khog/J, stock #016617) were purchased from The Jackson Laboratory. Muc2−/− mice41 crossed to a C57BL/6 background43 were imported to Duke University and further crossed to in-house C57BL/6J breeders purchased from the Jackson Laboratory. Colitic Muc2−/− mice were analyzed at 19–20 weeks of age. All other mice were analyzed between 8 and 12 weeks of age unless specially mentioned. Germ-free mice were housed at Duke University. All other mice were maintained under specific pathogen free “ultrabarrier” conditions (Helicobacter, Norovirus and Pasteurella pathogens were excluded) in housing at Duke University or University of Utah. All procedures were conducted with Institutional Animal Care and Use Committee approval at either Duke University or the University of Utah.
METHOD DETAILS
Cellular isolation from tissues
For intestine-resident cells, luminal contents were removed, tissue chopped into 2 mm segments, and intestinal tissue pieces were washed twice with HBSS/10mM HEPES/5mM EDTA/0.625% BSA/1mM DTT for 10 min at 37°C.60 Supernatant was collected from these washes to isolate intraepithelial lymphocytes. Tissue was then washed for 10 min at 37°C with HBSS/10mM HEPES/0.625% BSA followed by incubation in C-tubes (Miltenyi) with digestion cocktail containing Liberase (57.6 μg/mL) and DNase I (8 U/mL).60 Tissue was digested for 37°C for 30 min with shaking, followed by GentleMACS dissociation (Miltenyi). Proximal and distal small intestine samples were each ~10 cm long and defined as the first (stomach adjacent) or last (cecum adjacent) quarter of the small intestinal organ.
For isolation of uterine-resident cells minced uteri were incubated at 37°C in C-tubes in Liberase (57.6 μg/mL) and DNase I (8 U/mL) for 1 h, dissociated by GentleMACS (Miltenyi), and incubated again at 37°C for an additional 20 min. Samples were processed a final time by GentleMACS (Miltenyi) prior to cell isolation. For lung-resident cells, lung was inflated with solution containing Liberase (60 μg/mL) and DNase I (6500 U/mL) in HBSS/10mM HEPES/5%FBS, followed by incubation at 37°C for 45 min, with vigorous vortex every 15 min.61 After digestion all cellular suspensions were filtered and subjected to RBC lysis prior to analysis.
Flow cytometry and cell sorting
Freshly isolated cells were stained with FcR block (Biolegend) and Live/dead fixable dead cell staining (Thermo Fisher) followed by antibodies below to gate T cell populations, surface marker, and cytokine expression: anti-CD45 (30-F11), anti-CD3ε (145-2C11), anti-TCRβ (H57-597), anti-TCRδ (GL3), anti-CD4 (GK1.5), anti-CD8α (53-6.7), anti-CD44 (IM7), anti-PD-1 (29F.1A12), anti-CD69 (H1.2F3), anti-CD27 (LG.3A10), anti-CCR6 (29-2L17), anti-Vγ1/2 (4B2.9), anti-Vγ4 (UC3-10A6), anti-IFNγ (XMG1.2), anti-IL-17A (TC11-18H10.1), anti-Nur77 (12.14), and anti-RORγt (B2D). All populations analyzed were gated from live cells according to following markers, γδ T cells, (CD45+CD3+TCRδ+TCRβ−, followed by PD-1 and CD44 to distinguish PD-1+CD44high, PD-1−CD44high, and PD-1−CD44mid populations; in some experiments CD27, CCR6, Vγ1/2, or Vγ4 were also used); CD4 T cells, (CD45+CD3+TCRβ+TCRδ−CD4+); CD8 T cells, (CD45+CD3+TCRβ+TCRδ−CD8α+). For intracellular staining of cytokines, cells were stimulated with PMA (50 ng/mL) and ionomycin (2000 ng/mL) for 5h in complete RPMI medium with BD Golgi plug (BD Biosciences). Stimulated cells were fixed by eBioscience IC fixation buffer (Invitrogen) and for RORγt and Nur77 staining, cells were fixed by eBioscience Foxp3/Tanscription factor fixation/permeabilization concentrate and diluent (Invitrogen) followed by intracellular antibody staining. Flow cytometry analysis was performed on a BD Fortessa X20 (BD Biosciences), and data further analyzed using FlowJo software. For FACS sorting, cells were gated as described above and sorted by MoFlo Astrios Sorter (Beckman Coulter).
Quantitative PCR
For each experiment, colon lamina propria cells were pooled from 5 mice and γδ T cell subsets sorted into TriZol (Thermo Fisher). cDNA was generated using QuantiTect Reverse Transcription Kit (Qiagen) and gene expression analyzed using TaqMan Gene Expression Master Mix (AppliedBiosystems) with the following TaqMan probes: Il17a (Mm00439618_m1), Il17f (Mm00521423_m1), IFNγ (Mm01168134_m1), and Hprt (Mm03024075_m1). Data were analyzed according to the 2^ddct algorithm.
In vivo PD-1 and IL-1β blockade
For PD-1 blockade, Il17a-GFP mice were injected intraperitoneally with 200 μg of anti-PD-1 (RMP1-14, BioXcell) or isotype control Rat IgG2a (2A3, BioXcell) antibodies for three consecutive days. Mice were analyzed 24 h after the third antibody injection. For IL-1β blockade, Il17a-GFP mice were injected intraperitoneally with 200 μg of anti-IL-1β (B122, BioXcell) or isotype control polyclonal Armenian hamster IgG (BioXcell) twice a week for 2 weeks. Mice were analyzed 24 h after the last antibody injection.
Antibiotic treatment and DSS-induced colitis
Mice 8 to 10-weeks old received broad spectrum antibiotics containing ampicillin (1 g/L), vancomycin (500 mg/L), neomycin sulfate (1 g/L), metronidazole (1 g/L), and fluconazole (500 mg/L) in drinking water for 4 weeks. For DSS treatment mice were provided 2% (w/v) dextran sulfate sodium (DSS, Chem-Impex) in drinking water for 7 days. Following DSS withdrawal, mice were provided normal drinking water. Body weight was assessed throughout the experiment. Mice were analyzed at day 3 for early stage, or day 7–10 for inflammation stage of disease. In some experiments mice were administered antibiotics for 4 weeks prior to, and for the duration of DSS treatment.
Mitochondrial content/activity and lipid uptake
All reagents for metabolic analysis were purchased from Invitrogen and used per manufacturer’s instruction. LP cells were incubated for 30 min at 37C° with one of the following reagents: 200 nM tetramethylrhodamine ethyl ester (TMRE) to assess mitochondrial potential, 200 nM MitoTracker Green to measure mitochondrial mass (MitoGreen staining is independent of mitochondrial membrane potential), or 1 μM Bodipy-FL-C16 (palmitate) to measure lipid uptake. Cells were analyzed immediately by flow cytometry.
Intravascular staining for CD45+ cells in lung
To distinguish vascular and tissue-resident immune cells mice were anesthetized and retro-orbitally injected with 3 μg FITC anti-CD45 (30-F11).62 Mice were euthanized 5 min post-injection, followed by immediate preparation of lung immune cells.
QUANTIFICATION AND STATISTICAL ANALYSIS
Statistical analysis was performed using GraphPad Prism (GraphPad, San Diego, CA) to perform 2-tailed Student’s t-test or one-way ANOVA with Tukey’s post hoc test, as appropriate. The data point represents one mouse or combined samples as indicated in figure legends or table legends. Data are presented as mean ± SD. The sample sizes, statistical tests, and p values are indicated in figure legends. p values are classified as follows: *p < 0.05, **p < 0.01, ***p < 0.001, ****p < 0.0001.
Supplementary Material
KEY RESOURCES TABLE
| REAGENT or RESOURCE | SOURCE | IDENTIFIER |
|---|---|---|
| Antibodies | ||
| Brilliant Violet 785™ anti-mouse CD45 (30-F11) | Biolegend | Cat#103149; RRID:AB_2564590 |
| Biotin anti-mouse CD3ε (145-2C11) | Biolegend | Cat#100304; RRID:AB_312669 |
| FITC anti-mouse TCRβ (H57-597) | Biolegend | Cat#109206; RRID:AB_313429 |
| PE/Cyanine7 anti-mouse TCRβ (H57-597) | Biolegend | Cat#109222; RRID:AB_893625 |
| APC/Fire™ 750 anti-mouse TCRγ/δ (GL3) | Biolegend | Cat#118136; RRID:AB_2650828 |
| PE anti-mouse TCRγ/δ (GL3) | Biolegend | Cat#118108; RRID:AB_313832 |
| Brilliant Violet 510™ anti-mouse CD4 (GK1.5) | Biolegend | Cat#100449; RRID:AB_2564587 |
| Brilliant Violet 711™ anti-mouse CD8α (53-6.7) | Biolegend | Cat#100747; RRID:AB_11219594 |
| PerCP/Cyanine5.5 anti-mouse CD44 (IM7) | Biolegend | Cat#103032; RRID:AB_2076204 |
| APC anti-mouse PD-1 (29F.1A12) | Biolegend | Cat#135210; RRID:AB_2159183 |
| Brilliant Violet 421™ anti-mouse PD-1 (29F.1A12) | Biolegend | Cat#135221; RRID:AB_2562568 |
| PE anti-mouse CD69 (H1.2F3) | Biolegend | Cat#104507; RRID:AB_313110 |
| PE anti-mouse CD27 (LG.3A10) | Biolegend | Cat#124209; RRID:AB_1236464 |
| APC anti-mouse CCR6 (29-2L17) | Biolegend | Cat#129813; RRID:AB_1877148 |
| PE anti-mouse Vγ1/2 (4B2.9) | Biolegend | Cat#142703; RRID:AB_10960739 |
| APC ant-mouse Vγ4 (UC3-10A6) | Biolegend | Cat#137707; RRID:AB_10899574 |
| PE/Cyanine7 anti-mouse IFNγ (XMG1.2) | Biolegend | Cat#505826; RRID:AB_2295770 |
| PE anti-mouse IL-17A (TC11-18H10.1) | Biolegend | Cat#506904; RRID:AB_315464 |
| TruStain FcX™ PLUS (anti-mouse CD16/32) (S17011E) | Biolegend | Cat#156604; RRID:AB_2783138 |
| FITC CD45 (30-F11), eBioscience | Invitrogen | Cat#11-0451-81; RRID:AB_465049 |
| PE anti-mouse RORγt (B2D), eBioscience | Invitrogen | Cat#12-6981-82; RRID:AB_10807092 |
| PE anti-mouse Nur77 (12.14), eBioscience | Invitrogen | Cat#12-5965-80; RRID:AB_1257210 |
| InVivoMAb™ anti-mouse PD-1 (RMP1-14) | Bio X cell | Cat#BE0146; RRID:AB_10949053 |
| InVivoMAb™ rat IgG2a isotype control (2A3) | Bio X cell | Cat#BE0089; RRID:AB_1107769 |
| InVivoMAb™ anti-mouse/rat IL-1β (B122) | Bio X cell | Cat#BE0246; RRID:AB_2687727 |
| InVivoMAb™ Polyclonal Armenian hamster IgG | Bio X cell | Cat#BE0091; RRID:AB_1107773 |
|
Chemicals, peptides, and recombinant proteins | ||
| LIBERASE™ research grade | Sigma Aldrich | Cat#5401127001 |
| DNase I recombinant, RNase-free solution | Sigma Aldrich | Cat#04716728001 |
| Ampicillin | Duke University Hospital pharmacy | N/A |
| Vancomycin Hydrocholoride | Duke University Hospital pharmacy | N/A |
| Neomycin | Duke University Hospital pharmacy | N/A |
| Metronidazole | Duke University Hospital pharmacy | N/A |
| Fluconazole | Duke University Hospital pharmacy | N/A |
| Dextran sulfate sodium salt (DSS), Mw ~ 40000 | Chem-Impex | Cat#01288 |
| IC fixation buffer | Invitrogen | Cat#00-8222-49 |
| eBioscience™ Fixation/Permeabilization concentrate | Invitrogen | Cat#00-5123-43 |
| eBioscience™ Fixation/Permeabilization diluent | Invitrogen | Cat#00-5223-56 |
| Permeabilization buffer 10× | Invitrogen | Cat#00-8333-56 |
| TRIzol Reagent | Invitrogen | Cat#15596026 |
| Phorbol 12-myristate 13-acetate (PMA) | Sigma Aldrich | Cat#P8139 |
| Ionomycin calcium salt from Streptomyces conglobatus | Sigma Aldrich | Cat#I0634 |
| BD Golgi Plug™ protein transport inhibitor | BD Biosciences | Cat#555029 |
| eBioscience™ RBC Lysis buffer (multi-species) 10× | Invitrogen | Cat#00-4300-54 |
| LIVE/DEAD™ fixable blue dead cell stain kit | Invitrogen | Cat#L34962 |
| LIVE/DEAD™ fixable green dead cell stain kit | Invitrogen | Cat#L23101 |
| MitoTracker™ Green FM | Invitrogen | Cat#M7514 |
| Tetramethylrhodamine, Ethyl Ester, Perchlorate (TMRE) | Invitrogen | Cat#T669 |
| BODIPY™ FL C16 (4,4-Difluoro-5,7-Dimethyl-4-Bora-3a,4a-Diaza-s-Indacene-3-Hexadecanoic Acid) | Invitrogen | Cat#D3821 |
|
Critical commercial assays | ||
| TaqMan probe: Il17a | Thermo Fisher Scientific | Mm00439118_m1 |
| TaqMan probe: Il17f | Thermo Fisher Scientific | Mm0052143_m1 |
| TaqMan probe: IFNγ | Thermo Fisher Scientific | Mm01168134_m1 |
| TaqMan probe: Hprt | Thermo Fisher Scientific | Mm03024075_m1 |
| QuantiTect Reverse Transcription kit | Qiagen | Cat#205313 |
| TaqMan™ Gene Expression Master Mix | appliedbiosystems | Cat#4369016 |
|
Experimental models: Organisms/strains | ||
| Mouse: Il17a-GFP mice (C57BL/6-Il17atm1Bcgen/J) | Jackson Laboratory | Strain#018472; RRID:IMSR_JAX:018472 |
| Mouse: Nur77-GFP mice (C57BL/6-Tg (Nr4a1-EGFP/cre)820Khog/J) | Jackson Laboratory | Strain#016617; RRID:IMSR_JAX:016617 |
| Mouse: C57BL/6J | Jackson Laboratory | Strain#000664; RRID:IMSR_JAX:000664 |
| Mouse: Muc2−/− mice | Velcich et al.41 | N/A |
| Germ-free mice | Duke University Gnotobiotic Core | N/A |
|
Software and algorithms | ||
| FlowJo™ v10 | BD Biosciences | https://www.flowjo.com/solutions/flowjo/downloads |
| GraphPad Prism v9 | GraphPad | https://www.graphpad.com/ |
|
Other | ||
| BD LSRFortessa X20 Cell Analyzer | BD Biosciences | N/A |
| BD LSRFortessa Cell Analyzer | BD Biosciences | N/A |
| GentleMACS™ Dissociator | Miltenyi Biotec Inc. | N/A |
Highlights.
Mucosal barrier-resident γδ17 cells are preferentially PD-1high
Microbiota instruct and sustain γδ17 expression of PD-1 and IL-17
PD-1’s inhibitory effect on γδ17 cells restricts in situ IL-17 production
Intestinal inflammation augments γδ17 TCR signals, PD-1, IL-17, and lipid uptake
ACKNOWLEDGMENTS
The authors would like to thank Dr. Diana Healey for advice on reagents to investigate metabolism and Dr. Amanda MacLeod and Dr. Melodi Whitley for advice on γδ T cells in skin. Some components of the graphical abstract were prepared using BioRender software. These studies were supported by an American Association of Immunologists Careers in Immunology training award (to H.-IH.), NIH R01-AI088100 (to M.L.S.), a V Foundation scholar award (to G.E.H.), and NIH R01-AI145930 (to G.E.H.). G.E.H. is also supported as a Burroughs Wellcome Fund Investigator in the Pathogenesis of Infectious Disease.
Footnotes
DECLARATION OF INTERESTS
The authors declare no competing interests.
INCLUSION AND DIVERSITY
One or more of the authors of this paper self-identifies as an underrepresented ethnic minority in their field of research or within their geographical location. One or more of the authors of this paper self-identifies as a gender minority in their field of research. We support inclusive, diverse, and equitable conduct of research.
SUPPLEMENTAL INFORMATION
Supplemental information can be found online at https://doi.org/10.1016/j.celrep.2023.112951.
REFERENCES
- 1.Ribot JC, deBarros A, Pang DJ, Neves JF, Peperzak V, Roberts SJ, Girardi M, Borst J, Hayday AC, Pennington DJ, and Silva-Santos B (2009). CD27 is a thymic determinant of the balance between interferon-gamma- and interleukin 17-producing gammadelta T cell subsets. Nat. Immunol 10, 427–436. [DOI] [PMC free article] [PubMed] [Google Scholar]
- 2.Haas JD, González FHM, Schmitz S, Chennupati V, Föhse L, Kremmer E, Förster R, and Prinz I (2009). CCR6 and NK1.1 distinguish between IL-17A and IFN-γamma-producing gammadelta effector T cells. Eur. J. Immunol 39, 3488–3497. [DOI] [PubMed] [Google Scholar]
- 3.Turchinovich G, and Hayday AC (2011). Skint-1 identifies a common molecular mechanism for the development of interferon-γ-secreting versus interleukin-17-secreting γδ T cells. Immunity 35, 59–68. [DOI] [PubMed] [Google Scholar]
- 4.Haas JD, Ravens S, Düber S, Sandrock I, Oberdörfer L, Kashani E, Chennupati V, Föhse L, Naumann R, Weiss S, et al. (2012). Development of interleukin-17-producing γδ T cells is restricted to a functional embryonic wave. Immunity 37, 48–59. [DOI] [PubMed] [Google Scholar]
- 5.Sumaria N, Grandjean CL, Silva-Santos B, and Pennington DJ (2017). Strong TCRγδ Signaling Prohibits Thymic Development of IL-17A-Secreting γδ T Cells. Cell Rep 19, 2469–2476. [DOI] [PMC free article] [PubMed] [Google Scholar]
- 6.Sandrock I, Reinhardt A, Ravens S, Binz C, Wilharm A, Martins J, Oberdörfer L, Tan L, Lienenklaus S, Zhang B, et al. (2018). Genetic models reveal origin, persistence and non-redundant functions of IL-17-producing γδ T cells. J. Exp. Med 215, 3006–3018. [DOI] [PMC free article] [PubMed] [Google Scholar]
- 7.Tan L, Fichtner AS, Bruni E, Odak I, Sandrock I, Bubke A, Borchers A, Schultze-Florey C, Koenecke C, Förster R, et al. (2021). A fetal wave of human type 3 effector γδ cells with restricted TCR diversity persists into adulthood. Sci. Immunol 6, eabf0125. [DOI] [PubMed] [Google Scholar]
- 8.Ismail AS, Severson KM, Vaishnava S, Behrendt CL, Yu X, Benjamin JL, Ruhn KA, Hou B, DeFranco AL, Yarovinsky F, and Hooper LV (2011). Gammadelta intraepithelial lymphocytes are essential mediators of host-microbial homeostasis at the intestinal mucosal surface. Proc. Natl. Acad. Sci. USA 108, 8743–8748. [DOI] [PMC free article] [PubMed] [Google Scholar]
- 9.Hoytema van Konijnenburg DP, Reis BS, Pedicord VA, Farache J, Victora GD, and Mucida D (2017). Intestinal Epithelial and Intraepithelial T Cell Crosstalk Mediates a Dynamic Response to Infection. Cell 171, 783–794.e13. [DOI] [PMC free article] [PubMed] [Google Scholar]
- 10.Di Marco Barros R, Roberts NA, Dart RJ, Vantourout P, Jandke A, Nussbaumer O, Deban L, Cipolat S, Hart R, Iannitto ML, et al. (2016). Epithelia Use Butyrophilin-like Molecules to Shape Organ-Specific γδ T Cell Compartments. Cell 167, 203–218.e17. [DOI] [PMC free article] [PubMed] [Google Scholar]
- 11.Tan L, Sandrock I, Odak I, Aizenbud Y, Wilharm A, Barros-Martins J, Tabib Y, Borchers A, Amado T, Gangoda L, et al. (2019). Single-Cell Transcriptomics Identifies the Adaptation of Scart1+ Vγ6+ T Cells to Skin Residency as Activated Effector Cells. Cell Rep 27, 3657–3671.e4. [DOI] [PubMed] [Google Scholar]
- 12.Kadekar D, Agerholm R, Rizk J, Neubauer HA, Suske T, Maurer B, Viñals MT, Comelli EM, Taibi A, Moriggl R, and Bekiaris V (2020). The neonatal microenvironment programs innate γδ T cells through the transcription factor STAT5. J. Clin. Invest 130, 2496–2508. [DOI] [PMC free article] [PubMed] [Google Scholar]
- 13.Jandke A, Melandri D, Monin L, Ushakov DS, Laing AG, Vantourout P, East P, Nitta T, Narita T, Takayanagi H, et al. (2020). Butyrophilin-like proteins display combinatorial diversity in selecting and maintaining signature intraepithelial γδ T cell compartments. Nat. Commun 11, 3769–3816. [DOI] [PMC free article] [PubMed] [Google Scholar]
- 14.Lopes N, McIntyre C, Martin S, Raverdeau M, Sumaria N, Kohlgruber AC, Fiala GJ, Agudelo LZ, Dyck L, Kane H, et al. (2021). Distinct metabolic programs established in the thymus control effector functions of γδ T cell subsets in tumor microenvironments. Nat. Immunol 22, 179–192. [DOI] [PMC free article] [PubMed] [Google Scholar]
- 15.Sagar, Pokrovskii M, Herman JS, Naik S, Sock E, Zeis P, Lausch U, Wegner M, Tanriver Y, Littman DR, and Grün D (2020). Deciphering the regulatory landscape of fetal and adult γδ T-cell development at single-cell resolution. EMBO J 39, e104159. [DOI] [PMC free article] [PubMed] [Google Scholar]
- 16.Fu Z, Dean JW, Xiong L, Dougherty MW, Oliff KN, Chen Z-ME, Jobin C, Garrett TJ, and Zhou L (2021). Mitochondrial transcription factor A in RORγt+ lymphocytes regulate small intestine homeostasis and metabolism. Nat. Commun 12, 4462–4516. [DOI] [PMC free article] [PubMed] [Google Scholar]
- 17.Sheridan BS, Romagnoli PA, Pham Q-M, Fu H-H, Alonzo F, Schubert W-D, Freitag NE, and Lefrançois L (2013). γδ T cells exhibit multifunctional and protective memory in intestinal tissues. Immunity 39, 184–195. [DOI] [PMC free article] [PubMed] [Google Scholar]
- 18.Muzaki ARBM, Soncin I, Setiagani YA, Sheng J, Tetlak P, Karjalainen K, and Ruedl C (2017). Long-Lived Innate IL-17-Producing γ/δ T Cells Modulate Antimicrobial Epithelial Host Defense in the Colon. J. Immunol 199, 3691–3699. [DOI] [PubMed] [Google Scholar]
- 19.Chen Y-S, Chen I-B, Pham G, Shao T-Y, Bangar H, Way SS, and Haslam DB (2020). IL-17-producing γδ T cells protect against Clostridium difficile infection. J. Clin. Invest 130, 2377–2390. [DOI] [PMC free article] [PubMed] [Google Scholar]
- 20.Martin B, Hirota K, Cua DJ, Stockinger B, and Veldhoen M (2009). Interleukin-17-producing gammadelta T cells selectively expand in response to pathogen products and environmental signals. Immunity 31, 321–330. [DOI] [PubMed] [Google Scholar]
- 21.Sutton CE, Lalor SJ, Sweeney CM, Brereton CF, Lavelle EC, and Mills KHG (2009). Interleukin-1 and IL-23 induce innate IL-17 production from gammadelta T cells, amplifying Th17 responses and autoimmunity. Immunity 31, 331–341. [DOI] [PubMed] [Google Scholar]
- 22.Duan J, Chung H, Troy E, and Kasper DL (2010). Microbial colonization drives expansion of IL-1 receptor 1-expressing and IL-17-producing gamma/delta T cells. Cell Host Microbe 7, 140–150. [DOI] [PMC free article] [PubMed] [Google Scholar]
- 23.Wesch D, Peters C, Oberg H-H, Pietschmann K, and Kabelitz D (2011). Modulation of γδ T cell responses by TLR ligands. Cell. Mol. Life Sci 68, 2357–2370. [DOI] [PMC free article] [PubMed] [Google Scholar]
- 24.Melandri D, Zlatareva I, Chaleil RAG, Dart RJ, Chancellor A, Nussbaumer O, Polyakova O, Roberts NA, Wesch D, Kabelitz D, et al. (2018). The γδTCR combines innate immunity with adaptive immunity by utilizing spatially distinct regions for agonist selection and antigen responsiveness. Nat. Immunol 19, 1352–1365. [DOI] [PMC free article] [PubMed] [Google Scholar]
- 25.McKenzie DR, Kara EE, Bastow CR, Tyllis TS, Fenix KA, Gregor CE, Wilson JJ, Babb R, Paton JC, Kallies A, et al. (2017). IL-17-producing γδ T cells switch migratory patterns between resting and activated states. Nat. Commun 8, 15632–15713. [DOI] [PMC free article] [PubMed] [Google Scholar]
- 26.Ismail AS, Behrendt CL, and Hooper LV (2009). Reciprocal interactions between commensal bacteria and gamma delta intraepithelial lymphocytes during mucosal injury. J. Immunol 182, 3047–3054. [DOI] [PMC free article] [PubMed] [Google Scholar]
- 27.Polese B, Thurairajah B, Zhang H, Soo CL, McMahon CA, Fontes G, Hussain SNA, Abadie V, and King IL (2021). Prostaglandin E2 amplifies IL-17 production by γδ T cells during barrier inflammation. Cell Rep 36, 109456. [DOI] [PubMed] [Google Scholar]
- 28.Dupraz L, Magniez A, Rolhion N, Richard ML, Da Costa G, Touch S, Mayeur C, Planchais J, Agus A, Danne C, et al. (2021). Gut microbiota-derived short-chain fatty acids regulate IL-17 production by mouse and human intestinal γδ T cells. Cell Rep 36, 109332. [DOI] [PubMed] [Google Scholar]
- 29.Wu P, Wu D, Ni C, Ye J, Chen W, Hu G, Wang Z, Wang C, Zhang Z, Xia W, et al. (2014). γδT17 cells promote the accumulation and expansion of myeloid-derived suppressor cells in human colorectal cancer. Immunity 40, 785–800. [DOI] [PMC free article] [PubMed] [Google Scholar]
- 30.Lee JS, Tato CM, Joyce-Shaikh B, Gulen MF, Cayatte C, Chen Y, Blumenschein WM, Judo M, Ayanoglu G, McClanahan TK, et al. (2015). Interleukin-23-Independent IL-17 Production Regulates Intestinal Epithelial Permeability. Immunity 43, 727–738. [DOI] [PMC free article] [PubMed] [Google Scholar]
- 31.Do J-S, Kim S, Keslar K, Jang E, Huang E, Fairchild RL, Pizarro TT, and Min B (2017). γδ T Cells Coexpressing Gut Homing α4β7 and αE Integrins Define a Novel Subset Promoting Intestinal Inflammation. J. Immunol 198, 908–915. [DOI] [PMC free article] [PubMed] [Google Scholar]
- 32.Bally APR, Austin JW, and Boss JM (2016). Genetic and Epigenetic Regulation of PD-1 Expression. J. Immunol 196, 2431–2437. [DOI] [PMC free article] [PubMed] [Google Scholar]
- 33.Sen DR, Kaminski J, Barnitz RA, Kurachi M, Gerdemann U, Yates KB, Tsao H-W, Godec J, LaFleur MW, Brown FD, et al. (2016). The epigenetic landscape of T cell exhaustion. Science 354, 1165–1169. [DOI] [PMC free article] [PubMed] [Google Scholar]
- 34.Sharpe AH, and Pauken KE (2018). The diverse functions of the PD1 inhibitory pathway. Nat. Rev. Immunol 18, 153–167. [DOI] [PubMed] [Google Scholar]
- 35.Moran AE, Holzapfel KL, Xing Y, Cunningham NR, Maltzman JS, Punt J, and Hogquist KA (2011). T cell receptor signal strength in Treg and iNKT cell development demonstrated by a novel fluorescent reporter mouse. J. Exp. Med 208, 1279–1289. [DOI] [PMC free article] [PubMed] [Google Scholar]
- 36.Prinz I, Silva-Santos B, and Pennington DJ (2013). Functional development of γδ T cells. Eur. J. Immunol 43, 1988–1994. –1994. [DOI] [PubMed] [Google Scholar]
- 37.Wilharm A, Tabib Y, Nassar M, Reinhardt A, Mizraji G, Sandrock I, Heyman O, Barros-Martins J, Aizenbud Y, Khalaileh A, et al. (2019). Mutual interplay between IL-17-producing γδT cells and microbiota orchestrates oral mucosal homeostasis. Proc. Natl. Acad. Sci. USA 116, 2652–2661. [DOI] [PMC free article] [PubMed] [Google Scholar]
- 38.Nishimura H, Agata Y, Kawasaki A, Sato M, Imamura S, Minato N, Yagita H, Nakano T, and Honjo T (1996). Developmentally regulated expression of the PD-1 protein on the surface of double-negative (CD4-CD8-) thymocytes. Int. Immunol 8, 773–780. [DOI] [PubMed] [Google Scholar]
- 39.Liang SC, Latchman YE, Buhlmann JE, Tomczak MF, Horwitz BH, Freeman GJ, and Sharpe AH (2003). Regulation of PD-1, PD-L1, and PD-L2 expression during normal and autoimmune responses. Eur. J. Immunol 33, 2706–2716. [DOI] [PubMed] [Google Scholar]
- 40.Caruso R, Lo BC, and Núñez G (2020). Host-microbiota interactions in inflammatory bowel disease. Nat. Rev. Immunol 20, 411–426. [DOI] [PubMed] [Google Scholar]
- 41.Velcich A, Yang W, Heyer J, Fragale A, Nicholas C, Viani S, Kucherlapati R, Lipkin M, Yang K, and Augenlicht L (2002). Colorectal cancer in mice genetically deficient in the mucin Muc2. Science 295, 1726–1729. [DOI] [PubMed] [Google Scholar]
- 42.Van der Sluis M, De Koning BAE, De Bruijn ACJM, Velcich A, Meijerink JPP, Van Goudoever JB, Büller HA, Dekker J, Van Seuningen I, Renes IB, and Einerhand AWC (2006). Muc2-deficient mice spontaneously develop colitis, indicating that MUC2 is critical for colonic protection. Gastroenterology 131, 117–129. [DOI] [PubMed] [Google Scholar]
- 43.Wenzel UA, Magnusson MK, Rydström A, Jonstrand C, Hengst J, Johansson MEV, Velcich A, Öhman L, Strid H, Sjövall H, Hansson GC, and Wick MJ (2014). Spontaneous colitis in Muc2-deficient mice reflects clinical and cellular features of active ulcerative colitis. PLoS One 9, e100217. [DOI] [PMC free article] [PubMed] [Google Scholar]
- 44.Yang K, Blanco DB, Chen X, Dash P, Neale G, Rosencrance C, Easton J, Chen W, Cheng C, Dhungana Y, Kc A, Awad W, Guo XZJ, Thomas PG, and Chi H (2018). Metabolic signaling directs the reciprocal lineage decisions of αβ and γδ T cells. Sci. Immunol 3, eaas9818. [DOI] [PMC free article] [PubMed] [Google Scholar]
- 45.Harly C, Joyce SP, Domblides C, Bachelet T, Pitard V, Mannat C, Pappalardo A, Couzi L, Netzer S, Massara L, Obre E, Hawchar O, Lartigue L, Claverol S, Cano C, Moreau JF, Mahouche I, Soubeyran I, Rossignol R, Viollet B, Willcox CR, Mohammed F, Willcox BE, Faustin B, and Déchanet-Merville J (2021). Human γδ T cell sensing of AMPK-dependent metabolic tumor reprogramming through TCR recognition of EphA2. Sci. Immunol 6, eaba9010. [DOI] [PubMed] [Google Scholar]
- 46.Anipindi VC, Bagri P, Dizzell SE, Jiménez-Saiz R, Jordana M, Snider DP, Stämpfli MR, and Kaushic C (2019). IL-17 Production by γδ+ T Cells Is Critical for Inducing Th17 Responses in the Female Genital Tract and Regulated by Estradiol and Microbiota. Immunohorizons 3, 317–330. [DOI] [PubMed] [Google Scholar]
- 47.Wilharm A, Brigas HC, Sandrock I, Ribeiro M, Amado T, Reinhardt A, Demera A, Hoenicke L, Strowig T, Carvalho T, Prinz I, and Ribot JC (2021). Microbiota-dependent expansion of testicular IL-17-producing Vγ6+ γδ T cells upon puberty promotes local tissue immune surveillance. Mucosal Immunol 14, 242–252. [DOI] [PMC free article] [PubMed] [Google Scholar]
- 48.Blank CU, Haining WN, Held W, Hogan PG, Kallies A, Lugli E, Lynn RC, Philip M, Rao A, Restifo NP, Schietinger A, Schumacher TN, Schwartzberg PL, Sharpe AH, Speiser DE, Wherry EJ, Youngblood BA, and Zehn D (2019). Defining ‘T cell exhaustion’. Nat. Rev. Immunol 19, 665–674. [DOI] [PMC free article] [PubMed] [Google Scholar]
- 49.Pauken KE, Sammons MA, Odorizzi PM, Manne S, Godec J, Khan O, Drake AM, Chen Z, Sen DR, Kurachi M, et al. (2016). Epigenetic stability of exhausted T cells limits durability of reinvigoration by PD-1 blockade. Science 354, 1160–1165. [DOI] [PMC free article] [PubMed] [Google Scholar]
- 50.Shi J, Hou S, Fang Q, Liu X, Liu X, and Qi H (2018). PD-1 Controls Follicular T Helper Cell Positioning and Function. Immunity 49, 264–274.e4. [DOI] [PMC free article] [PubMed] [Google Scholar]
- 51.Wang C, Hillsamer P, and Kim CH (2011). Phenotype, effector function, and tissue localization of PD-1-expressing human follicular helper T cell subsets. BMC Immunol 12. 53–15. [DOI] [PMC free article] [PubMed] [Google Scholar]
- 52.Reynoso ED, Elpek KG, Francisco L, Bronson R, Bellemare-Pelletier A, Sharpe AH, Freeman GJ, and Turley SJ (2009). Intestinal tolerance is converted to autoimmune enteritis upon PD-1 ligand blockade. J. Immunol 182, 2102–2112. [DOI] [PMC free article] [PubMed] [Google Scholar]
- 53.Reis BS, Darcy PW, Khan IZ, Moon CS, Kornberg AE, Schneider VS, Alvarez Y, Eleso O, Zhu C, Schernthanner M, Lockhart A, Reed A, Bortolatto J, Castro TBR, Bilate AM, Grivennikov S, Han AS, and Mucida D (2022). TCR-Vγδ usage distinguishes protumor from antitumor intestinal γδ T cell subsets. Science 377, 276–284. [DOI] [PMC free article] [PubMed] [Google Scholar]
- 54.Edwards SC, Hedley A, Hoevenaar WHM, Wiesheu R, Glauner T, Kilbey A, Shaw R, Boufea K, Batada N, Hatano S, Yoshikai Y, Blyth K, Miller C, Kirschner K, and Coffelt SB (2023). PD-1 and TIM-3 differentially regulate subsets of mouse IL-17A-producing γδ T cells. J. Exp. Med 220, e20211431. [DOI] [PMC free article] [PubMed] [Google Scholar]
- 55.Iwasaki M, Tanaka Y, Kobayashi H, Murata-Hirai K, Miyabe H, Sugie T, Toi M, and Minato N (2011). Expression and function of PD-1 in human γδ T cells that recognize phosphoantigens. Eur. J. Immunol 41, 345–355. [DOI] [PubMed] [Google Scholar]
- 56.Hoeres T, Holzmann E, Smetak M, Birkmann J, and Wilhelm M (2019). PD-1 signaling modulates interferon-g production by Gamma Delta (γδ) T-Cells in response to leukemia. OncoImmunology 8, 1550618. [DOI] [PMC free article] [PubMed] [Google Scholar]
- 57.Wu Y, Kyle-Cezar F, Woolf RT, Naceur-Lombardelli C, Owen J, Biswas D, Lorenc A, Vantourout P, Gazinska P, Grigoriadis A, Tutt A, and Hayday A (2019). An innate-like Vδ1+ γδ T cell compartment in the human breast is associated with remission in triple-negative breast cancer. Sci. Transl. Med 11, eaax9364. [DOI] [PMC free article] [PubMed] [Google Scholar]
- 58.Hsu H, Boudova S, Mvula G, Divala TH, Rach D, Mungwira RG, Boldrin F, Degiacomi G, Manganelli R, Laufer MK, and Cairo C (2021). Age-related changes in PD-1 expression coincide with increased cytotoxic potential in Vδ2 T cells during infancy. Cell. Immunol 359, 104244. [DOI] [PMC free article] [PubMed] [Google Scholar]
- 59.Song M-Y, Hong C-P, Park SJ, Kim J-H, Yang B-G, Park Y, Kim SW, Kim KS, Lee JY, Lee S-W, Jang MH, and Sung YC (2015). Protective effects of Fc-fused PD-L1 on two different animal models of colitis. Gut 64, 260–271. [DOI] [PubMed] [Google Scholar]
- 60.Liang J, Huang H-I, Benzatti FP, Karlsson AB, Zhang JJ, Youssef N, Ma A, Hale LP, and Hammer GE (2016). Inflammatory Th1 and Th17 in the Intestine Are Each Driven by Functionally Specialized Dendritic Cells with Distinct Requirements for MyD88. Cell Rep 17, 1330–1343. [DOI] [PMC free article] [PubMed] [Google Scholar]
- 61.Xu-Vanpala S, Deerhake ME, Wheaton JD, Parker ME, Juvvadi PR, MacIver N, Ciofani M, and Shinohara ML (2020). Functional heterogeneity of alveolar macrophage population based on expression of CXCL2. Sci. Immunol 5, eaba7350. [DOI] [PMC free article] [PubMed] [Google Scholar]
- 62.Anderson KG, Mayer-Barber K, Sung H, Beura L, James BR, Taylor JJ, Qunaj L, Griffith TS, Vezys V, Barber DL, and Masopust D (2014). Intravascular staining for discrimination of vascular and tissue leukocytes. Nat. Protoc 9, 209–222. [DOI] [PMC free article] [PubMed] [Google Scholar]
Associated Data
This section collects any data citations, data availability statements, or supplementary materials included in this article.
Supplementary Materials
Data Availability Statement
All data reported in this paper will be shared by the lead contact upon request.
This paper does not report original code.
Any additional information required to reanalyze the data reported in this paper is available from the lead contact upon request.