

Abstract
Background and Aims
Treatment adherence is key to the efficacy of exclusive enteral nutrition [100% EN] in active Crohn’s disease [CD], but there are no biomarkers to objectively estimate this. We explored faecal parameters as biomarkers of compliance with 100% EN, and subsequently developed and validated the Glasgow Exclusive Enteral Nutrition Index of Compliance [GENIE].
Methods
Healthy adults replaced all [100% EN] or part [85% EN, 50% EN, 20% EN] of their diet with a formula for 7 days. Faecal pH, water content, short chain fatty acids, and branched chain fatty acids [BCFAs] were measured before [D0] and after [D7] each intervention. Optimal biomarkers and threshold values were derived using receiver operating characteristic curve analyses and machine learning to develop the GENIE. The GENIE was then validated in 30 CD children, during and after 100% EN.
Results
In all, 61 adults were recruited. D7 faecal pH and the ratios of BCFAs to either acetate or butyrate performed the best to differentiate between patients on 100% EN from <100% EN. Two models were generated; one included faecal metabolites (Laboratory GENIE, L-GENIE; sensitivity, specificity, and positive predictive value [PPV] of 88%, 94%, and 92%) and a second one [Clinical Genie, C-GENIE] which considers only faecal pH [sensitivity, specificity, and PPV of 84%, 86%, and 81%]. Validation of GENIE in CD children found that C-GENIE outperformed L-GENIE, producing a sensitivity, specificity, and PPV of 85%, 88%, and 88%, respectively.
Conclusions
GENIE can help predict adherence to 100% EN and may complement current conventional dietary assessment.
Keywords: Biomarkers, paediatrics, exclusive enteral nutrition
Graphical Abstract
Graphical Abstract.

1. Introduction
Enteral nutrition [EN] is used for nutritional support to patients with undernutrition,1 and exclusive enteral nutrition [100% EN] as therapy in children with active Crohn’s disease [CD]2 and eosinophilic oesophagitis.3 Nonetheless, there are currently no objective biomarkers to assess compliance with 100% EN, an issue of increasing importance to achieving optimal nutritional or disease treatment outcomes.4 In routine clinical practice and in research, compliance with 100% EN is assessed using conventional dietary assessment methodology such as food diaries or dietary recalls, which are prone to misreporting bias.5 Thus, there is an unmet clinical need and strong interest towards the development of objective biomarkers to assess compliance with dietary interventions. A recent study found that the presence of gluten immunogenic peptides [GIP] in faeces of patients with coeliac disease may be used as an objective biomarker of recent gluten consumption, and by proxy compliance with a gluten-free diet.6 Similar biomarkers of compliance with 100% EN would allow the clinical team to promptly recognise non-compliant patients and modify treatment plans accordingly. We have recently shown that GIP could be one of such biomarkers of compliance in children with CD during 100% EN treatment with a gluten-free formula.4 However, GIP is suitable to detect dietary transgressions only if gluten-containing products are consumed close to the point of assessment.
Short chain fatty acids [SCFAs] are produced in abundance in the colon from fermentation of fermentable fibre, whereas the very small amounts of branched chain fatty acids [BCFAs] produced are end-products of bacterial metabolism of branched-chain amino acids, particularly increasing in the absence of dietary fibre in the gut.7,8 When used as 100% EN, consumption of fibre-free EN formula decreases the faecal concentrations of SCFAs while in parallel increasing the amounts of BCFAs and luminal pH in healthy adults,9 and in children with CD.10 The dependence of these faecal parameters on host diet, and in particular dietary fibre, make them potential candidate biomarkers to assess compliance with 100% EN. The present study evaluated the use of faecal parameters as putative biomarkers of compliance with EN in healthy adults, and subsequently validated findings in a cohort of children with active CD during treatment with 100% EN and also after return to normal diet.
2. Methods
2.1. Study design
Healthy adults [>18 years] were recruited from the local community via poster advertisement and word of mouth. Participants were eligible if they had stable weight [±2 kg] in the past month, no underlying health conditions requiring regular medical consultations, no previous gut surgery, and no antibiotic, prebiotic/probiotic supplement, or steroid use in the past 3 months. Participants were allocated to one of the four groups and were asked to replace all [ie, 100% EN] or part [85% EN, 50% EN, 20% EN] of their daily energy requirements with a fibre-free polymeric EN formula [Modulen IBD, Nestle©] for 7 days. To increase compliance with the intervention and improve accuracy of dietary assessment, participants were provided with all their preferred meals free of charge. Allocation to each group was based on each participant’s personal choice, to maximise intervention adherence. Energy requirements were calculated using estimated basal metabolic rate11 and self-reported physical activity levels. Dietary intake was recorded during the intervention with estimated weight food diaries and any leftover EN formula tins were returned to the researchers to further cross-check EN intake. Energy intake from both habitual diet and EN was calculated using WinDiets [version 10, Robert Gordon University, Aberdeen, UK].
2.2. Faecal sample collection and measurements
Fresh faecal samples [entire bowel movement] were collected from each participant at two time points: before [D0] and after [D7] of the 7-day intervention . Following homogenisation with mechanical kneading, faecal pH in 1:3 w/v slurry, % water content following freeze drying,9 and Bristol Stool Chart score12 were measured. The concentrations of faecal fatty acids [FAs] including SCFAs (acetate [C2], propionate [C3], and butyrate [C4]), and BCFAs (isobutyrate [IC4] and isovalerate [IC5]) were measured with gas chromatography with flame ionisation detector and quantified against authentic standards.9 Data were expressed per wet matter and dry matter, following lyophilisation, and as relative abundance [%] to total FAs or SCFAs.
2.3. Development of the Glasgow Exclusive Enteral Nutrition Index of Compliance
For the development of the Glasgow Exclusive enteral Nutrition Index of compliancE [GENIE] we used a dual methodological approach; a conventional one based on receiver operating characteristics [ROC] curve analysis and an innovative one using machine learning prediction. ROC curve analysis determined optimal cut-off values for group assignment, using D7 faecal parameters and their changes from D0 [Δ]. Sensitivity, specificity, positive [PPV], and negative predictive values [NPV] were calculated to identify optimal cut-off values to differentiate between groups [ie, 100% EN vs < 100% EN]. In the machine learning approach, decision trees for group assignment were generated using the recursive partitioning method ‘rpart’ implemented in R.13
2.4. Validation of GENIE in children with Crohn’s disease
Validation of the GENIE models was carried out in a subset of 30 children with CD who participated in the iPENS study [www.clinicaltrials.gov, identifier: NCT04225689]. From these children, faecal samples were collected the week prior to the end of 8-week treatment with 100% EN [100% EN samples] and again 4 weeks after completion of 100% EN treatment and return to normal diet [<100% EN samples]. A total of 55 faecal samples [n = 30 during 100% EN and n = 25 post-EN on normal diet] were collected in which faecal pH, SCFAs, and BCFAs were measured. Since the EN formula the patients received [Modulen IBD, Nestle©] was gluten-free, faecal GIP, a highly sensitive and specific objective biomarker of recent gluten consumption, was measured as a proxy of compliance with 100% EN and with the intention to select only patients who were the most likely to be on 100% EN.4,6 Any samples from the 100% EN group with detectable GIP were excluded from analysis.
2.5. Statistical analysis
Data analyses were performed in Minitab Version 19 [Minitab, Coventry, UK] and R version 4.1.2. Normally distributed data were presented with mean and standard deviation [SD] and not normally distributed data with median and interquartile range [Q1-Q3]. Between- and within-group comparisons were performed with general linear models using Box-Cox transformation and post hoc pairwise Fisher’s least significant difference tests, accounting for subject effect, when appropriate. Categorical variable comparisons were performed with the chi square test. Univariate linear regression analysis with 10-fold cross-validation was performed to identify D7 faecal parameters and their changes from D0 [Δ] predictive of self-reported EN intake, expressed as percentage of total energy intake [%]. Multivariate regression analysis including only significant predictors from univariate analyses and accounting for co-linearity with 10-fold cross-validation, was carried out using stepwise backward elimination. Statistical significance was set at p <0.05.
2.6. Ethical permissions and compensation
The study protocol in healthy people was approved by the University of Glasgow Research Ethical Committee [Reference: 200130161] and in children with CD by the West of Scotland Research Ethics Committee [Reference: 19/WS/0163]. All participants provided informed consent and received £100 in shopping vouchers as participation compensation.
3. Results
A total of 61 [31 females, 30 males] healthy volunteers were recruited [n = 25 to 100% EN, and n = 12 to each of the 85% EN, 50% EN, and 20% EN groups]. All participants completed the intervention and provided baseline [D0] and follow-up [D7] faecal samples. There were no differences between the groups in age, gender, anthropometry, energy requirements at study enrolment, or total energy intake during the study course [Table 1] Participants’ intake [EN intake/total energy intake] did not differ from the one prescribed [Table 1]. Participants’ body weight did not change following each intervention [all p-values >0.05 for within-group pairwise comparisons].
Table 1.
Baseline participant characteristics, reported energy and enteral nutrition intakes. Data presented as mean [SD] or median [Q1-Q3] unless stated otherwise
| 100% EN [n = 25] | 85% EN [n = 12] | 50% EN [n = 12] | 20% EN [n = 12] | p-value | |
|---|---|---|---|---|---|
| Age, years | 23.3 [22.8–25.6] | 24.8 [24.2–27.7] | 27.0 [2.4] | 26.6 [4.7] | 0.158 |
| Female, n [%] | 13/25 [52%] | 5/12 [42%] | 6/12 [50%] | 7/12 [58%] | 0.875 |
| BMI, kg/m2 | 22.2 [2.5] | 22.8 [3.5] | 24.5 [3.0] | 23.8 [2.6] | 0.098 |
| Height, cm | 171.1 [8.7] | 171.9 [7.5] | 175.1 [8.9] | 172.1 [7.0] | 0.591 |
| Body weight, kg | 66.0 [11.3] | 69.0 [14.9] | 75.7 [14.0] | 71.0 [12.2] | 0.192 |
| Estimated BMR, kcal/day | 1,578 [1,321-1,795] | 1,633 [315] | 1,726 [316] | 1,612 [247] | 0.511 |
| Estimated TEE, kcal/day | 2,209 [1,853-2,513] | 2,404 [382] | 2,512 [476] | 2,321 [386] | 0.239 |
| Total energy intake, kcal/day | 2,270 [528] | 2,559 [429] | 2,532 [497] | 2,333 [397] | 0.248 |
| Total energy intake/TEE [%] | 103 [19.7] | 106 [5.7] | 101 [2.0] | 100 [3.3] | 0.662 |
| EN energy intake/total energy intake [%] | 96 [2.1] | 87 [1.6] | 50 [1.4] | 20. [0.9] | <0.001 |
BMI, body mass index; BMR, basal metabolic rate; EN, enteral nutrition; F, female; M, male; TEE, total energy expenditure.
3.1. Faecal sample parameters and the effect of interventions
There were no significant differences in any faecal parameters measured between groups at D0 [Supplementary Table 1]. Following the 100% EN intervention, the Bristol Stool Chart score, faecal water content, and the relative abundance [%] of C2 and C3 decreased, whereas the absolute concentrations [μmol/g] of IC4, IC5, and total BCFAs significantly increased [Supplementary Table 1]. Likewise, following both the 100% EN and 85% EN interventions, the absolute concentrations of C2, C4, SCFAs, and FAs and the relative abundance of C4 and that of total SCFAs decreased, whereas the relative abundance of the individual and total BCFAs increased. Fewer changes were observed in the 50% EN and 20% EN groups [Supplementary Table 1]. Faecal pH increased in all but the 20% EN group, in a dose-dependent manner [Figure 1].
Figure 1.

Baseline [D0] and 7-day [D7] faecal pH measurements.
When considering only the D7 samples, faecal pH was the only parameter which differed between the four groups and in all pairwise comparisons [Supplementary Table 1]. Of interest, faecal pH increased from D0 to D7 in all participants after 100% [n = 25] and 85% [n = 12] EN, in 83% [10 of 12] of participants after 50% EN, and in 50% [6 of 12] of participants after 20% EN. The 7-day absolute concentrations of C2, C3, C4, total SCFAs, and total FAs differed significantly between the 100% EN or 85% EN group compared with the 50% EN or 20% EN group, but not between the 100% EN compared with the 85% EN group [Supplementary Table 1]. Likewise, the Bristol Stool Chart score, water content, relative abundance of IC4, IC5, and total BCFAs, and their ratios against SCFAs, differed between the 100% EN group compared with all the other groups, including the 85% EN [Supplementary Table 1].
3.2. Prediction of intake of EN from faecal parameters
Univariate linear regression analyses were carried out using faecal parameters as predictors and EN intake relative to reported energy intake [%] as a response variable. Both D7 parameters and their changes from D0 [Δ] were considered. Single D7 parameters performed best, hence only these were considered for further analysis and are presented here [Supplementary Table 2].
Faecal pH was the strongest predictor of the proportion of EN intake, explaining 62% of % EN variance [Supplementary Table 2]. Significant predictors identified in univariate models were subsequently entered in multivariate regression analyses with stepwise backward elimination, wherein combinations of predictors were tested accounting for co-linearity of variables. The most accurate model of EN intake included three predictors: faecal pH, concentration of C2, and concentration of C3 [SCFAs both as wet matter], which only slightly improved the prediction of % EN using pH measurements alone [R2 70%].
3.3. Development of GENIE using ROC analysis
Best predictors and optimal cut-off values were identified by ROC curve analysis for the following dichotomous group comparisons: a] 100% EN [n = 25] vs < 100% EN [85% EN + 50% EN + 20% EN; n = 36]; and b] 100% EN [n = 25] vs 85% EN [n = 12]. Both D7 predictors and their changes from D0 [Δ] were considered. Single D7 predictors performed best in both group comparisons, hence only these were considered for further analysis [Supplementary Table 3].
Among all faecal predictors measured, D7 faecal pH and the ratio of BCFAs to either C2 or C4 performed the best to differentiate between the two groups. A ratio of IC4 to C2 > 0.039 and a ratio of IC4 to C2 + C4 > 0.035 both produced a sensitivity, specificity, and PPV of 92%, 83%, and 79%, respectively, to differentiate between 100% EN vs all other groups [Table 2]. The same cut-off values for both ratios of IC4 to C2 and of IC4 to C2 + C4 also had a high diagnostic performance to differentiate between 100% EN vs 85% EN groups [Table 2], hence indicating high model fidelity to distinguish between patients who receive 100% EN from those who had up to 15% of their daily intake coming from normal food.
Table 2.
Receiver operating characteristic curve analyses with D7 faecal measurements as predictors
| Predictor | Optimal cut-off | Positive class | Negative class | AUC | Sensitivity, % | Specificity, % | PPV, % | NPV, % | p-value |
|---|---|---|---|---|---|---|---|---|---|
| IC4/C2 | 0.039 | 100% EN [n = 25] | <100% EN [n = 36] | 0.91 | 92 | 83 | 79 | 94 | <0.001 |
| IC4/C2 + C4 | 0.035 | 100% EN [n = 25] | <100% EN [n = 36] | 0.92 | 92 | 83 | 79 | 94 | <0.001 |
| IC5/C4 | 0.362 | 100% EN [n = 25] | <100% EN [n = 36] | 0.90 | 100 | 75 | 73 | 100 | <0.001 |
| Total BCFAs/C4 | 0.630 | 100% EN [n = 25] | <100% EN [n = 36] | 0.90 | 100 | 75 | 73 | 100 | <0.001 |
| IC4/C4 | 0.269 | 100% EN [n = 25] | <100% EN [n = 36] | 0.90 | 100 | 72 | 71 | 100 | <0.001 |
| C2 dry, μmol/g | 239 | 100% EN [n = 25] | <100% EN [n = 36] | 0.92 | 96 | 78 | 75 | 97 | <0.001 |
| Total SCFAs dry, μmol/g | 347.4 | 100% EN [n = 25] | <100% EN [n = 36] | 0.91 | 96 | 75 | 73 | 69 | <0.001 |
| Total SCFAs wet, μmol/g | 93.1 | 100% EN [n = 25] | <100% EN [n = 36] | 0.88 | 84 | 86 | 81 | 89 | <0.001 |
| pH | 8 | 100% EN [n = 25] | <100% EN [n = 36] | 0.91 | 84 | 86 | 81 | 89 | <0.001 |
| Total SCFAs, % | 92.00 | 100% EN [n = 25] | <100% EN [n = 36] | 0.92 | 76 | 92 | 86 | 85 | <0.001 |
| Total BCFAs, % | 8.00 | 100% EN [n = 25] | <100% EN [n = 36] | 0.92 | 76 | 92 | 86 | 85 | <0.001 |
| Total BCFAs/total SCFAs | 0.087 | 100% EN [n = 25] | <100% EN [n = 36] | 0.92 | 76 | 92 | 86 | 85 | <0.001 |
| IC4/C2 | 0.039 | 100% EN [n = 25] | 85% EN [n = 12] | 0.89 | 92 | 83 | 92 | 83 | <0.001 |
| IC4/C2 + C4 | 0.035 | 100% EN [n = 25] | 85% EN [n = 12] | 0.89 | 92 | 83 | 92 | 83 | <0.001 |
| IC4, % | 2.7 | 100% EN [n = 25] | 85% EN [n = 12] | 0.90 | 88 | 83 | 92 | 77 | <0.001 |
| IC4/total SCFAs | 0.028 | 100% EN [n = 25] | 85% EN [n = 12] | 0.90 | 88 | 83 | 92 | 77 | <0.001 |
| IC5/C2 | 0.056 | 100% EN [n = 25] | 85% EN [n = 12] | 0.89 | 88 | 83 | 92 | 77 | <0.001 |
| pH | 8.1 | 100% EN [n = 25] | 85% EN [n = 12] | 0.78 | 76 | 75 | 86 | 60 | 0.001 |
AUC, area under the curve; BCFAS, branched chain fatty acids [isobutyrate + isovalerate]; C2, acetate; C4, butyrate; IC4, isobutyrate; IC5, isovalerate; NPV, negative predictive value; PPV, positive predictive value; SCFAS, short chain fatty acids [acetate + propionate + butyrate].
3.4. Development of GENIE using machine learning classification
Machine learning classification, using recursive partitioning, was applied to construct decision trees using faecal parameters for the same group combinations for 100% vs < 100% EN comparison, as with ROC curve analysis above. We generated models using two approaches. The first model included all faecal parameters measured in the current study, and the second one included only faecal pH, which performed well in ROC analysis, and would be more practical to use at point of care testing. Both D7 predictors and their changes from D0 were considered in the models, but only single D7 predictors were chosen by the algorithm.
Using all faecal predictors as input data, the ratios of IC5/C4 and IC4/C2, at selected cut-off values, were chosen as the optimal biomarkers for two-level classification for 100% vs < 100% EN comparison [Figure 2]. Remarkably, this model outperformed the individual cut-off values identified from ROC curve analysis [Tables 2 and 4] and produced a sensitivity, specificity, PPV, and NPV of 88%, 94%, 92%, and 92%, respectively.
Figure 2.
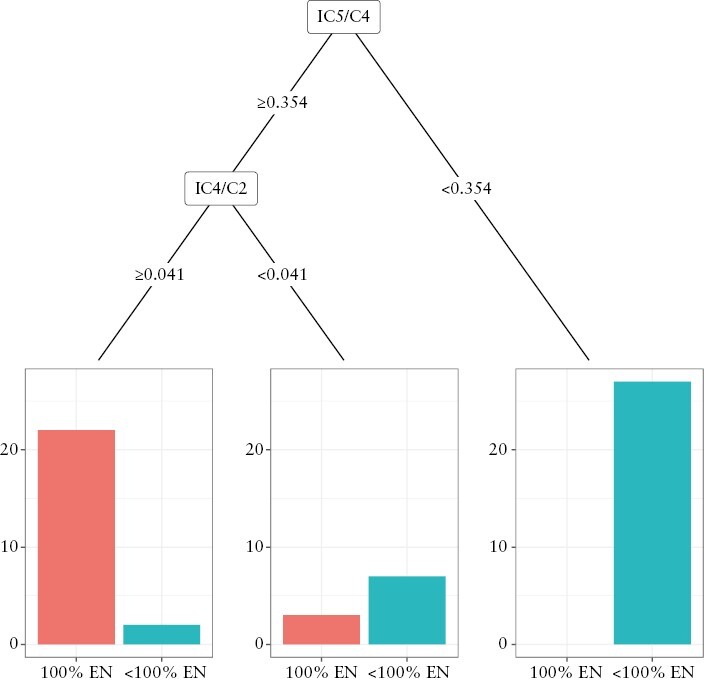
Decision tree for group classification into 100% EN [n = 25] or <100% EN [n = 36] groups using machine learning algorithm and all 7-day faecal metabolite parameters. EN, enteral nutrition.
Table 4.
Baseline characteristics of paediatric Crohn’s disease patients [n = 30]. Data presented as mean [SD] or median [Q1-Q3] unless stated otherwise
| Characteristics | Values |
|---|---|
| Age, years | 12.2 [2.4] |
| Female, n [%] | 11/30 [37%] |
| Body weight, kg | 43.6 [14.5] |
| Body weight z-score, SD | 0.10 [1.09] |
| Height z-score, SD | 0.27 [1.07] |
| BMI z-score, SD | -0.20 [-0.89–0.24] |
| wPCDAI | 2.5 [0.0–10.6] |
| CRP, mg/L | 1.0 [1–5.3] |
| Raised CRP [>10 mg/L], n [%] | 1/30 [3%] |
| FC, mg/kg | 328.3 [154.2–2369.9] |
| Raised FC [>250 mg/kg], n [%] | 17/30 [57%] |
| Newly diagnosed patients, n [%] | 23/30 [77%] |
| Immunosuppressant use, n [%] | 17/30 [57%] |
| Paris classification: | |
| Age at diagnosis, n [%] | |
| A1a | 8/30 [27%] |
| A1b | 22/30 [73%] |
| Location, n [%] | |
| L1 | 2/30 [7%] |
| L1, L4a | 2/30 [7%] |
| L1, L4b | 1/30 [3%] |
| L2 | 3/30 [10%] |
| L2, L4a | 2/30 [7%] |
| L3 | 9/30 [30%] |
| L3, L4a | 6/30 [20%] |
| L4a | 5/30 [17%] |
| Behaviour, n [%] | |
| B1 | 27/30 [90%] |
| B1p | 2/30 [7%] |
| B2 | 1/30 [3%] |
| Growth, n [%] | |
| G1 | 2/30 [7%] |
| G0 | 28/30 [93%] |
BMI, body mass index; CRP, C-reactive protein; FC, faecal calprotectin; wPCDAI: weighted Paediatric Crohn’s Disease Activity Index.
When considering only faecal pH as the input data, a threshold pH of 7.95 was identified as optimal for 100% vs < 100% EN comparison [Figure 3]. This model produced the same sensitivity, specificity, PPV, and NPV as the individual cut-off value identified from ROC curve analysis [Tables 2 and 4]. Since the threshold pH of 7.95 produced the same sensitivity, specificity, PPV, and NPV as a threshold of 8.0 identified from the ROC curve analysis [Table 2], we chose to round up the threshold pH to 8.0.
Figure 3.
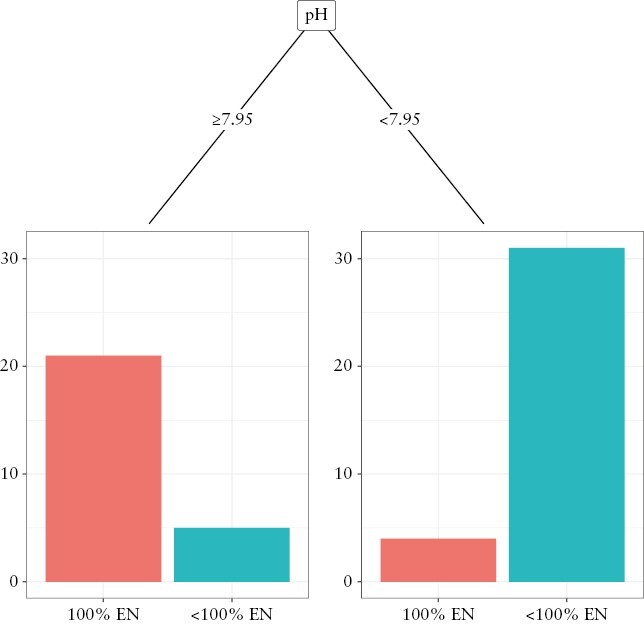
Decision tree for group classification into 100% EN [n = 25] or <
100% EN [n = 36] groups using machine learning algorithm and 7-day faecal pH measurements. EN, enteral nutrition.
Based on the data produced from machine learning and ROC curve analyses, we then devised the Clinical GENIE [C-GENIE] [Supplementary Figure 1] using D7 faecal pH and the Laboratory GENIE [L-GENIE] [Supplementary Figure 2] using the D7 ratios of BCFAs to C2 and C4 [Figure 4].
Figure 4.

Glasgow Exclusive Enteral Nutrition Index of Compliance [GENIE].
3.5. Validation of GENIE in paediatric patients with CD
The GENIE was validated on 55 faecal samples collected from 30 children with CD during the week prior to the end of an 8-week course of 100% EN [30 samples], and from a subset of the same patients [n = 25] 4 weeks following treatment completion when participants returned to their normal diet. Of these, four samples collected from the group during 100% EN had detectable faecal GIP, indicating non-exclusivity to 100% EEN, and were therefore excluded from the validation study. Baseline characteristics of all patients are presented in Table 3.
Table 3.
Results of validation of the GENIE model in children with Crohn’s disease [CD] during treatment with 100% EN and after return to unrestricted diet and compared with the development cohort of healthy adults
| GENIE models | Cohort | Sensitivity, % | Specificity, % | PPV, % | NPV, % |
|---|---|---|---|---|---|
| L-GENIE [IC5/C4 + IC4/C2] | Healthy adults | 88 | 94 | 92 | 92 |
| L-GENIE [IC5/C4 + IC4/C2] | Children with CD | 50 | 96 | 93 | 65 |
| C-GENIE [pH ≥ 8.0] | Healthy adults | 84 | 86 | 81 | 89 |
| C-GENIE [pH ≥ 8.0] | Children with CD | 85 | 88 | 88 | 85 |
C2, acetate; C4, butyrate; CD, Crohn’s disease; C-GENIE, Clinical Glasgow Exclusive Enteral Nutrition Index of Compliance; GENIE, Glasgow Exclusive Enteral Nutrition Index of Compliance; IC4, isobutyrate; IC5, isovalerate; L-GENIE, Laboratory Glasgow Exclusive Enteral Nutrition Index of Compliance; NPV, negative predictive value; PPV, positive predictive value.
First, we tested the performance of the L-GENIE model which incorporated the ratios of IC5/C4 and IC4/C2. L-GENIE correctly classified 73% [37/51], yet its performance was inferior in children with CD compared with the development cohort of healthy adults, producing a low sensitivity but very high specificity and PPV [50%, 96%, and 93%, respectively, Table 4]. Next, we tested the C-GENIE using the faecal pH measurements only. This correctly classified 86% [44/51] of all samples tested. The C-GENIE produced higher sensitivity [85%], specificity [88%], and PPV [88%] in children with CD than in the healthy adults in whom the model was developed [Table 4].
4. Discussion
The present study explored the use of diet-dependent faecal parameters as putative biomarkers of compliance with 100% EN, and subsequently developed and validated the GENIE tool. Our findings suggest that the C-GENIE, using faecal pH measurements, and the L-GENIE, using the ratios of BCFAs to C2 or C4, could objectively assess compliance with 100% EN with high sensitivity and positive predictive validity. Interestingly, certain changes in faecal parameters, such as an increase in the concentrations of BCFAs, occurred only in participants receiving 100% EN and not in those receiving < 100% EN, even when EN was supplied at volumes as high as 85% of daily energy requirements. The increase in BCFAs in parallel with a decrease in C2 and C4 reflect increased bacterial metabolism of branched chain amino acids in the absence of fibrous substrate for bacterial fermentation in the colon.7 However, when even small amounts of fibre become available inside the colon, as in the case of participants on 85% EN, the production of SCFAs will still decrease but this will not be counterbalanced by a detectable increase in protein fermentation biomarkers. Collectively, this indicates the high fidelity of the ratios of BCFAs to SCFAs, and by proxy that of L-GENIE to differentiate between participants who consume 100% EN from those who are slightly less compliant.
Although ROC curve analysis and machine learning identified the same faecal parameters as optimal predictors of 100% EN compliance with similar cut-off values, machine learning with multilayer classification performed better. Faecal parameters at D7 and their changes from D0 were considered as predictors in the present analysis; still the former were consistently the most predictive of group assignments, meaning that baseline assessments are not required, thus making GENIE more practical as a ‘spot-test’ and cheaper to use. Likewise, we explored expressions of metabolite concentrations per wet and per dry faecal matter, but the best-performing predictors were the ratios of BCFAs to C2 or C4, which are independent of faecal water content.
Whereas measurement of SCFAs and BCFAs requires specialist equipment and personnel and might be limited due to long result turnaround time and high overall costs, measurement of faecal pH requires fewer resources and expertise, is cheap, and may potentially be used as a point of care test. Based on these concepts, we proposed the laboratory version of L-GENIE, which requires post-intervention measurements of faecal BCFAs, C2, and C4, and the clinical version of C-GENIE to use as a point of care test, which only requires the post-intervention measurements of faecal pH. Although the use of pH-measuring paper strips was also pilot tested as a possibly even quicker and cheaper method to measure pH, it did not produce accurate results as the colour developed on the strip was significantly influenced by the background colour of the stool samples [data not presented]. Nonetheless, faecal pH can be measured easily, at low cost, and quickly, using portable pH meters and requiring minimal training.
Against our expectations, validation of GENIE on samples from paediatric patients with CD during 100% EN, and after 100% EN treatment, showed that C-GENIE performed better than L-GENIE in correctly classifying patients into their respective groups. In addition to that, the findings from the C-GENIE development phase in healthy adults were mirrored in paediatric patients with CD w,ith similar predictive validity. This offers confidence that the C-GENIE can be used for assessment of compliance with 100% EN in patients with CD receiving induction treatment with 100% EN. In turn, this may help the clinical practitioner to make an informed decision between a patient who is non-responsive to 100% EN and another where treatment failure is due to diminished compliance. The inferior performance of the L-GENIE in the cohort of children with CD compared with the development cohort of healthy adults, may be explained by differences in the profile and levels of production of SCFA and BCFA in the colon, consistent with the features of microbial alterations seen in this population.10,14 The L-GENIE may perform better in patients with conditions that do not induce microbial dysbiosis, such as eosinophilic oesophagitis or food allergies. However, the C-GENIE using measurements of faecal pH, a cumulative marker of acidity in the distal gut lumen, performed much better and equally to the development cohort of healthy adults.
This work has certain limitations including modest sample size, and the fact that the validation cohort included samples collected from patients with CD towards the end of 8-week treatment with 100% EN and not at a time point of treatment evaluation when checking treatment compliance would be most relevant clinically. Checking compliance at a 2-week time point with C-GENIE or L-GENIE would allow identification of patients who may require more dietetic input to improve compliance, and also of primary non-responders who are compliant but do not respond and may instead require an alternative treatment to achieve disease control. We present a clinical application example of C-GENIE in patients with active CD treated with 100% EN [Figure 5]. A caveat to this approach is that an induction course of 100% EN is likely to be equally effective as 85% EN in management of active CD, albeit a randomised, controlled trial [RCT] to demonstrate this is currently lacking. Using the same methodology as with GENIE, we constructed alternative models for separation between ≥ 85% EN vs < 85% EN. Encouragingly, the same predictors at similar threshold values were chosen as optimal biomarkers for two-level classification to each EN group [Supplementary Figure 3]. This was also the case when using only faecal pH as the input data, where a threshold pH of 7.75 was identified as optimal for group assignment [Supplementary Figure 4]. The diagnostic performances of both alternative models are presented in Supplementary Table 4, although we acknowledge the absence of an independent cohort of children with CD receiving variable volumes of EN to test their performance.
Figure 5.

A clinical application example of Clinical Glasgow Exclusive Enteral Nutrition Index of Compliance [C-GENIE] in patients with active Crohn’s disease treated with 100% EN. EN, enteral nutrition.
In principle, the model development and validation groups, in this case children with CD, should come from the same population. However, we envision the GENIE use for patients with other conditions in which 100% EN is used as treatment [eg, eosinophilic oesophagitis] or in the research setting. When we used the same methodology as GENIE to construct decision trees using faecal parameters of the validation cohort of 30 children on 100% EN and following 100% EN on unrestricted diet, again similar faecal parameters and threshold values were selected by the algorithm [Supplementary Figures 5 and 6]. The alternative models developed in children with CD had a higher diagnostic performance in the cohort of CD patients compared with GENIE models developed in healthy adults [Supplementary Table 5]. However, it is likely that this difference is due to the lower variability in EN intakes in the cohort of CD children [ie, 100% EN or no 100% EN] than in the healthy adults who participated in the development phase of the study. This may make these alternative models less accurate when assessing compliance in situations when patients are still consuming some EN in addition to ordinary food.
Future research should replicate these findings and test GENIE performance in other conditions for which 100% EN is prescribed as a treatment. This may be particularly important, as changes in gastrointestinal motility in certain conditions or with medical treatments may influence the performance of the faecal parameters and their associated threshold values. The performance of the GENIE with EN feeds other than the one we used here, including those containing fermentable fibre, needs to be explored too. In addition, future studies should validate the alternative models presented here, including an 85% EN intake cut-off and the one developed in the cohort of children with CD.
In conclusion, the GENIE might offer a simple, quick, cheap, and objective way to check compliance with 100% EN in clinical practice and in addition to other dietary assessment methods routinely applied in clinical practice.
Supplementary Material
Contributor Information
Aleksandra Jatkowska, Human Nutrition, School of Medicine, Dentistry and Nursing, University of Glasgow, Glasgow, UK.
Bernadette White, Human Nutrition, School of Medicine, Dentistry and Nursing, University of Glasgow, Glasgow, UK.
Ben Nichols, Human Nutrition, School of Medicine, Dentistry and Nursing, University of Glasgow, Glasgow, UK.
Vaios Svolos, Human Nutrition, School of Medicine, Dentistry and Nursing, University of Glasgow, Glasgow, UK.
Konstantinos Gkikas, Human Nutrition, School of Medicine, Dentistry and Nursing, University of Glasgow, Glasgow, UK.
Richard Hansen, Department of Paediatric Gastroenterology, Royal Hospital for Children, Glasgow, UK.
Richard K Russell, Department of Paediatric Gastroenterology, Royal Hospital for Children & Young People, Edinburgh, UK.
Daniel Gaya, Department of Gastroenterology, Glasgow Royal Infirmary, Glasgow, UK.
Emily Brownson, Department of Gastroenterology, Queen Elizabeth University Hospital, Glasgow, UK.
John Paul Seenan, Department of Gastroenterology, Queen Elizabeth University Hospital, Glasgow, UK.
Simon Milling, School of Infection and Immunity, University of Glasgow, Glasgow, UK.
Jonathan MacDonald, Department of Gastroenterology, Queen Elizabeth University Hospital, Glasgow, UK.
Konstantinos Gerasimidis, Human Nutrition, School of Medicine, Dentistry and Nursing, University of Glasgow, Glasgow, UK.
Funding statement
This work was supported by Nestle Health Science.
Conflict of interest
The studentships of AJ, BW, and KGk are funded by Nestle Health Science and the University of Glasgow. KGe received research funding, speakers’ fees and travel expenses covered by Nestle Health Science. RKR received speakers fees, travel support, or has performed consultancy work with Nestle Health Sciences, AbbVie, Pharmacosmos, Lilly, Celltrion Healthcare, and Janssen. DG is funded by a senior NHS research fellowship and received speaker fees and travel support from Pfizer, BMS, Abbvie, Takeda, Janssen, and Vifor pharma. SM received research funding from Nutricia and SciRhom. JPS has received speaker fees from AbbVie, Fresenius Kabi, Galapagos, Janssen-Cilag, Pharmacosmos, Takeda, and Tillotts Pharma; and received advisory board fees from AbbVie, Bristol Myers Squibb, Dr Falk Pharma, and Galapagos. VS received consultancy fees from Chronicles Health. EB, JM, and RH have no conflicts of interest to disclose. The funders had no role in the concept, design, execution, interpretation, writing, or submission of this manuscript.
Author contributions
VS, KGk, KGe, RH, RKR, DG, JPS, JM contributed to the concept and design of the study. VS, EB, SM, BW, AJ, and KGk contributed to delivery of the interventions and sample laboratory analysis. AJ, BW, KGk, BN, VS, and KGe contributed to the data analysis. All authors were involved in data interpretation and drafting of the manuscript.
This work was presented during the 54th ESPGHAN Annual Meeting in Copenhagen, Denmark, in 2022.
References
- 1. Hale MD, Logomarsino JV.. The use of enteral nutrition in the treatment of eating disorders: A systematic review. Eat Weight Disord 2019;24:179–98. [DOI] [PubMed] [Google Scholar]
- 2. Logan M, Clark CM, Ijaz UZ, et al. The reduction of faecal calprotectin during exclusive enteral nutrition is lost rapidly after food re-introduction. Aliment Pharmacol Ther 2019;50:664–74. [DOI] [PMC free article] [PubMed] [Google Scholar]
- 3. Atwal K, Hubbard GP, Venter C, Stratton RJ.. The use of amino acid-based nutritional feeds is effective in the dietary management of pediatric eosinophilic oesophagitis. Immun Inflamm Dis 2019;7:292–303. [DOI] [PMC free article] [PubMed] [Google Scholar]
- 4. McKirdy S, Russell RK, Svolos V, et al. The impact of compliance during exclusive enteral nutrition on faecal calprotectin in children with Crohn disease. J Pediatr Gastroenterol Nutr 2022;74:801–4. [DOI] [PubMed] [Google Scholar]
- 5. Naska A, Lagiou A, Lagiou P.. Dietary assessment methods in epidemiological research: Current state of the art and future prospects. F1000Res 2017;6:926. [DOI] [PMC free article] [PubMed] [Google Scholar]
- 6. Gerasimidis K, Zafeiropoulou K, Mackinder M, et al. Comparison of clinical methods with the faecal gluten immunogenic peptide to assess gluten intake in coeliac disease. J Pediatr Gastroenterol Nutr 2018;67:356–60. [DOI] [PubMed] [Google Scholar]
- 7. Oliphant K, Allen-Vercoe E.. Macronutrient metabolism by the human gut microbiome: Major fermentation by-products and their impact on host health. Microbiome 2019;7:91. [DOI] [PMC free article] [PubMed] [Google Scholar]
- 8. Gerasimidis K, Nichols B, McGowan M, et al. The effects of commonly consumed dietary fibres on the gut microbiome and its fibre fermentative capacity in adults with inflammatory bowel disease in remission. Nutrients 2022;14:1053. [DOI] [PMC free article] [PubMed] [Google Scholar]
- 9. Svolos V, Hansen R, Nichols B, et al. Treatment of active Crohn’s disease with an ordinary food-based diet that replicates exclusive enteral nutrition. Gastroenterology 2019;156:1354–67.e6. [DOI] [PubMed] [Google Scholar]
- 10. Gerasimidis K, Bertz M, Hanske L, et al. Decline in presumptively protective gut bacterial species and metabolites are paradoxically associated with disease improvement in pediatric Crohn’s disease during enteral nutrition. Inflamm Bowel Dis 2014;20:861–71. [DOI] [PubMed] [Google Scholar]
- 11. Schofield WN. Predicting basal metabolic rate, new standards and review of previous work. Hum Nutr Clin Nutr 1985;39:5–41. [PubMed] [Google Scholar]
- 12. Lewis SJ, Heaton KW.. Stool form scale as a useful guide to intestinal transit time. Scand J Gastroenterol 1997;32:920–4. [DOI] [PubMed] [Google Scholar]
- 13. Therneau TM, Atkinson EJ.. An Introduction to Recursive Partitioning Using the Rpart Routines. 2022. https://cran.r-project.org/web/packages/rpart/vignettes/longintro.pdf. Accessed 7 March 2023 [Google Scholar]
- 14. Quince C, Ijaz UZ, Loman N, et al. Extensive modulation of the fecal metagenome in children with Crohn’s disease during exclusive enteral nutrition. Am J Gastroenterol 2015;110:1718–29; quiz 1730. [DOI] [PMC free article] [PubMed] [Google Scholar]
Associated Data
This section collects any data citations, data availability statements, or supplementary materials included in this article.