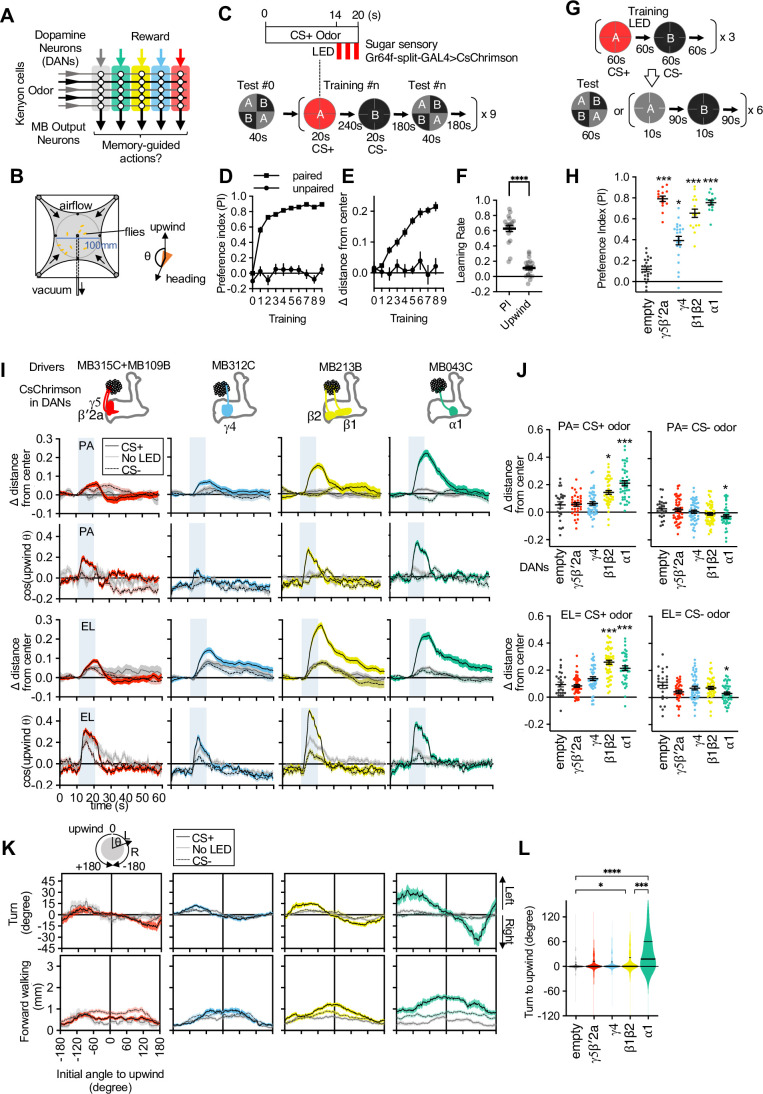
Figure 1. Memories in specific set of mushroom body (MB) compartments drive upwind locomotion.
(A) A conceptual diagram of the MB circuit. The colored rectangles represent individual MB compartments. (B) A diagram of a four-armed olfactory arena. In each experiment, approximately 20 female flies were introduced into the circular arena. (C) Protocols for optogenetic training and tests used. One of two odors (pentyl acetate [PA] and ethyl lactate [EL]) was presented for 20 s, and three 1 s pulses of 627 nm light were started at 14 s. Another odor was presented alone, and then preference between two odors was measured. The cycles of training and tests were repeated nine times. In the unpaired protocol, LED was started 90 s before the onset of ‘CS+’ odor. (D) Preference to the CS+ odor in binary choice. (E) Displacement of flies’ position relative to the center of the arena during the initial 14 s of 20 s odor period as wind-directional response. (F) Learning rate defined as response after single training divided by peak response after 9× training. (G) Protocols for optogenetic training and the two different memory tests used in this work. (H) Appetitive memories assessed by binary choice between CS+ and CS− odors immediately after training with optogenetic activation of dopaminergic neurons (DANs) that express CsChrimson with drivers indicated in (I). Empty is a split-GAL4 driver without promoters for AD and DBD domains. Thick and thin horizontal lines represent means and SEMs. Dunn’s multiple comparison tests compared to empty-split-GAL4 control, following Kruskal-Wallis test; n=12–22. (I) Time course of the area-normalized mean of fly’s position relative to the center of the arena as compared with its mean position at odor onset and the cosine of the angle between the fly’s orientation and the upwind direction (see Materials and methods). Flies of each genotype were trained with three protocols: (1) pentyl acetate (PA) was paired with the LED illumination and ethyl lactate (EL) was unpaired. (2) EL was paired with LED and PA was unpaired. (3) Neither odor was paired (No LED). Lines and filled areas around lines are mean and SEM. N=24–60. (J) The delta of distance from the center at the end of the 10 s odor period. Each dot represents data from individual trials. Black lines are mean and SEM. *, p<0.05; ***, p<0.001; Dunn’s multiple comparison tests compared to empty-split-GAL4 control, following Kruskal-Wallis test; n=24–60. The upwind displacements of MB213B and MB043C in response to CS+ odor were also significantly higher than the control when trial averages of six movies were compared. (K) Cumulative angle of turning and forward walking speed during the first 10 frames (333 ms; a time window we used for optogenetic experiments in Figure 6) following odor onset are plotted against initial angle to upwind, smoothened with ±30 degree bin. The number of trajectories analyzed for (CS+, CS−, No LED) conditions for MB109B+MB315C, MB312C, MB213B, and MB043C were (531, 562, 167), (710, 758, 814), (920, 1039, 919), and (449, 768, 531), respectively. Only flies that were 3 mm or more from the edge of the arena were analyzed. (L) The violin-plots of the cumulative angle of turn to the upwind orientation during the first 10 frames (333 ms) of odor onset. Only flies that oriented –90 to –150 or +90–150 degrees to the upwind direction at odor onset were analyzed. n=122, 137, 233, 239, 99 for empty-split-GAL4, MB109B+MB315C, MB312C, MB213B, and MB043C, respectively. *, p<0.05; ***, p<0.001; Dunn’s multiple comparison tests compared to empty-split-GAL4 control, following Kruskal-Wallis test.


