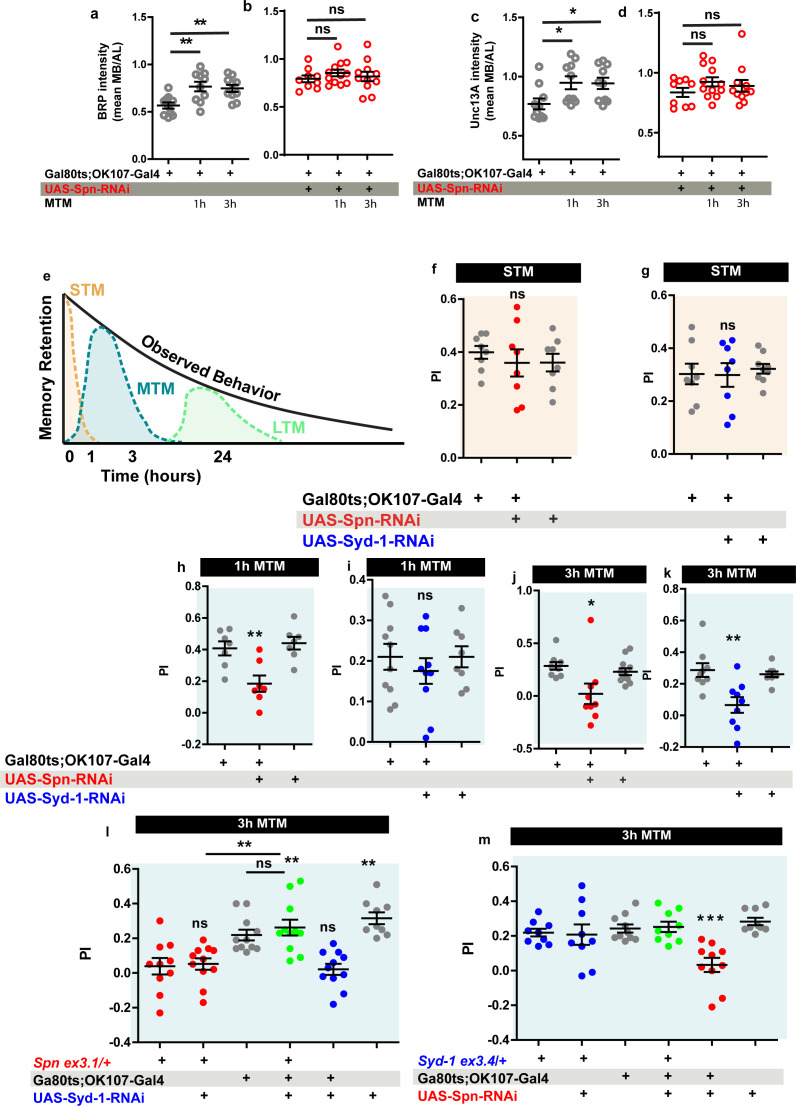
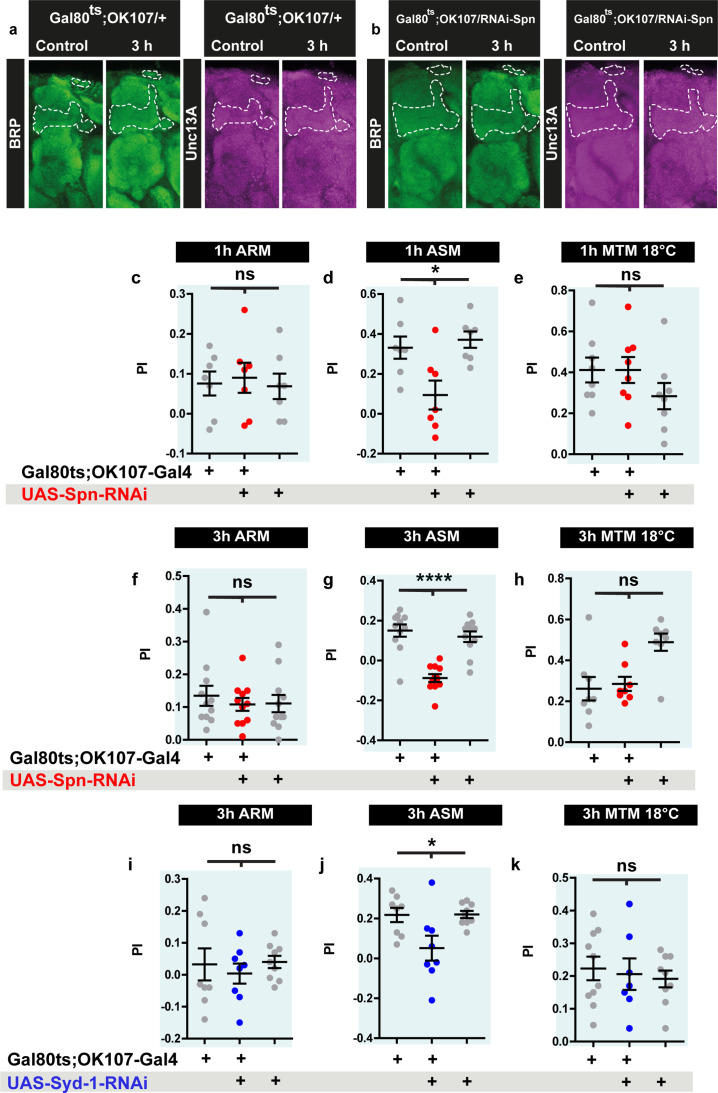
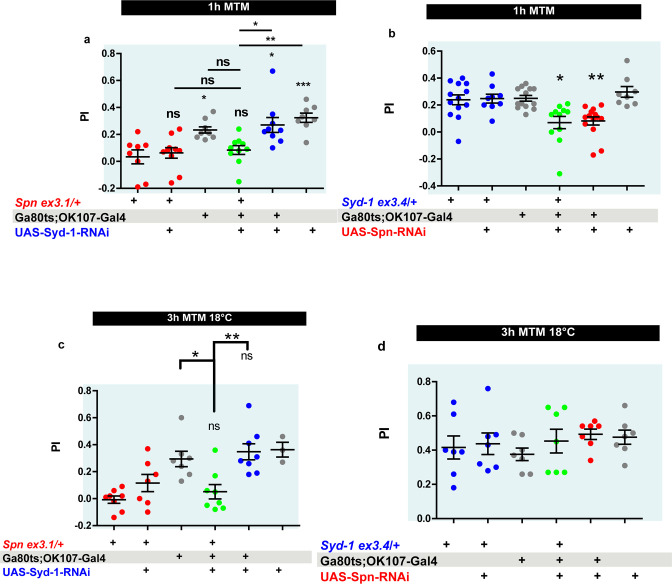
Figure 7. Spinophilin is crucial for aversive olfactory mid-term memories but not for learning.
The Spinophilin/Syd-1 antagonism controls aversive mid-term memories. (a–d) Quantification of BRP and Unc13A intensity in control and Spn knockdown (KD) flies, 1 and 3 h after conditioning. (a,c) BRP and Unc13A levels increase in controls upon paired conditioning while (b,d) BRP and Unc13A do not increase in Spn KD upon paired conditioning. (e) Scheme showing different phases of memory in Drosophila. (f–g) STM is normal in both Spn and Syd-1 KDs. (h) 1 hour and (j) 3 hour MTM are both impaired in Spn KD. (i) 1 hour MTM is normal while (k) 3 hour MTM is impaired in Syd-1 KD. (l) Spn heterozygosity (Spnex3.1/+) shows impaired 3 hr MTM, which is rescued upon concomitant KD of Syd-1. (m) 3 hour MTM impairment in Spn KD is rescued by concomitant reduction in Syd-1 through Syd-1 heterozygosity (Syd-1ex3.4/+). Also see Figure 7—figure supplements 1–3. Source data as exact normalized and raw values, detailed statistics including sample sizes and p values are provided in Figure 7—source data 1. *p≤0.05; **p ≤ 0.01; ***p ≤ 0.001; n.s., not significant, p > 0.05. All panels show mean ± s.e.m.


