

Abstract
The occurrence of heart failure following acute myocardial infarction (AMI) significantly increases the risk of post-infarction mortality. Alkaline phosphatase (AP) is considered to be an independent predictor of cardiovascular disease (CVD) and adverse outcomes. Furthermore, in recent years, alkaline phosphatase has been associated with insulin resistance (IR). Our aim was to investigate the correlation between IR substitutes (triglyceride-glucose (TyG) index, triglyceride to high-density lipoprotein cholesterol (TG/HDL-C) ratio), AP, and LV dysfunction in patients admitted after AMI. The retrospective study included 810 patients who underwent coronary angiography for myocardial infarction at the First Hospital of Hebei Medical University from August 2018 to December 2021. Patients were categorized into three groups based on their serum AP levels. Clinical characteristics at admission, cardiac echocardiography findings, coronary angiography results, and biochemical markers such as serum AP levels and triglycerides (TG) were recorded during hospitalization. Left ventricular ejection fraction (LVEF) was assessed using cardiac echocardiography conducted from the time of admission until the coronary angiography procedure. A total of 774 patients with AMI were included in this study. The TyG index is significantly correlated with the TG/HDL-C ratio. (R = 0.739, P < 0.001). Binary logistic regression analysis revealed that elevated serum AP (OR 2.598, 95% CI 1.331–5.071, P = 0.005), presence of the left anterior descending (LAD) artery as the infarct-related artery (IRA) (OR 2.452, 95% CI 1.352–4.449, P = 0.003), and triglyceride (TG) levels (OR 0.652, 95% CI 0.429–0.992, P = 0.046) were protective risk factor for an admission LVEF < 40% following AMI. The serum alkaline phosphatase and LAD as IRA are independent risk factors for severe reduction in LVEF during hospitalization for AMI. Conversely, triglyceride are independent protective factor for severe reduction in LVEF during AMI hospitalization.
Subject terms: Cardiology, Diseases, Endocrinology, Medical research
Introduction
The incidence of myocardial infarction (MI) has been increasing over the years, attracting significant attention. Although the mortality rate from AMI has decreased with the advent of percutaneous coronary intervention (PCI), myocardial cell loss resulting from heart attacks remains a major cause of heart failure. Heart failure significantly increases the risk of mortality after a myocardial infarction. Patients with LVEF < 40% are defined as having severely reduced LVEF, and compared to patients with LVEF ≥ 40%, those with LVEF < 40% exhibit a significantly lower one-year survival rate1,2. In search of prognostic biomarkers, IR surrogate markers and serum AP levels have garnered considerable interest among researchers.
Insulin resistance is a hallmark of metabolic syndrome (MetS), and high IR levels not only increase the risk of CAD but also significantly correlate with adverse cardiovascular outcomes3,4. However, direct measurements of IR (such as hyperinsulinemic-euglycemic clamp and insulin suppression test) are invasive, costly, and complex procedures5. Epidemiological studies require simple and easily obtainable markers of IR. In this context, the TyG index and TG/HDL-C ratio have been confirmed by studies as surrogate markers of IR6,7. The TyG index, composed of TG and FBG (fasting blood glucose), is calculated using the formula: TyG = ln[fasting triglycerides (mg/dl) × fasting blood glucose (mg/dl)/2]8.
Furthermore, alternative markers of IR are associated with poor prognosis in patients with acute ST-segment elevation myocardial infarction (STEMI) and non-ST elevation acute coronary syndrome (NSTE-ACS) after percutaneous coronary intervention (PCI) treatment9,10. In recent years, Professor Da-Hye Son discovered Serum AP levels are independently and positively associated with surrogate markers of insulin resistance in Korean adults11. Elevated serum AP levels not only contribute to vascular calcification12 but are also associated with adverse prognosis in CAD13. Therefore, our aim was to investigate the relationship between IR surrogate markers (TyG index and TG/HDL-C ratio) and serum AP with severe reduction in LVEF at admission in a population of first-time AMI patients, providing insights for predicting adverse cardiovascular events.
Materials and methods
Study population
The study is a retrospective study that selected a total of 810 patients who underwent coronary angiography due to AMI at the First Hospital of Hebei Medical University from August 2018 to December 2021 as the study subjects. The inclusion criteria were as follows: (1) AMI (2) undergoing coronary angiography. The exclusion criteria were as follows: (1) previous coronary intervention, thrombolytic therapy, or coronary artery bypass grafting; (2) history of heart failure, cardiomyopathy, congenital heart disease, or valvular heart disease; (3) chronic dialysis; (4) chronic liver disease, active hepatitis, or severe liver dysfunction; (5) severe acute infection; (6) acute or chronic hepatobiliary diseases, including chronic inflammatory diseases involving the skeletal system; (7) malignancy; (8) suspected familial hypertriglyceridemia [plasma triglycerides (TG) ≥ 500 mg/dL (5.65 mmol/L) or having a first-degree relative with TG ≥ 500 mg/dL]; (9) incomplete clinical data. The study was performed according to the guidelines of the Helsinki Declaration and was approved by the Ethics Committee of The First Hospital of Hebei Medical University (20,200,511).
Data collection and definitions
Clinical data were collected by trained clinical doctors from medical records, including medical history, baseline clinical and demographic characteristics. The records indicated that all patients had blood biochemical parameters, complete blood count, and cardiac echocardiography collected upon admission. All blood samples were collected from the antecubital vein after a 12-h overnight fasting following admission. Left ventricular ejection fraction was obtained through cardiac echocardiography at admission and before coronary angiography. Systolic and diastolic blood pressures were measured in the right arm of the patients using a standard mercury sphygmomanometer after the patients had been seated and rested for 10 min. The triglyceride-glucose index was defined as TyG = Ln[fasting triglycerides (mg/dL) × fasting glucose (mg/dL)/2]8. The triglyceride to high-density lipoprotein cholesterol ratio was calculated as TG (mg/dL) divided by HDL-C (mg/dL). Diabetes mellitus was defined as fasting blood glucose (FBG) ≥ 7.0 mmol/L, 2-h postprandial blood glucose (PBG) ≥ 11.1 mmol/L, glycated hemoglobin (HbA1c) ≥ 6.5%, or use of any hypoglycemic medications or self-reported history of diabetes. Hypertension was defined as systolic blood pressure (SBP) ≥ 140 mmHg or diastolic blood pressure (DBP) ≥ 90 mmHg, use of any antihypertensive medications, or self-reported history of hypertension. Dyslipidemia was defined as any self-reported history or use of lipid-lowering medications or total cholesterol (TC) ≥ 5.17 mmol/L. Left ventricular systolic dysfunction was defined as LVEF < 40%. Atrial fibrillation (AF) was defined as AF on admission electrocardiogram or a history of AF. Ischemic time was defined as the time from the onset of typical AMI symptoms to admission. The time for revascularization is defined as the duration from hospital admission to the performance of PCI or CABG. In this study, acute myocardial infarction included STEMI and non-ST-elevation myocardial infarction (NSTEMI), and was in accordance with the guidelines of the European Society of Cardiology14,15.
Angiographic analysis
The angiographic data were retrieved from the records of the cardiac catheterization laboratory. Coronary angiography procedures were conducted by three specialized interventionists, either through the radial or femoral route, based on the operator's discretion. To ensure consistency and minimize inter-observer variability, the assessment of coronary arteries was performed by three senior cardiologists. If the degree of coronary artery stenosis is equal to or greater than 50%, we consider the presence of significant CAD. The complexity of coronary atherosclerosis was quantified using the Gensini score, which takes into account both angiographically significant and nonsignificant stenosis. The Gensini score for each patient was determined by summing up the scores of individual coronary arteries. To facilitate the calculation of the Gensini score, a minimum of five different views were obtained for each patient. The degree of stenosis and the coronary artery lesion site were scored as follows: 1 point for ≤ 25% narrowing, 2 points for 26–50% narrowing, 4 points for 51–75% narrowing, 8 points for 76–90% narrowing, 16 points for 91–99% narrowing, and 32 points for total occlusion. Thereafter, multiply the score assigned to each lesion by the relevant coefficient based on the location and significance of the lesion within the coronary artery (5 for the left main coronary artery, 2.5 for the proximal segment of the left anterior descending coronary artery, 2.5 for the proximal segment of the circumflex artery, 1.5 for the mid-segment of the left anterior descending coronary artery, 1.0 for the right coronary artery, the distal segment of the left anterior descending coronary artery, the posterolateral artery, and the obtuse marginal artery, and 0.5 for other segments). Finally, add up the obtained scores to calculate the Gensini score16.
Statistical analysis
Serum AP tertile were categorized as follows: Low: < 66 U/L, Middle: 67–85 U/L, High: > 85U/L. Continuous variables were presented as mean ± standard deviation for normally distributed variables and as median (interquartile range) for non-normally distributed variables. Student's t-test was employed to compare the normally distributed values between different serum AP levels groups. Mann–Whitney U test was used to assess differences in non-normally distributed values among different serum AP levels groups. The correlation between the TyG index and other parameters was assessed using the Spearman rank correlation test.The χ2 test or Fisher exact test was used for categorical variables, as appropriate. Univariate regression analysis was performed to evaluate the association between clinical variables and severe reduction in LVEF. Variables with P < 0.05 on univariate analysis were considered as confounding factors and entered the multivariate regression analysis. The calibration was assessed using the Hosmer–Lemeshow goodness-of-fit test. A two-sided analysis with a P value < 0.05 was considered statistically significant. All statistical analyses were performed using SPSS version 26.0.
Ethics approval and consent to participate
The study was performed according to the guidelines of the Helsinki Declaration and has been approved by the ethics committees at the First Hospital of Hebei Medical University, China. Since data were evaluated retrospectively, pseudonymously and were solely obtained for treatment purposes, a requirement of informed consent was waived by the Ethics Committee of the First Hospital of Hebei Medical University.
Results
Baseline characteristics of patients in different serum AP levels groups
The final study population consisted of 774 patients who underwent coronary angiography for AMI (Fig. 1). All patients were divided into three groups based on their serum AP levels. The baseline characteristics of the three groups are presented in Table 1, the significant differences were observed among the groups in terms of ischemic time, dyslipidemia, LVEF < 40%, white blood cell count (WBC), low-density lipoprotein cholesterol (LDL-C), total cholesterol (TC), Apolipoprotein B (ApoB), and TyG index significantly increased with increasing tertiles, while it significantly decreases with the increase in tertiles for diabetic patients (P < 0.05). No statistically significant differences were found for other variables (Table 1). Regarding the TyG index, a significant difference was observed only between the high serum AP levels group and the low serum AP levels group (P = 0.022). No significant differences in the TG/HDL-C ratio were observed among the various groups categorized by serum AP (Fig. 2).
Figure 1.

Flow chart.
Table 1.
Comparison of baseline characteristics of patients in different serum AP levels groups.
| Items | Total population | COV | Serum AP level Tertile | P value | |||||
|---|---|---|---|---|---|---|---|---|---|
| Low | COV | Middle | COV | High | COV | ||||
| n | 774 | 254 | 263 | 257 | |||||
| Clinical characteristics | |||||||||
| Age, years | 62.00 (52.00–69.00) | 0.18 | 63.00 (54.00 − 70.00) | 0.17 | 62.00 (51.00–70.00) | 0.19 | 61.00 (51.50 − 67.00) | 0.19 | 0.090 |
| Male, n (%) | 597 (77.13) | – | 208 (81.89) | – | 197 (74.91) | – | 192 (74.71) | – | 0.088 |
| Ischemic time, hour | 18.00 (6.00–72.00) | 41.39 | 17.00 (6.00 − 72.00) | 37.00 | 12.00 (5.00–48.00) | 89.68 | 24.00 (6.50 − 96.00) | 13.22 | 0.042 |
| Time for revascularization, hour | 77.00 (24.00–158.00) | 1.34 | 71.00 (22.00–156.00) | 1.49 | 79.00 (23.25.00–156.00) | 1.20 | 89.00 (27.75 − 163.00) | 1.21 | 0.862 |
| Diabetes mellitus, n (%) | 196 (25.32) | – | 79 (31.10) | – | 60 (22.81) | – | 57 (22.18) | – | 0.035 |
| Hypertension, n (%) | 452 (58.40) | – | 154 (60.63) | – | 149 (56.65) | – | 149 (57.98) | – | 0.648 |
| Dyslipidemia, n (%) | 207 (26.74) | – | 51 (20.08) | – | 72 (27.38) | – | 84 (32.68) | – | 0.005 |
| Current Smoking, n (%) | 253 (32.69) | – | 77 (30.31) | – | 89 (33.84) | – | 87 (33.85) | – | 0.617 |
| Family History of CAD, n (%) | 31 (4.01) | – | 6 (2.36) | – | 15 (5.70) | – | 10 (3.89) | – | 0.152 |
| Family History of Cerebrovascular disease , n (%) | 125 (16.15) | – | 41 (16.14) | – | 38 (14.45) | – | 46 (17.90) | – | 0.565 |
| Atrial fibrillation, n (%) | 28 (3.62) | – | 10 (3.94) | – | 14 (5.32) | – | 4 (1.56) | – | 0.067 |
| STEMI, n (%) | 399 (51.55) | – | 120 (47.24) | – | 134 (50.95) | – | 145 (56.42) | – | 0.113 |
| Vital signs at admission | |||||||||
| SBP, mmHg | 129.00 (115.00 − 143.25) | 0.17 | 127.00 (113.00–144.00) | 0.18 | 132.00 (116.00 − 143.00) | 0.15 | 128.00 (115.00 − 144.00) | 0.18 | 0.530 |
| DBP, mmHg | 80.00 (72.00 − 89.00) | 0.17 | 79.00 (72.00–89.00) | 0.16 | 80.00 (73.00 − 89.00) | 0.16 | 80.00 (72.00 − 90.00) | 0.18 | 0.396 |
| RHR, beats per minute | 75.00 (66.00 − 85.00) | 0.22 | 74.50 (65.00–82.00) | 0.21 | 75.00 (67.00 − 85.00) | 0.22 | 76.00 (67.00 − 88.00) | 0.22 | 0.068 |
| Laboratory characteristics | |||||||||
| WBC , 10^9/L | 8.40 (6.60 − 10.60) | 0.41 | 7.80 (6.30–10.10) | 0.45 | 8.60 (6.60 − 10.50) | 0.36 | 9.00 (6.80 − 11.60) | 0.40 | 0.001 |
| Hb , g/L | 138.00 (126.00 − 148.00) | 0.13 | 139.00 (125.75–146.00) | 0.13 | 137.00 (126.00 − 148.00) | 0.14 | 139.00 (127.50 − 150.00) | 0.13 | 0.311 |
| FBG, mmol/L | 5.61 (4.86 − 7.27) | 0.62 | 5.56 (4.78–7.10) | 0.68 | 5.61 (4.91 − 6.92) | 0.56 | 5.63 (4.94 − 7.84) | 0.61 | 0.247 |
| Creatinine, μmol/L | 70.50 (61.68 − 81.30) | 0.31 | 71.25 (63.00–83.30) | 0.29 | 70.90 (61.60 − 81.00) | 0.33 | 68.60 (60.20 − 79.25) | 0.30 | 0.096 |
| BUN, mmol/L | 5.28 (4.24 − 6.53) | 0.48 | 5.43 (4.48–6.61) | 0.41 | 5.24 (4.23 − 6.56) | 0.56 | 5.06 (4.10 − 6.48) | 0.46 | 0.074 |
| LDL–C, mmol/L | 2.90 (2.38 − 3.36) | 0.26 | 2.75 (2.35–3.31) | 0.25 | 2.92 (2.35 − 3.39) | 0.25 | 2.99 (2.47 − 3.43) | 0.27 | 0.032 |
| HDL–C, mmol/L | 0.97 (0.84 − 1.11) | 0.27 | 0.96 (0.83–1.07) | 0.20 | 0.96 (0.84 − 1.11) | 0.26 | 0.99 (0.84 − 1.16) | 0.33 | 0.116 |
| TG, mmol/L | 1.32 (0.98 − 1.86) | 0.64 | 1.27 (0.91–1.81) | 0.63 | 1.30 (1.05 − 1.86) | 0.64 | 1.39 (1.07 − 1.90) | 0.63 | 0.096 |
| TC, mmol/L | 4.59 (3.88 − 5.22) | 0.23 | 4.46 (3.82–5.01) | 0.21 | 4.59 (3.86 − 5.21) | 0.22 | 4.78 (4.00 − 5.38) | 0.24 | 0.006 |
| UA, μmol/L | 331.60 (279.65 − 402.05) | 0.38 | 340.50 (287.40–413.48) | 0.29 | 331.50 (286.1 − 397.00) | 0.32 | 322.60 (272.00 − 400.05) | 0.51 | 0.249 |
| Lp(a), mg/L | 212.30 (104.80 − 417.00) | 1.54 | 214.40 (110.40–440.90) | 1.57 | 215.05 (109.75 − 415.45) | 1.56 | 206.40 (94.18 − 400.42) | 1.49 | 0.335 |
| ApoA1, g/L | 1.12 (1.00 − 1.24) | 0.19 | 1.11 (1.00–1.21) | 0.17 | 1.10 (0.98 − 1.24) | 0.20 | 1.14 (1.01 − 1.26) | 0.20 | 0.222 |
| ApoB, g/L | 0.82 (0.66 − 0.97) | 0.29 | 0.81 (0.64–0.94) | 0.28 | 0.81 (0.67 − 0.96) | 0.29 | 0.86 (0.69 − 1.01) | 0.28 | 0.013 |
| AP, U/L | 75.50 (63.00 − 90.25) | 0.31 | 58.00 (52.00–63.00) | 0.14 | 75.00 (71.00 − 80.00) | 0.07 | 98.00 (90.50 − 109.00) | 0.21 | < 0.001 |
| TyG index | 8.74 (8.39 − 9.20) | 0.07 | 8.67 (8.31–9.15) | 0.07 | 8.82 (8.39 − 9.16) | 0.07 | 8.79 (8.45 − 9.29) | 0.07 | 0.027 |
| TG/HDL ratio | 3.23 (2.22 − 4.63) | 0.74 | 3.15 (2.06–4.64) | 0.71 | 3.19 (2.27 − 4.60) | 0.74 | 3.31 (2.26 − 4.69) | 0.78 | 0.597 |
| Infarct related artery, n (%) | |||||||||
| LM ,n (%) | 7 (0.90) | – | 4 (1.57) | – | 1 (0.38) | – | 2 (0.78) | – | 0.529 |
| LAD, n (%) | 446 (57.62) | – | 138 (54.33) | – | 150 (57.03) | – | 158 (61.48) | – | 0.255 |
| LCX, n (%) | 138 (17.83) | – | 54 (21.26) | – | 44 (16.73) | – | 40 (15.56) | – | 0.206 |
| RCA, n (%) | 183 (23.64) | – | 58 (22.83) | – | 68 (25.86) | – | 57 (22.18) | – | 0.574 |
| Extent of coronary artery disease,n (%) | |||||||||
| 1–vessel, n (%) | 183 (23.64) | – | 52 (20.47) | – | 69 (26.24) | – | 62 (24.12) | – | 0.382 |
| 2–vessel, n (%) | 238 (30.75) | – | 75 (29.53) | – | 78 (29.66) | – | 85 (33.07) | – | |
| 3–vessel, n (%) | 353 (45.61) | – | 127 (50.00) | – | 116 (44.11) | – | 110 (42.80) | – | |
| Gensini score | 56.00 (38.00–88.00) | 0.77 | 62.00 (40.00–92.00) | 0.73 | 52.00 (36.00–84.00) | 0.80 | 57.50 (35.50–92.00) | 0.74 | 0.144 |
| Echocardiography | |||||||||
| LVEF, % | 56.00 (46.00–63.00) | 0.20 | 57.00 (46.75–63.00) | 0.20 | 56.00 (46.00–63.00) | 0.20 | 53.00 (45.00–63.00) | 0.22 | 0.179 |
| LVEF < 40%, n (%) | 78 (10.08) | – | 17 (6.69) | – | 26 (9.98) | – | 35 (13.62) | – | 0.034 |
| Prior medication | |||||||||
| Antiplatelets, n (%) | 23 (2.97) | – | 8 (3.15) | – | 5 (1.90) | – | 10 (3.89) | – | 0.401 |
| Beta–blocker, n (%) | 25 (3.23) | – | 11(4.33) | – | 8 (3.04) | – | 6 (2.34) | – | 0.433 |
| Calcium inhibitor, n (%) | 177(22.87) | – | 61(24.02) | – | 56 (21.29) | – | 60 (23.35) | – | 0.743 |
| ACEI, n (%) | 28 (36.18) | – | 12 (4.72) | – | 12 (4.56) | – | 4 (1.56) | – | 0.095 |
| Angiotensin II antagonist, n (%) | 40 (5.16) | – | 16 (6.30) | – | 13 (4.94) | – | 11 (4.28) | – | 0.576 |
| Diuretic, n (%) | 10 (1.29) | – | 5 (1.97) | – | 3 (1.14) | – | 2 (0.78) | – | 0.448 |
| Insulin, n (%) | 37 (4.78) | – | 15 (5.91) | – | 13 (4.94) | – | 9 (3.50) | – | 0.439 |
| Oral antidiabetic drug, n (%) | 91 (11.76) | – | 38 (14.96) | – | 23 (8.75) | – | 30 (11.67) | – | 0.090 |
| Statin, n (%) | 22 (2.84) | – | 11 (4.33) | – | 4 (1.52) | – | 7 (2.72) | – | 0.156 |
| Comorbidities | |||||||||
| Atrial fibrillation, n (%) | 28 (3.62) | – | 10 (3.94) | – | 14 (5.32) | – | 4 (1.56) | – | 0.067 |
| Ventricular tachycardia, n (%) | 9 (1.16) | – | 3 (1.18) | – | 4 (1.52) | – | 2 (0.78) | – | 0.847 |
| Heart arrest, n (%) | 8 (1.03) | – | 3 (1.18) | – | 4 (1.52) | – | 1 (0.39) | – | 0.504 |
| Pulmonary infection, n (%) | 37 (4.78) | – | 9 (3.54) | – | 14 (5.32) | – | 14 (5.45) | – | 0.528 |
| Hydropericardium, n (%) | 6 (0.78) | – | 1 (0.39) | – | 2 (0.76) | – | 3 (1.27) | – | 0.706 |
| Type of revascularization, n (%) | |||||||||
| PCI, n (%) | 621 (80.23) | – | 201 (79.13) | – | 221 (84.03) | – | 199 (77.43) | – | 0.145 |
| CABG, n (%) | 28 (3.62) | – | 12 (4.72) | – | 8 (3.04) | – | 8 (3.11) | – | 0.514 |
TyG triglyceride-glucose, TG/HDL-C ratio triglyceride/high-density lipoprotein cholesterol ratio, COV coefficient of variation, STEMI ST-elevation myocardial infarction, WBC white blood cell, ACEI angiotensin converting enzyme inhibitor, Hb hemoglobin, CAD coronary artery disease, SBP systolic blood pressure, DBP diastolic blood pressure, RHR resting heart rate, LM left main coronary artery, LAD left anterior descending artery, LCX left circumflex artery, RCA right coronary artery, FBG fasting blood glucose, LDL-C low-density lipoprotein cholesterol, HDL-C high-density lipoprotein cholesterol, TG triglycerides, TC total cholesterol, UA uric acid, Lp(a) lipoprotein (a), ApoA1 apolipoprotein A1 ApoB apolipoprotein B, BUN blood urea nitrogen, LVEF left ventricular ejection fraction, AP alkaline phosphatase, PCI percutaneous coronary intervention, CABG coronary artery bypass grafting.
Dates are presented as mean ± SD, medians with inter quartile ranges or percentage.
Figure 2.
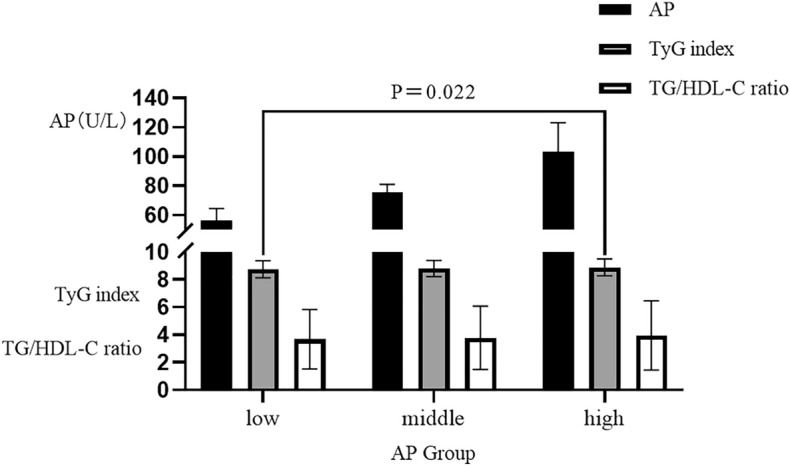
Relationship between serum alkaline phosphatase and TyG index and TG/HLD-C ration. AP alkaline phosphatase; TyG Triglyceride-glucose; TG/HDL-C ratio Triglyceride/high-density lipoprotein cholesterol ratio.
Correlation between the TyG index and clincal variables
Spearman's correlation analysis revealed that there was no significant correlation between the TyG index and serum AP groups, HDL-C, LVEF, and Gensini score. Weak relationships were observed between the TyG index and TC, as well as LDL-C. However, a strong correlation was found between the TyG index and the TG/HDL-C ratio (R = 0.739, P < 0.001) (Table 2).
Table 2.
Correlation between the TyG index and clincal variables.
| Parameters | R (Spearman) | P value |
|---|---|---|
| TG/HDL ratio | 0.739 | < 0.001 |
| AP | 0.120 | 0.001 |
| TC | 0.355 | < 0.001 |
| LDL-C | 0.322 | < 0.001 |
| HDL-C | − 0.112 | 0.002 |
| LVEF | − 0.077 | 0.032 |
| Gensini score | 0.097 | 0.007 |
TyG triglyceride-glucose, TG/HDL-C ratio triglyceride/high-density lipoprotein cholesterol ratio, LDL-C low-density lipoprotein cholesterol, HDL-C high-density lipoprotein cholesterol, TC total cholesterol, LVEF left ventricular ejection fraction, AP alkaline phosphatase.
Evaluation of factors associated with LVEF < 40%
In the fully adjusted model, the serum AP level in the high group (OR 2.598, 95% CI 1.331–5.071, P = 0.005), LAD as IRA (OR 2.452, 95% CI 1.352–4.449, P = 0.003). Conversely, triglyceride (OR 0.652, 95% CI 0.429–0.992, P = 0.046) are independent protective factors for severe reduction in LVEF during AMI hospitalization (Table 3).
Table 3.
Univariate and multivariate analysis of TyG index and LVEF < 40%.
| Variable | Univariate analysis | Multivariate analysis | ||
|---|---|---|---|---|
| OR (95%CI) | P value | OR (95%CI) | P value | |
| Age | 1.026 (1.004–1.049) | 0.020 | 1.012 (0.986–1.038) | 0.376 |
| Male | 1.371 (0.812–2.317) | 0.238 | ||
| SBP | 0.979 (0.968–0.991) | 0.001 | 0.983 (0.970–0.996) | 0.012 |
| DBP | 0.985 (0.967–1.003) | 0.104 | ||
| RHR | 1.020 (1.007–1.034) | 0.002 | 1.014 (1.000–1.029) | 0.055 |
| Ischemic time | 1.000 (0.999–1.003) | 0.734 | ||
| WBC | 1.014 (0.982–1.046) | 0.401 | ||
| Hb | 0.984 (0.973–0.995) | 0.005 | 0.992 (0.979–1.005) | 0.248 |
| TyG | 1.019 (0.695–1.494) | 0.924 | ||
| FBG | 1.084 (1.026–1.146) | 0.004 | 1.016 (0.937–1.102) | 0.702 |
| TG | 0.598 (0.410–0.873) | 0.008 | 0.652 (0.429–0.992) | 0.046 |
| BUN | 1.240 (1.144–1.343) | < 0.001 | 1.127 (0.996–1.275) | 0.058 |
| Creatinine | 1.018 (1.009–1.027) | < 0.001 | 1.002 (0.989–1.015) | 0.790 |
| LDL-C | 1.018 (0.744–1.392) | 0.911 | ||
| HDL-C | 1.765 (0.844–3.694) | 0.131 | ||
| TC | 1.050 (0.840–1.313) | 0.666 | ||
| UA | 1.002 (1.000–1.004) | 0.012 | 1.000 (0.999–1.002) | 0.651 |
| ApoA1 | 1.597 (0.541–4.715) | 0.396 | ||
| ApoB | 1.594 (0.608–4.181) | 0.343 | ||
| Lp(a) | 1.000 (0.999–1.001) | 0.954 | ||
| LAD as IRA | 2.677 (1.548–4.628) | < 0.001 | 2.452 (1.352–4.449) | 0.003 |
| Extent of coronary artery disease | ||||
| 1-vessel | 1 | – | 1 | – |
| 2-vessel | 1.94 (0.903–4.167) | 0.089 | 1.545 (0.686–3.481) | 0.294 |
| 3-vessel | 2.463 (1.209–5.018) | 0.013 | 1.266 (0.540–2.969) | 0.587 |
| Gensini score | 1.012 (1.007–1.017) | < 0.001 | 1.009 (1.003–1.016) | 0.003 |
| Hypertension | 0.814 (0.509–1.302) | 0.390 | ||
| Diabetes mellitus | 1.875 (1.147–3.063) | 0.012 | 0.919 (0.399–2.119) | 0.843 |
| Dyslipidemia | 1.617 (0.988–2.648) | 0.056 | ||
| Current Smoking | 1.326 (0.818–2.149) | 0.253 | ||
| Atrial fibrillation | 1.074 (0.317–3.640) | 0.909 | ||
| Family history of CAD | 1.339 (0.456–3.933) | 0.595 | ||
| Family history of cerebrovascular disease | 1.941 (1.121–3.361) | 0.018 | 1.378 (0.419–4.530) | 0.598 |
| Serum AP level Tertile | ||||
| I (low) | 1 | – | 1 | – |
| II (middle) | 1.529 (0.809–2.893) | 0.191 | 1.857 (0.920–3.750) | 0.084 |
| III (high) | 2.198 (1.197–4.036) | 0.011 | 2.598 (1.331–5.071) | 0.005 |
| Antiplatelets | 2.580 (0.930–7.153) | 0.069 | ||
| Beta-blocker | 0.770 (0.178–3.330) | 0.726 | ||
| Calcium inhibitor | 0.649 (0.349–1.207) | 0.172 | ||
| ACEI | – | 0.998 | ||
| Angiotensin II antagonist | 0.712 (0.214–2.367) | 0.580 | ||
| Diuretic | 2.263 (0.472–10.851) | 0.307 | ||
| Insulin | 1.421 (0.537–3.760) | 0.479 | ||
| Oral antidiabetic drug | 2.137 (1.173–3.892) | 0.013 | 1.779 (0.722–4.387) | 0.211 |
| Statin | 2.736 (0.981–7.632) | 0.055 | ||
| Atrial fibrillation | 1.074 (0.317–3.640) | 0.909 | ||
| Ventricular Tachycardia | 2.59 (0.529–12.692) | 0.240 | ||
| Heart arrest | 3.026 (0.600–15.258) | 0.180 | ||
| Pulmonary Infection | 2.189 (0.928–5.164) | 0.074 | ||
| Hydropericardium | 1.795 (0.207–15.562) | 0.596 | ||
TyG triglyceride-glucose, TG/HDL-C ratio triglyceride/high-density lipoprotein cholesterol ratio, STEMI ST-elevation myocardial infarction, WBC white blood cell, ACEI angiotensin converting enzyme inhibitor, Hb hemoglobin, CAD coronary artery disease, SBP systolic blood pressure, DBP diastolic blood pressure, RHR resting heart rate, LM left main coronary artery, LAD left anterior descending artery, LCX left circumflex artery, RCA right coronary artery, FBG fasting blood glucose, LDL-C low-density lipoprotein cholesterol, HDL-C high-density lipoprotein cholesterol, TG triglycerides, TC total cholesterol, UA uric acid, Lp(a) lipoprotein (a), ApoA1 apolipoprotein A1, ApoB apolipoprotein B, BUN blood urea nitrogen, LVEF left ventricular ejection fraction, AP alkaline phosphatase.
Discussion
Our clinical study has, for the first time, reported that independent risk factors for AMI hospitalized patients with LVEF < 40% are serum AP levels, LAD as IRA, while an independent protective factor is TG. Insulin resistance surrogate markers did not show any significant association with the aforementioned factors. Furthermore, we found no significant correlation between serum AP and IR surrogate markers in AMI patients. However, a significant association still exists between previously established IR surrogate markers, TyG index, and TG/HDL-C ratio.
Serum alkaline phosphatase is a hydrolytic enzyme responsible for dephosphorylation processes in various types of molecules. It is expressed in multiple tissues, with the highest concentration found in bone, liver, and kidneys, and lower levels in the intestine, placenta, kidneys, and white blood cells17. In clinical practice, serum alkaline phosphatase is predominantly used for diagnosing obstructive biliary disease and monitoring metabolic bone diseases caused by renal insufficiency. Phosphate has been proven to be a protective factor for vascular integrity. During the dephosphorylation process mediated by AP, hydrolysis of phosphate may promote vascular calcification, ultimately leading to endothelial dysfunction18. Some novel inhibitors targeting the physiological pyrophosphatase activity of AP have demonstrated the ability to reduce vascular calcification in animal models19. Additionally, studies have shown an upregulation of serum AP levels in blood vessels with medial calcification, supporting the involvement of AP in vascular calcification mediation20. The promotion of vascular calcification by AP was initially discovered in maintenance hemodialysis patients, and higher levels of AP have been consistently associated with increased mortality rates in these patients12. As vascular calcification is a major contributor to atherosclerosis and leads to arterial stiffness, aging, and ultimately adverse cardiovascular events21,22, researchers have used intravascular ultrasound (IVUS) examinations on patients with acute coronary syndrome (ACS) to indicate AP as a potential predictive biomarker for calcification and plaque vulnerability23. Professor Wannamethee et al. not only found a strong correlation between AP and various cardiovascular risk factors but also conducted an 11-year follow-up study on a baseline population without CVD, revealing a significant association between elevated serum AP levels and increased risk of CAD events24. Another study investigating 470 stable angina patients found that higher serum AP levels were associated with higher Gensini scores and more severe forms of CAD25. In a study establishing a link between liver parameters and narrow diameters of coronary vessels in AMI patients, AP was identified as the most important variable for predicting coronary vessel diameter narrowing ≥ 50% or coronary vessel diameter < 50%26. Elevated serum AP during AMI, although below the upper limit of normal, still independently correlate with a higher risk of adverse cardiovascular and cerebrovascular events requiring primary percutaneous coronary intervention27. Moreover, research has found an independent relationship between AP and adverse outcomes in myocardial infarction survivors28. Research has also indicated that AP is a predictive factor for mortality, MI, or stent thrombosis after coronary artery drug-eluting stent implantation13. In recent years, studies have discovered that excessive tissue nonspecific alkaline phosphatase (TNAP) exacerbates myocardial fibrosis induced by MI29.
Insulin resistance is typically defined as a reduced sensitivity or responsiveness to the metabolic actions of insulin. Currently, the hyperinsulinemic-euglycemic clamp technique is considered the "gold standard" for assessing IR. However, the technique is time-consuming, labor-intensive, expensive, and requires experienced operators, making it impractical for epidemiological studies and large-scale clinical investigations30. In recent years, some new and simple indicators have been considered reliable surrogate markers for IR, such as the TyG index and TG/HDL ratio31. Numerous studies have found these surrogate markers to be independent risk factors for CVD and prognosis32–34. Recent research has also shown a positive and independent correlation between serum AP and surrogate markers of IR in the general population11. However, in our study population, we did not find a significant correlation between the two, but we did observe a significant correlation between the previously established surrogate markers of IR, TyG index, and TG/HDL-C ratio, which is consistent with previous research4.
Left ventricular function after AMI is the most important predictor of long-term prognosis35. Impaired LV function indicates a higher risk of cardiac arrest and death36–38. Some studies have indicated that higher TyG index is an independent and causal risk factor for heart failure in the general population39. However, we did not find a significant association between TyG index and severe LV dysfunction in patients hospitalized after AMI. Another study analyzed factors contributing to the decline in LVEF after PCI in patients with STEMI and found that infarction involving the LAD was a significant determinant of LVEF decline in young STEMI patients40, which is consistent with our results. It may be due to the LAD supplying 40% to 50% of the LV myocardium, and patients with LAD as IRA tend to experience more pronounced LV remodeling and dysfunction compared to those without LAD as IRA41. Elevated TG are often associated with CVD and adverse prognosis42.
Our study found that elevated TG were a protective factor for LVEF < 40% in patients hospitalized after AMI, but the specific mechanisms are unclear. The epidemiological studies from multiple previous cohorts consistently indicate a direct relationship between serum triglyceride levels and the risk of coronary heart disease43–45. Furthermore, a meta-analysis found that an increase in TG levels is associated with a dose-dependent elevation in the risk of cardiovascular disease and all-cause mortality46. In our study, triglycerides appear to act as a protective factor against heart failure following MI, although the specific mechanism remains unclear. We consider that this may be due to a decrease in triglyceride levels following myocardial infarction-induced heart failure. Several factors could contribute to this phenomenon: Firstly, evidence suggests a significant enhancement of non-cardiac lipolysis processes in heart failure patients47. Secondly, post-myocardial infarction, sympathetic nervous system activation stimulates the adrenergic system, which not only increases heart rate but also promotes the breakdown of non-cardiac fat tissues48. Thirdly, severe left ventricular dysfunction often accompanies insulin resistance, and damage to insulin signaling during heart failure can lead to non-cardiac fat breakdown49. Lastly, severe inadequacy in left ventricular contraction, leading to elevated B-type natriuretic peptide (BNP) levels, can further stimulate fat tissue lipolysis processes50.
Hypoxic liver injury caused by AMI may result in a slight elevation of serum AP, but studies suggest that it does not cause significant confounding of results27. However, the specific mechanism underlying the AMI remains unclear. We speculate that the elevation of serum AP levels may lead to: first, aggravated myocardial fibrosis, promoting ventricular remodeling29,51; second, endothelial dysfunction leading to poor microcirculation 18; third, inadequate collateral circulation of coronary arteries52; fourth, slow coronary blood flow53, ultimately resulting in severe impairment of LV function after AMI. Based on the first-time confirmation from our study, we have discovered an association between alkaline phosphatase and heart failure following myocardial infarction, prior to the administration of relevant treatments. Our research finding provides crucial evidence for the early prevention of left ventricular dysfunction after myocardial infarction. Furthermore, our research has concluded that alkaline phosphatase cannot serve as a substitute marker for insulin resistance in patients with myocardial infarction, as there is no significant correlation between the two.
Study limitations
Our study had several limitations. Firstly, our study is retrospective in nature and cannot establish causal relationships between certain outcomes. Secondly, The sample size is relatively small, which may affect the reliability of the results. Thirdly, due to the lack of recorded insulin concentration data, we were unable to compare serum AP levels with HOMA-IR and the clamp test for hyperinsulinemia. Finally, our study population consisted exclusively of the Han Chinese ethnicity, thus making it difficult to generalize the current research findings to all countries and ethnic groups. Although adjustments were made for other potential risk factors, we cannot completely rule out the possibility of residual or unassessed confounding factors.
Conclusion
Serum alkaline phosphatase and left anterior descending artery as infarct related artery are independent risk factors for severe reduction in LVEF during hospitalization for AMI. Conversely, triglyceride are independent protective factors for severe reduction in LVEF during AMI hospitalization. We also found a significant association between previous IR surrogate marker TyG index and TG/HDL-C ratio in AMI patients, but no significant correlation was observed between serum AP and IR surrogate markers.
Abbreviations
- AP
Alkaline phosphatase
- AF
Atrial fibrillation
- ACS
Acute coronary syndrome
- TNAP
Tissue nonspecific alkaline phosphatase
- LV
Left ventricular
- LVEF
Left ventricular ejection fraction
- PCI
Percutaneous coronary intervention
- TyG
Triglyceride-glucose
- IR
Insulin resistance
- CAD
Coronary artery disease
- CVD
Cardiovascular disease
- TG
Triglyceride
- SBP
Systolic blood pressure
- DBP
Diastolic blood pressure
- RHR
Resting heart rate
- LM
Left main coronary artery
- LAD
Left anterior descending artery
- LCX
Left circumflex artery
- RCA
Right coronary artery
- IRA
Infarct related artery
- FBG
Fasting blood glucose
- LDL-C
Low-density lipoprotein cholesterol
- HDL-C
High-density lipoprotein cholesterol
- TG
Triglycerides
- TC
Total cholesterol
- UA
Uric Acid
- Lp(a)
Lipoprotein (a)
- ApoA1
Apolipoprotein A1
- ApoB
Apolipoprotein B
- LVEF
Left ventricular ejection fraction
- WBC
White blood cell
- Hb
Hemoglobin
- BUN
Blood urea nitrogen
- MACCE
Main adverse cardiovascular and cerebrovascular events
- BNP
B-type natriuretic peptide
- PCI
Percutaneous coronary intervention
- CABG
Coronary Artery Bypass Grafting
- MI
Myocardial infarction
- STEMI
ST-elevation myocardial infarction
- NSTEMI
Non-ST-elevation myocardial infarction
- NSTE-ACS
Non-ST elevation acute coronary syndrome
Author contributions
All authors contributed substantially to the acquisition and interpretation of data. All authors contributed to manuscript writing, revised the manuscript critically for important intellectual content and approved the final version for publication. Qifeng Guo and Mengdan Miao coordinated the writing of the manuscript and are responsible for the integrity of the work as a whole. No published individual participant data were reported that would require consent from the participants.
Funding
Key Medical Project of Hebei Province, 2020–2021, China. Grant No. 20200118; Geriatric Diseases project, 2020, China. Grant No. LNB202013; Natural Science Foundation of Hebei Province, China. Grant No. H2021206217; Medical science research project of Hebei Province, China. Grant No. 20210051; Hebei Health Care Commission, Grant No.20231904.
Data availability
Due to the small amount of data in this study and the fact that we will collect further data for subsequent studies, the datasets generated and/or analysed during the current study are not publicly available but are available from the corresponding author on reasonable request.
Competing interests
The authors declare no competing interests.
Footnotes
The original online version of this Article was revised: In the original version of this Article, the authors Qifeng Guo and Mengdan Miao were omitted as equally contributing authors.
Publisher's note
Springer Nature remains neutral with regard to jurisdictional claims in published maps and institutional affiliations.
These authors contributed equally: Qifeng Guo and Mengdan Miao.
Change history
11/15/2023
A Correction to this paper has been published: 10.1038/s41598-023-46685-w
Contributor Information
Mingqi Zheng, Email: mzhena@hebmu.edu.cn.
Mei Wei, Email: mei491458@sina.com.
Gang Liu, Email: cardio2004@hebmu.edu.cn.
References
- 1.Halkin A, et al. Impact and determinants of left ventricular function in patients undergoing primary percutaneous coronary intervention in acute myocardial infarction. Am. J. Cardiol. 2005;96(3):325–331. doi: 10.1016/j.amjcard.2005.03.069. [DOI] [PubMed] [Google Scholar]
- 2.Zaret BL, et al. Value of radionuclide rest and exercise left ventricular ejection fraction in assessing survival of patients after thrombolytic therapy for acute myocardial infarction: Results of thrombolysis in myocardial infarction (TIMI) phase II study. The TIMI study group. J. Am. Coll. Cardiol. 1995;26(1):73–79. doi: 10.1016/0735-1097(95)00146-q. [DOI] [PubMed] [Google Scholar]
- 3.Hanley AJ, Williams K, Stern MP, Haffner SM. Homeostasis model assessment of insulin resistance in relation to the incidence of cardiovascular disease: The san antonio heart study. Diab. Care. 2002;25(7):1177–1184. doi: 10.2337/diacare.25.7.1177. [DOI] [PubMed] [Google Scholar]
- 4.Mao Q, Zhou D, Li Y, Wang Y, Xu SC, Zhao XH. The triglyceride-glucose index predicts coronary artery disease severity and cardiovascular outcomes in patients with non-ST-segment elevation acute coronary syndrome. Dis. Markers. 2019;11(2019):6891537. doi: 10.1155/2019/6891537. [DOI] [PMC free article] [PubMed] [Google Scholar]
- 5.Yusuf S, et al. Obesity and the risk of myocardial infarction in 27,000 participants from 52 countries: A case-control study. Lancet. 2005;366(9497):1640–1649. doi: 10.1016/S0140-6736(05)67663-5. [DOI] [PubMed] [Google Scholar]
- 6.Sánchez-García A, et al. Diagnostic accuracy of the triglyceride and glucose index for insulin resistance: A systematic review. Int. J. Endocrinol. 2020;10(2020):4678526. doi: 10.1155/2020/4678526. [DOI] [PMC free article] [PubMed] [Google Scholar]
- 7.Pantoja-Torres B, et al. High triglycerides to HDL-cholesterol ratio is associated with insulin resistance in normal-weight healthy adults. Diabet. Metab. Syndr. 2019;13(1):382–388. doi: 10.1016/j.dsx.2018.10.006. [DOI] [PubMed] [Google Scholar]
- 8.Simental-Mendía LE, Rodríguez-Morán M, Guerrero-Romero F. The product of fasting glucose and triglycerides as surrogate for identifying insulin resistance in apparently healthy subjects. Metab. Syndr. Relat. Disord. 2008;6(4):299–304. doi: 10.1089/met.2008.0034. [DOI] [PubMed] [Google Scholar]
- 9.Zhao Q, et al. Comparison of various insulin resistance surrogates on prognostic prediction and stratification following percutaneous coronary intervention in patients with and without type 2 diabetes mellitus. Cardiovasc. Diabetol. 2021;20(1):190. doi: 10.1186/s12933-021-01383-7. [DOI] [PMC free article] [PubMed] [Google Scholar]
- 10.Luo E, et al. High triglyceride-glucose index is associated with poor prognosis in patients with acute ST-elevation myocardial infarction after percutaneous coronary intervention. Cardiovasc. Diabetol. 2019;18(1):150. doi: 10.1186/s12933-019-0957-3. [DOI] [PMC free article] [PubMed] [Google Scholar]
- 11.Son DH, Ha HS, Lee YJ. Association of serum alkaline phosphatase with the TG/HDL ratio and TyG index in Korean adults. Biomolecules. 2021;11(6):882. doi: 10.3390/biom11060882. [DOI] [PMC free article] [PubMed] [Google Scholar]
- 12.Regidor DL, et al. Serum alkaline phosphatase predicts mortality among maintenance hemodialysis patients. J. Am. Soc. Nephrol. 2008;19(11):2193–2203. doi: 10.1681/ASN.2008010014. [DOI] [PMC free article] [PubMed] [Google Scholar]
- 13.Park JB, et al. Serum alkaline phosphatase is a predictor of mortality, myocardial infarction, or stent thrombosis after implantation of coronary drug-eluting stent. Eur. Heart J. 2013;34(12):920–931. doi: 10.1093/eurheartj/ehs419. [DOI] [PubMed] [Google Scholar]
- 14.Ibanez B, et al. 2017 ESC guidelines for the management of acute myocardial infarction in patients presenting with ST-segment elevation: The task force for the management of acute myocardial infarction in patients presenting with ST-segment elevation of the European society of cardiology (ESC) Eur. Heart J. 2018;39(2):119–177. doi: 10.1093/eurheartj/ehx393. [DOI] [PubMed] [Google Scholar]
- 15.Collet JP, et al. 2020 ESC Guidelines for the management of acute coronary syndromes in patients presenting without persistent ST-segment elevation. Eur. Heart J. 2021;42(14):1289–1367. doi: 10.1093/eurheartj/ehaa575. [DOI] [PubMed] [Google Scholar]
- 16.Gensini GG. A more meaningful scoring system for determining the severity of coronary heart disease. Am. J. Cardiol. 1983;51(3):606. doi: 10.1016/s0002-9149(83)80105-2. [DOI] [PubMed] [Google Scholar]
- 17.Schoppet M, Shanahan CM. Role for alkaline phosphatase as an inducer of vascular calcification in renal failure? Kidney Int. 2008;73(9):989–991. doi: 10.1038/ki.2008.104. [DOI] [PubMed] [Google Scholar]
- 18.Johnson RC, Leopold JA, Loscalzo J. Vascular calcification: Pathobiological mechanisms and clinical implications. Circ. Res. 2006;99(10):1044–1059. doi: 10.1161/01.RES.0000249379.55535.21. [DOI] [PubMed] [Google Scholar]
- 19.Narisawa S, Harmey D, Yadav MC, O'Neill WC, Hoylaerts MF, Millán JL. Novel inhibitors of alkaline phosphatase suppress vascular smooth muscle cell calcification. J. Bone Miner. Res. 2007;22(11):1700–1710. doi: 10.1359/jbmr.070714. [DOI] [PubMed] [Google Scholar]
- 20.Shanahan CM, Cary NR, Salisbury JR, Proudfoot D, Weissberg PL, Edmonds ME. Medial localization of mineralization-regulating proteins in association with Mönckeberg's sclerosis: Evidence for smooth muscle cell-mediated vascular calcification. Circulation. 1999;100(21):2168–2176. doi: 10.1161/01.cir.100.21.2168. [DOI] [PubMed] [Google Scholar]
- 21.Detrano R, et al. Coronary calcium as a predictor of coronary events in four racial or ethnic groups. N. Engl. J. Med. 2008;358(13):1336–1345. doi: 10.1056/NEJMoa072100. [DOI] [PubMed] [Google Scholar]
- 22.Van Campenhout A, Golledge J. Osteoprotegerin, vascular calcification and atherosclerosis. Atherosclerosis. 2009;204(2):321–329. doi: 10.1016/j.atherosclerosis.2008.09.033. [DOI] [PMC free article] [PubMed] [Google Scholar]
- 23.Ren Y, et al. Serum alkaline phosphatase levels are associated with coronary artery calcification patterns and plaque vulnerability. Catheter. Cardiovasc. Interv. 2021;1(97 Suppl 2):1055–1062. doi: 10.1002/ccd.29642. [DOI] [PubMed] [Google Scholar]
- 24.Wannamethee SG, Sattar N, Papcosta O, Lennon L, Whincup PH. Alkaline phosphatase, serum phosphate, and incident cardiovascular disease and total mortality in older men. Arterioscler. Thromb. Vasc. Biol. 2013;33(5):1070–1076. doi: 10.1161/ATVBAHA.112.300826. [DOI] [PubMed] [Google Scholar]
- 25.Sahin I, et al. Correlation between the serum alkaline phosphatase level and the severity of coronary artery disease. Coron. Artery Dis. 2014;25(4):349–352. doi: 10.1097/MCA.0000000000000080. [DOI] [PubMed] [Google Scholar]
- 26.Baars T, et al. In acute myocardial infarction liver parameters are associated with stenosis diameter. Med. Baltim. 2016;95(6):e2807. doi: 10.1097/MD.0000000000002807. [DOI] [PMC free article] [PubMed] [Google Scholar]
- 27.Oh PC, et al. Prognostic impact of alkaline phosphatase measured at time of presentation in patients undergoing primary percutaneous coronary intervention for ST-segment elevation myocardial infarction. PLoS One. 2017;12(2):e0171914. doi: 10.1371/journal.pone.0171914. [DOI] [PMC free article] [PubMed] [Google Scholar]
- 28.Tonelli M, et al. Relation between alkaline phosphatase, serum phosphate, and all-cause or cardiovascular mortality. Circulation. 2009;120(18):1784–1792. doi: 10.1161/CIRCULATIONAHA.109.851873. [DOI] [PubMed] [Google Scholar]
- 29.Cheng X, et al. TNAP is a novel regulator of cardiac fibrosis after myocardial infarction by mediating TGF-β/Smads and ERK1/2 signaling pathways. EBioMedicine. 2021;67:103370. doi: 10.1016/j.ebiom.2021.103370. [DOI] [PMC free article] [PubMed] [Google Scholar]
- 30.DeFronzo RA, Tobin JD, Andres R. Glucose clamp technique: A method for quantifying insulin secretion and resistance. Am. J. Physiol. 1979;237(3):E214–E223. doi: 10.1152/ajpendo.1979.237.3.E214. [DOI] [PubMed] [Google Scholar]
- 31.Guerrero-Romero F, et al. The product of triglycerides and glucose, a simple measure of insulin sensitivity. Comparison with the euglycemic-hyperinsulinemic clamp. J. Clin. Endocrinol. Metab. 2010;95(7):3347–3351. doi: 10.1210/jc.2010-0288. [DOI] [PubMed] [Google Scholar]
- 32.Ma X, et al. Triglyceride glucose index for predicting cardiovascular outcomes after percutaneous coronary intervention in patients with type 2 diabetes mellitus and acute coronary syndrome. Cardiovasc. Diabetol. 2020;19(1):31. doi: 10.1186/s12933-020-01006-7. [DOI] [PMC free article] [PubMed] [Google Scholar]
- 33.Tian X, et al. Triglyceride-glucose index is associated with the risk of myocardial infarction: An 11-year prospective study in the Kailuan cohort. Cardiovasc. Diabetol. 2021;20(1):19. doi: 10.1186/s12933-020-01210-5. [DOI] [PMC free article] [PubMed] [Google Scholar]
- 34.Che B, et al. Triglyceride-glucose index and triglyceride to high-density lipoprotein cholesterol ratio as potential cardiovascular disease risk factors: An analysis of UK biobank data. Cardiovasc. Diabetol. 2023;22(1):34. doi: 10.1186/s12933-023-01762-2. [DOI] [PMC free article] [PubMed] [Google Scholar]
- 35.St John Sutton M, et al. Quantitative two-dimensional echocardiographic measurements are major predictors of adverse cardiovascular events after acute myocardial infarction. The protective effects of captopril. Circulation. 1994;89(1):68–75. doi: 10.1161/01.cir.89.1.68. [DOI] [PubMed] [Google Scholar]
- 36.White HD, Norris RM, Brown MA, Brandt PW, Whitlock RM, Wild CJ. Left ventricular end-systolic volume as the major determinant of survival after recovery from myocardial infarction. Circulation. 1987;76(1):44–51. doi: 10.1161/01.cir.76.1.44. [DOI] [PubMed] [Google Scholar]
- 37.Multicenter Postinfarction Research Group Risk stratification and survival after myocardial infarction. N. Engl. J. Med. 1983;309(6):331–336. doi: 10.1056/NEJM198308113090602. [DOI] [PubMed] [Google Scholar]
- 38.Hammermeister KE, De Rouen TA, Dodge HT. Variables predictive of survival in patients with coronary disease. Selection by univariate and multivariate analyses from the clinical, electrocardiographic, exercise, arteriographic, and quantitative angiographic evaluations. Circulation. 1979;59(3):421–430. doi: 10.1161/01.cir.59.3.421. [DOI] [PubMed] [Google Scholar]
- 39.Li X, et al. Triglyceride-glucose index and the risk of heart failure: Evidence from two large cohorts and a mendelian randomization analysis. Cardiovasc. Diabetol. 2022;21(1):229. doi: 10.1186/s12933-022-01658-7. [DOI] [PMC free article] [PubMed] [Google Scholar]
- 40.Yildiz I, Rencüzoğulları I, Karabağ Y, Karakayali M, Artac I, Gurevin MS. Predictors of left ventricular ejection function decline in young patients with ST-segment elevation myocardial infarction. Rev. Assoc. Med. Bras. 1992;68(6):802–807. doi: 10.1590/1806-9282.20220033. [DOI] [PMC free article] [PubMed] [Google Scholar]
- 41.Masci PG, et al. Relationship between location and size of myocardial infarction and their reciprocal influences on post-infarction left ventricular remodelling. Eur. Heart J. 2011;32(13):1640–1648. doi: 10.1093/eurheartj/ehr064. [DOI] [PubMed] [Google Scholar]
- 42.Budoff M. Triglycerides and triglyceride-rich lipoproteins in the causal pathway of cardiovascular disease. Am. J. Cardiol. 2016;118(1):138–145. doi: 10.1016/j.amjcard.2016.04.004. [DOI] [PubMed] [Google Scholar]
- 43.Kasai T, et al. Mortality risk of triglyceride levels in patients with coronary artery disease. Heart. 2013;99(1):22–29. doi: 10.1136/heartjnl-2012-302689. [DOI] [PubMed] [Google Scholar]
- 44.Nordestgaard BG, Benn M, Schnohr P, Tybjaerg-Hansen A. Nonfasting triglycerides and risk of myocardial infarction, ischemic heart disease, and death in men and women. JAMA. 2007;298(3):299–308. doi: 10.1001/jama.298.3.299. [DOI] [PubMed] [Google Scholar]
- 45.Langsted A, Freiberg JJ, Nordestgaard BG. Fasting and nonfasting lipid levels: Influence of normal food intake on lipids, lipoproteins, apolipoproteins, and cardiovascular risk prediction. Circulation. 2008;118(20):2047–2056. doi: 10.1161/CIRCULATIONAHA.108.804146. [DOI] [PubMed] [Google Scholar]
- 46.Liu J, Zeng FF, Liu ZM, Zhang CX, Ling WH, Chen YM. Effects of blood triglycerides on cardiovascular and all-cause mortality: A systematic review and meta-analysis of 61 prospective studies. Lipids Health Dis. 2013;29(12):159. doi: 10.1186/1476-511X-12-159. [DOI] [PMC free article] [PubMed] [Google Scholar]
- 47.Polak J, et al. Lipolytic effects of B-type natriuretic peptide 1–32 in adipose tissue of heart failure patients compared with healthy controls. J. Am. Coll. Cardiol. 2011;58(11):1119–1125. doi: 10.1016/j.jacc.2011.05.042. [DOI] [PubMed] [Google Scholar]
- 48.Cohn JN, Levine TB, Olivari MT, Garberg V, Lura D, Francis GS, Simon AB, Rector T. Plasma norepinephrine as a guide to prognosis in patients with chronic congestive heart failure. N. Engl. J. Med. 1984;311(13):819–823. doi: 10.1056/NEJM198409273111303. [DOI] [PubMed] [Google Scholar]
- 49.Riehle C, Abel ED. Insulin signaling and heart failure. Circ. Res. 2016;118(7):1151–1169. doi: 10.1161/CIRCRESAHA.116.306206. [DOI] [PMC free article] [PubMed] [Google Scholar]
- 50.Szabó T, et al. Increased catabolic activity in adipose tissue of patients with chronic heart failure. Eur. J. Heart Fail. 2013;15(10):1131–1137. doi: 10.1093/eurjhf/hft067. [DOI] [PubMed] [Google Scholar]
- 51.González A, Schelbert EB, Díez J, Butler J. Myocardial interstitial fibrosis in heart failure: Biological and translational perspectives. J. Am. Coll. Cardiol. 2018;71(15):1696–1706. doi: 10.1016/j.jacc.2018.02.021. [DOI] [PubMed] [Google Scholar]
- 52.Karabulut A, et al. Impact of serum alkaline phosphatase level on coronary collateral circulation. Kardiol. Pol. 2014;72(12):1388–1393. doi: 10.5603/KP.a2014.0114. [DOI] [PubMed] [Google Scholar]
- 53.Wang Y, et al. Association between increased serum alkaline phosphatase and the coronary slow flow phenomenon. BMC Cardiovasc. Disord. 2018;18(1):138. doi: 10.1186/s12872-018-0873-6. [DOI] [PMC free article] [PubMed] [Google Scholar]
Associated Data
This section collects any data citations, data availability statements, or supplementary materials included in this article.
Data Availability Statement
Due to the small amount of data in this study and the fact that we will collect further data for subsequent studies, the datasets generated and/or analysed during the current study are not publicly available but are available from the corresponding author on reasonable request.