

Abstract
BACKGROUND:
Cerebrovascular reactivity (CVR) is inversely related to white matter hyperintensity severity, a marker of cerebral small vessel disease (SVD). Less is known about the relationship between CVR and other SVD imaging features or cognition. We aimed to investigate these cross-sectional relationships.
METHODS:
Between 2018 and 2021 in Edinburgh, we recruited patients presenting with lacunar or cortical ischemic stroke, whom we characterized for SVD features. We measured CVR in subcortical gray matter, normal-appearing white matter, and white matter hyperintensity using 3T magnetic resonance imaging. We assessed cognition using Montreal Cognitive Assessment. Statistical analyses included linear regression models with CVR as outcome, adjusted for age, sex, and vascular risk factors. We reported regression coefficients with 95% CIs.
RESULTS:
Of 208 patients, 182 had processable CVR data sets (median age, 68.2 years; 68% men). Although the strength of association depended on tissue type, lower CVR in normal-appearing tissues and white matter hyperintensity was associated with larger white matter hyperintensity volume (BNAWM=−0.0073 [95% CI, −0.0133 to −0.0014] %/mm Hg per 10-fold increase in percentage intracranial volume), more lacunes (BNAWM=−0.00129 [95% CI, −0.00215 to −0.00043] %/mm Hg per lacune), more microbleeds (BNAWM=−0.00083 [95% CI, −0.00130 to −0.00036] %/mm Hg per microbleed), higher deep atrophy score (BNAWM=−0.00218 [95% CI, −0.00417 to −0.00020] %/mm Hg per score point increase), higher perivascular space score (BNAWM=−0.0034 [95% CI, −0.0066 to −0.0002] %/mm Hg per score point increase in basal ganglia), and higher SVD score (BNAWM=−0.0048 [95% CI, −0.0075 to −0.0021] %/mm Hg per score point increase). Lower CVR in normal-appearing tissues was related to lower Montreal Cognitive Assessment without reaching convention statistical significance (BNAWM=0.00065 [95% CI, −0.00007 to 0.00137] %/mm Hg per score point increase).
CONCLUSIONS:
Lower CVR in patients with SVD was related to more severe SVD burden and worse cognition in this cross-sectional analysis. Longitudinal analysis will help determine whether lower CVR predicts worsening SVD severity or vice versa.
REGISTRATION:
URL: https://www.isrctn.com; Unique identifier: ISRCTN12113543.
Keywords: cerebrovascular circulation, cerebrovascular disorders, cognition, cross-sectional studies, humans, magnetic resonance imaging
Cerebral small vessel disease (SVD) is a disorder of the cerebral small vessels causing lacunar ischemic strokes1 and vascular cognitive impairment.2,3 The associated neuroimaging features observed with magnetic resonance imaging (MRI) are white matter hyperintensities (WMHs), lacunes of presumed vascular origin, microbleeds, enlarged perivascular spaces (PVSs), and recent small subcortical infarcts.4 Currently, SVD pathophysiology is unclear; no effective treatments are available.5 Therefore, identifying vascular dysfunctions and their relationships to disease features and progression may help develop treatments.6
One vascular parameter of interest is cerebrovascular reactivity (CVR), which probes the ability of cerebral blood vessels to dilate in response to increased brain demand for energy and is impaired in patients with SVD.6–8 CVR can be obtained by measuring changes in blood oxygen level dependent (BOLD)—an MRI technique sensitive to cerebral blood flow and cerebral blood volume—in response to a vasodilatory stimulus, including carbon dioxide (CO2) enriched air.7,9
Previous studies investigating CVR in patients with SVD found cross-sectional associations between lower CVR in subcortical gray matter (SGM) and white matter and higher WMH burden.8,10,11 One study noted lower CVR in WMH compared with contralateral normal-appearing white matter (NAWM).12 Furthermore, SGM and subcortical white matter CVR are associated with higher blood pressure but not with global cerebral blood flow.8 White matter CVR is associated with enlarged PVSs in the basal ganglia, increased pulsatility in the venous sinuses, and lower cerebrospinal fluid stroke volume in the foramen magnum.8 Global CVR reduction is associated with having more microbleeds but not with the number of lacunes.13 Overall, the sample sizes of these studies were relatively small, most of the results have not yet been replicated, and associations of CVR with clinical features such as cognition have not been extensively tested in patients with SVD.
Therefore, we aimed to assess CVR in relation to SVD MRI features at 3T, cognition, and stroke severity in a large cohort of patients with SVD who presented with a minor nondisabling lacunar or cortical ischemic stroke. We hypothesized that lower CVR in normal-appearing tissues and WMH would be associated with more severe SVD imaging features, worse cognition, and stroke severity.
METHODS
We followed the STROBE (Strengthening the Reporting of Observational Studies in Epidemiology) reporting guidelines.14 The data that support the findings of this study will be made available when the study has been completed. In the meantime, they are available from the corresponding author upon reasonable request.
Patients
Between August 2018 and June 2021, we recruited patients with mild ischemic stroke, either lacunar or mild cortical ischemic stroke, presenting at Edinburgh/Lothian Stroke Services (Mild Stroke Study 3; ISRCTN12113543).15,16 Mild stroke was defined as a modified Rankin Scale score ≤2, and stroke diagnosis was undertaken by specialist stroke physicians and neuroradiologists. We excluded patients with MRI contraindications, major neuronal conditions, and severe cardiac and respiratory diseases. All participants gave written informed consent. The Southeast Scotland Regional Ethics Committee approved the study (reference number 18/SS/0044).
Within 3 months of index stroke, all participants underwent MRI. We recorded medical history and vascular risk factors for each patient and measured blood pressure. We assessed global cognition using the Montreal Cognitive Assessment (MoCA). Stroke severity and degree of patient disability were measured using the National Institutes of Health Stroke Scale and modified Rankin Scale.17
MRI Acquisitions
The visit included a 1.5-hour MRI scanning session with breaks for patient comfort. All images were acquired on a 3T MRI scanner (MAGNETOM Prisma; Siemens Healthcare, Erlangen, Germany). We acquired 3-dimensional T1-weighted (repetition time [TR]/echo time [TE]/inversion time [TI], 2500/4.37/1100 ms; flip angle, 7°; isotropic resolution, 1.0 mm3), 3-dimensional T2-weighted (T2W; TR/TE, 3200/408 ms; isotropic resolution, 0.9 mm3), 3-dimensional fluid-attenuated inversion recovery (TR/TE/TI, 5000/388/1800 ms; isotropic resolution, 1.0 mm3), and 3-dimensional susceptibility-weighted (TR/TE, 28/20 ms; flip angle, 9°; 0.6×0.6×3.0 mm3 resolution) images.15 We also performed a 2-dimensional gradient-echo echo-planar imaging scan to measure CVR (TR/TE, 1550/30 ms; flip angle, 67°; isotropic resolution, 2.5 mm3). Full details of the MRI acquisition protocols including reproducibility can be found in previous works.7,15,16,18
During the 12-minute CVR scan, a physician or nurse was present, and we administered medical air and 6% CO2-enriched air (CO2:O2:N2, 6%:21%:73%) alternately for 2 and 3 minutes, respectively.7 We monitored other physiological parameters: end-tidal CO2, end-tidal O2, oxygen saturation level, and heart and respiration rates.
Analysis of MRI Data
Neuroimaging SVD features were assessed using the STRIVE-1 (Standards for ReportIng Vascular Changes on Neuroimaging 1) criteria (Table S1).4 We visually assessed WMH, separately in periventricular and deep WM, using Fazekas scores. We visually rated PVS score in the basal ganglia and centrum semiovale.19 We also noted the number of lacunes and microbleeds and rated atrophy in deep and superficial brain areas.20 We summed Fazekas, PVS, and atrophy scores to get the total Fazekas, PVS, and atrophy scores, respectively. We computed the SVD score, scoring overall SVD severity.21
For each individual, all structural images were coregistered to the subject’s T2W image using FSL FLIRT22,23 (FMRIB Software Library, FMRIB Analysis Group, Oxford, United Kingdom). Acute stroke lesions were manually segmented on fluid-attenuated inversion recovery images under supervision of an expert neuroradiologist. WMHs were segmented on fluid-attenuated inversion recovery images,24 whereas PVS were segmented on T2W images using a previously described computational method.25,26 The brain was segmented using the coregistered and combined fluid-attenuated inversion recovery, T1-weighted, and T2W images. NAWM masks were generated using an in-house–developed processing pipeline that combines FreeSurfer27,28 (https://surfer.nmr.mgh.harvard.edu/) and FSL FAST29 outputs. Subcortical structures and ventricles were segmented using FreeSurfer.27,28 All masks were checked and rectified manually if needed. WMH and brain volumes were normalized to the intracranial volume and reported in percentage intracranial volume units. PVS volumes were normalized to the volume of the region of interest (ROI) where they were segmented and reported in %ROI volume units.
Regarding CVR data processing, SGM and NAWM masks were eroded in T2W space by 1 mm in all directions to reduce partial volume artifact. To minimize contamination from large blood vessels running along the ventricles, tissue adjacent to the ventricles was excluded using a mask of the ventricles dilated by 5 mm to the left and right and by 4 mm to the anterior, posterior, superior, and inferior directions. We then subtracted the dilated mask from the NAWM and WMH masks. The contribution from other large venous blood vessels was manually removed by comparing all masks to the susceptibility-weighted images. Thereafter, BOLD volumes were temporally realigned. Masks (SGM, NAWM, and WMH) were registered to the mean BOLD space and used to compute the mean BOLD signal in each ROI. We used linear regression to model the mean BOLD signal using a time-shifted end-tidal CO2 profile and volume number (to account for linear signal drift) as independent variables.7,18 We did not model voxel-wise BOLD signals as this lacks robustness against noise.18 The optimal delay per subject and ROI was defined as the time-shift of the end-tidal CO2 profile that gave the lowest sum of squared residuals. CVR (in %/mm Hg) was defined as the relative change in BOLD signal per unit change in end-tidal CO2. CVR was not assessed in cortical GM due to its thinness, especially in patients with SVD where atrophy including cortical thinning is common, and due to large blood vessels running along the brain surface and causing a large blooming effect thereby contaminating the cortical signal.7
Statistical Analysis
Statistical analyses were conducted using R. We modeled CVR separately in SGM, NAWM, and WMH. Univariate and multivariable linear regressions were conducted using CVR as outcome and SVD features or cognition as independent variables. In the multivariable analyses, we adjusted the models for age, sex, mean arterial pressure, smoking history (current/recent versus ex-smoker for >1 year versus never), diagnosis of hypertension, diabetes, and hypercholesterolemia. We checked for collinearity between variables and verified model assumptions: normality of residuals and heteroscedasticity. To ensure normality of residuals, we transformed WMH volumes using the logarithm to the base-10 function.
We excluded missing data from the relevant analyses. We reported coefficients of the linear regressions with 95% CIs and P values. We did not apply corrections for multiple comparisons as we did not use a significance level. We conducted several sensitivity analyses to verify specific technical points (Tables S4 through S9).
RESULTS
We recruited 208 patients of whom 15 did not undergo CVR (Figure 1). We included 182 of 193 data sets in the analysis (median age, 68.2 years; 68% men; Table 1). Reasons to exclude 11 data sets are given in Figure 1. Of the remaining 182 data sets, 7 patients did not have WMH voxels following mask registration into the mean BOLD space, thus resulting in 175 data sets specifically for WMH CVR analyses. PVS volumes could not be computed in 6 of 182 data sets due to poor quality of T2W images. Full MoCA assessment was not available for 3 of 182 subjects.
Figure 1.

Flowchart showing data exclusion process before the analysis. BOLD indicates blood oxygen level dependent; CVR, cerebrovascular reactivity; EtCO2, end-tidal CO2; MoCA, Montreal Cognitive Assessment; NAWM, normal-appearing white matter; PVS, perivascular space; SGM, subcortical gray matter; T2W, T2 weighted; and WMH, white matter hyperintensity.
Table 1.
Population Characteristics
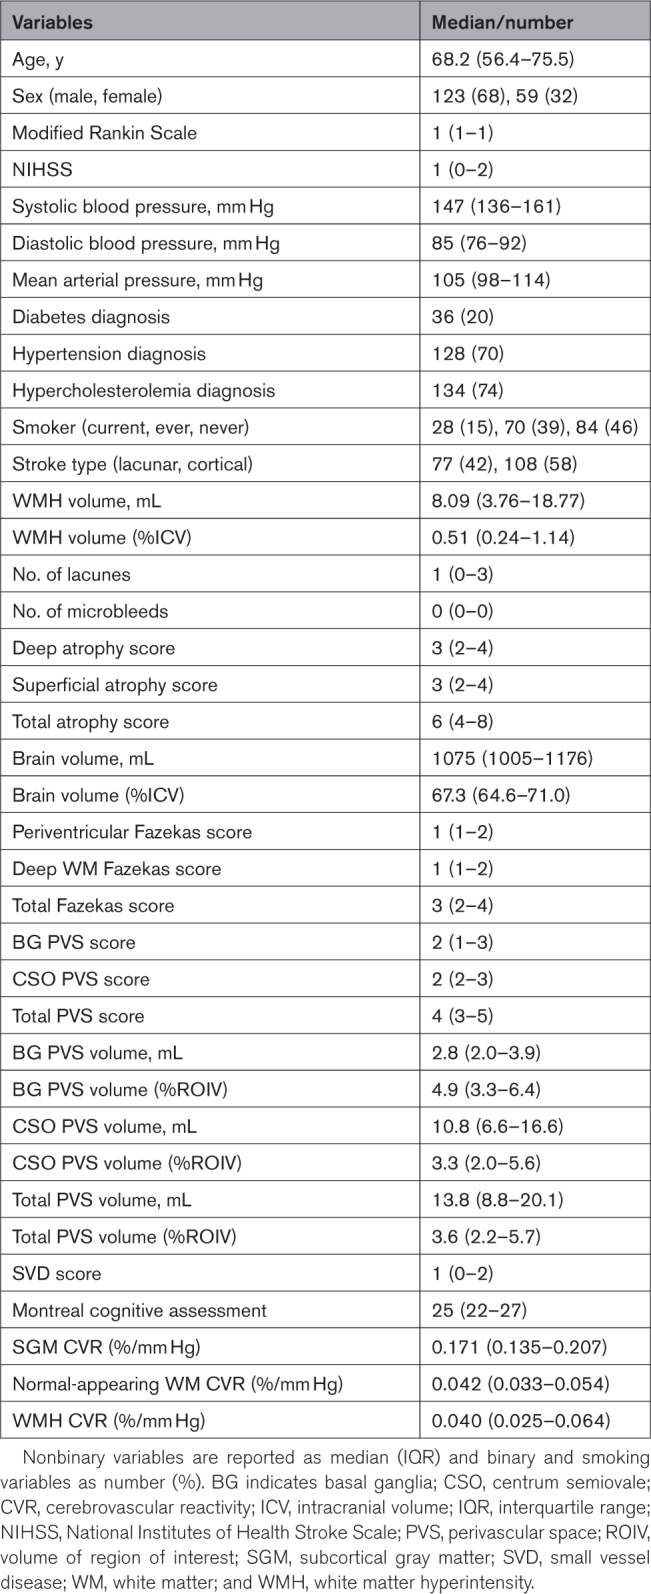
CVR was similar in WMH and NAWM (mean inter-region difference, 0.00206 [95% CI, −0.00379 to 0.00791] %/mm Hg) and highest in SGM (SGM−NAWM CVR difference, 0.128 [0.121–0.134] %/mm Hg; Table 1).
Regression coefficients are reported in Table 2 and illustrated in Figures 2 and 3. Lower CVR in most tissues was associated with greater WMH volumes, higher Fazekas scores, more microbleeds, more lacunes, and higher SVD scores, although relationships between WMH CVR and lacunes and between NAWM CVR and deep WM Fazekas scores were not conventionally significant. Lower NAWM CVR was associated with higher deep atrophy scores, with a similar relationship for SGM and WMH CVR. We found an association between lower CVR in normal-appearing tissues and higher basal ganglia PVS scores, with a similar direction of effect for WMH CVR. Moreover, lower WMH CVR was associated with higher centrum semiovale and total PVS scores. There was a general direction of lower CVR in normal-appearing tissues and lower MoCA scores, although not conventionally significant. We did not find associations between CVR, brain volumes, National Institutes of Health Stroke Scale, and modified Rankin Scale scores.
Table 2.
Adjusted Analyses

Figure 2.

Standardized regression coefficients between small vessel disease (SVD) features and CVR in subcortical gray matter (SGM; pink), normal-appearing white matter (NAWM; green), and white matter hyperintensity (WMH; blue). The dots represent the mean standardized coefficients and the horizontal lines, the associated 95% CIs. The vertical dashed line emphasizes a zero-valued coefficient. Coefficients to left of zero line indicate association with lower CVR. BG indicates basal ganglia; CSO, centrum semiovale; DWM, deep white matter; MoCA, Montreal Cognitive Assessment; mRS, modified Rankin Scale; NIHSS, National Institutes of Health Stroke Scale; PV, periventricular; and PVS, perivascular space.
Figure 3.

Relationships between adjusted cerebrovascular reactivity (CVR), small vessel disease (SVD) features, and cognition. CVR was adjusted for age, sex, and vascular risk factors. The results are shown for adjusted CVR in subcortical gray matter (SGM; pink), normal-appearing white matter (NAWM; green), and white matter hyperintensity (WMH; blue) as a function of (A) WMH volume, (B) number of lacunes, (C) deep atrophy score, (D) perivascular space (PVS) score in the basal ganglia, (E) SVD score, and (F) Montreal Cognitive Assessment (MoCA) score. In A and B, the regression lines are shown.
DISCUSSION
We investigated how CVR relates to a comprehensive set of SVD features, as well as to cognitive impairment and stroke severity. In this largest study of CVR in SVD to date, CVR was lower in patients with more severe SVD even in normal-appearing tissues, and in association with different SVD features, although the strength of association varied across tissue and lesion types. CVR in normal-appearing tissues and MoCA scores were positively related, although the existence of effect did not reach conventional significance. These relationships were independent of age, sex, and vascular risk factors. As SVD-related tissue damage accumulates over time,30 regions with low CVR could be at risk of deteriorating. Indeed, a previous study (n=45) found that CVR in NAWM that progressed into WMH after 1 year was lower than in contralateral NAWM.31 Future studies should confirm this.
The relationship between lower CVR and higher WMH burden is consistent between WMH volumes and visual scores. Such relationships have been found in previous studies in older subjects with WMH,12,31–34 patients with Alzheimer disease,35 and SVD patients with mild stroke.8 The effect sizes are similar to those from a previous study.10 Overall, the sample size of the current study is larger (n=182 versus n=10–75), thereby making the finding much more robust.
Lower CVR in most ROIs was associated with more lacunes and microbleeds. The coefficient between CVR in WMH and number of lacunes did not reach conventional statistical significance (P<0.05), although the direction of effect is biologically plausible. Two previous studies also investigated those relationships but found no associations between CVR and number of lacunes.8,13 Results for number of microbleeds differed: 1 study found CVR impairment related to more microbleeds13 and the other found no associations.8 However, the 2 studies had much smaller sample sizes (n=49–53), data were acquired at different field strengths (1.5T and 7T), and other brain regions were considered for CVR computation.
Lower NAWM CVR was associated with higher deep atrophy score, whereas other relationships between CVR and brain atrophy did not pass the P<0.05 threshold. However, based on the coefficient and its 95% CIs, one could argue about the existence of an association between lower WMH CVR and higher deep atrophy scores. A previous study8 found no associations between CVR and atrophy, possibly due to smaller sample size (n=53).
We found an association between lower CVR in all ROIs and higher basal ganglia PVS score with lower confidence in the existence of an effect in the case of CVR in WMH. On the contrary, we found associations between WMH CVR and centrum semiovale or total PVS scores. Different relationships with CVR were found when using PVS scores and volumes: whereas scores reflect only a count, volumes will also be influenced by PVS size. Moreover, scores could be limited by floor and ceiling effects.36 Previous studies have found that lower CVR8,37 and higher vascular pulsatility38 are associated with enlarged PVS. Although currently under debate, lower CVR and higher vascular pulsatility could be linked to vascular stiffness, which itself could induce stagnation of interstitial fluid, thereby providing a link between the brain’s waste clearance and vascular systems.6,39
We also found an association between lower CVR in all ROIs and higher SVD score in agreement with a previous study.8 Therefore, CVR could be a marker reflecting overall SVD severity and should be considered for future clinical studies of SVD.
CVR impairment in normal-appearing tissues was related to worse cognition, although the results did not reach conventional statistical significance. However, this could have been mediated by WMH burden. There were no associations between CVR and stroke outcome or severity, possibly because both were mild. One previous study also reported no associations between CVR and stroke severity or dependency, though its sample size was smaller.8 Previous studies on Alzheimer disease have found lower CVR compared with healthy volunteers but did not report on the relationship between CVR and cognition directly.35,40
This work has multiple strengths. We used a reproducible CVR experiment optimized for SVD research.7,10,18 Visual assessments of SVD features were systematic, comprehensive, and supervised by expert neuroradiologists, and statistical analyses were verified by a professional statistician. Image analysis used pipelines designed and tested in vascular disease. Finally, this is the largest study to date to have assessed CVR impairment in SVD.
There are also some limitations. First, the BOLD contrast is sensitive to cerebral blood flow but also to cerebral blood volume, oxygen extraction fraction, oxygen consumption, hematocrit, and vessel morphology, thereby hindering the interpretation of BOLD signal changes. CVR was not assessed in cortical GM due to associated technical challenges, although this would be relevant in future work. Due to limited repeatability,18 CVR delay was not investigated in this study. This analysis only included SVD patients with lacunar or cortical stroke; therefore, the associations found could differ in other forms of SVD. More men were recruited than women, reflecting men excess in small vessel stroke.41 The population had mild stroke, but patients with more severe stroke would not be able to tolerate long scans. Moreover, we only used MoCA to reflect cognition, whereas other metrics could be investigated, for example, trail making A and B test.42 Lastly, this is a cross-sectional study; therefore, the relationships found are not causal.
Overall, lower CVR in WMH, NAWM, and SGM was associated with SVD burden in patients with mild ischemic stroke and SVD. The strength of association depended on the tissue and SVD feature type. Further research is needed to understand how CVR impairment relates to the progression of SVD lesions.
ARTICLE INFORMATION
Acknowledgments
The authors thank the participants, radiographers, and professional support staff for their contribution to this work. The present study is based on Chapter 6 of the doctoral thesis of Dr Sleight conducted at the University of Edinburgh. Dr Sleight prepared the manuscript, contributed to data collection and processing, and did the formal analysis and interpretation of data. Drs Wardlaw, Clancy, Thrippleton, Marshall, and Doubal designed the study. Dr Clancy, Dr Arteaga, D.J. Garcia, and W. Hewins participated in patient recruitment. Dr Stringer, Dr Clancy, Dr Arteaga, D.J. Garcia, W. Hewins, A.C.C. Jochems, Dr Hamilton, Dr Manning, Dr Morgan, R. Locherty, Dr Cheng, Dr Liu, Dr Zhang, I. Hamilton, C. Jardine, Dr Brown, E. Sakka, A. Kampaite, Dr Wiseman, Dr Valdés-Hernández, Dr Chappell, and Dr Wardlaw contributed to data collection and processing. Dr Stringer, Dr Manning, Dr Morgan, Dr Valdés-Hernández, Dr Chappell, Dr Marshall, Dr Thrippleton, and Dr Wardlaw contributed to data analysis and interpretation. Dr Wardlaw, Dr Stringer, Dr Marshall, and Dr Thrippleton supervised the project. Dr Wardlaw oversaw the work and takes full responsibility for the content. All authors reviewed the article and approved the submitted version.
Sources of Funding
Dr Sleight is funded by the Medical Research Council (MRC) National Productivity Fund (MR/R502327) and, with A.C.C. Jochems, acknowledges support from the University of Edinburgh College of Medicine and Veterinary Medicine (CMVM). Drs Sleight, Stringer, Arteaga, and Wardlaw are funded by the UK Dementia Research Institute (UKDRI), which receives funding from UKDRI, Ltd, funded by the MRC, Alzheimer’s Society, and Alzheimer’s Research UK. This work received funding from the UKDRI, European Union Horizon 2020 (PHC-03-15, project No. 666881 SVDs@Target), Fondation Leducq Transatlantic Network of Excellence for the Study of Perivascular Spaces in Small Vessel Disease (reference No. 16CVD 05). Furthermore, W. Hewins, Dr Wiseman, and R. Locherty acknowledge funding from Stroke Association (SVD-SOS [Small Vessel Disease - Spotlight On Symptoms], SA PG 19\100068; Stroke Association Postdoctoral Fellowship 18\100026); A.C.C. Jochems from Alzheimer’s Society (ref 486 [AS-CP-18b-001]); Dr Valdés-Hernández, from the Row Fogo Center for Research Into Ageing and the Brain (AD.ROW4.35. BRO-D.FID3668413); Dr Thrippleton from the Scottish Chief Scientist Office through the NHS Lothian Research and Development Office; Dr Clancy from the Chief Scientist Office (CAF/18/08), Princess Margaret Stroke Association Research Development Fellowship and SCREDS (Scottish Clinical Research Excellence Development Scheme) Lectureship Scheme; Dr Arteaga from the Mexican National Council of Science and Technology, Anne Rowling Regenerative Neurology Clinic, and Row Fogo Center for Research Into Small Vessel Diseases; Dr Doubal from The Stroke Association-Garfield Weston Foundation (The Stroke Association Lectureship 2015/04), NHS Research Scotland, and Agnes Parry Endowment at the University of Edinburgh; D.J. Garcia from the Wellcome Trust; Dr Cheng from the China Scholarship Council; and Dr Liu from University of Hong Kong Foundation Postgraduate Fellowship. At the time of contribution, Dr Hamilton was funded by the University of Edinburgh CMVM as part of the Wellcome Trust 4-year PhD in Translational Neuroscience. The 3T research scanner is funded by the Wellcome Trust (104916/Z/14/Z), Dunhill Trust (R380R/1114), Edinburgh and Lothians Health Foundation (2012/17), Muir Maxwell Research Fund, and University of Edinburgh. For the purpose of open access, the author has applied a CC-BY public copyright license to any author accepted manuscript version arising from this submission.
Disclosures
Drs Morgan and Stringer receive funding from Siemens Healthineers. The other authors report no conflicts.
Supplemental Material
Figures S1–S2
Tables S1–S9
Supplementary Material
Nonstandard Abbreviations and Acronyms
- BOLD
- blood oxygen level dependent
- CVR
- cerebrovascular reactivity
- MoCA
- Montreal Cognitive Assessment
- MRI
- magnetic resonance imaging
- NAWM
- normal-appearing white matter
- PVS
- perivascular space
- ROI
- region of interest
- SGM
- subcortical gray matter
- SVD
- small vessel disease
- WMH
- white matter hyperintensity
Presented in part at the 2021 European Stroke Organisation Conference, virtual, September 1–3, 2021, and the 2022 European Stroke Organisation Conference, Lyon, France, May 4–6, 2022.
For Sources of Funding and Disclosures, see page 2783.
Supplemental Material is available at https://www.ahajournals.org/doi/suppl/10.1161/STROKEAHA.123.042656.
Contributor Information
Emilie Sleight, Email: s1959968@ed.ac.uk.
Michael S. Stringer, Email: m.stringer@ed.ac.uk.
Una Clancy, Email: una.clancy@ed.ac.uk.
Carmen Arteaga, Email: carmen.arteaga@ed.ac.uk.
Daniela Jaime Garcia, Email: dany.jaime@ed.ac.uk.
Will Hewins, Email: will.hewins@ed.ac.uk.
Angela C.C. Jochems, Email: ajochems@ed.ac.uk.
Olivia K.L. Hamilton, Email: igerrish@exseed.ed.ac.uk.
Cameron Manning, Email: C.J.Manning-1@sms.ed.ac.uk.
Alasdair G. Morgan, Email: s1005152@ed.ac.uk.
Rachel Locherty, Email: Rachel.Locherty@ed.ac.uk.
Yajun Cheng, Email: 495319040@qq.com.
Xiaodi Liu, Email: dillys10@connect.hku.hk.
Junfang Zhang, Email: v1jzha19@exseed.ed.ac.uk.
Iona Hamilton, Email: igerrish@exseed.ed.ac.uk.
Charlotte Jardine, Email: Charlotte.Jardine@ed.ac.uk.
Rosalind Brown, Email: rbrown9@exseed.ed.ac.uk.
Eleni Sakka, Email: eleni.sakka@ed.ac.uk.
Agniete Kampaite, Email: a.kampaite@ed.ac.uk.
Stewart Wiseman, Email: swiseman@staffmail.ed.ac.uk.
Francesca M. Chappell, Email: f.chappell@ed.ac.uk.
Fergus N. Doubal, Email: fergus.doubal@ed.ac.uk.
Ian Marshall, Email: ian.marshall@ed.ac.uk.
Michael J. Thrippleton, Email: m.j.thrippleton@ed.ac.uk.
REFERENCES
- 1.Georgakis MK, Duering M, Wardlaw JM, Dichgans M. WMH and long-term outcomes in ischemic stroke: a systematic review and meta-analysis. Neurology. 2019;92:e1298–e1308. doi: 10.1212/WNL.0000000000007142 [DOI] [PubMed] [Google Scholar]
- 2.Sweeney MD, Montagne A, Sagare AP, Nation DA, Schneider LS, Chui HC, Harrington MG, Pa J, Law M, Wang DJJ, et al. Vascular dysfunction—the disregarded partner of Alzheimer’s disease. Alzheimers Dement. 2019;15:158–167. doi: 10.1016/j.jalz.2018.07.222 [DOI] [PMC free article] [PubMed] [Google Scholar]
- 3.Gorelick PB, Scuteri A, Black SE, DeCarli C, Greenberg SM, Iadecola C, Launer LJ, Laurent S, Lopez OL, Nyenhuis D, et al. ; American Heart Association Stroke Council, Council on Epidemiology and Prevention, Council on Cardiovascular Nursing, Council on Cardiovascular Radiology and Intervention, and Council on Cardiovascular Surgery and Anesthesia. Vascular contributions to cognitive impairment and dementia. Stroke. 2011;42:2672–2713. doi: 10.1161/STR.0b013e3182299496 [DOI] [PMC free article] [PubMed] [Google Scholar]
- 4.Wardlaw JM, Smith EE, Biessels GJ, Cordonnier C, Fazekas F, Frayne R, Lindley RI, O’Brien JT, Barkhof F, Benavente OR, et al. ; Standards for Reporting Vascular Changes on Neuroimaging (STRIVE v1). Neuroimaging standards for research into small vessel disease and its contribution to ageing and neurodegeneration. Lancet Neurol. 2013;12:822–838. doi: 10.1016/S1474-4422(13)70124-8 [DOI] [PMC free article] [PubMed] [Google Scholar]
- 5.Bath PM, Wardlaw JM. Pharmacological treatment and prevention of cerebral small vessel disease: a review of potential interventions. Int J Stroke. 2015;10:469–478. doi: 10.1111/ijs.12466 [DOI] [PMC free article] [PubMed] [Google Scholar]
- 6.Wardlaw JM, Smith C, Dichgans M. Small vessel disease: mechanisms and clinical implications. Lancet Neurol. 2019;18:684–696. doi: 10.1016/S1474-4422(19)30079-1 [DOI] [PubMed] [Google Scholar]
- 7.Thrippleton MJ, Shi Y, Blair G, Hamilton I, Waiter G, Schwarzbauer C, Pernet C, Andrews PJD, Marshall I, Doubal F, et al. Cerebrovascular reactivity measurement in cerebral small vessel disease: rationale and reproducibility of a protocol for MRI acquisition and image processing. Int J Stroke. 2018;13:195–206. doi: 10.1177/1747493017730740 [DOI] [PubMed] [Google Scholar]
- 8.Blair GW, Thrippleton MJ, Shi Y, Hamilton I, Stringer M, Chappell F, Dickie DA, Andrews P, Marshall I, Doubal FN, et al. Intracranial hemodynamic relationships in patients with cerebral small vessel disease. Neurology. 2020;94:e2258–e2269. doi: 10.1212/WNL.0000000000009483 [DOI] [PMC free article] [PubMed] [Google Scholar]
- 9.Sleight E, Stringer MS, Marshall I, Wardlaw JM, Thrippleton MJ. Cerebrovascular reactivity measurement using magnetic resonance imaging: a systematic review. Front Physiol. 2021;12:643468. doi: 10.3389/fphys.2021.643468 [DOI] [PMC free article] [PubMed] [Google Scholar]
- 10.Stringer MS, Blair GW, Hamilton I, Doubal FN, Marshall IM, Thrippleton MJ, Wardlaw JM, Shi Y, Dickie DA. A comparison of CVR magnitude and delay assessed at 15 and 3T in patients with cerebral small vessel disease. Front Physiol. 2021;12:644837. doi: 10.3389/fphys.2021.644837 [DOI] [PMC free article] [PubMed] [Google Scholar]
- 11.Atwi S, Shao H, Crane DE, da Costa L, Aviv RI, Mikulis DJ, Black SE, MacIntosh BJ. BOLD-based cerebrovascular reactivity vascular transfer function isolates amplitude and timing responses to better characterize cerebral small vessel disease. NMR Biomed. 2019;32:e4064. doi: 10.1002/nbm.4064 [DOI] [PubMed] [Google Scholar]
- 12.Sam K, Crawley AP, Poublanc J, Conklin J, Sobczyk O, Mandell DM, Mikulis DJ, Duffin J, Venkatraghavan L, Fisher JA, et al. Vascular dysfunction in leukoaraiosis. Am J Neuroradiol. 2016;37:2258–2264. doi: 10.3174/ajnr.A4888 [DOI] [PMC free article] [PubMed] [Google Scholar]
- 13.Hoogduin JM, Hendrikse J, Conijn MMA, van der Graaf Y, Geerlings MI, Luijten PR. Microbleeds, lacunar infarcts, white matter lesions and cerebrovascular reactivity - a 7T study. Neuroimage. 2012;59:950–956. doi: 10.1016/j.neuroimage.2011.08.059 [DOI] [PubMed] [Google Scholar]
- 14.von Elm E, Altman DG, Egger M, Pocock SJ, Gøtzsche PC, Vandenbroucke JP; STROBE Initiative. Strengthening the Reporting of Observational Studies in Epidemiology (STROBE) statement: guidelines for reporting observational studies. BMJ. 2007;335:806–808. doi: 10.1136/bmj.39335.541782.AD [DOI] [PMC free article] [PubMed] [Google Scholar]
- 15.Clancy U, Garcia DJ, Stringer MS, Thrippleton MJ, Valdés-Hernández MC, Wiseman S, Hamilton OK, Chappell FM, Brown R, Blair GW, et al. Rationale and design of a longitudinal study of cerebral small vessel diseases, clinical and imaging outcomes in patients presenting with mild ischaemic stroke: Mild Stroke Study 3. Eur Stroke J. 2020;6:81–88. doi: 10.1177/2396987320929617 [DOI] [PMC free article] [PubMed] [Google Scholar]
- 16.Sleight E. Optimisation, evaluation and application of cerebrovascular reactivity measurement using magnetic resonance imaging in patients with cerebral small vessel disease. 2023. https://era.ed.ac.uk/handle/1842/40797
- 17.van Swieten JC, Koudstaal PJ, Visser MC, Schouten HJ, van Gijn J. Interobserver agreement for the assessment of handicap in stroke patients. Stroke. 1988;19:604–607. doi: 10.1161/01.str.19.5.604 [DOI] [PubMed] [Google Scholar]
- 18.Sleight E, Stringer MS, Mitchell I, Murphy M, Marshall I, Wardlaw JM, Thrippleton MJ. Cerebrovascular reactivity measurements using 3T BOLD MRI and a fixed inhaled CO2 gas challenge: repeatability and impact of processing strategy. Front Physiol. 2023;14:1070233. doi: 10.3389/fphys.2023.1070233 [DOI] [PMC free article] [PubMed] [Google Scholar]
- 19.Potter GM, Chappell FM, Morris Z, Wardlaw JM. Cerebral perivascular spaces visible on magnetic resonance imaging: development of a qualitative rating scale and its observer reliability. Cerebrovasc Dis. 2015;39:224–231. doi: 10.1159/000375153 [DOI] [PMC free article] [PubMed] [Google Scholar]
- 20.Farrell C, Chappell F, Armitage PA, Keston P, Maclullich A, Shenkin S, Wardlaw JM. Development and initial testing of normal reference MR images for the brain at ages 65-70 and 75-80 years. Eur Radiol. 2009;19:177–183. doi: 10.1007/s00330-008-1119-2 [DOI] [PubMed] [Google Scholar]
- 21.Staals J, Makin SDJ, Doubal FN, Dennis MS, Wardlaw JM. Stroke subtype, vascular risk factors, and total MRI brain small-vessel disease burden. Neurology. 2014;83:1228–1234. doi: 10.1212/WNL.0000000000000837 [DOI] [PMC free article] [PubMed] [Google Scholar]
- 22.Jenkinson M, Smith S. A global optimisation method for robust affine registration of brain images. Med Image Anal. 2001;5:143–156. doi: 10.1016/s1361-8415(01)00036-6 [DOI] [PubMed] [Google Scholar]
- 23.Jenkinson M, Bannister P, Brady M, Smith S. Improved optimization for the robust and accurate linear registration and motion correction of brain images. Neuroimage. 2002;17:825–841. doi: 10.1016/s1053-8119(02)91132-8 [DOI] [PubMed] [Google Scholar]
- 24.Valdés Hernández MC, Ferguson KJ, Chappell FM, Wardlaw JM. New multispectral MRI data fusion technique for white matter lesion segmentation: method and comparison with thresholding in FLAIR images. Eur Radiol. 2010;20:1684–1691. doi: 10.1007/s00330-010-1718-6 [DOI] [PMC free article] [PubMed] [Google Scholar]
- 25.Ballerini L, Lovreglio R, Valdés Hernández MC, Ramirez J, MacIntosh BJ, Black SE, Wardlaw JM. Perivascular spaces segmentation in brain MRI using optimal 3D filtering. Sci Rep. 2018;8:2132. doi: 10.1038/s41598-018-19781-5 [DOI] [PMC free article] [PubMed] [Google Scholar]
- 26.Ballerini L, Booth T, Valdés Hernández MC, Wiseman S, Lovreglio R, Muñoz Maniega S, Morris Z, Pattie A, Corley J, Gow A, et al. Computational quantification of brain perivascular space morphologies: associations with vascular risk factors and white matter hyperintensities a study in the Lothian Birth Cohort 1936. NeuroImage Clin. 2020;25:102120. doi: 10.1016/j.nicl.2019.102120 [DOI] [PMC free article] [PubMed] [Google Scholar]
- 27.Fischl B, Salat DH, Busa E, Albert M, Dieterich M, Haselgrove C, van der Kouwe A, Killiany R, Kennedy D, Klaveness S, et al. Whole brain segmentation: automated labeling of neuroanatomical structures in the human brain. Neuron. 2002;33:341–355. doi: 10.1016/s0896-6273(02)00569-x [DOI] [PubMed] [Google Scholar]
- 28.Fischl B, Salat DH, van der Kouwe AJW, Makris N, Ségonne F, Quinn BT, Dale AM. Sequence-independent segmentation of magnetic resonance images. Neuroimage. 2004;23:S69–S84. doi: 10.1016/j.neuroimage.2004.07.016 [DOI] [PubMed] [Google Scholar]
- 29.Zhang Y, Brady M, Smith S. Segmentation of brain MR images through a hidden Markov random field model and the expectation-maximization algorithm. IEEE Trans Med Imaging. 2001;20:45–57. doi: 10.1109/42.906424 [DOI] [PubMed] [Google Scholar]
- 30.van Leijsen EMC, van Uden IWM, Ghafoorian M, Bergkamp MI, Lohner V, Kooijmans ECM, van der Holst HM, Tuladhar AM, Norris DG, van Dijk EJ, et al. Nonlinear temporal dynamics of cerebral small vessel disease: the RUN DMC study. Neurology. 2017;89:1569–1577. doi: 10.1212/WNL.0000000000004490 [DOI] [PMC free article] [PubMed] [Google Scholar]
- 31.Sam K, Conklin J, Poublanc J, Crawley AP, Sobczyk O, Mandell DM, Mikulis DJ, Venkatraghavan L, Duffin J, Fisher JA, et al. Development of white matter hyperintensity is preceded by reduced cerebrovascular reactivity. Ann Neurol. 2016;80:277–285. doi: 10.1002/ana.24712 [DOI] [PubMed] [Google Scholar]
- 32.Uh J, Yezhuvath U, Cheng Y, Lu H. In vivo vascular hallmarks of diffuse leukoaraiosis. J Magn Reson Imaging. 2010;32:184–190. doi: 10.1002/jmri.22209 [DOI] [PMC free article] [PubMed] [Google Scholar]
- 33.Sam K, Conklin J, Sobczyk O, Poublanc J, Crawley AP, Mandell DM, Mikulis DJ, Venkatraghavan L, Duffin J, Fisher JA, et al. Cerebrovascular reactivity and white matter integrity. Neurology. 2016;87:2333–2339. doi: 10.1212/WNL.0000000000003373 [DOI] [PMC free article] [PubMed] [Google Scholar]
- 34.Sam K, Conklin J, Holmes KR, Sobczyk O, Poublanc J, Crawley AP, Mandell DM, Venkatraghavan L, Duffin J, Fisher JA, et al. Impaired dynamic cerebrovascular response to hypercapnia predicts development of white matter hyperintensities. NeuroImage Clin. 2016;11:796–801. doi: 10.1016/j.nicl.2016.05.008 [DOI] [PMC free article] [PubMed] [Google Scholar]
- 35.Yezhuvath US, Uh J, Cheng Y, Martin-Cook K, Weiner M, Diaz-Arrastia R, van Osch M, Lu H. Forebrain-dominant deficit in cerebrovascular reactivity in Alzheimer’s disease. Neurobiol Aging. 2012;33:75–82. doi: 10.1016/j.neurobiolaging.2010.02.005 [DOI] [PMC free article] [PubMed] [Google Scholar]
- 36.Wardlaw JM, Benveniste H, Nedergaard M, Zlokovic BV, Mestre H, Lee H, Doubal FN, Brown R, Ramirez J, MacIntosh BJ, et al. ; colleagues from the Fondation Leducq Transatlantic Network of Excellence on the Role of the Perivascular Space in Cerebral Small Vessel Disease. Perivascular spaces in the brain: anatomy, physiology and pathology. Nat Rev Neurol. 2020;16:137–153. doi: 10.1038/s41582-020-0312-z [DOI] [PubMed] [Google Scholar]
- 37.Kapoor A, Yew B, Jang JY, Dutt S, Li Y, Alitin JPM, Gaubert A, Ho JK, Blanken AE, Sible IJ, et al. Older adults with perivascular spaces exhibit cerebrovascular reactivity deficits. Neuroimage. 2022;264:119746. doi: 10.1016/j.neuroimage.2022.119746 [DOI] [PMC free article] [PubMed] [Google Scholar]
- 38.Shi Y, Thrippleton MJ, Blair GW, Dickie DA, Marshall I, Hamilton I, Doubal FN, Chappell F, Wardlaw JM. Small vessel disease is associated with altered cerebrovascular pulsatility but not resting cerebral blood flow. J Cereb Blood Flow Metab. 2020;40:85–99. doi: 10.1177/0271678X18803956 [DOI] [PMC free article] [PubMed] [Google Scholar]
- 39.Brown R, Benveniste H, Black SE, Charpak S, Dichgans M, Joutel A, Nedergaard M, Smith KJ, Zlokovic BV, Wardlaw JM. Understanding the role of the perivascular space in cerebral small vessel disease. Cardiovasc Res. 2018;114:1462–1473. doi: 10.1093/cvr/cvy113 [DOI] [PMC free article] [PubMed] [Google Scholar]
- 40.Cantin S, Villien M, Moreaud O, Tropres I, Keignart S, Chipon E, Le Bas J-F, Warnking J, Krainik A. Impaired cerebral vasoreactivity to CO2 in Alzheimer’s disease using BOLD fMRI. Neuroimage. 2011;58:579–587. doi: 10.1016/j.neuroimage.2011.06.070 [DOI] [PubMed] [Google Scholar]
- 41.Jiménez-Sánchez L, Hamilton OKL, Clancy U, Backhouse EV, Stewart CR, Stringer MS, Doubal FN, Wardlaw JM. Sex differences in cerebral small vessel disease: a systematic review and meta-analysis. Front Neurol. 2021;12:756887. doi: 10.3389/fneur.2021.756887 [DOI] [PMC free article] [PubMed] [Google Scholar]
- 42.Tombaugh TN. Trail making test A and B: normative data stratified by age and education. Arch Clin Neuropsychol. 2004;19:203–214. doi: 10.1016/S0887-6177(03)00039-8 [DOI] [PubMed] [Google Scholar]
Associated Data
This section collects any data citations, data availability statements, or supplementary materials included in this article.