Abstract
Carotid atherosclerosis (AS) occurs in atherosclerotic lesions of the carotid artery, which can lead to transient ischemic attack and stroke in severe cases. However, the relationship between pleckstrin (PLEK) and lymphocyte antigen 86 (LY86) and carotid AS remains unclear. The carotid AS datasets GSE43292 and GSE125771 were downloaded from the gene expression omnibus database. Differentially expressed genes (DEGs) were screened and weighted gene co-expression network analysis was performed. Construction and analysis of protein-protein interaction network. Functional enrichment analysis, gene set enrichment analysis and comparative toxicogenomics database analysis were performed. TargetScan screened miRNAs that regulated central DEGs. A total of 305 DEGs were identified. According to gene ontology analysis, they were mainly enriched in immune system processes, extracellular regions and cytokine binding. Kyoto encyclopedia of genes and genomes analysis showed that the target cells were mainly enriched in Rap1 signal pathway, B cell receptor signal pathway and PPAR signal pathway. In the enrichment project of metascape, the reaction to bacteria, cell activation and chemotaxis can be seen in the enrichment project of gene ontology. Total 10 core genes (TYROBP, FCER1G, PLEK, LY86, IL10RA, ITGB2, LCP2, FCGR2B, CD86, CCR1) were obtained by protein-protein interaction network construction and analysis. Core genes (PLEK, LY86, IL10RA, ITGB2, and LCP2) were highly expressed in carotid AS samples and lowly expressed in normal samples. Comparative toxicogenomics database analysis showed that 5 genes were associated with pneumonia, inflammation, necrosis, and drug allergy. PLEK and LY86 genes are highly expressed in carotid AS. The higher the expression of PLEK and LY86, the worse the prognosis is.
Keywords: carotid atherosclerosis, LY86, PLEK
1. Introduction
In recent years, cardiovascular disease (CVD) has become one of the deadliest diseases in many countries in the world.[1] According to the 2015 Global Disease, injury and risk Factor burden study, an estimated 422.7 million people worldwide were affected by CVD in 2015, causing about 17.9 million deaths, accounting for 31% of global deaths, which poses a huge burden worldwide.[2] Atherosclerosis (AS) is a systemic disease that involves large arteries leading to stenosis and formation of atherosclerotic plaques. CVD caused by AS, such as stroke and coronary heart disease, is the main cause of death and disability in human beings.[3] AS is the main pathological process of most CVDs, which can start in the early stage of life, latent and asymptomatic for a long time, and then develop to the late stage.[4,5] Carotid AS is the early manifestation of systemic AS. According to the 2016 European guidelines for Cardiovascular Disease Prevention, carotid intima-media thickness ≥1.0 mm is generally considered abnormal. In 2020, the global prevalence of increased intima-media thickness of the carotid artery is estimated at 27.6% (95%CI: 16.9–41.3) and carotid stenosis is estimated at 1.5% (1.1%–2.1%) among people aged 30 to 79.[6,7] The increase of intima-media thickness of carotid artery, the prevalence of carotid plaque and carotid artery stenosis increased with the increase of age, and the prevalence rate of male was higher than that of female. At present, smoking, diabetes and hypertension are common risk factors for carotid intima-media thickness and increased carotid plaque.[8] Due to the complexity of the pathogenesis of carotid AS, the cause of carotid AS is not clear. The disease may be related to genetic factors, chromosome abnormalities, gene fusion and other factors. Therefore, in-depth study of the molecular mechanism of carotid AS is particularly important.
As an important part of the development of life science, bioinformatics has been at the forefront of life science and technology research. In recent years, China biotechnology has developed by leaps and bounds, and bioinformation resources have also grown explosively. Bioinformatics reveals the biological significance represented by big data, which is a bridge between data and clinic. Represented by the analysis and reporting of gene detection data, bioinformatics plays an important role in the treatment of tumors and CVDs.[9,10]
Pleckstrin (PLEK), also known as p47-phosphoprotein, is involved as a substrate for PKC in platelets and leukocytes. PLEK is the protein that is altered in both platelet activation and inhibition, with no significant overlap in the affected proteome.[11] PLEK has been implicated in a variety of autoimmune and inflammatory diseases. Lymphocyte antigen 86 (LY86) is a protein-coding gene involved in apoptosis and apoptosis, inflammatory response, humoral immune response, and signal transduction.[12] LY86-related diseases include parametritis and interstitial emphysema, and the associated pathways include activated TLR4 signaling pathway and innate immune system. LY86 may cooperate with CD180 and TLR4 to mediate innate immune responses to bacterial lipopolysaccharide (LPS) and cytokines.
However, the relationship between PLEK, LY86 genes and carotid AS is not clear. Therefore, this paper intends to use bioinformatics technology to mine the core genes between carotid AS and normal tissue, and carry out enrichment analysis and pathway analysis. The public dataset was used to verify the significant role of PLEK and LY86 genes in carotid AS.
2. Method
2.1. Carotid AS data set
In this study, the carotid AS dataset GSE43292 and GSE125771 configuration files were downloaded from the gene expression omnibus database (http://www.ncbi.nlm.nih.gov/geo/) generated by GPL6244 and GPL17586. GSE43292 includes 32 carotid AS and 32 normal samples, and GSE125771 includes 40 carotid AS samples[13] to identify differentially expressed genes (DEGs) of carotid AS.
2.2. De-batch processing
For merging and debatching of multiple datasets, we first use R software package to merge datasets GSE43292 and GSE125771. For the combination of multiple data sets, we first use the R software package in Silico Merging [DOD:10.1186/1471-2105-13335] to merge the data sets to get the merging matrix. Furthermore, we use the remove Batch Effect function of the R software package limma (version3.42.2,) to remove the batch effect, and finally obtain the matrix after removing the batch effect, and apply it to the follow-up analysis.
2.3. Screening of differentially expressed genes (DEGs)
R package “limma” is used for probe aggregation and background correction of the merge matrix of GSE43292 and GSE125771. The Benjamini–Hochberg method is used to adjust the original P value. The multiple change (FC) is calculated using the error detection rate (FDR). The cutoff value of DEG is P < .05 and FC is >1.5. And make a visual representation of the volcano.
2.4. Weighted gene co-expression network analysis (WGCNA)
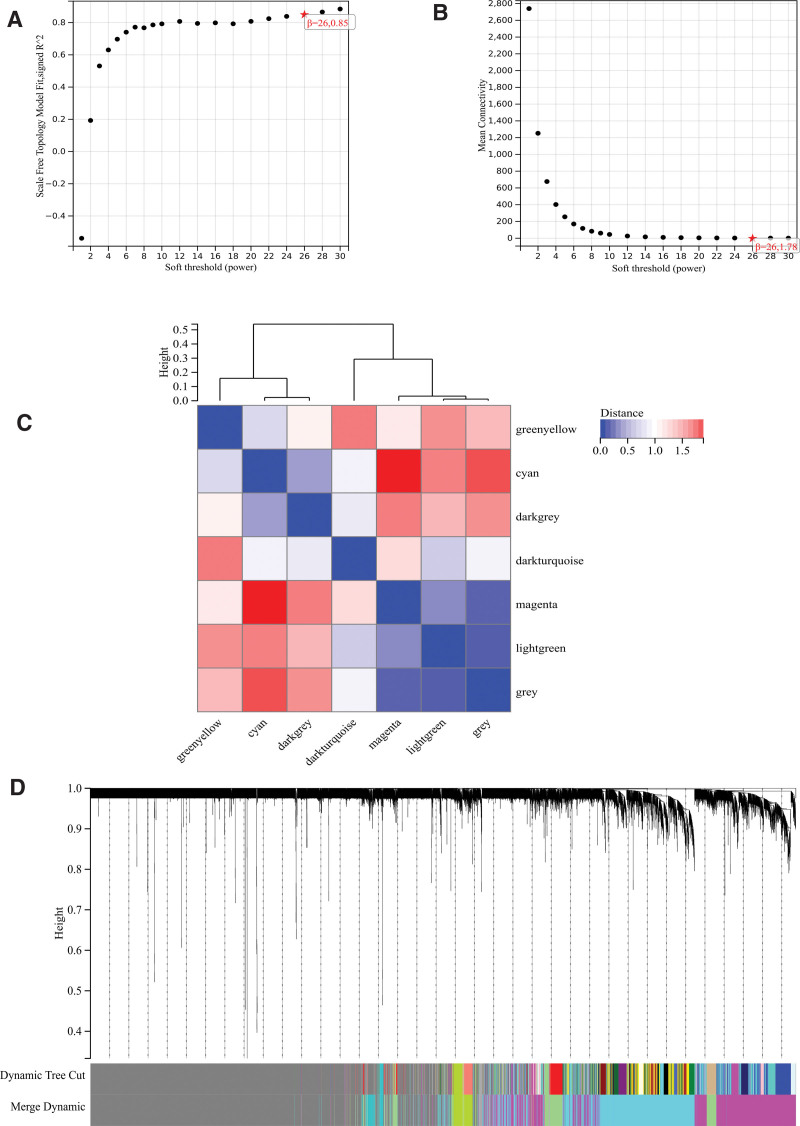
First of all, we use the de-batch and post-merge matrix of GSE43292 and GSE125771 to calculate the median absolute deviation of each gene, eliminate the first 50% of the genes with the smallest median absolute deviation, use the good Samples Genes method of R package WGCNA to remove the outlier genes and samples, and then use WGCNA to construct scale-free co-expression network. Specifically, we first apply Pearson correlation matrix and average linkage method to all paired genes. Then the weighted adjacency matrix is constructed by using the power function Abelimn =|C_mn| ^ β (correlation between Pearson Gene_m and Gene_n). Abelimn = the adjacency between gene m and gene n. β is a soft threshold parameter, which can emphasize the strong correlation between genes and weaken the weak correlation. After selecting the power of 26, the adjacency is transformed into a topological overlap matrix (TOM). The network connectivity of genes defined as the sum of their adjacency with all other genes can be measured and the corresponding 1-TOM can be calculated. In order to classify the genes with similar expression profiles into gene modules, the average linkage hierarchical clustering is carried out according to the dissimilarity measure based on TOM, and the minimum size (genome) of the gene tree is 30. The sensitivity is set to: 3. In order to further analyze the module, we calculate the difference of the feature genes of the module, select a cut line for the module tree view and merge some modules. In addition, we also merged the modules with a distance <0.25, and finally obtained 7 co-expression modules. It is worth noting that the gray module is considered to be a set of genes that cannot be assigned to any module.
2.5. Construction and analysis of protein-protein interaction (PPI) Network
The search tool for the retrieval of interacting genes (STRING) database (http://stringmurdb.Org/) aims to collect, score and integrate all publicly available sources of PPI information, and to supplement these sources by calculating predictions. In this study, the list of differential genes was input into STRING database to construct a PPI network for predicting core genes (confidence >0.4). Cytoscape software can provide biologists with biological network analysis and two-dimensional (2D) visualization. In this study, the PPI network formed by string database is visualized and core genes are predicted by Cytoscape software. First of all, we import the PPI network into the cytoscape software, find the module with the best correlation through MCODE, and calculate the ten genes with the best correlation through 2 algorithms (Maximal Clique Centrality and Maximum Neighborhood Component). After visualization, we derive the list of core genes.
2.6. Functional enrichment analysis
Gene ontology (GO) analysis and Kyoto encyclopedia of genes and genomes (KEGG) analysis are computational methods for evaluating the function and biological pathways of genetics. In this study, the list of differential genes screened by Wayne map was input into KEGG rest API (https://www.kegg.jp/kegg/rest/keggapi.html) obtained the latest KEGG Pathway gene annotation, which was used as the background, the genes were mapped to the background set, and the R software package cluster Profiler (version 3.14.3) was used for enrichment analysis to obtain the results of gene set enrichment. The GO annotation of genes in R software package org.Hs.e.g.db (version 3.1.0) was also used as a background to map genes into the background set. The minimum gene set was set to 5, and the maximum gene set was set to 5000 value of <0.05 and a FDR of <0.25. It was considered to be a statistically significant measure.
In addition, Metascape database can provide comprehensive gene list annotation and analysis resources, and can be visually exported. We used Metascape (http://metascape.org/gp/index.html) database to analyze the functional enrichment of the above differential gene list and derive it.
2.7. Gene set enrichment analysis (GSEA)
For GSEA, we obtained the GSEA software (version3.0) from GSEA (DOI:10.1073/pnas.0506580102, http://software.broadinstitute.org/gsea/index.jsp). The samples were divided into 2 groups according to carotid AS and normal samples, and from Molecular Signatures Database (DOI:10.1093/bioinformatics/btr260) downloaded the c2.cp.kegg.v7.4.symbols.gmt subset. In order to evaluate the related pathways and molecular mechanisms, based on gene expression profile and phenotypic grouping, the minimum gene set is 5, the maximum gene set is 5000, and a thousand resampling times, P value of <.05 and a FDR of <0.25 is considered to be statistically significant. The whole genome was analyzed by GO and KEGG. Developed by GSEA.
2.8. Gene expression heat map
We use R-packet heatmap to map the expression of core genes found by 2 algorithms in PPI network in GSE43292 and GSE125771, and to visualize the difference of core gene expression between carotid AS and normal samples.
2.9. Comparative toxicogenomics database (CTD) analysis
CTD database integrates a large number of chemical substances, genes, functional phenotypes and disease interaction data, which provides great convenience for the study of disease-related environmental exposure factors and drug potential mechanism. We input the core gene into the CTD website, find the disease most related to the core gene, and use Excel to draw the radar map of the differential expression of each gene.
2.10. miRNA
TargetScan (www.targetscan.org) is an online database for predicting and analyzing miRNA and target genes. In our study, TargetScan was used to screen the miRNA that regulates central DEG.
3. Results
3.1. Analysis of differentially expressed genes
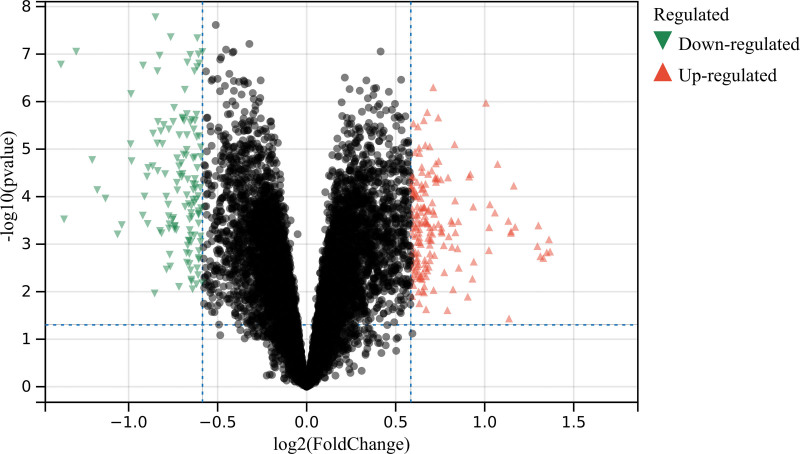
In this study, according to the set cutoff value and the de batching merge matrix of GSE43292 and GSE125771, a total of 305 DEGs were identified (Fig. 1).
Figure 1.
Analysis of differentially expressed genes. A total of 305 differentially expressed genes (DEGs).
3.2. Functional enrichment analysis
3.2.1. Functional enrichment analysis of DEGs.
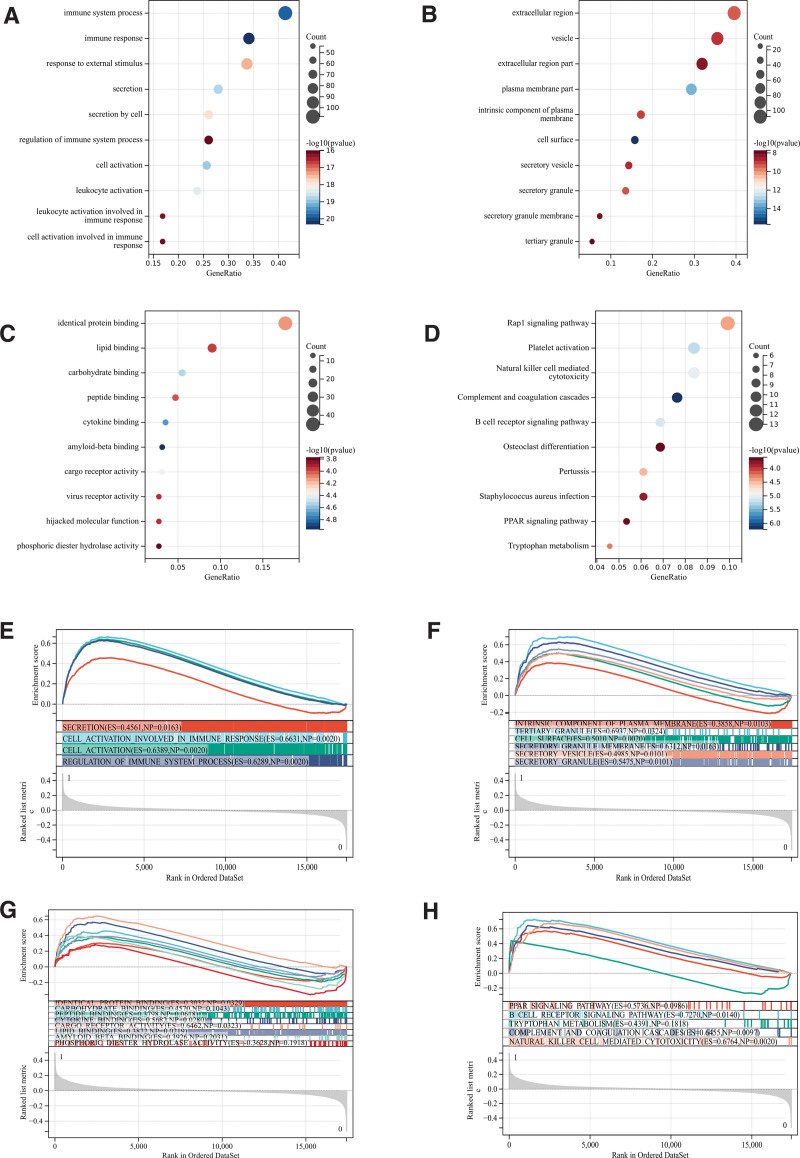
We analyzed these differentially expressed genes by GO and KEGG. According to GO analysis, they were mainly enriched in immune system processes, extracellular regions and cytokine binding (Fig. 2A–C).
Figure 2.
Functional enrichment analysis. (A–D) DEGs. (E–H) GSEA. DEGs = differentially expressed genes, GSEA = gene set enrichment analysis.
KEGG analysis showed that the target cells were mainly enriched in Rap1 signal pathway, B cell receptor signal pathway and PPAR signal pathway (Fig. 2D).
3.3. GSEA
In addition, we carried out GSEA enrichment analysis of the whole genome in order to find out the possible enrichment items in non-differentially expressed genes and verify the results of differentially expressed genes. The intersection of enrichment and GO KEGG enrichment of differentially expressed genes is shown in the figure, which is mainly concentrated in PPAR signal pathway, B cell receptor signal pathway and cell activation (Fig. 2E–H).
3.4. Metascape enrichment analysis
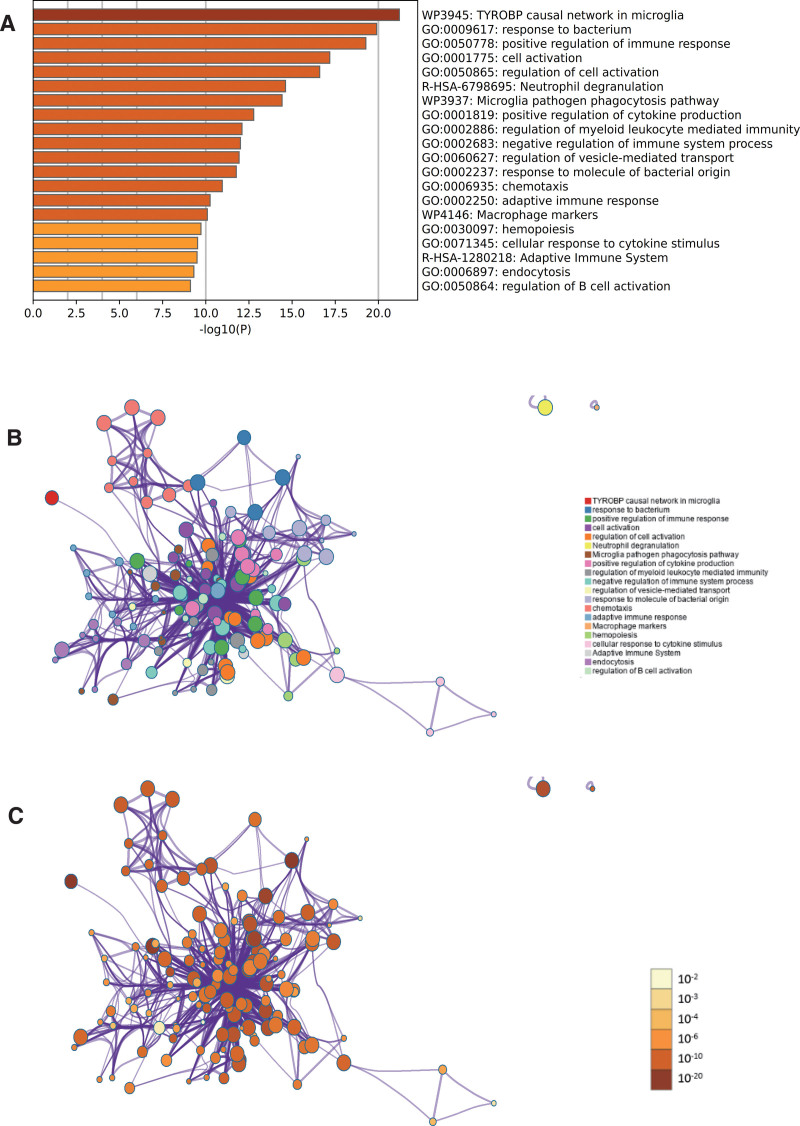
In the enrichment project of metascape, the reaction to bacteria, cell activation and chemotaxis can be seen in the enrichment project of GO (Fig. 3A). At the same time, we also output the enrichment network colored by enrichment term and P value (Figs. 3B, C and 4), which visually shows the correlation and confidence of each enrichment project.
Figure 3.
Metascape enrichment analysis. (A) The reaction to bacteria, cell activation and chemotaxis can be seen in the enrichment project of gene ontology (GO). (B) The enrichment network colored by enrichment term. (C) The enrichment network colored by P value.
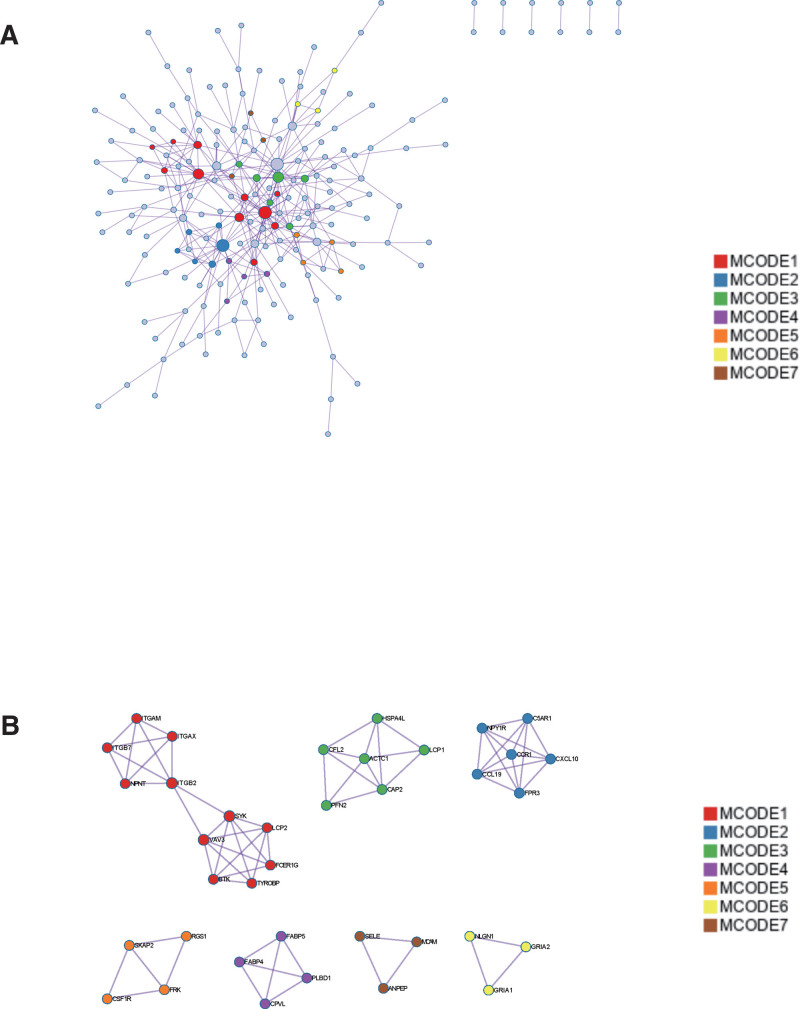
Figure 4.
Metascape enrichment analysis. 7 modules.
3.5. WGCNA
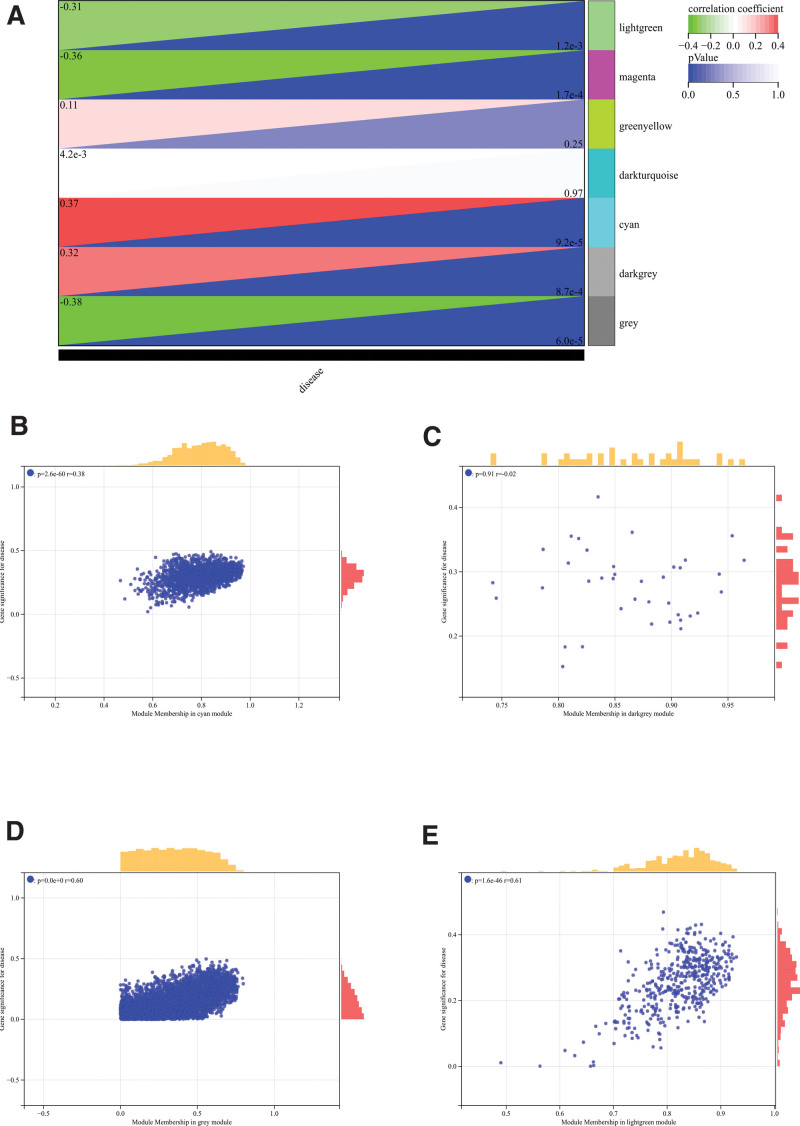
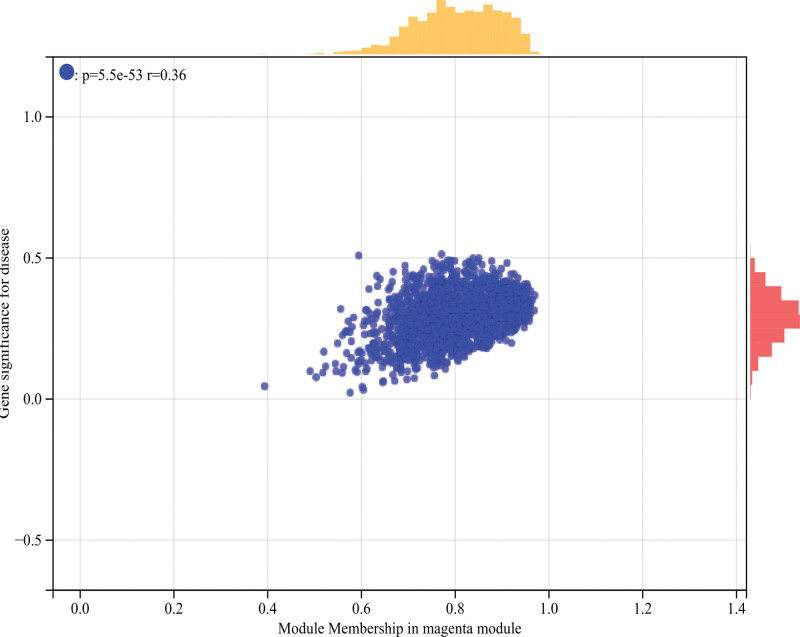
The selection of soft threshold power is an important step in WGCNA analysis. The network topology is analyzed to determine the soft threshold power. The soft threshold power in WGCNA analysis is set to 26 (Fig. 5A and B). A hierarchical clustering tree of all genes is constructed, important modules are generated, and then the interaction between these modules is analyzed (Fig. 5C and D). The module-phenotypic correlation heat map (Fig. 6A) and the GS-MM correlation scatter map of related hub genes were generated (Figs. 6B–E and 7).
Figure 5.
WGCNA. (A) β = 26,0.86. (B) β = 26,1.78. (C) The hierarchical clustering tree of all genes was constructed, important modules were generated. (D) The interaction between these modules. WGCNA = weighted gene co-expression network analysis.
Figure 6.
WGCNA. (A) The module-phenotypic correlation heat map. (B–E) The GS-MM correlation scatter map of related hub genes. WGCNA = weighted gene co-expression network analysis.
Figure 7.
WGCNA. GS-MM correlation scatter map of related hub genes. P = 5.5e-53, R = 0.36. WGCNA = weighted gene co-expression network analysis.
We calculated the correlation between module feature vectors and gene expression to obtain MM. Based on the cutoff criteria (| MM | > 0.8), 2100 genes with high connectivity in clinically significant modules were identified as hub genes.
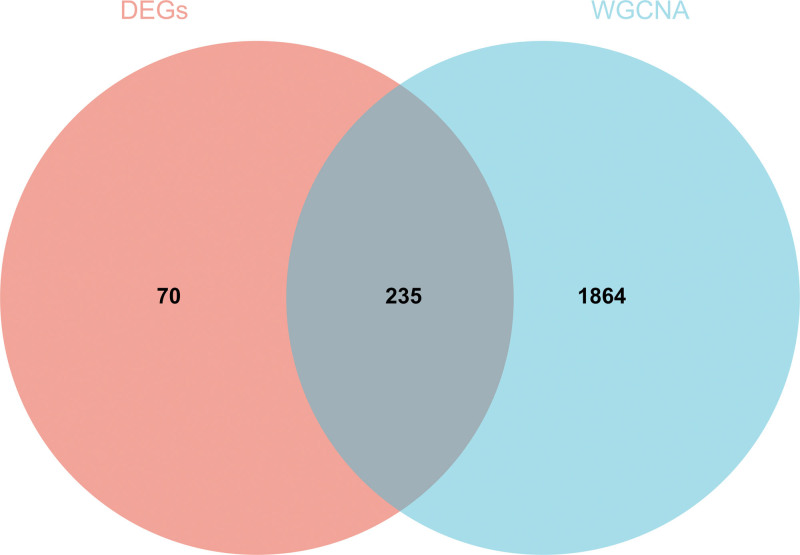
We also draw the Wayne diagram of the differential genes screened by WGCNA and DEGs and take the intersection to create and analyze the PPI network. The results are shown in Figure 8.
Figure 8.
WGCNA. The Wayne diagram of the differential genes screened by WGCNA and DEGs and take the intersection to create and analyze the protein-protein interaction network. DEGs = differentially expressed genes, WGCNA = weighted gene co-expression network analysis.
3.6. Construction and analysis of PPI Network
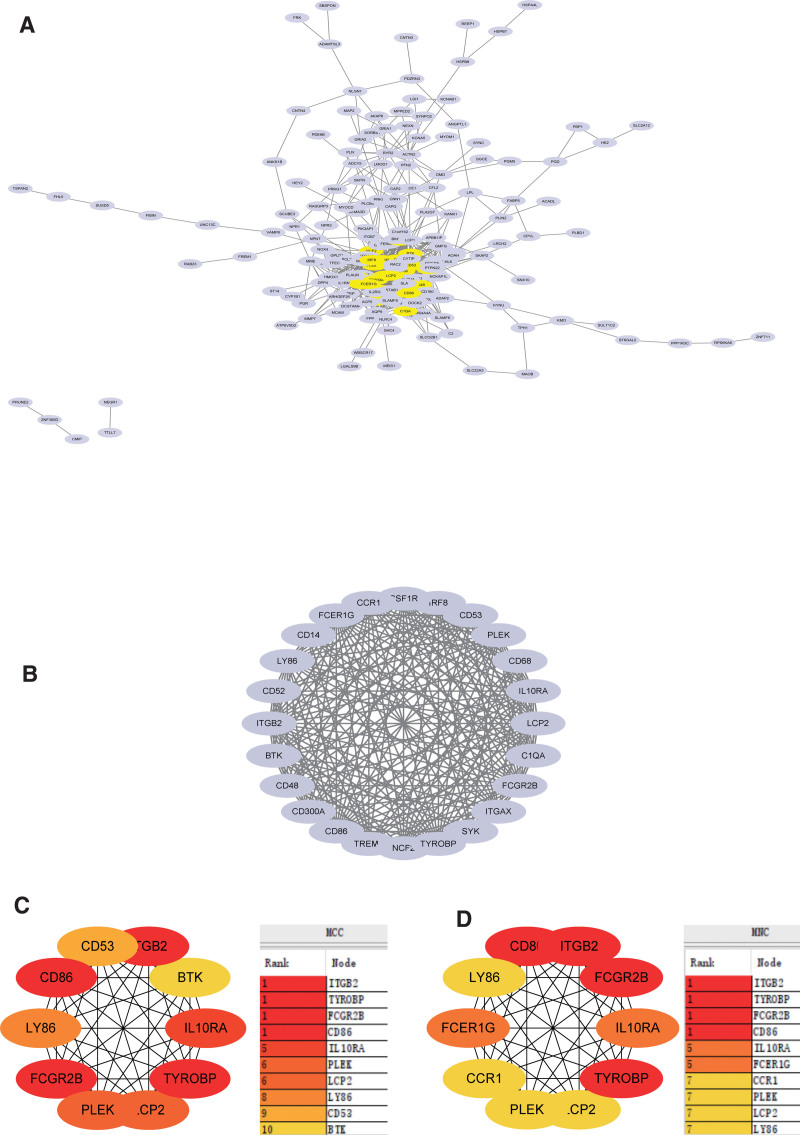
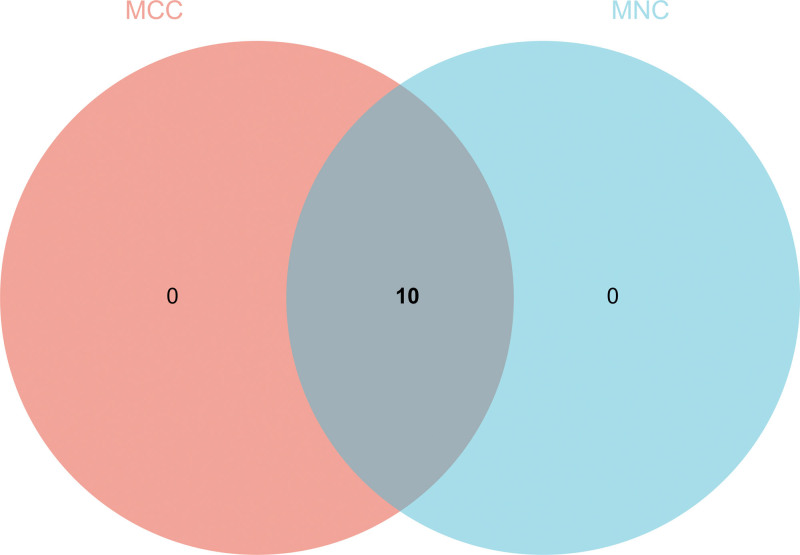
DEGs PPI network was constructed from STRING online database and analyzed by Cytoscape software (Fig. 9A). The core gene cluster (Fig. 9B) was obtained. Two different algorithms were used to identify central genes (Fig. 9C and D), and Wayne diagram was used to obtain the intersection (Fig. 10). Ten core genes (TYROBP, FCER1G, PLEK, LY86, IL10RA, ITGB2, LCP2, FCGR2B, CD86, CCR1) were obtained.
Figure 9.
Construction and analysis of protein-protein interaction (PPI) Network. (A) DEGs PPI network was constructed from STRING online database and analyzed by Cytoscape software. (B) The core gene cluster. (C) MCC was used to identify central genes (D) MNC was used to identify central genes. DEGs = differentially expressed genes, MCC = Maximal Clique Centrality, MNC = Maximum Neighborhood Component, STRING = search tool for the retrieval of interacting genes.
Figure 10.
Construction and analysis of protein-protein interaction (PPI) Network. Wayne diagram was used to obtain the intersection.
At the same time, we also use the metascape website to output the protein interaction network, and identify the core module to verify the PPI network results in string. Among them, TYROBP, FCER1G, ITGB2, LCP2, and CCR1 genes were identified as core genes.
3.7. Gene expression heat map
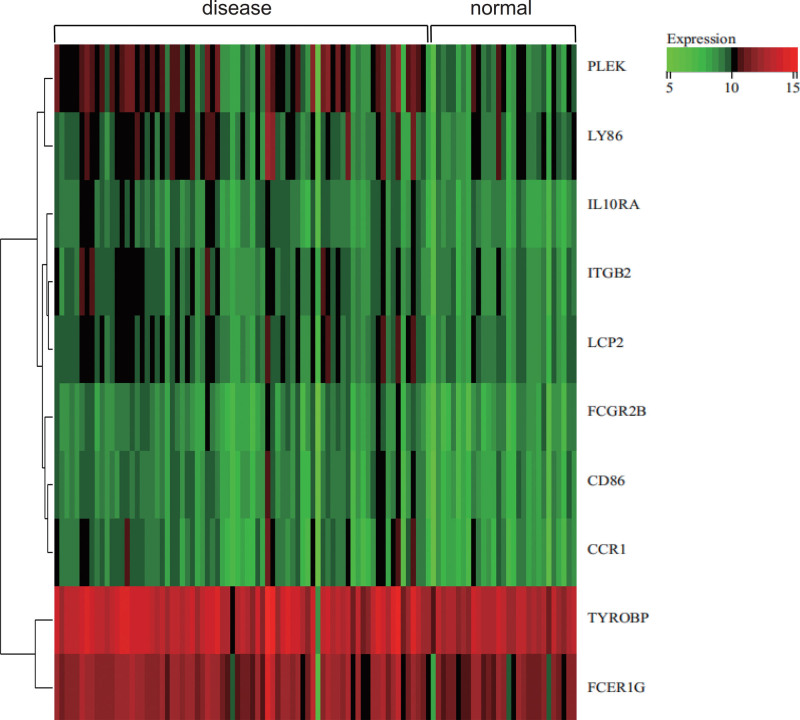
We visualized the heat map of the expression of core genes in the samples (Fig. 11). It was found that core genes (TYROBP, FCER1G) were highly expressed in both carotid atherosclerotic samples and normal samples. Core genes (PLEK, LY86, IL10RA, ITGB2, LCP2) were highly expressed in carotid atherosclerotic samples and low expression in normal samples. Core genes (FCGR2B, CD86, CCR1) were low expressed in both carotid atherosclerotic samples and normal samples. It may play a regulatory role in carotid AS.
Figure 11.
Gene expression heat map. The heat map of the expression of core genes in the samples.
3.8. CTD analysis
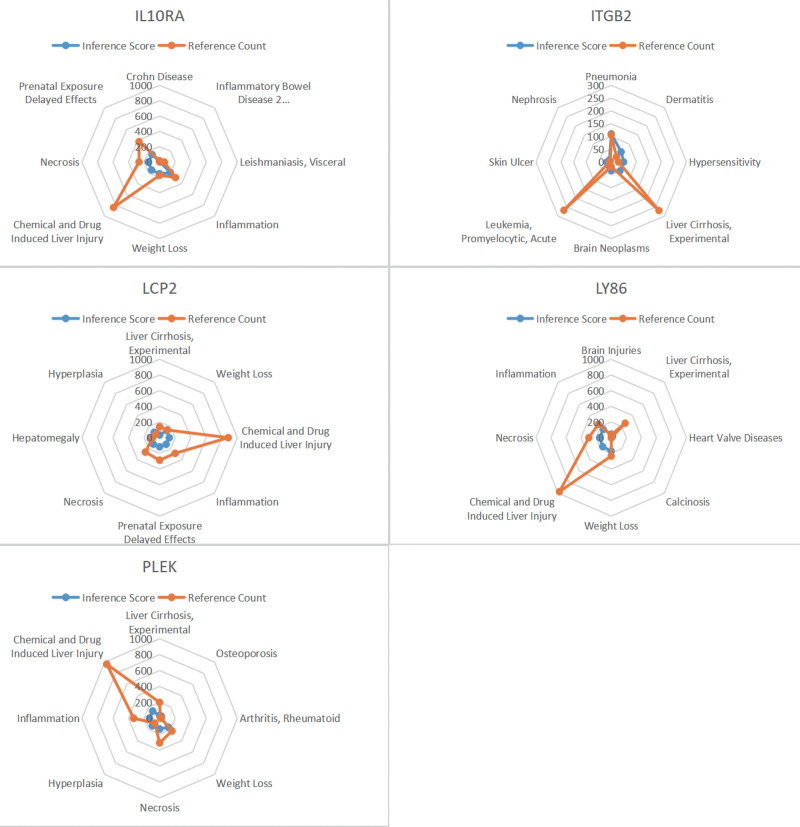
In this study, we entered a list of core genes into the CTD website to find diseases related to core genes, improving the understanding of the association between genes and diseases. Five genes (PLEK, LY86, IL10RA, ITGB2, LCP2) were found to be associated with pneumonia, inflammation, necrosis and drug hypersensitivity (Fig. 12).
Figure 12.
Comparative toxicogenomics database (CTD) analysis. Five genes (PLEK, LY86, IL10RA, ITGB2, LCP2) were found to be associated with pneumonia, inflammation, necrosis and drug hypersensitivity. LY86 = lymphocyte antigen 86.
3.9. miRNA prediction and functional annotation related to hub gene
In this study, we input the hub gene list into targetsacan to find the relevant miRNA to improve the understanding of gene expression regulation (Table 1). We found that the related miRNA of FCER1G gene is the related miRNA of hsa-miR-325-3pscape PLEK gene, the related miRNA of hsa-miR-4262, hsa-miR-181c-5p, hsa-miR-181d-5p;IL10RA gene, the related miRNA of hsa-miR-6838-5p, hsa-miR-4975p, hsa-miR-424-5ptransfer LCP2 gene, the related miRNA of hsa-miR-203a-3p.2;CD86 gene, the related miRNA of hsa-let-7i-5p, hsa-let-7e-5p, hsa-miR-4500. The related miRNA of CCR1 gene is hsa-miR-129-1-3p and hsa-miR-129-2-3p.
Table 1.
A summary of miRNAs that regulate hub genes.
| Gene | MIRNA | |||
|---|---|---|---|---|
| 1 | TYROBP | None | ||
| 2 | FCER1G | hsa-miR-325-3p | ||
| 3 | PLEK | hsa-miR-4262 | hsa-miR-181c-5p | hsa-miR-181d-5p |
| 4 | LY86 | None | ||
| 5 | IL10RA | hsa-miR-6838-5p | hsa-miR-497-5p | hsa-miR-424-5p |
| 6 | ITGB2 | None | ||
| 7 | LCP2 | hsa-miR-203a-3p.2 | ||
| 8 | FCGR2B | None | ||
| 9 | CD86 | hsa-let-7i-5p | hsa-let-7e-5p | hsa-miR-4500 |
| 10 | CCR1 | hsa-miR-129-1-3p | hsa-miR-129-2-3p | |
LY86 = lymphocyte antigen 86, PLEK = pleckstrin.
4. Discussion
The formation of atherosclerotic plaque is a sign of AS, and plaque rupture is the cause of ischemic cerebrovascular disease.[14,15] The prevalence of carotid AS and carotid plaque increases with age, and the prevalence of CAS and CP in males is higher than that in females. In 2010, 27.22% and 20.15% of Chinese people aged between 30 and 79 suffered from CAS and CP respectively, equivalent to 207.73 million and 153.82 million, respectively. As the population ages, the number of people affected by CAS and CP will increase to 267.25 million and 199.83 million respectively by 2020.[4,16] Therefore, in-depth exploration of the molecular mechanism of carotid AS is very important for the study of targeted drugs. The main result of this study is that PLEK and LY86 genes are highly expressed in carotid AS. The higher the PLEK and LY86 genes are, the worse the prognosis.
PLEK gene is expressed to produce PLEK, which is a 47-kDa protein, mainly located in the cytoplasm, but can be translocated to the cell membrane in the form of phosphorylation or non-phosphorylation.[17] PLEK was first found in platelets. As the substrate of protein kinase C (PKC), it participates in cytoskeleton recombination and promotes intercellular adhesion and migration.[18] PKC enzyme plays an important role in mitogen-activated protein kinase pathway, including kinase phosphorylation involved in JNK and p38 α (mitogen-activated protein kinase 14) signal transduction pathways.[19] In addition, PKC enzyme is also involved in the phosphorylation of kinase, leading to the downstream activation of nuclear factor κ β (NF- κ β).[20] As far as we know, there are few reports on the role of PKC in regulating the level of PLEK in CP and the level of PLEK in other chronic inflammatory diseases. Anna Lundmark et al reported for the first time that PLEK is usually upregulated in periodontitis and chronic inflammatory CVD, inflammatory bowel disease ulcerative colitis and rheumatoid arthritis.[21] PLEK is an important intermediate in the secretion and activation of proinflammatory cytokines TNF α and IL-1 β.[22] In addition, studies have shown that LPS can induce PLEK expression in macrophages in response to bacterial stimulation.[23] PLEK was up-regulated in gingival fibroblasts stimulated by LPS. The up-regulation of PLEK by oral bacterial products combined with the activation of PKC pathway in response to MUC4 overexpression may contribute to the initiation and maintenance of chronic inflammation. These results are consistent with our current results, PLEK gene is highly expressed in carotid AS, the higher the PLEK gene, the worse the prognosis. However, at present, the mechanism of the association between PLEK and carotid AS and other diseases is not very clear, we speculate that this protein is involved in these chronic inflammatory diseases. Therefore, it is necessary to further clarify the functional correlation of the gene and its contribution to various chronic systemic diseases.
The protein encoded by LY86 gene is “LY86,” also known as protein MD-1. It is a secreted glycoprotein related to RP105 (TLR family proteins) and plays an important role in B cell surface expression of RP105.[24] RP105/MD-1 complex is expressed on immune cells, including B cells, macrophages and dendritic cells.[25] Mice lacking RP105 or MD-1 showed decreased LPS reactivity in B cells. On the other hand, the expression of RP105/MD-1 in dendritic cells and macrophages has been proved to be a negative regulator of TLR4/MD-2 in LPS response.[26] There is growing evidence that LY86 may be involved in the physiological regulation of innate immune system and inflammation. Recently, in a mouse model, Watanabe et al reported that MD-1 may lead to high fat, diet-induced obesity, adipose tissue inflammation and insulin resistance.[27] It is well known that RP105 is a member of the TLR family. There are 22 leucine-rich repeats in the extracellular domain, but there is no toll interleukin receptor domain in the cells. RP105 was first found on the surface of mouse B cells, which is related to the activation of B cells. It has the ability to promote cell proliferation and enhance B cell-dependent inflammatory processes. TLR4 binds closely to its junction molecule MD-2 to recognize bacterial LPS on the cell surface, which exists in circulating cells and cardiomyocytes. However, a large number of studies have shown that RP105-MD1 down-regulates endotoxin response through interaction with TLR4-MD2. In addition, recent studies have found that PI3K signaling pathway is closely related to RP105 in reducing cardiomyocyte apoptosis during myocardial ischemia-reperfusion injury (MI/RI), thus improving myocardial injury. So far, studies have found that MI/RI involves complex signal pathways. Recently, studies have found that RP105 can play a potential role in the treatment of CVDs through TLR4 and PI3K signaling pathways. As an indispensable auxiliary medium of RP105, the contribution of MD-1 and/ or RP105 in a variety of CVDs has been widely studied. For example, Xiong Xiaofu et al found that MD-1 inhibition accelerated atrial and cardiac remodeling induced by high fat.[28] In addition, MD-1 deficiency seems to aggravate myocardial inflammation induced by Imax R and increase myocardial susceptibility to ventricular arrhythmias.[29] These results are consistent with our current results, LY86 is highly expressed in carotid AS, but the mechanism of the relationship between PLEK and carotid AS and other diseases is not very clear. AS is characterized by leukocyte infiltration into the intima, causing local vascular inflammation, which plays an important role in the initiation, development and rupture of atherosclerotic mice. It has been confirmed that different kinds of leukocytes are related to the formation of atherosclerotic lesions, including macrophages, T cells, mast cells, B cells and so on. The function of TLR is related to macrophages or foam cells.[30] It has been proved that RP105 deficiency can increase neointimal formation by promoting the proliferation of smooth muscle cells.[31] RP105 regulates the function of B cells through the cell surface receptor TLR4, and the proliferation is inhibited in B cells with RP105 deficiency.[32] A recent paper showed that the expression of B cell activating factor (BAFF) increased in RP105-/- mice, indicating that the changes of pro-inflammatory B cells can reduce the formation of atherosclerotic lesions.[33] Based on the above findings, we speculate that LY86 gene may play an important role in the inflammatory process of carotid AS.
Although this paper has carried out rigorous bioinformatics analysis, there are still some shortcomings. In this study, no animal experiments of gene overexpression or knockout were carried out to further verify its function. Therefore, in the future research, we should make an in-depth exploration in this aspect.
5. Conclusions
To sum up, PLEK and LY86 are highly expressed in patients with carotid AS, and may play a significant role in the development of carotid AS through inflammation and cellular structure. PLEK and LY86 may serve as molecular targets for early diagnosis and accurate treatment of carotid AS and provide a basis for the study of the mechanism of carotid AS.
Author contributions
Conceptualization: Man Zhao, Aixian Liu, Lei Chen.
Data curation: Linhong Mo, Taozhu Fu, Hongru Deng.
Formal analysis: Guiling Wan, Hongrun Chen, Hongru Deng.
Methodology: Fang Lu, Siwei Fu, Hongrun Chen, Taozhu Fu.
Software: Siwei Fu, Hongrun Chen.
Supervision: Man Zhao, Aixian Liu, Lei Chen.
Validation: Aixian Liu, Hongru Deng.
Writing – review & editing: Man Zhao, Aixian Liu, Lei Chen.
Writing – original draft: Aixian Liu, Taozhu Fu, Hongru Deng.
Abbreviations:
- AS
- atherosclerosis
- CTD
- comparative toxicogenomics database
- CVD
- cardiovascular disease
- DEGs
- differentially expressed genes
- FDR
- error detection rate
- GO
- gene ontology
- GSEA
- gene set enrichment analysis
- KEGG
- Kyoto encyclopedia of genes and genomes
- LPS
- lipopolysaccharide
- LY86
- lymphocyte antigen 86
- PKC
- protein kinase C
- PLEK
- pleckstrin
- PPI
- protein-protein interaction
- STRING
- search tool for the retrieval of interacting genes
- TOM
- topological overlap matrix
- WGCNA
- weighted gene co-expression network analysis
This study was approved by the Ethics Committee of the Fuxing Hospital Affiliated to Capital Medical University.
The authors have no funding and conflicts of interest to disclose.
The datasets generated during and/or analyzed during the current study are available from the corresponding author on reasonable request.
How to cite this article: Zhao M, Liu A, Mo L, Wan G, Lu F, Chen L, Fu S, Chen H, Fu T, Deng H. Higher expression of PLEK and LY86 as the potential biomarker of carotid atherosclerosis. Medicine 2023;102:42(e34445).
Contributor Information
Lei Chen, Email: sga2573@163.com.
Siwei Fu, Email: futaozhu731@sina.com.
Hongrun Chen, Email: sga2573@163.com.
Taozhu Fu, Email: futaozhu731@sina.com.
Hongru Deng, Email: denghongru2023@163.com.
References
- [1].Joh JH, Cho S. Cardiovascular risk of carotid atherosclerosis: global consensus beyond societal guidelines. Lancet Glob Health. 2020;8:e625–6. [DOI] [PubMed] [Google Scholar]
- [2].Mozaffarian D. Global scourge of cardiovascular disease: time for health care systems reform and precision population health. J Am Coll Cardiol. 2017;70:26–8. [DOI] [PubMed] [Google Scholar]
- [3].Libby P. The changing landscape of atherosclerosis. Nature. 2021;592:524–33. [DOI] [PubMed] [Google Scholar]
- [4].Song P, Xia W, Zhu Y, et al. Prevalence of carotid atherosclerosis and carotid plaque in Chinese adults: a systematic review and meta-regression analysis. Atherosclerosis. 2018;276:67–73. [DOI] [PubMed] [Google Scholar]
- [5].Chen FH, Liu T, Xu L, et al. Association of serum vitamin D level and carotid atherosclerosis: a systematic review and meta-analysis. J Ultrasound Med. 2018;37:1293–303. [DOI] [PubMed] [Google Scholar]
- [6].Song P, Fang Z, Wang H, et al. Global and regional prevalence, burden, and risk factors for carotid atherosclerosis: a systematic review, meta-analysis, and modelling study. Lancet Glob Health. 2020;8:e721–9. [DOI] [PubMed] [Google Scholar]
- [7].Kamtchum-Tatuene J. Epidemiology of carotid atherosclerosis in Africa: a blind spot. Lancet Glob Health. 2020;8:e996. [DOI] [PubMed] [Google Scholar]
- [8].Yu M, Zhang S, Wang L, et al. Metabolically healthy obesity and carotid plaque among steelworkers in North China: the role of inflammation. Nutrients. 2022;14:5123. [DOI] [PMC free article] [PubMed] [Google Scholar]
- [9].Goh J, Goh C, Lim QW, et al. Transcriptomics indicate nuclear division and cell adhesion not recapitulated in MCF7 and MCF10A compared to luminal A breast tumours. Sci Rep. 2022;12:20902. [DOI] [PMC free article] [PubMed] [Google Scholar]
- [10].Hartsough EJ, Weiss MB, Heilman SA, et al. CADM1 is a TWIST1-regulated suppressor of invasion and survival. Cell Death Dis. 2019;10:281. [DOI] [PMC free article] [PubMed] [Google Scholar]
- [11].Schmidt GJ, Reumiller CM, Ercan H, et al. Comparative proteomics reveals unexpected quantitative phosphorylation differences linked to platelet activation state. Sci Rep. 2019;9:19009. [DOI] [PMC free article] [PubMed] [Google Scholar]
- [12].Razmkhah F, Ghasemi S, Soleimani M, et al. LY86, LRG1 and PDE9A genes overexpression in umbilical cord blood hematopoietic stem progenitor cells by acute myeloid leukemia (M3) microvesicles. Exp Hematol Oncol. 2019;8:23. [DOI] [PMC free article] [PubMed] [Google Scholar]
- [13].Ma C, Lu T, He Y, et al. Comprehensive analysis of autophagy-related gene expression profiles identified five gene biomarkers associated with immune infiltration and advanced plaques in carotid atherosclerosis. Orphanet J Rare Dis. 2023;18:66. [DOI] [PMC free article] [PubMed] [Google Scholar]
- [14].Li W, Bai W, Miao C, et al. Joint effects of carotid plaques and renal impairment on the risk of cardiovascular disease and all-cause death in a community-based population: the Kailuan cohort study. Front Cardiovasc Med. 2022;9:943718. [DOI] [PMC free article] [PubMed] [Google Scholar]
- [15].Huang G, Jin Q, Tian X, et al. Development and validation of a carotid atherosclerosis risk prediction model based on a Chinese population. Front Cardiovasc Med. 2022;9:946063. [DOI] [PMC free article] [PubMed] [Google Scholar]
- [16].Li W, Zhao J, Song L, et al. Combined effects of carotid plaques and hypertension on the risk of cardiovascular disease and all-cause mortality. Clin Cardiol. 2020;43:715–22. [DOI] [PMC free article] [PubMed] [Google Scholar]
- [17].Tyers M, Rachubinski RA, Sartori CS, et al. Induction of the 47 kDa platelet substrate of protein kinase C during differentiation of HL-60 cells. Biochem J. 1987;243:249–53. [DOI] [PMC free article] [PubMed] [Google Scholar]
- [18].Christian F, Smith EL, Carmody RJ. The regulation of NF-κB Subunits by phosphorylation. Cells. 2016;5:12. [DOI] [PMC free article] [PubMed] [Google Scholar]
- [19].Cargnello M, Roux PP. Activation and function of the MAPKs and their substrates, the MAPK-activated protein kinases. Microbiol Mol Biol Rev. 2011;75:50–83. [DOI] [PMC free article] [PubMed] [Google Scholar]
- [20].Alim MA, Njenda D, Lundmark A, et al. Pleckstrin levels are increased in patients with chronic periodontitis and regulated via the MAP Kinase-p38α signaling pathway in gingival fibroblasts. Front Immunol. 2021;12:801096. [DOI] [PMC free article] [PubMed] [Google Scholar]
- [21].Lundmark A, Davanian H, Båge T, et al. Transcriptome analysis reveals mucin 4 to be highly associated with periodontitis and identifies pleckstrin as a link to systemic diseases. Sci Rep. 2015;5:18475. [DOI] [PMC free article] [PubMed] [Google Scholar]
- [22].Hasturk H, Kantarci A, Van Dyke TE. Oral inflammatory diseases and systemic inflammation: role of the macrophage. Front Immunol. 2012;3:118. [DOI] [PMC free article] [PubMed] [Google Scholar]
- [23].Brumell JH, Howard JC, Craig K, et al. Expression of the protein kinase C substrate pleckstrin in macrophages: association with phagosomal membranes. J Immunol. 1999;163:3388–95. [PubMed] [Google Scholar]
- [24].Nagai Y, Shimazu R, Ogata H, et al. Requirement for MD-1 in cell surface expression of RP105/CD180 and B-cell responsiveness to lipopolysaccharide. Blood. 2002;99:1699–705. [DOI] [PubMed] [Google Scholar]
- [25].Su S, Zhu H, Xu X, et al. DNA methylation of the LY86 gene is associated with obesity, insulin resistance, and inflammation. Twin Res Hum Genet. 2014;17:183–91. [DOI] [PMC free article] [PubMed] [Google Scholar]
- [26].Schultz TE, Blumenthal A. The RP105/MD-1 complex: molecular signaling mechanisms and pathophysiological implications. J Leukoc Biol. 2017;101:183–92. [DOI] [PubMed] [Google Scholar]
- [27].Watanabe Y, Nakamura T, Ishikawa S, et al. The radioprotective 105/MD-1 complex contributes to diet-induced obesity and adipose tissue inflammation. Diabetes. 2012;61:1199–209. [DOI] [PMC free article] [PubMed] [Google Scholar]
- [28].Xiong X, Liu Y, Mei Y, et al. Novel protective role of myeloid differentiation 1 in pathological cardiac remodelling. Sci Rep. 2017;7:41857. [DOI] [PMC free article] [PubMed] [Google Scholar]
- [29].Peng J, Liu Y, Xiong X, et al. Loss of MD1 exacerbates pressure overload-induced left ventricular structural and electrical remodelling. Sci Rep. 2017;7:5116. [DOI] [PMC free article] [PubMed] [Google Scholar]
- [30].Yang J, Zeng P, Yang J, et al. The Role of RP105 in cardiovascular disease through Regulating TLR4 and PI3K signaling pathways. Curr Med Sci. 2019;39:185–9. [DOI] [PubMed] [Google Scholar]
- [31].Huang W, Yang J, He C, et al. RP105 plays a cardioprotective role in myocardial ischemia reperfusion injury by regulating the Toll-like receptor 2/4 signaling pathways. Mol Med Rep. 2020;22:1373–81. [DOI] [PMC free article] [PubMed] [Google Scholar]
- [32].Allen JL, Flick LM, Divanovic S, et al. Cutting edge: regulation of TLR4-driven B cell proliferation by RP105 is not B cell autonomous. J Immunol. 2012;188:2065–9. [DOI] [PMC free article] [PubMed] [Google Scholar]
- [33].Gruber S, Hendrikx T, Tsiantoulas D, et al. Sialic acid-binding immunoglobulin-like lectin g promotes atherosclerosis and liver inflammation by suppressing the protective functions of B-1 Cells. Cell Rep. 2016;14:2348–61. [DOI] [PMC free article] [PubMed] [Google Scholar]


