

Summary
Polygenic risk scores (PRSs) developed from multi-ancestry genome-wide association studies (GWASs), PRSmulti, hold promise for improving PRS accuracy and generalizability across populations. To establish best practices for leveraging the increasing diversity of genomic studies, we investigated how various factors affect the performance of PRSmulti compared with PRSs constructed from single-ancestry GWASs (PRSsingle). Through extensive simulations and empirical analyses, we showed that PRSmulti overall outperformed PRSsingle in understudied populations, except when the understudied population represented a small proportion of the multi-ancestry GWAS. Furthermore, integrating PRSs based on local ancestry-informed GWASs and large-scale, European-based PRSs improved predictive performance in understudied African populations, especially for less polygenic traits with large-effect ancestry-enriched variants. Our work highlights the importance of diversifying genomic studies to achieve equitable PRS performance across ancestral populations and provides guidance for developing PRSs from multiple studies.
Keywords: genome-wide association studies, multi-ancestry, polygenic risk scores, genetic architecture
Graphical abstract
Highlights
-
•
PRSs derived from multi-ancestry GWASs improved accuracy in understudied populations
-
•
Multi-ancestry GWAS-based PRSs outperformed weighted PRSs from single-ancestry GWASs
-
•
Local ancestry-informed PRSs enhanced predictive performance in African populations
-
•
Best practices for utilizing genomic diversity for PRS prediction were provided
Wang et al. conducted extensive simulations and empirical analyses, revealing that incorporating greater diversity from discovery GWASs improved PRS accuracy in comparison to using large-scale, European-based PRSs in understudied populations. They also offered valuable guidelines for optimizing polygenic prediction across diverse populations, considering genetic architecture, ancestry composition, and PRS methodologies.
Introduction
Polygenic risk scores (PRSs) are useful tools for estimating the cumulative genetic susceptibility to complex traits and diseases. PRSs are typically calculated by weighting the number of risk alleles based on their associations in genome-wide association studies (GWASs). PRSs have shown promising potential in predicting some traits and disease risks, comparable to monogenic variants and traditional clinical risk factors.1,2,3,4,5 Achieving the most accurate and generalizable PRS requires access to large-scale and diverse GWASs, especially with representation that matches the specific target population. However, the current landscape of GWASs predominantly focuses on European (EUR) ancestry populations, which have considerably larger sample sizes compared with other populations. Although ongoing efforts are underway to rectify these gaps, achieving global representativeness is a challenging goal. Encouragingly, studies have shown that using GWAS data with even a small proportion of non-EUR-ancestry individuals has the potential to improve the predictive accuracy of PRSs in underrepresented populations.6,7,8 This finding could largely be attributed to the substantial contribution of common variants to the heritable variation of complex traits and diseases and that causal variants are largely shared across ancestries.9,10,11,12 With the ever-increasing availability and scalability of genomic data from underrepresented and ancestrally diverse populations, we are especially interested in leveraging this greater diversity to improve PRS generalizability.
In particular, recently admixed populations, consisting of chromosomal segments of mosaic ancestries, are systematically excluded in many existing genomic studies due to their underrepresentation and complicated population structure.13,14,15 However, these populations present unique opportunities to develop more generalizable PRSs, as their genetic effects can be estimated in more consistent environments, which helps reduce confounding factors compared with estimates across different ancestry groups in different populations.16 Furthermore, the comprehensive characterization of phenotypes is often insufficient or inconsistently performed in different populations. However, in the recently admixed populations, there is a greater potential for consistency and comparability in phenotype measurements, as the genetic factors contributing to phenotypic differences between the source populations can be decoupled in the recently admixed populations.16,17 The advancement of methodologies such as local ancestry inference and association testing has further enabled ancestry-specific GWASs in admixed populations,18,19,20 allowing for the construction of PRSs that leverage genetic information captured by local ancestry inference. With the ongoing data accumulation from recently admixed populations, particularly through initiatives like the All of Us Research Program,21 expanded resources will provide unparalleled opportunities to explore the performance of PRSs derived from local ancestry-informed summary statistics within historically underrepresented populations. Furthermore, such data will facilitate their integration with PRSs derived from predominantly EUR-based cohorts.
Recently developed statistical methodologies leverage the increasing diversity of GWAS data to improve PRS portability.8,22,23 However, the effect of genetic architecture, ancestry composition of GWAS discovery cohorts, and PRS construction methodologies on cross-ancestry predictive accuracy remains largely unclear. For example, a recent study found no increase in accuracy when meta-analyzing GWASs from a relatively small Ugandan cohort with larger EUR data.6 Furthermore, theoretical frameworks for approximating expected PRS accuracy from multi-ancestry GWASs are lacking. Current theoretical calculations for PRS accuracy rely on the assumption of homogeneity within the ancestral discovery samples,24,25 ignoring factors that are likely to play a role in multi-ancestry cohorts. Such factors may include differences in linkage disequilibrium (LD), minor allele frequency (MAF), heritability, sample sizes, and genetic correlation across different ancestries.
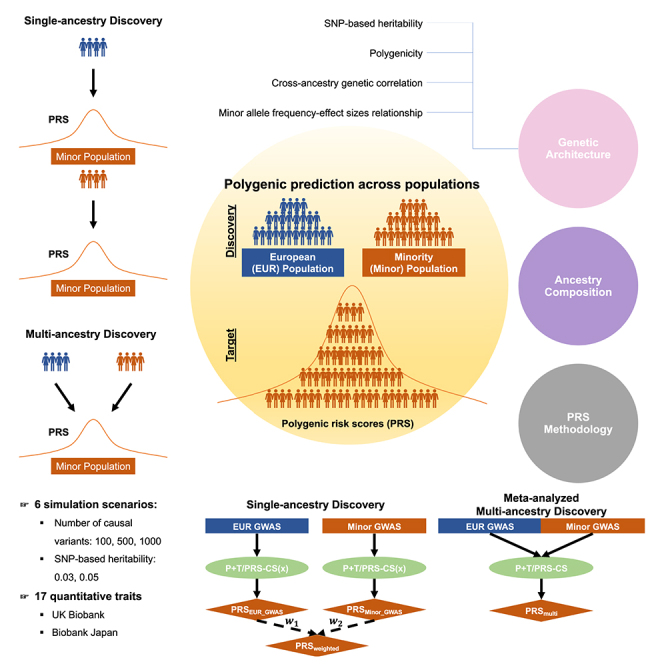
To provide insights into those issues, we explored the impact of ancestry compositions in discovery GWASs on the predictive accuracy of PRSs constructed using different methodologies. This exploration involved large-scale population genetic simulations as well as the utilization of real genomic data from the BioBank Japan (BBJ)26 and UK Biobank (UKBB)27 across traits exhibiting distinct genetic architectures (Figure 1). In what follows, we used single-ancestry GWASs to denote studies conducted exclusively within a single ancestry group (defined using genetic data), while multi-ancestry GWASs refer to studies encompassing two or more distinct ancestries. In our analyses, we performed meta-analyses of GWASs conducted in EUR ancestry populations (EUR GWASs) and GWASs conducted in other minority populations (Minor GWASs) by varying the ratios of sample sizes to mimic multi-ancestry GWASs with varying ancestry compositions. Specifically, we focused on East Asian (EAS) and African (AFR) minority populations. By comparing the performance of PRSs derived from single-ancestry GWASs (referred to as PRSsingle) and multi-ancestry GWASs (referred to as PRSmulti) through simulations and real data, we consistently observed that PRSmulti overall exhibited superior performance in comparison to PRSsingle (primarily PRSs derived from large-scale EUR GWASs, referred to as PRSEUR_GWAS). As admixed populations remain understudied despite disproportionately yielding novel genetic findings,28 we further conducted local ancestry inference to explore whether, how, and to what extent PRS performance could be improved using GWAS discovery data from AFR-EUR admixed individuals. While optimal PRS methods are trait and context specific, this study comprehensively evaluates PRS accuracy across a wide range of scenarios, facilitating a set of best practices that ultimately reduce the number of analyses necessary to optimize PRSs for specific applications.
Figure 1.

Study design in both simulations and empirical analyses
(1) In the context of single-ancestry GWASs, we randomly split individuals in European (EUR) and other minority populations, including East Asian and African populations, into equally sized bins. Simulations involved a total of 52 bins per population, each containing 10,000 individuals. For empirical analysis, bin number was dependent on the sample size of the respective phenotype in that population (Table S3), with 5,000 individuals per bin. A GWAS was conducted within each bin for each individual population, followed by meta-analysis of GWASs from various numbers of bins within each population. To construct PRSs derived from single-ancestry GWASs (PRSsingle) in the target population, we applied P + T for both simulations and empirical analyses, utilizing PRS-CS for the latter. Subsequently, we combined PRSsingle developed from EUR GWAS (PRSEUR_GWAS) and other minority population-based GWAS (PRSMinor_GWAS) through a linear weighted strategy (denoted as PRSweighted, highlighted in red box) for empirical analyses. Note that PRSweighted was also developed using PRS-CSx, which utilizes GWAS summary statistics from multiple populations. (2) For meta-analyzed multi-ancestry GWASs (referred to as Meta), we ran meta-analyses on EUR GWASs and Minor GWASs with varying ancestry compositions. In simulations, we incrementally included 4 bins from EUR GWASs for the meta-analysis, while in empirical analyses, we increased the number to 8 bins. Simultaneously, we varied the number of bins in Minor GWASs from 1 to the total number. Following the meta-analysis, we constructed PRSs based on Meta (referred to as PRSmulti), using the P + T method for simulations, and employing both P + T and PRS-CS for empirical analyses.
Results
Evaluating the effects of imbalanced sample sizes across ancestries on PRS accuracy through simulations
We simulated genotypes using HapGen2 and phenotypes by varying trait heritability ( = 0.03, 0.05) and number of causal variants = 100, 500, 1,000), such that the polygenicity ranged from ∼0.1% to ∼1%. We assumed that the causal variants and their effect sizes are shared across ancestries (i.e., cross-ancestry genetic correlation [] is 1) in our initial simulations. For single-ancestry GWASs, we first conducted GWASs within each bin and then meta-analyzed GWASs across different numbers of bins (1–52 per ancestry). Each bin represented 10,000 individuals randomly sampled from the corresponding ancestry. For multi-ancestry GWASs, we meta-analyzed GWASs from EUR and minor populations (EAS or AFR) to evaluate the impact of ancestry composition. We used varying numbers of bins from the EUR GWASs (4–52 with 4 increments) and varied the contribution from EAS or AFR GWASs (1–52 bins). We constructed PRSs using the classic pruning and thresholding (P + T) method with varying p value thresholds. We assessed the accuracy, measured by prediction R2, using the optimal threshold through fine-tuning in the validation cohort. The detailed simulation setup is shown in Figure 1 and STAR Methods.
PRS predictive accuracy improved with more individuals from target populations included in the multi-ancestry GWASs but varied with genetic architecture
When developing PRSsingle, we found that using ancestry-matched GWASs generally outperformed using GWASs from other discovery populations (Figure S1). Compared to using EUR GWASs, the benefit of using ancestry-matched GWASs was more evident for traits with more polygenic genetic architectures and larger GWAS sample sizes. To further evaluate the impact of ancestry composition, we compared the accuracy of PRSmulti and PRSsingle. We constructed PRSmulti using an LD reference panel consisting of individuals proportional to the ancestry composition of the discovery GWAS (STAR Methods). This reference panel yielded approximately optimal accuracy among three different reference panels utilized in our study (Figure S2).
Relative to the accuracy of PRSEUR_GWAS, we observed significant improvements in the understudied population by including more individuals from the target ancestry in multi-ancestry GWASs. Across all simulations, a statistically significant median improvement of 0.008 in R2 was observed (one-sided Wilcoxon signed-rank test, p < 2.2e−16; Table S1). This trend was more apparent in more polygenic traits. As shown in Figure 2, we compared accuracy between PRSmulti and PRSEUR_GWAS derived from 320,000 EUR individuals. For traits with an of 0.05, the median improvements in R2 of PRSmulti were 0.006, 0.014, and 0.013 with of 100, 500, and 1,000, respectively, in EAS individuals. Similarly, corresponding R2 improvements of 0.009, 0.010, and 0.014 were shown in AFR individuals (Figure S3). However, we did not consistently observe such accuracy gains for the majority EUR population or in scenarios where the other understudied ancestry was not included in the multi-ancestry discovery GWAS. In our simulations, but unlike in most GWASs, populations typically understudied in current genomic studies can be the majority in the discovery GWASs. Note that when the proportion of underrepresented populations in the discovery GWAS was below 50%, we still observed significant improvements in PRS accuracy. Specifically, across various simulations, we noted a median increase in R2 of 0.007 (p < 2.2e−16). We expected to observe similar relative R2 improvements, which measured the PRS generalizability, in the target populations using PRSmulti compared with using PRSEUR_GWAS (STAR Methods).
Figure 2.

Improvement of PRS accuracy through meta-analyzed multi-ancestry GWASs compared with large-scale EUR GWASs across 6 simulated genetic architectures
The multi-ancestry GWASs included populations of EUR and East Asian (EAS) ancestry, with the EAS sample size varying as indicated on the x axis. For illustrative purposes, we present the results using 32 EUR bins, each consisting of 10,000 individuals, which were included in both EUR GWASs and multi-ancestry GWASs. The PRS was separately evaluated in African (AFR), EAS, and EUR populations. Full results are shown in Table S1. indicates the number of causal variants, and refers to SNP-based heritability. In each panel, the red vertical dashed line indicates the point where an equal number of bins from EUR and EAS populations was included in the multi-ancestry GWAS. The error bars represent the SEs of predictive accuracy differences between PRSmulti and PRSEUR_GWAS.
Compared with using PRSEUR_GWAS, we found that PRSmulti derived from GWASs with much smaller sample sizes could achieve comparable or better predictive accuracy (Table S1). For example, in the scenario with an of 1,000 and an of 0.03, the meta-analysis of 16 EUR and 2 AFR bins achieved a comparable accuracy of 0.008 to that of using 32 EUR bins in the AFR population. Overall, adding fewer individuals from the target populations saturated accuracy improvements faster for less polygenic traits than more polygenic traits. Similarly, larger sample sizes from AFR populations were required to achieve comparable accuracy to EAS populations, especially for more polygenic traits, likely due to the larger effective population size in AFR populations and larger genetic divergence between EUR and AFR populations. As shown in Figure S3, when was 0.03, the accuracy improvement of PRSmulti in AFR plateaued to ∼0.005 with 11 and 20 AFR bins for of 100 and 500, respectively, but continued to increase with more AFR bins for an of 1,000. Similarly, when was 0.03, including 2 and 12 EAS bins in PRSmulti yielded an accuracy improvement of >0.005 in EAS for of 100 and 500, respectively (Figure 2). In comparison to PRSs derived from Minor GWASs alone (PRSMinor_GWAS), we found that the accuracy improvement of PRSmulti gradually diminished as the sample size of Minor GWASs increased (Figure S4; Table S1). We showed that for more polygenic traits, PRSmulti achieved little to no improvement when the understudied target populations accounted for more than half of the sample size in multi-ancestry GWASs.
Because estimates can be significantly less than 1, we also modified our simulations by varying the to be 0.6 and 0.8. We investigated two simulation scenarios that represent the extremes in per-variant variance explained: the least polygenic scenario 1 with = 100 and = 0.05, and the most polygenic scenario 2 with = 1,000 and = 0.03 (STAR Methods). Consistent with our previous findings, PRSmulti exhibited improved accuracy in the target population when a greater number of individuals from the same ancestry were included, as compared to relying solely on large-scale EUR GWASs (Figures S5A and S5B; Table S2). This improvement was more pronounced for scenario 2. Moreover, we needed a larger number of individuals from the target ancestry to saturate accuracy improvements in scenario 1 when was moderately reduced. Furthermore, as the sample sizes of the Minor GWASs increased and the values of decreased, the advantage of utilizing PRSmulti over PRSMinor_GWAS diminished and eventually vanished (Figures S5C and S5D; Table S2).
Empirical analysis of PRS accuracy within and across ancestries using 17 quantitative phenotypes
Genetic architecture of 17 studied phenotypes
To understand how trait genetic architecture influences the accuracy of PRSs across ancestries, we conducted a comprehensive analysis involving 17 phenotypes in the UKBB and the BBJ. Using the summary-data-based BayesS (SBayesS) method, we estimated key parameters, including SNP-based heritability, polygenicity (the proportion of SNPs with nonzero effects), and a coefficient of negative selection (S; measuring the relationship between MAF and estimated effect sizes), by leveraging GWAS summary statistics as input data.29
The phenotypes included in this study varied widely in genetic architecture across these estimated parameters (Figure 3; Tables S3 and S4). The polygenicity estimates spanned a broad range, from low values (0.001–0.005) for traits like mean corpuscular hemoglobin concentration (MCHC), basophil count (basophil), mean corpuscular hemoglobin (MCH), and mean corpuscular volume (MCV), to higher values (0.012–0.047) for traits such as height and body mass index (BMI). SNP-based heritability estimates similarly ranged from <0.1 for basophil and MCHC to 0.54 and 0.33 for height using the UKBB and the BBJ, respectively, regardless of polygenicity. The median S parameters were −0.63 and −0.47 using the UKBB and the BBJ, respectively. While the negative S values indicate negative selection (i.e., rarer variants have larger effects), it remains unclear to what degree population stratification could confound such estimates.30,31 We found that the polygenicity estimates using the UKBB were mostly higher than those using the BBJ, which could be due to the higher statistical power with larger sample sizes in the UKBB resulting in the detection of more variants with small effects. Similarly, we observed significantly higher SNP-based heritability in the UKBB compared with the BBJ, with the exception of MCHC and basophil, indicating possible phenotype heterogeneity between the two cohorts. These results are expected from the biobank designs, as the BBJ is a hospital-based cohort with participants recruited with certain diseases, whereas the UKBB is a population-based cohort with overall healthier participants and thus a wider range of natural variation in complete blood counts. This finding is also consistent with the previous study using estimates from LD score regression (LDSC) and stratified LDSC.32 Moreover, the estimated between the UKBB and the BBJ for those traits were not statistically different from 1 (p > 0.05/17) except for a few including basophil (0.5945, SE = 0.1221), height (0.6932, SE = 0.0172), BMI (0.7474, SE = 0.0230), diastolic blood pressure (DBP; 0.8354, SE = 0.0509), and systolic blood pressure (SBP; 0.8469, SE = 0.0430).32
Figure 3.

Genetic architecture of 17 studied traits between the BioBank Japan and the UK Biobank
The error bar is the standard deviation of the corresponding estimate. The vertical dashed line was the median estimate. Full results are shown in Table S4. The phenotypes were ranked according to their polygenicity estimates using GWASs from the UKBB, including: BMI (body mass index); height; DBP (diastolic blood pressure); SBP (systolic blood pressure); WBC (white blood cell count); lymphocyte (lymphocyte count); RBC (red blood cell count); neutrophil (neutrophil count); HB (hemoglobin concentration); HT (hematocrit percentage); eosinophil (eosinophil count); PLT (platelet count); monocyte (monocyte count); MCV (mean corpuscular volume); MCH (mean corpuscular hemoglobin); basophil (basophil count); and MCHC (mean corpuscular hemoglobin concentration).
PRSmulti usually improves predictive performance compared with PRSsingle
We constructed PRSsingle using P + T and PRS-continuous shrinkage (PRS-CS) with GWASs from the UKBB and the BBJ, respectively. The GWAS sample sizes varied based on the number of BinTotal, which represented the total number of bins specific to each trait as shown in Table S3. Each bin consisted of 5,000 individuals randomly selected from the respective cohort. We found that employing target ancestry-matched GWASs, even with smaller sample sizes, yielded comparable accuracy to utilizing large-scale EUR GWASs but depended on PRS methodology and trait-specific genetic architecture (Figures S6 and S7; Table S5).
For comparison, we developed PRSmulti through meta-analyzing single-ancestry GWASs obtained from the UKBB and the BBJ. The PRSmulti was constructed by varying the number of bins from each cohort, with UKBB bins ranging from 8 to 64, incrementing by 8 (details provided in STAR Methods and Figure 1). Consistent with our findings from the simulations, where we observed that the choice of LD reference panel had limited impacts on the predictive accuracy of more polygenic traits, we observed only a slight improvement of median R2 of 0.002 for P + T when employing a combined LD reference panel that was proportional to the ancestries represented in the multi-ancestry GWASs. We compared this result with PRSs developed using a reference panel that was matched with the majority population of the discovery GWAS (Figure S8; Table S6). Because the majority of PRSs (85%) were constructed from GWASs predominantly composed of EUR individuals (>50% EUR), we hereafter reported the results using 1KG-EUR as the LD reference.
In our analysis comprising 3,160 comparisons between PRSs derived from UKBB GWASs (PRSEUR_GWAS) and PRSmulti, we observed encouraging results. Specifically, in the UKBB-EAS population, PRSmulti showed accuracy improvements in 99.7% and 92.4% of these comparisons when using P + T and PRS-CS, respectively (Table S7; Figure S9). Accuracy increased with more EAS samples in the multi-ancestry GWAS (Figure 4). For example, when comparing PRSmulti with PRSEUR_GWAS using P + T, the largest relative improvements in R2 were 80.9% (0.085 vs. 0.047) for platelet count (PLT), 152.2% (0.058 vs. 0.023) for BMI, and 91.9% (0.071 vs. 0.037) for height. We observed these improvements when using multi-ancestry GWASs including EAS bins from the BBJ, which were either concordant with or proximal to BinTotal, along with 64 EUR bins from the UKBB. Similarly, the corresponding relative R2 improvements for these same three traits were 18.9% (0.126 vs. 0.106), 50% (0.075 vs. 0.050), and 15.5% (0.097 vs. 0.084) when using PRS-CS. We did not consistently observe the upward trend for white blood cell count (WBC) with PRS-CS, which can be attributed to the lack of accuracy improvement with larger sample sizes of BBJ (Figure S6). We also found that P + T showed greater improvement compared to PRS-CS but worse accuracy overall, regardless of the number of bins from EUR GWASs; the median improvements in R2 across traits were 0.014 and 0.008, respectively. However, the upward trend in PRS accuracy was not consistently shown in the UKBB-EUR, particularly when using PRS-CS (Figure S10; Table S7). This pattern aligned with our simulation results and previous reports that PRS accuracy for minority populations included in the multi-ancestry GWAS benefited more from adding more ancestry-matched individuals compared with other populations, including EUR populations.33 We noted that the accuracy of PRSmulti remained largely unchanged or slightly decreased when the number of bins from the BBJ was small (e.g., 1 or 2 bins), which was consistent with previous studies.6,33 In contrast to PRSs derived from the BBJ (PRSMinor_GWAS), we noted a diminishing trend in accuracy improvements of PRSmulti as the sample sizes of BBJ increased, especially for traits such as height, PLT, MCH, and MCV (Figure S11). Furthermore, we observed greater variation in accuracy among traits from real data compared with simulations, which could be attributed to the smaller sample sizes and the more complicated genetic architecture.
Figure 4.

Accuracy improvement of PRS in the UKBB-EAS population using multi-ancestry GWASs compared with using EUR GWASs for P + T and PRS-CS
The multi-ancestry GWASs were obtained by meta-analyzing EUR GWASs and EAS GWASs, with the EAS sample size from the BBJ varying as indicated on the x axis. For illustrative purposes, we present the results using 64 EUR bins, each containing 5,000 individuals, which were included in both EUR GWASs and multi-ancestry GWASs. The y axis is the accuracy difference of PRSs when using multi-ancestry GWASs (PRSmulti) compared with using EUR GWASs (PRSEUR_GWAS). The error bars indicate the SE of accuracy improvement. The red dashed line is y = 0. We showed the results for 7 traits with SNP-based heritability >0.1 in both the BBJ and the UKBB, and they were ranked by polygenicity estimates using the UKBB (Figure 3). Abbreviations are the same as in Figure 3. Full results are shown in Table S7.
PRSs derived from meta-analyzed multi-ancestry GWASs vs. weighted PRSs from single-ancestry GWASs in understudied populations
In contrast to PRSmulti, an alternative approach proposed in previous studies to enhance predictive accuracy in diverse populations is the linear combination of PRSs derived from GWASs conducted on populations with different ancestries.34 Here, we implemented this approach by developing a weighted PRS (PRSweighted) using P + T and PRS-CS. This combination involved linearly weighting PRSs derived from single-ancestry GWASs conducted in the UKBB and the BBJ. Additionally, we employed a more advanced Bayesian method called PRS-CSx,8 which jointly models GWAS and LD information from multiple populations. Similarly, we constructed PRSweighted using ancestry-specific posterior SNP effects. Furthermore, we developed PRSs by integrating ancestry-specific posterior SNP effects using the inverse-variance weighted meta-analysis strategy, also referred to as PRSmulti (see STAR Methods).
Among the three PRS methods evaluated in the UKBB-EAS, PRS-CSx exhibited the highest performance, followed by PRS-CS and P + T. Specifically, for PRSmulti, the corresponding median R2 values across traits were 0.051, 0.048, and 0.037, while for PRSweighted, they were 0.051, 0.045, and 0.021, respectively (Figure 5; Tables S8 and S9). Notably, we observed that PRSmulti for BMI using PRS-CS yielded significantly better accuracy compared with PRS-CSx (median R2: 0.057 vs. 0.055, p < 2.2e−16). Out of the 3,160 comparisons between PRSmulti and PRSweighted in the UKBB-EAS, 91.4% and 78% showed higher accuracy of PRSmulti (p < 2.2e−16) when using P + T and PRS-CS, respectively, with median improvements in R2 of 0.011 and 0.003. Although we found better performance overall with PRSmulti, we found that PRSweighted significantly outperformed PRSmulti for PLT using P + T (median R2: 0.086 vs. 0.081, p < 2.2e−16) and for height using PRS-CS (median R2: 0.091 vs. 0.082, p = 2.6e−04). Contrary to trends observed with other methods, in 59.7% of the comparisons, PRSweighted outperformed PRSmulti when using PRS-CSx, although we observed no significant accuracy difference across traits. However, PRSweighted showed superior performance compared with PRSmulti (p < 0.05/17) for several traits, including MCV (median R2: 079 vs. 0.072), MCH (median R2: 0.079 vs. 0.073), basophil (median R2: 0.010 vs. 0.007), and hemoglobin (HB) concentration (median R2: 0.025 vs. 0.024).
Figure 5.

Predictive accuracy using different PRS methods in the UKBB-EAS population
We showed the results for 7 traits with SNP-based heritability >0.1 in both the BBJ and the UKBB. Traits were ranked by polygenicity estimates using the UKBB (Figure 3). Boxes represent the first and third quartiles, with the whiskers extending to 1.5-fold the interquartile range. Abbreviations are the same as in Figure 3. Full results are shown in Tables S8 and S9.
Moreover, the extent of accuracy improvements using PRSmulti, in contrast to PRSweighted, largely varied across traits and ancestry compositions. For example, when evaluating accuracy within the UKBB-EAS using P + T, we observed 3.25-fold increase in R2 with PRSmulti compared with PRSweighted for monocyte count (monocyte; 0.065 vs. 0.020). This improvement was achieved with a bin ratio 56:15 for the discovery GWAS, consisting of 56 bins from the UKBB and 15 bins from the BBJ. Similarly, using a bin ratio of 40:25, we achieved a 4-fold increase in R2 for DBP (0.048 vs. 0.012) with PRSmulti compared with PRSweighted. When developing PRSmulti using PRS-CS, we observed notable relative improvements in R2 when compared to PRSweighted, specifically a 24.7% increase for PLT (0.091 vs. 0.073) with a bin ratio of 24:1 and a 57.1% increase for lymphocyte (0.044 vs. 0.028) with a bin ratio of 16:1. Additionally, we found that PRS-CSx showed better performance in comparison with PRS-CS, especially when the EUR GWAS was smaller or the Minor GWAS was larger. However, such improvements were less pronounced with large-scale EUR GWASs or small Minor GWASs (Figure S12). While sharing ancestry-specific GWAS summary statistics is highly beneficial for determining optimal approaches, our findings highlight the value of pragmatic approaches that directly construct PRS from large-scale meta-analyzed multi-ancestry GWASs. Such studies are often more accessible than ancestry-specific GWAS summary statistics.
PRSs derived from local ancestry-informed GWASs can improve accuracy for some less polygenic traits
We next conducted a comparative analysis to evaluate the optimal PRS approaches for admixed populations, utilizing local ancestry-informed GWASs. Specifically, we used Tractor19 to perform GWASs in AFR tracts within admixed AFR-EUR individuals, referred to as AFRTractor. This approach enabled us to construct ancestry-specific PRSs across 17 traits in the understudied AFR population. We developed PRSs using both P + T and PRS-CS and subsequently compared the accuracies of PRSs derived from AFRTractor with those derived from large-scale EUR GWASs performed with standard linear regression (EURstandard). To maximize discovery sample size, we also developed PRSweighted by combining EURstandard-derived PRSs and AFRTractor-derived PRSs through linear weighting; we compared its performance with PRSs derived from multi-ancestry meta-analyzed GWAS (referred to as Metastandard; see STAR Methods).
Local ancestry-informed ancestry-specific GWASs had a much smaller sample size relative to the EUR-inclusive GWASs, as is typical for GWASs of underrepresented populations. As expected, we did not observe significant predictive accuracy of AFRTractor-derived PRSs for most traits such as height and BMI (Figure 6; Table S10). However, we observed notable improvements for 5 traits, including WBC, neutrophil count (neutrophil), MCV, MCH, and MCHC, where AFRTractor-derived PRSs achieved significantly higher R2 compared with EURstandard-derived PRSs when using P + T (0.040 vs. 0.007, one-sided paired t test, p = 0.038), despite a much larger sample size for EURstandard. This improvement might be attributed to the presence of large-effect AFR-enriched variants, particularly for MCV, MCH, and MCHC, which are effectively captured by Tractor GWASs.6,19 Consistent with our previous findings, P + T generally outperformed PRS-CS for these traits, characterized by much sparser genetic architectures, with a mean R2 of 0.040 compared with 0.022. In line with our PRS accuracy results, we observed higher estimates of SNP-based heritability for WBC ( = 0.41, SE = 0.19 vs. = 0.17, SE = 0.01), neutrophil ( = 0.44, SE = 0.26 vs. = 0.15, SE = 0.01), and MCHC ( = 0.15, SE = 0.11 vs. = 0.06, SE = 0.01) in the AFR population compared with in the EUR population (STAR Methods). However, these differences did not reach statistical significance, which can be attributed to the large SEs resulting from the limited small sample size of the AFR population and the sparser genetic architectures, leading to less stable heritability estimates using LDSC.
Figure 6.

Accuracy of PRSs derived from local ancestry-informed GWASs vs. other discovery GWASs in the UKBB-AFR population
AFRTractor denotes the AFR-specific GWAS performed using Tractor on the UKBB admixed AFR-EUR individuals. EURstandard refers to standard GWASs performed on the EUR population in the UKBB. Metastandard is the meta-analysis performed on AFRTractor and EURstandard. Furthermore, we constructed a weighted PRS by combining PRSs generated from AFRTractor and EURstandard through a linear weighted approach. The figure shows the results for traits with SNP-based heritability >0.1 in the UKBB-AFR. Full results are shown in Table S10.
The best local ancestry-informed PRS approach that we evaluated for the 5 less polygenic traits was PRSweighted. This finding aligns with our earlier observations, where PRSweighted outperformed PRSmulti for traits with large-effect ancestry-enriched variants, while PRSmulti exhibited superior overall performance for traits lacking such variants. Specifically, the mean accuracies of PRSweighted using P + T, PRS-CS, and PRS-CSx for those 5 traits were 0.044, 0.031, and 0.028, respectively, with no significant differences observed among the three PRS methods. The mean accuracies of Metastandard-derived PRSs were 0.016 and 0.008 using PRS-CS and P + T, respectively. Additionally, we did not observe significant accuracy differences between PRSs derived from GWASs conducted using standard linear regression in admixed populations and AFRTractor-derived PRSs (Table S10). It is worth noting that the effective sample size of local ancestry-informed GWASs is approximately 20% smaller due to the reduction from deconvolving ancestral tracts. Moreover, PRSs derived from traditional GWASs in admixed populations necessitate an in-sample LD reference panel. In contrast, local ancestry-informed GWAS-based PRSs, as shown in this study, can leverage external LD reference panels, eliminating the need for direct access to individual-level genotypes of admixed populations.
Discussion
In this study, we extensively evaluated PRS performance through a combination of simulation and empirical analyses to explore the impact of various factors on PRS predictive accuracy and generalizability across populations. We demonstrated that increasing genetic diversity of discovery GWASs improved predictive accuracy in understudied populations. The extent of improvement was influenced by factors such as sample size ratios between EUR GWASs and Minor GWASs, genetic architecture, PRS methodology, and LD reference panels. Among those factors, between-ancestry genetic architecture differences, such as ancestry-enriched variants with large effects, affected accuracy improvement more than other factors. While leveraging large-scale EUR GWASs continues to benefit PRS accuracy given the current scale of understudied populations, we may not expect accuracy improvement when meta-analyzing extremely small Minor GWASs.6
Our study also revealed that directly meta-analyzing datasets from diverse ancestral groups could yield greater accuracy improvements than linearly combining PRSs through an optimized weighting strategy, especially for P + T. Such improvements from meta-analyzed GWASs support the common implicit assumption that causal variants are shared between ancestries. Consistent with this assumption, when smaller target populations lack representation, leveraging genetic information from a different population with larger sample sizes improves PRS accuracy, even when it is ancestrally diverged. Notably, when employing the more sophisticated genome-wide PRS method, PRS-CSx, accuracy differences between PRSmulti and PRSweighted were marginal. Moreover, PRS-CSx generally outperformed PRS-CS, with the exception of BMI. The improvement was most pronounced for traits with ancestry-specific variants, such as MCV and MCH.
We have comprehensively evaluated characteristics that impact PRS performance, including in recently admixed populations. We have shown the advantage of leveraging GWASs in admixed populations by accounting for local ancestry, which could improve PRS predictive performance in understudied populations even without direct access to individual genotypes of admixed populations. Specifically, we found that PRSweighted consistently outperformed PRSmulti for traits with ancestry-enriched variants. However, the sample size of admixed individuals here was relatively small, and we anticipate that future analyses incorporating larger datasets, such as the All of Us Research Program, will provide further insights into optimal PRS strategies for improved accuracy and generalizability using PRSs derived from local ancestry-informed GWASs.
While previous studies have shown the advantages of leveraging increased genetic diversity to improve PRS accuracy in global populations,7,35 most have used GWASs with primarily EUR ancestry. Here, we have provided additional best practices for developing PRSs for understudied populations using diverse discovery cohorts, particularly when GWASs encompass different ancestry compositions across various trait genetic architectures (Figure 7). Our recommendations primarily revolve around general guidelines for constructing PRSsingle and PRSmulti (or PRSweighted), depending on factors examined in this study (Figure S13).
Figure 7.

General practices for developing PRSs using different discovery GWASs
We summarized the general practice for developing PRSs (A) using single-ancestry GWASs (PRSsingle) and (B) using GWASs from multiple ancestries (PRSmulti or PRSweighted). , cross-ancestry genetic correlation; and , SNP-based heritability in discovery and target populations, respectively; , discovery GWAS sample size; , the number of genome-wide independent segments in the discovery population.
First, in the development of PRSsingle, we employed a theoretical equation36 to enhance the selection of input GWASs (STAR Methods), as a function of , SNP-based heritability in discovery and target populations, GWAS sample size, and the number of genome-wide independent segments in the discovery population.36 For traits with relatively low and a sizable ancestry-matched GWAS (e.g., >20%–40% of EUR GWASs), such as BMI and height, PRS accuracy in the target population improves when ancestry-matched GWASs are utilized. On the other hand, for traits with high and high SNP-based heritability, we expect larger-scale EUR GWASs to outperform smaller-scale ancestry-matched GWASs. Additionally, we expect Bayesian methods tailored to trait-specific genetic architecture to outperform P + T. However, this superior performance may not hold true for traits that exhibit large-effect ancestry-enriched variants or with a very sparse genetic architecture, which are attributes typically informed by prior knowledge or information gleaned from literature and public resources.35,37,38,39 To enhance accuracy in such scenarios, we recommend employing a grid-search approach with a finer-scale adjustment of the hyper-parameters in Bayesian methods.
Second, in comparison to PRSsingle derived from large-scale EUR GWASs, we recommend using PRSmulti, unless the target ancestry-matched GWAS is extremely small (<10,000). PRSmulti is generally preferred for traits with high , high SNP-based heritability, and large sample sizes. We find increasing evidence supporting the notion that the effects of most common variants are shared between ancestries, indicating a high for most traits.9,11 However, estimates of can be affected by phenotypic and environmental heterogeneity across populations.10,16 When constructing PRSmulti using summary-level-based methods, researchers should carefully consider which LD reference panel best approximates the LD structure between SNPs while being the most readily accessible. We have shown that when EUR remains the majority population in the discovery GWAS, using the EUR-based reference panel effectively approximates the LD of the discovery GWAS, consistent with our previous findings.7
Third, our findings indicate the advantages of PRSmulti compared with PRSweighted, particularly when employing P + T and PRS-CS. However, there are some notable exceptions, such as the higher accuracy observed when using PRSweighted with PRS-CS for traits with low , such as height. Furthermore, when incorporating local ancestry-informed GWASs and large-scale EUR GWASs, PRSweighted outperformed PRSmulti for traits with AFR-enriched variants, such as WBC and MCHC, in the UKBB-AFR. On the other hand, we note that the accuracy of PRSmulti could be more affected by the choice of LD reference panel, while PRSweighted was not limited in this regard due to its easy accessibility of external ancestry-matched reference panels. PRS-CSx is recommended when ancestry-specific GWASs from multiple populations are available, especially with considerable sample sizes (e.g., >25,000–50,000) of Minor GWASs. These results highlight the importance of making ancestry-specific summary statistics publicly available.
In summary, there is no one-size-fits all approach for constructing PRSs, as the optimal approach depends on genetic architecture, ancestry composition, statistical power, and other factors. These factors can be complex, particularly as a deluge of methods are being developed to address the PRS generalizability problem. To inform optimal approaches across a wide range of scenarios, we have distilled the results of extensive simulations and empirical analyses across trait genetic architectures, ancestries, and methods into a set of guidelines from parameters that are typically evaluated at the outset of a genetic study.
Limitations of the study
We acknowledge some limitations and future directions in our study. First, we focused on common variants, while population-enriched variants have lower frequencies in the overall population. The role of such variants in polygenic prediction are worth exploring across phenotypes when there are sufficient sample sizes for different ancestral populations. Second, as we used external LD reference panels for PRS construction, PRS performance decreases with LD mismatch between the discovery population and the LD reference panel, especially when using multi-ancestry GWASs. While we show that LD reference panel differences have a relatively modest effect on PRS accuracy, they have a much larger effect on fine-mapping,40 so future efforts are warranted to share in-sample LD without direct access to individual-level genotypes, especially for large consortia with numerous and diverse cohorts. Alternatively, developing more sophisticated individual-level PRS methods that preserve privacy and are scalable to current biobank-scale data is also promising. Third, while our primary focus pertains to quantitative phenotypes characterized by diverse genetic architectures, we expect that our findings can be broadly applied to binary traits, as we have investigated previously.7 However, binary phenotypes introduce additional complexities due to factors such as variable case/control ratios, phenotype definitions, environmental differences, and smaller effective sample sizes or lower statistical power. Finally, it is important to acknowledge that our study focused on selected methods, which consistently exhibit similar trends. Although we anticipate that our findings are broadly applicable to alternative methods, such as XPASS41 and XP-BLUP,42 further research is needed to explore the generalizability of our findings to other polygenic prediction approaches. Despite the limitations, our study highlights the advantages of leveraging the increasing diversity of current genomics studies to improve polygenic prediction across populations. We emphasize the necessity of diversifying not only the ancestry but also the phenotypic spectrum when collecting genomic data from global populations, which will contribute to achieve a more equitable and effective use of PRSs for traits with varying genetic architectures.
STAR★Methods
Key resources table
| REAGENT or RESOURCE | SOURCE | IDENTIFIER |
|---|---|---|
| Deposited data | ||
| 1000 Genome Phase 3 | 43 | ftp://ftp.1000genomes.ebi.ac.uk/vol1/ftp/data_collections/1000_genomes_project/data |
| Software and algorithms | ||
| Plink | 44 | https://www.cog-genomics.org/plink/ |
| PRS-CS | 39 | https://github.com/getian107/PRScs |
| SBayesS/GCTB | 29 | https://cnsgenomics.com/software/gctb/ |
| PRS-CSx | 8 | https://github.com/getian107/PRScsx |
| Tractor | 19 | https://github.com/Atkinson-Lab/Tractor |
| HapGen2 | 45 | https://mathgen.stats.ox.ac.uk/genetics_software/hapgen/hapgen2.html |
| Codes for this study | This paper | https://doi.org/10.5281/zenodo.8218174 |
Resource availability
Lead contact
Further information and requests for resources and reagents should be directed to and will be fulfilled by the lead contact, Ying Wang (yiwang@broadinstitute.org).
Materials availability
This study did not generate new unique reagents.
Method details
Simulations
Simulated genotypes in three populations
To explore the potential improvement of predictive accuracy within an underrepresented target ancestry through the inclusion of additional samples included in the multi-ancestry discovery GWAS, we simulated genotypes of chromosome 22 for 560,000 individuals in each population including European ancestry (EUR), East Asian ancestry (EAS) and African ancestry (AFR) using the software HapGen2 v2.1.2.45 We used the haplotypes from 1000 Genome Project (1KG, Phase 3)43 as the sample pool. We excluded Americans of African Ancestry in SW USA and African Caribbeans in Barbados from the AFR samples due to their high degree of recent admixture. We used default parameters in HapGen2 with effective sample sizes of 11,375, 12,239 and 17,380 for EUR, EAS and AFR, respectively.45 After simulating the genotypes on chromosome 22, we ran analyses with a total of 87,938 overlapping SNPs across the three ancestries which passed quality control filters: minor allele frequency (MAF) > 0.01, Hardy-Weinberg Equilibrium (HWE) p value > and genotype missingness rates across individuals <0.05. We then removed 2nd-degree related individuals using the software KING,46 resulting in 534,352, 533,996 and 537,498 unrelated individuals from EUR, EAS and AFR, separately. We randomly sampled 10,000 and 520,000 individuals from each ancestry as the withheld target population and discovery population, respectively.
Simulated phenotypes with varying trait genetic architecture
For the sake of simplicity, we assumed that causal variants are shared across populations and their effect sizes are perfectly correlated (cross-ancestry genetic correlation, ) in our initial simulations. The pairwise among populations is represented by a matrix, denoted as R, where the off-diagonal elements of R had the value of and diagonal elements of R were set to 1. In our study, was equal to 3, indicating the number of populations considered. We simulated phenotypes based on the simple additive model: , where is the number of causal variants, is the genotype coded as 0, 1, or 2 for the th SNP in the th population. The effect size of th SNP across populations is drawn from a multivariate normal distribution, , where for the variance-covariance matrix, , the diagonal and off-diagonal elements were and R⋅ , respectively. We denoted as the MAF of th SNP in the th population and as the trait heritability. We simulated the environmental effects to follow a normal distribution with 0 mean and variance, . We simulated different levels of heritability for chromosome 22 ( 0.03 and 0.05). Additionally, we randomly sampled various numbers of causal variants = 100, 500, and 1000) from all the 87,938 SNPs. As a result, we defined a total of 6 distinct simulation scenarios that encompass a realistic spectrum of polygenicity, ranging from ∼0.1% to ∼1% of causal variants. To assess the impact of on PRS performance, we expanded our simulation study by considering two scenarios. These scenarios aimed to capture different levels of per-variant variance explained. In scenario 1 characterized by = 100 and 0.05, the per-variant variance explained was higher. Conversely, scenario 2 involved = 1000 and 0.03, resulting in a lower per-variant variance explained. For each scenario, we varied the values of to 0.6 and 0.8, respectively.
Downsampling and meta-analyzed GWAS in simulations
To provide the requisite discovery data for constructing PRS, we proceeded to perform GWAS on the simulated phenotypes. Specifically, we split the discovery population, which consisted of 520,000 unrelated individuals, into 52 evenly distributed bins, each comprising 10,000 individuals (denoted as Bin1, Bin2, …, Bintotal). Subsequently, we ran GWAS on each of those 52 bins independently within the three populations, using simple linear regression implemented in PLINK v2.0.44 We excluded the causal variants when running GWAS to mimic the phenomenon of imperfect tagging. We then employed an iterative process of meta-analysis, employing the inverse-variance weighted method using METAL,47 gradually incorporating a varying number of bins. Specifically, we commenced the meta-analysis with Bin1+Bin2, subsequently progressing to Bin1+Bin2+Bin3, and so forth, until we encompassed the complete set of bins (Bin1+Bin2+Bin3+ … +Bintota) for each population.
To simulate a scenario resembling a meta-analysis involving multiple ancestries with varying proportions, we opted for an arbitrary selection of subsets from EUR GWAS. Specifically, we chose a range of bins, from 4 to 52 bins, with increments of 4. Subsequently, we systematically incorporated different numbers of bins, spanning from 1 to 52, from EAS and AFR populations into the EUR GWAS dataset via meta-analysis. The meta-analysis was conducted utilizing the inverse-variance weighted fixed-effects model implemented in the METAL software. This iterative process allowed us to achieve a range of sample size ratios between EUR and EAS as well as EUR and AFR, encompassing ratios from 52:1 to 4:52, in the meta-analyzed multi-ancestry GWAS (referred to as Meta). The simulation configuration is visually depicted in Figure 1.
Pruning and thresholding (P + T) in simulations
P + T follows a greedy heuristic algorithm wherein variants are sorted based on their p values. The algorithm iteratively descends in significance while retaining only those variants that do not exceed a predetermined LD threshold with previously retained variants. We employed PLINK v1.90 to clump quasi-independent SNPs within 500Kb windows, utilizing an LD threshold of r2 < 0.1. To explore the impact of various LD reference panels on predictive accuracy of PRS, we used a total of four different LD reference panels:one for single-ancestry and three for multi-ancestry GWAS, with consideration to the ancestry composition of the discovery GWAS and the target population.
For the single-ancestry GWAS, we used an LD reference panel consisting of 10,000 individuals from the target population that were matched to the ancestry of the discovery GWAS. In the case of multi-ancestry GWAS, we used three LD reference panels. These panels included two composed of a single ancestry that did not mirror the ancestral makeup of the discovery GWAS. Specifically, one panel comprised 10,000 withheld EUR individuals, while the other panel encompassed individuals from understudied populations, either 10,000 EAS or 10,000 AFR individuals, consistent with the minority population represented in the discovery GWAS. The third LD reference panel consisted of individuals from different ancestries in proportions proportional to the discovery GWAS, amounting to a total of 10,000 samples.
We calculated PRS in the target population using 8 different p value thresholds: 5 × 10⁻⁸, 1 × 10⁻⁶, 1 × 10⁻⁴, 1 × 10⁻³, 0.01, 0.05, 0.1, and 1. We denoted PRS constructed from single-ancestry GWAS as single-ancestry PRS (PRSsingle) and those from meta-analyzed multi-ancestry GWAS as multi-ancestry PRS (PRSmulti). We calculated the predictive accuracy as the variance explained by the PRS (R2) through linear regression: PRS and computed corresponding 95% confidence intervals (CIs) through bootstrap. To identify the optimal p value threshold associated with the highest predictive accuracy, we evenly divided the target population into a test cohort and a validation cohort. The p value threshold was optimized through a process of hyperparameter tuning in the validation cohort, and subsequently, the accuracy of the model was assessed using the test cohort. To further compare the accuracy of PRSmulti relative to PRSEUR_GWAS, we calculated the relative accuracy (RA) as the difference in PRS R2 between the PRS derived from multi-ancestry GWAS and EUR GWAS divided by the PRS R2 in EUR ancestry from the EUR GWAS, i.e., . Therefore, the trend of RA was consistent with the accuracy improvement of PRSmulti.
Empirical analysis of 17 quantitative traits in the UK biobank (UKBB) and biobank Japan (BBJ)
We further explored how the findings from simulations generalized in real data using 17 quantitative traits shared between UKBB and BBJ, including anthropometric traits (BMI and height) and blood panel traits studied previously (Table S3).32 The selection of these traits was motivated by their widespread availability within biobanks and their substantial statistical power, attributable to their quantitative properties.
Datasets and quality control (QC)
UK biobank (UKBB)
The details of assigning ancestry for each individual in the UKBB are described in the Pan-UK Biobank Project (Pan UKBB: https://pan.ukbb.broadinstitute.org/). Briefly, a random forest classifier trained on reference data from 1KG and Human Genome Diversity Project (HGDP)48 was used to classify cohort individuals under continental population labels based on the top 6 principal components (PCs). In this study, we used a total of 361,144 and 2,684 unrelated EUR and EAS participants, respectively. We obtained unrelated individuals through running hl.maximal_independent_set using Hail (https://hail.is/). Specifically, within each population, we ran PC-Relate49 with k = 10 and min_individual_maf = 0.05. We used the individuals assigned EAS ancestry as the target dataset. For EUR samples, we first randomly retained 5,000 individuals with complete phenotype information for all 17 studied phenotypes as the target population. Subsequently, we split the remaining individuals into evenly distributed bins, each containing 5,000 individuals, for each phenotype. The number of total bins for each studied phenotype ranged from 68 to 71, depending on phenotype missingness (Table S3). The bins were labeled sequentially from 1 to the total number of bins, following the same procedure as described in our simulations.
BioBank Japan (BBJ)
BBJ is a multi-institutional hospital-based biobank which has recruited approximately 200,000 participants from 12 medical institutions in Japan between fiscal years 2003 and 2007.26 Written informed consents were obtained from all the participants, as approved by the ethics committees of the RIKEN Center for Integrative Medical Sciences, and the Institute of Medical Sciences, the University of Tokyo. The participants were genotyped using either (i) the Illumina HumanOmniExpressExome BeadChip or (ii) a combination of the Illumina HumanOmniExpress and HumanExome BeadChips. The genotypes were then prephased using Eagle50 and imputed using Minimac351 with a reference panel that consists of 1KG samples (N = 2,504) and whole-genome sequencing (WGS) data of Japanese individuals (N = 1,037).52 Standard quality controls of participants and genotypes were applied as described elsewhere.52 Briefly, we excluded samples with low call rates (<98%), closely related individuals (PLINK PI_HAT >0.175), or non-Japanese outliers based on the principal component analysis (PCA). We then excluded genotyped variants with call rate <98%, HWE p-value <1.0 × 10⁻⁶, number of heterozygotes <5, or low concordance rate (<99.5%) with WGS for a subset of individuals (N = 939). Phenotypes were retrieved from medical records and prepared as described previously.53
1000 genomes project phase 3 (1KG)
We used 1KG phase 3 data as LD reference panels in this study. Specifically, we kept 495 unrelated EUR, 498 unrelated EAS, and 484 unrelated AFR individuals from 1KG. The AFR individuals were solely utilized for analyses pertaining to recently admixed populations.
Quality controls
The imputation strategies for UKBB and BBJ have been described in detail elsewhere.27,54 After imputation, we first excluded ambiguous variants (e.g., A/T and C/G) and further filtered to keep those variants with imputation INFO score >0.3, MAF >0.01, HWE p value >10−6, and genotyping missing rates across individuals <0.05. Consequently, approximately 8.6 million and 6.6 million SNPs were retained for the UKBB and BBJ, respectively. For our analyses, we exclusively utilized SNPs that passed these quality control measures, resulting in approximately 3.6 million SNPs that were shared among both biobanks and 1KG.
PRS construction for 17 traits in empirical analysis
Discovery GWAS
All phenotypes were curated and transformed to be normally distributed as described previously.32 Subsequently, we performed GWAS on the rank normalized phenotypes using simple linear regression implemented in PLINK v2.0. We included age, sex, age,2 age × sex, age2 × sex, and the first 20 PCs as the covariates. In line with the GWAS strategy outlined in the simulations section, we initially performed GWAS within individual bins and then engaged in an iterative meta-analysis, employing inverse-variance weighted meta-analysis in METAL, separately for UKBB and BBJ cohorts. For the meta-analysis of GWAS results derived from single-ancestry analyses in the UKBB and BBJ (referred to as "Meta"), we incorporated a variable number of EUR bins from UKBB, ranging from 8 to 64 with an increment of 8. Subsequently, we systematically integrated additional EAS bins from BBJ.
PRS construction methods
We used different methods to construct PRS in the target populations, specifically UKBB-EAS and UKBB-EUR. In accordance with Simulations, we also explored the impact of LD reference panels on PRS performance by utilizing multiple panels from 1KG, while taking into account the ancestry composition of discovery GWAS for P + T. Additionally, we implemented PRS-CS,39 a Bayesian regression framework that integrates a continuous shrinkage prior to infer the posterior mean effects of SNPs. To alleviate computational burdens, we initially ran PRS-CS using GWAS summary statistics from UKBB with varying numbers of bins (ranging from 8 to 64, with an increment of 8) for 17 traits. We systematically explored the influence of the hyper-parameter (phi), representing the proportion of SNPs with non-zero effects, on PRS performance, considering diverse GWAS sample sizes and trait genetic architectures. Specifically, we performed both the grid model with various phi parameters (1 × 10⁻⁶, 1 × 10⁻⁴, 0.01 and 1) and the auto model, which automatically estimates the phi parameter based on the input GWAS. We used default settings for all other parameters. Our findings indicated that PRS-CS-auto exhibited comparable predictive accuracy across all traits in the UK Biobank dataset when compared to using the optimal phi parameter in the grid model (Figure S15). To ensure computational efficiency, we employed the auto model in the PRS-CS framework based on the input GWAS. For both UKBB and Meta, we used 1KG-EUR as the LD reference panel, while for BBJ, we utilized 1KG-EAS reference panel.
To further explore the performance of PRS incorporating GWAS from multiple ancestries, we constructed a weighted PRS by linearly combining PRS derived from single-ancestry GWAS.34 Specifically, the weighted PRS was calculated as PRSweighted = ∗ PRSEUR_GWAS + ∗ PRSMinor_GWAS, where and were weights attached to individual PRS. Furthermore, we used a more sophisticated method, PRS-CSx,8 to generate ancestry-specific posterior SNP effects using multiple GWAS summary statistics. PRS-CSx, an extension of PRS-CS, can model ancestry-specific allele frequencies and LD patterns. Similar to PRS-CS, we used the ancestry-matched LD reference panel from 1KG and performed the auto model implemented in PRS-CSx. We also incorporated the --meta flag, which enables inverse-variance weighted meta-analysis in the Gibbs sampler. Consequently, we developed two types of PRS from PRS-CSx, one was based on the meta-analyzed effects (referred to as PRSmulti) and the other, PRSweighted, was dependent on the ancestry-specific posterior SNP effects.
PRS performance evaluation
We assessed the predictive accuracy of PRS by measuring the incremental R2 using linear regression, where we accounted for the influence of covariates. Two models were compared: 1) , representing the baseline model, and 2) , incorporating PRS as the full model. The incremental R2 was utilized to quantify the improvement in model accuracy resulting from the inclusion of PRS, thus providing a measure of the specific contribution made by PRS to the predictive power of the model. We computed the corresponding 95% confidence intervals (CIs) through bootstrap. To maximize the predictive accuracy of P + T and PRSweighted, we employed an optimization strategy to identify the optimal p value thresholds for P + T and the weights ( and ) assigned to various PRS components for PRSweighted. This optimization process entailed a random partitioning of the target population into two equally sized subsets, namely the validation dataset and the test dataset. The hyperparameter was identified in the validation dataset, and subsequently, the accuracy of the model was assessed using the test dataset. We replicated the process 100 times and calculated the standard error of predictive accuracy across 100 replicates. This approach allowed us to maximize the performance of P + T and PRSweighted by iteratively refining the p value thresholds and weight parameters, thereby enhancing their predictive capabilities.
The expected accuracy of PRS in the UKBB-EAS derived from BBJ is based on the theoretical equation: (1),25 where denotes the SNP-based heritability in the discovery population, is the discovery GWAS sample size and is the number of independent chromosome segments in the discovery population, which we assume to be 50,000.55 The results are shown in Figure S14. When there is imperfect cross-ancestry genetic correlation (), we used a generalization of this formula: (2),36 where denotes SNP-based heritability in the target populations. It is important to note that this formula provides an approximation and does not explicitly account for differences in LD structure between ancestries, except for the influence of LD disparities on genetic correlation. Note that the reliability of parameter estimates such as and poses significant challenges, particularly in the context of multi-ancestry GWAS with highly imbalanced sample sizes.
Measures of genetic architecture using summary-data-based BayesS (SBayesS)29
To better understand the impact of trait genetic architecture on PRS predictive performance, we evaluated three parameters including the polygenicity (proportion of SNPs with nonzero effects), SNP-based heritability and S (the relationship between MAF and effect sizes) for 17 studied phenotypes (Table S3). These parameters were estimated using SBayesS implemented in the GCTB software (https://cnsgenomics.com/software/gctb/). For the analysis, we employed meta-analyzed GWAS data obtained from the comprehensive UKBB and BBJ datasets. Specifically, the number of bins included in the GWAS was equal to the total number of bins associated with the respective phenotype (Table S3). We used the LD reference panel provided by GCTB for UKBB GWAS. We constructed a shrunk LD matrix using 50,000 unrelated individuals from BBJ as the LD reference panel for BBJ GWAS. We used 4 chains for the Markov Chain Monte Carlo process, which calculated the Gelman-Rubin convergence diagnostic (also known as potential scale reduction factor) for these three parameters. We performed the analyses using other default settings for SBayesS. Given the potential convergence issues associated with Bayesian models, we deemed a threshold value of less than 1.2 for the Gelman-Rubin convergence diagnostic as indicative of good convergence for the estimated parameters.
UK biobank recent admixture ancestry analysis
To investigate one explanation for poor transferability of PRS across populations – genetic divergence between the discovery and target cohorts – we further explored whether PRS constructed from ancestry-specific summary statistics generated with local ancestry-informed GWAS in admixed populations improves predictive performance in underrepresented populations. Specifically, we used the Tractor method,19 accounting for both local ancestry and risk allele information, to run GWAS in two-way admixed AFR-EUR individuals from the UKBB (N = 4,576). The average AFR proportion was 62.9%. We used 4,022 unrelated relatively homogeneous AFR individuals, which are independent from the admixed individuals, as the target cohort.
We followed the same criteria for QC and individual selection as described in Atkinson et al.19 For sample QC, we excluded individuals that had <95% call rate, withdrew from the study, had closer than 2nd degree relatives present in the sample, or that had sex chromosome aneuploidies. For variant QC we restricted to biallelic SNPs with >90% call rate, HWE p value >10−6, and MAF of at least 0.5%. We selected two-way admixed AFR-EUR individuals from the UKBB by first using the PC loadings from the reference dataset described previously for ancestry inference (1KG + HGDP) to project UKBB individuals into the same PC space. We applied the same random forest ancestry classifier described previously to the projected UK Biobank PCA data and assigned AFR ancestry if the probability was >50%. We restricted to only two-way admixed AFR-EUR ancestry individuals by selecting those individuals assigned the ‘AFR’ population label, then filtering to those with at least 12.5% European ancestry, at least 10% African ancestry, and who did not deviate more than 1 standard deviation from the AFR-EUR cline based on their PC loadings. This process resulted in 4,576 individuals.
We ran local ancestry deconvolution on this set of admixed individuals using RFmix v218 with 1 EM iteration and a window size of 0.2 cM with the HapMap combined recombination map56 to inform switch locations. The -n 5 flag (terminal node size for random forest trees) was included to account for an unequal number of reference individuals per reference population. We used the --reanalyze-reference flag, which recalculates admixture in the reference samples for improved ability to distinguish ancestries. As a reference panel, we used continental AFR and EUR individuals from the 1KG.
Subsequently, we performed GWAS for the 17 quantitative traits utilizing the Tractor method on the 4,576 individuals with mixed AFR-EUR ancestry from the UKBB. This analysis yielded the generation of ancestry-specific summary statistics for the AFR (AFRTractor) and EUR (EURTractor) ancestry components. To evaluate the performance of PRS in the UKBB-AFR, we developed PRS using Tractor GWAS. Furthermore, we compared these local-ancestry informed PRS with those derived from GWAS conducted using standard methodologies. Specifically, we constructed PRS using GWAS performed on the same set of admixed individuals utilizing the simple linear regression model (ADMStandard). Additionally, GWAS summary statistics obtained from UKBB (EURstandard, N = 320,000) from the previous section were utilized, and a meta-analysis was conducted to combine the AFRTractor with EURstandard (Metastandard, N = 324,576). We constructed PRS based on HapMap3 SNPs, as previous studies have shown comparable performance between using reliable HapMap3 SNPs exclusively and the use of genome-wide SNPs.7,57 Additionally, we constructed weighted PRS by incorporating GWAS of AFRTractor and EURStandard, for P + T, PRS-CS and PRS-CSx, respectively. Considering the ancestry composition of the discovery GWAS, we used different sets of reference panels for each respective GWAS. Specifically, we used 1KG-EUR as the LD reference panel for EURTractor, EURstandard and Metastandard, while using 1KG-AFR for AFRTractor. We used an in-sample LD panel for ADMStandard. We calculated the predictive accuracy in the UKBB-AFR using incremental R2 as described above. We repeated the process 100 times and reported the standard error of predictive accuracy across 100 estimates.
Given that heritability bounds predictive accuracy, which can vary among populations and contexts, we also compared SNP-based heritability estimates between the AFR and EUR populations in the Pan-UK Biobank Project (https://pan.ukbb.broadinstitute.org/docs/heritability/index.html).
Acknowledgments
A.R.M. and Y.W. are supported by NIH (K99/R00MH117229 to A.R.M.) and by the European Union’s Horizon 2020 research and innovation program under grant agreement 101016775. A.R.M. is also supported by U01HG011719. H.H. acknowledges support from NIDDK K01DK114379, NIDDK 1R01DK129364, NIMH U01MH109539, the Zhengxu and Ying He Foundation, and the Stanley Center for Psychiatric Research. E.G.A. is supported by K01MH121659 from NIMH, the Caroline Wiess Law Fund for Research in Molecular Medicine, and the ARCO Foundation Young Teacher-Investigator Fund at Baylor College of Medicine. P.T. is supported by NIH/NIA (R00 AG062787) and by the Good Ventures Foundation (010623-00001).
Author contributions
Conceptualization, Y.W., A.R.M., E.G.A., and M. Kanai; formal analysis, Y.W., M. Kanai., T.T., M. Kamariza., K.Y., W.Z., and P.T.; writing – original draft, Y.W., A.R.M., E.G.A., M. Kanai., and T.T.; writing – review & editing, Y.W., M. Kanai., T.T., M. Kamariza, K.T., K.Y., W.Z., Y.O., H.H., P.T., E.G.A., and A.R.M.
Declaration of interests
H.H. received consultancy fees from Ono Pharmaceutical and honorarium from Xian Janssen Pharmaceutical.
Published: September 14, 2023
Footnotes
Supplemental information can be found online at https://doi.org/10.1016/j.xgen.2023.100408.
Contributor Information
Ying Wang, Email: yiwang@broadinstitute.org.
Alicia R. Martin, Email: armartin@broadinstitute.org.
Supplemental information
Data and code availability
1000 Genome Phase 3 data can be accessed at ftp://ftp.1000genomes.ebi.ac.uk/vol1/ftp/data_collections/1000_genomes_project/data. We used UK Biobank data via application 31063. The software used in this study can be found at: Plink (https://www.cog-genomics.org/plink/), PRS-CS (https://github.com/getian107/PRScs), PRS-CSx (https://github.com/getian107/PRScsx), Tractor (https://github.com/Atkinson-Lab/Tractor), HapGen2 (https://mathgen.stats.ox.ac.uk/genetics_software/hapgen/hapgen2.html) and SBayesS/GCTB (https://cnsgenomics.com/software/gctb/). The Pan UK Biobank Project can be accessed at: Pan-UK Biobank Project https://pan.ukbb.broadinstitute.org. The codes used in this study have been deposited to https://doi.org/10.5281/zenodo.8218174.
References
- 1.Inouye M., Abraham G., Nelson C.P., Wood A.M., Sweeting M.J., Dudbridge F., Lai F.Y., Kaptoge S., Brozynska M., Wang T., et al. Genomic Risk Prediction of Coronary Artery Disease in 480,000 Adults: Implications for Primary Prevention. J. Am. Coll. Cardiol. 2018;72:1883–1893. doi: 10.1016/j.jacc.2018.07.079. [DOI] [PMC free article] [PubMed] [Google Scholar]
- 2.Khera A.V., Chaffin M., Aragam K.G., Haas M.E., Roselli C., Choi S.H., Natarajan P., Lander E.S., Lubitz S.A., Ellinor P.T., Kathiresan S. Genome-wide polygenic scores for common diseases identify individuals with risk equivalent to monogenic mutations. Nat. Genet. 2018;50:1219–1224. doi: 10.1038/s41588-018-0183-z. [DOI] [PMC free article] [PubMed] [Google Scholar]
- 3.Mars N., Widén E., Kerminen S., Meretoja T., Pirinen M., Della Briotta Parolo P., Palta P., FinnGen. Palotie A., Kaprio J., et al. The role of polygenic risk and susceptibility genes in breast cancer over the course of life. Nat. Commun. 2020;11:6383. doi: 10.1038/s41467-020-19966-5. [DOI] [PMC free article] [PubMed] [Google Scholar]
- 4.Maas P., Barrdahl M., Joshi A.D., Auer P.L., Gaudet M.M., Milne R.L., Schumacher F.R., Anderson W.F., Check D., Chattopadhyay S., et al. Breast Cancer Risk From Modifiable and Nonmodifiable Risk Factors Among White Women in the United States. JAMA Oncol. 2016;2:1295–1302. doi: 10.1001/jamaoncol.2016.1025. [DOI] [PMC free article] [PubMed] [Google Scholar]
- 5.Craig J.E., Han X., Qassim A., Hassall M., Cooke Bailey J.N., Kinzy T.G., Khawaja A.P., An J., Marshall H., Gharahkhani P., et al. Multitrait analysis of glaucoma identifies new risk loci and enables polygenic prediction of disease susceptibility and progression. Nat. Genet. 2020;52:160–166. doi: 10.1038/s41588-019-0556-y. [DOI] [PMC free article] [PubMed] [Google Scholar]
- 6.Majara L., Kalungi A., Koen N., Tsuo K., Wang Y., Gupta R., Nkambule L.L., Zar H., Stein D.J., Kinyanda E., et al. Low and differential polygenic score generalizability among African populations due largely to genetic diversity. HGG Adv. 2023;4 doi: 10.1016/j.xhgg.2023.100184. [DOI] [PMC free article] [PubMed] [Google Scholar]
- 7.Wang Y., Namba S., Lopera E., Kerminen S., Tsuo K., Läll K., Kanai M., Zhou W., Wu K.-H., Favé M.J., et al. Global Biobank analyses provide lessons for developing polygenic risk scores across diverse cohorts. Cell Genom. 2023;3 doi: 10.1016/j.xgen.2022.100241. [DOI] [PMC free article] [PubMed] [Google Scholar]
- 8.Ruan Y., Lin Y.-F., Feng Y.-C.A., Chen C.-Y., Lam M., Guo Z., Stanley Global Asia Initiatives. He L., Sawa A., Martin A.R., et al. Improving polygenic prediction in ancestrally diverse populations. Nat. Genet. 2022;54:573–580. doi: 10.1038/s41588-022-01054-7. [DOI] [PMC free article] [PubMed] [Google Scholar]
- 9.Wang Y., Guo J., Ni G., Yang J., Visscher P.M., Yengo L. Theoretical and empirical quantification of the accuracy of polygenic scores in ancestry divergent populations. Nat. Commun. 2020;11:3865. doi: 10.1038/s41467-020-17719-y. [DOI] [PMC free article] [PubMed] [Google Scholar]
- 10.Guo J., Bakshi A., Wang Y., Jiang L., Yengo L., Goddard M.E., Visscher P.M., Yang J. Quantifying genetic heterogeneity between continental populations for human height and body mass index. Sci. Rep. 2021;11:5240. doi: 10.1038/s41598-021-84739-z. [DOI] [PMC free article] [PubMed] [Google Scholar]
- 11.Shi H., Burch K.S., Johnson R., Freund M.K., Kichaev G., Mancuso N., Manuel A.M., Dong N., Pasaniuc B. Localizing Components of Shared Transethnic Genetic Architecture of Complex Traits from GWAS Summary Data. Am. J. Hum. Genet. 2020;106:805–817. doi: 10.1016/j.ajhg.2020.04.012. [DOI] [PMC free article] [PubMed] [Google Scholar]
- 12.Ding Y., Hou K., Xu Z., Pimplaskar A., Petter E., Boulier K., Privé F., Vilhjálmsson B.J., Olde Loohuis L.M., Pasaniuc B. Polygenic scoring accuracy varies across the genetic ancestry continuum. Nature. 2023;618:774–781. doi: 10.1038/s41586-023-06079-4. [DOI] [PMC free article] [PubMed] [Google Scholar]
- 13.Pfaff C.L., Parra E.J., Bonilla C., Hiester K., McKeigue P.M., Kamboh M.I., Hutchinson R.G., Ferrell R.E., Boerwinkle E., Shriver M.D. Population structure in admixed populations: effect of admixture dynamics on the pattern of linkage disequilibrium. Am. J. Hum. Genet. 2001;68:198–207. doi: 10.1086/316935. [DOI] [PMC free article] [PubMed] [Google Scholar]
- 14.Pritchard J.K., Przeworski M. Linkage disequilibrium in humans: models and data. Am. J. Hum. Genet. 2001;69:1–14. doi: 10.1086/321275. [DOI] [PMC free article] [PubMed] [Google Scholar]
- 15.Fatumo S., Chikowore T., Choudhury A., Ayub M., Martin A.R., Kuchenbaecker K. A roadmap to increase diversity in genomic studies. Nat. Med. 2022;28:243–250. doi: 10.1038/s41591-021-01672-4. [DOI] [PMC free article] [PubMed] [Google Scholar]
- 16.Hou K., Ding Y., Xu Z., Wu Y., Bhattacharya A., Mester R., Belbin G.M., Buyske S., Conti D.V., Darst B.F., et al. Causal effects on complex traits are similar for common variants across segments of different continental ancestries within admixed individuals. Nat. Genet. 2023;55:549–558. doi: 10.1038/s41588-023-01338-6. [DOI] [PMC free article] [PubMed] [Google Scholar]
- 17.Kim J., Edge M.D., Goldberg A., Rosenberg N.A. Skin deep: The decoupling of genetic admixture levels from phenotypes that differed between source populations. Am. J. Phys. Anthropol. 2021;175:406–421. doi: 10.1002/ajpa.24261. [DOI] [PMC free article] [PubMed] [Google Scholar]
- 18.Maples B.K., Gravel S., Kenny E.E., Bustamante C.D. RFMix: a discriminative modeling approach for rapid and robust local-ancestry inference. Am. J. Hum. Genet. 2013;93:278–288. doi: 10.1016/j.ajhg.2013.06.020. [DOI] [PMC free article] [PubMed] [Google Scholar]
- 19.Atkinson E.G., Maihofer A.X., Kanai M., Martin A.R., Karczewski K.J., Santoro M.L., Ulirsch J.C., Kamatani Y., Okada Y., Finucane H.K., et al. Tractor uses local ancestry to enable the inclusion of admixed individuals in GWAS and to boost power. Nat. Genet. 2021;53:195–204. doi: 10.1038/s41588-020-00766-y. [DOI] [PMC free article] [PubMed] [Google Scholar]
- 20.Pasaniuc B., Zaitlen N., Lettre G., Chen G.K., Tandon A., Kao W.H.L., Ruczinski I., Fornage M., Siscovick D.S., Zhu X., et al. Enhanced statistical tests for GWAS in admixed populations: assessment using African Americans from CARe and a Breast Cancer Consortium. PLoS Genet. 2011;7 doi: 10.1371/journal.pgen.1001371. [DOI] [PMC free article] [PubMed] [Google Scholar]
- 21.Ramirez A.H., Sulieman L., Schlueter D.J., Halvorson A., Qian J., Ratsimbazafy F., Loperena R., Mayo K., Basford M., Deflaux N., et al. The All of Us Research Program: Data quality, utility, and diversity. Patterns (N Y) 2022;3 doi: 10.1016/j.patter.2022.100570. [DOI] [PMC free article] [PubMed] [Google Scholar]
- 22.Weissbrod O., Kanai M., Shi H., Gazal S., Peyrot W.J., Khera A.V., Okada Y., Biobank Japan Project. Martin A.R., Finucane H.K., Price A.L. Leveraging fine-mapping and multipopulation training data to improve cross-population polygenic risk scores. Nat. Genet. 2022;54:450–458. doi: 10.1038/s41588-022-01036-9. [DOI] [PMC free article] [PubMed] [Google Scholar]
- 23.Zhang H., Zhan J., Jin J., Ahearn T.U., Yu Z., O’Connell J., Jiang Y., Chen T., Garcia-Closas M., Lin X., et al. Novel Methods for Multi-ancestry Polygenic Prediction and their Evaluations in 3.7 Million Individuals of Diverse Ancestry. bioRxiv. 2022 doi: 10.1101/2022.03.24.485519. Preprint at. [DOI] [Google Scholar]
- 24.Wray N.R., Yang J., Hayes B.J., Price A.L., Goddard M.E., Visscher P.M. Pitfalls of predicting complex traits from SNPs. Nat. Rev. Genet. 2013;14:507–515. doi: 10.1038/nrg3457. [DOI] [PMC free article] [PubMed] [Google Scholar]
- 25.Daetwyler H.D., Villanueva B., Woolliams J.A. Accuracy of predicting the genetic risk of disease using a genome-wide approach. PLoS One. 2008;3 doi: 10.1371/journal.pone.0003395. [DOI] [PMC free article] [PubMed] [Google Scholar]
- 26.Nagai A., Hirata M., Kamatani Y., Muto K., Matsuda K., Kiyohara Y., Ninomiya T., Tamakoshi A., Yamagata Z., Mushiroda T., et al. Overview of the BioBank Japan Project: Study design and profile. J. Epidemiol. 2017;27:S2–S8. doi: 10.1016/j.je.2016.12.005. [DOI] [PMC free article] [PubMed] [Google Scholar]
- 27.Bycroft C., Freeman C., Petkova D., Band G., Elliott L.T., Sharp K., Motyer A., Vukcevic D., Delaneau O., O’Connell J., et al. The UK Biobank resource with deep phenotyping and genomic data. Nature. 2018;562:203–209. doi: 10.1038/s41586-018-0579-z. [DOI] [PMC free article] [PubMed] [Google Scholar]
- 28.Morales J., Welter D., Bowler E.H., Cerezo M., Harris L.W., McMahon A.C., Hall P., Junkins H.A., Milano A., Hastings E., et al. A standardized framework for representation of ancestry data in genomics studies, with application to the NHGRI-EBI GWAS Catalog. Genome Biol. 2018;19:21. doi: 10.1186/s13059-018-1396-2. [DOI] [PMC free article] [PubMed] [Google Scholar]
- 29.Zeng J., Xue A., Jiang L., Lloyd-Jones L.R., Wu Y., Wang H., Zheng Z., Yengo L., Kemper K.E., Goddard M.E., et al. Widespread signatures of natural selection across human complex traits and functional genomic categories. Nat. Commun. 2021;12:1164. doi: 10.1038/s41467-021-21446-3. [DOI] [PMC free article] [PubMed] [Google Scholar]
- 30.Berg J.J., Harpak A., Sinnott-Armstrong N., Joergensen A.M., Mostafavi H., Field Y., Boyle E.A., Zhang X., Racimo F., Pritchard J.K., Coop G. Reduced signal for polygenic adaptation of height in UK Biobank. Elife. 2019;8 doi: 10.7554/eLife.39725. [DOI] [PMC free article] [PubMed] [Google Scholar]
- 31.Sohail M., Maier R.M., Ganna A., Bloemendal A., Martin A.R., Turchin M.C., Chiang C.W., Hirschhorn J., Daly M.J., Patterson N., et al. Polygenic adaptation on height is overestimated due to uncorrected stratification in genome-wide association studies. Elife. 2019;8 doi: 10.7554/eLife.39702. [DOI] [PMC free article] [PubMed] [Google Scholar]
- 32.Martin A.R., Kanai M., Kamatani Y., Okada Y., Neale B.M., Daly M.J. Clinical use of current polygenic risk scores may exacerbate health disparities. Nat. Genet. 2019;51:584–591. doi: 10.1038/s41588-019-0379-x. [DOI] [PMC free article] [PubMed] [Google Scholar]
- 33.Lehmann B., Mackintosh M., McVean G., Holmes C. Optimal strategies for learning multi-ancestry polygenic scores vary across traits. Nat. Commun. 2023;14:4023. doi: 10.1038/s41467-023-38930-7. [DOI] [PMC free article] [PubMed] [Google Scholar]
- 34.Márquez-Luna C., Loh P.-R., A.L., SIGMA Type 2 Diabetes Consortium, Price. South Asian Type 2 Diabetes SAT2D Consortium Multiethnic polygenic risk scores improve risk prediction in diverse populations. Genet. Epidemiol. 2017;41:811–823. doi: 10.1002/gepi.22083. [DOI] [PMC free article] [PubMed] [Google Scholar]
- 35.Graham S.E., Clarke S.L., Wu K.-H.H., Kanoni S., Zajac G.J.M., Ramdas S., Surakka I., Ntalla I., Vedantam S., Winkler T.W., et al. The power of genetic diversity in genome-wide association studies of lipids. Nature. 2021;600:675–679. doi: 10.1038/s41586-021-04064-3. [DOI] [PMC free article] [PubMed] [Google Scholar]
- 36.de Vlaming R., Okbay A., Rietveld C.A., Johannesson M., Magnusson P.K.E., Uitterlinden A.G., van Rooij F.J.A., Hofman A., Groenen P.J.F., Thurik A.R., Koellinger P.D. Meta-GWAS Accuracy and Power (MetaGAP) Calculator Shows that Hiding Heritability Is Partially Due to Imperfect Genetic Correlations across Studies. PLoS Genet. 2017;13 doi: 10.1371/journal.pgen.1006495. [DOI] [PMC free article] [PubMed] [Google Scholar]
- 37.Ni G., Zeng J., Revez J.A., Wang Y., Zheng Z., Ge T., Restuadi R., Kiewa J., Nyholt D.R., Coleman J.R.I., et al. A Comparison of Ten Polygenic Score Methods for Psychiatric Disorders Applied Across Multiple Cohorts. Biol. Psychiatr. 2021;90:611–620. doi: 10.1016/j.biopsych.2021.04.018. [DOI] [PMC free article] [PubMed] [Google Scholar]
- 38.Lloyd-Jones L.R., Zeng J., Sidorenko J., Yengo L., Moser G., Kemper K.E., Wang H., Zheng Z., Magi R., Esko T., et al. Improved polygenic prediction by Bayesian multiple regression on summary statistics. Nat. Commun. 2019;10:5086. doi: 10.1038/s41467-019-12653-0. [DOI] [PMC free article] [PubMed] [Google Scholar]
- 39.Ge T., Chen C.-Y., Ni Y., Feng Y.-C.A., Smoller J.W. Polygenic prediction via Bayesian regression and continuous shrinkage priors. Nat. Commun. 2019;10:1776. doi: 10.1038/s41467-019-09718-5. [DOI] [PMC free article] [PubMed] [Google Scholar]
- 40.Daly M.J., Elzur R., Global Biobank Meta-analysis Initiative. Zhou W., Kanai M., Finucane H.K., Rasheed H., Tsuo K., Hirbo J.B., Wang Y., et al. Meta-analysis fine-mapping is often miscalibrated at single-variant resolution. Cell Genom. 2022;2 doi: 10.1016/j.xgen.2022.100210. [DOI] [PMC free article] [PubMed] [Google Scholar]
- 41.Cai M., Xiao J., Zhang S., Wan X., Zhao H., Chen G., Yang C. A unified framework for cross-population trait prediction by leveraging the genetic correlation of polygenic traits. Am. J. Hum. Genet. 2021;108:632–655. doi: 10.1016/j.ajhg.2021.03.002. [DOI] [PMC free article] [PubMed] [Google Scholar]
- 42.Coram M.A., Fang H., Candille S.I., Assimes T.L., Tang H. Leveraging Multi-ethnic Evidence for Risk Assessment of Quantitative Traits in Minority Populations. Am. J. Hum. Genet. 2017;101:218–226. doi: 10.1016/j.ajhg.2017.06.015. [DOI] [PMC free article] [PubMed] [Google Scholar]
- 43.1000 Genomes Project Consortium. Auton A., Brooks L.D., Durbin R.M., Garrison E.P., Kang H.M., Korbel J.O., Marchini J.L., McCarthy S., McVean G.A., Abecasis G.R. A global reference for human genetic variation. Nature. 2015;526:68–74. doi: 10.1038/nature15393. [DOI] [PMC free article] [PubMed] [Google Scholar]
- 44.Chang C.C., Chow C.C., Tellier L.C., Vattikuti S., Purcell S.M., Lee J.J. Second-generation PLINK: rising to the challenge of larger and richer datasets. GigaScience. 2015;4:7. doi: 10.1186/s13742-015-0047-8. [DOI] [PMC free article] [PubMed] [Google Scholar]
- 45.Su Z., Marchini J., Donnelly P. HAPGEN2: simulation of multiple disease SNPs. Bioinformatics. 2011;27:2304–2305. doi: 10.1093/bioinformatics/btr341. [DOI] [PMC free article] [PubMed] [Google Scholar]
- 46.Manichaikul A., Mychaleckyj J.C., Rich S.S., Daly K., Sale M., Chen W.-M. Robust relationship inference in genome-wide association studies. Bioinformatics. 2010;26:2867–2873. doi: 10.1093/bioinformatics/btq559. [DOI] [PMC free article] [PubMed] [Google Scholar]
- 47.Willer C.J., Li Y., Abecasis G.R. METAL: fast and efficient meta-analysis of genomewide association scans. Bioinformatics. 2010;26:2190–2191. doi: 10.1093/bioinformatics/btq340. [DOI] [PMC free article] [PubMed] [Google Scholar]
- 48.Li J.Z., Absher D.M., Tang H., Southwick A.M., Casto A.M., Ramachandran S., Cann H.M., Barsh G.S., Feldman M., Cavalli-Sforza L.L., Myers R.M. Worldwide human relationships inferred from genome-wide patterns of variation. Science. 2008;319:1100–1104. doi: 10.1126/science.1153717. [DOI] [PubMed] [Google Scholar]
- 49.Conomos M.P., Reiner A.P., Weir B.S., Thornton T.A. Model-free Estimation of Recent Genetic Relatedness. Am. J. Hum. Genet. 2016;98:127–148. doi: 10.1016/j.ajhg.2015.11.022. [DOI] [PMC free article] [PubMed] [Google Scholar]
- 50.Loh P.-R., Palamara P.F., Price A.L. Fast and accurate long-range phasing in a UK Biobank cohort. Nat. Genet. 2016;48:811–816. doi: 10.1038/ng.3571. [DOI] [PMC free article] [PubMed] [Google Scholar]
- 51.Das S., Forer L., Schönherr S., Sidore C., Locke A.E., Kwong A., Vrieze S.I., Chew E.Y., Levy S., McGue M., et al. Next-generation genotype imputation service and methods. Nat. Genet. 2016;48:1284–1287. doi: 10.1038/ng.3656. [DOI] [PMC free article] [PubMed] [Google Scholar]
- 52.Akiyama M., Ishigaki K., Sakaue S., Momozawa Y., Horikoshi M., Hirata M., Matsuda K., Ikegawa S., Takahashi A., Kanai M., et al. Characterizing rare and low-frequency height-associated variants in the Japanese population. Nat. Commun. 2019;10:4393. doi: 10.1038/s41467-019-12276-5. [DOI] [PMC free article] [PubMed] [Google Scholar]
- 53.Sakaue S., Kanai M., Tanigawa Y., Karjalainen J., Kurki M., Koshiba S., Narita A., Konuma T., Yamamoto K., Akiyama M., et al. A cross-population atlas of genetic associations for 220 human phenotypes. Nat. Genet. 2021;53:1415–1424. doi: 10.1038/s41588-021-00931-x. [DOI] [PMC free article] [PubMed] [Google Scholar]
- 54.Kanai M., Akiyama M., Takahashi A., Matoba N., Momozawa Y., Ikeda M., Iwata N., Ikegawa S., Hirata M., Matsuda K., et al. Genetic analysis of quantitative traits in the Japanese population links cell types to complex human diseases. Nat. Genet. 2018;50:390–400. doi: 10.1038/s41588-018-0047-6. [DOI] [PubMed] [Google Scholar]
- 55.Wray N.R., Kemper K.E., Hayes B.J., Goddard M.E., Visscher P.M. Complex Trait Prediction from Genome Data: Contrasting EBV in Livestock to PRS in Humans: Genomic Prediction. Genetics. 2019;211:1131–1141. doi: 10.1534/genetics.119.301859. [DOI] [PMC free article] [PubMed] [Google Scholar]
- 56.International HapMap 3 Consortium. Altshuler D.M., Gibbs R.A., Peltonen L., Altshuler D.M., Gibbs R.A., Peltonen L., Dermitzakis E., Schaffner S.F., Yu F., et al. Integrating common and rare genetic variation in diverse human populations. Nature. 2010;467:52–58. doi: 10.1038/nature09298. [DOI] [PMC free article] [PubMed] [Google Scholar]
- 57.Privé F., Vilhjálmsson B.J., Aschard H., Blum M.G.B. Making the Most of Clumping and Thresholding for Polygenic Scores. Am. J. Hum. Genet. 2019;105:1213–1221. doi: 10.1016/j.ajhg.2019.11.001. [DOI] [PMC free article] [PubMed] [Google Scholar]
Associated Data
This section collects any data citations, data availability statements, or supplementary materials included in this article.
Supplementary Materials
Data Availability Statement
1000 Genome Phase 3 data can be accessed at ftp://ftp.1000genomes.ebi.ac.uk/vol1/ftp/data_collections/1000_genomes_project/data. We used UK Biobank data via application 31063. The software used in this study can be found at: Plink (https://www.cog-genomics.org/plink/), PRS-CS (https://github.com/getian107/PRScs), PRS-CSx (https://github.com/getian107/PRScsx), Tractor (https://github.com/Atkinson-Lab/Tractor), HapGen2 (https://mathgen.stats.ox.ac.uk/genetics_software/hapgen/hapgen2.html) and SBayesS/GCTB (https://cnsgenomics.com/software/gctb/). The Pan UK Biobank Project can be accessed at: Pan-UK Biobank Project https://pan.ukbb.broadinstitute.org. The codes used in this study have been deposited to https://doi.org/10.5281/zenodo.8218174.