

Summary
Genomic and transcriptomic analysis has furthered our understanding of many tumors. Yet, thyroid cancer management is largely guided by staging and histology, with few molecular prognostic and treatment biomarkers. Here, we utilize a large cohort of 251 patients with 312 samples from two tertiary medical centers and perform DNA/RNA sequencing, spatial transcriptomics, and multiplex immunofluorescence to identify biomarkers of aggressive thyroid malignancy. We identify high-risk mutations and discover a unique molecular signature of aggressive disease, the Molecular Aggression and Prediction (MAP) score, which provides improved prognostication over high-risk mutations alone. The MAP score is enriched for genes involved in epithelial de-differentiation, cellular division, and the tumor microenvironment. The MAP score also identifies aggressive tumors with lymphocyte-rich stroma that may benefit from immunotherapy. Future clinical profiling of the stromal microenvironment of thyroid cancer could improve prognostication, inform immunotherapy, and support development of novel therapeutics for thyroid cancer and other stroma-rich tumors.
Keywords: aggressive thyroid cancer, cancer-associated fibroblasts, tumor immune microenvironment, next-generation sequencing, molecular biomarkers, anaplastic thyroid carcinoma
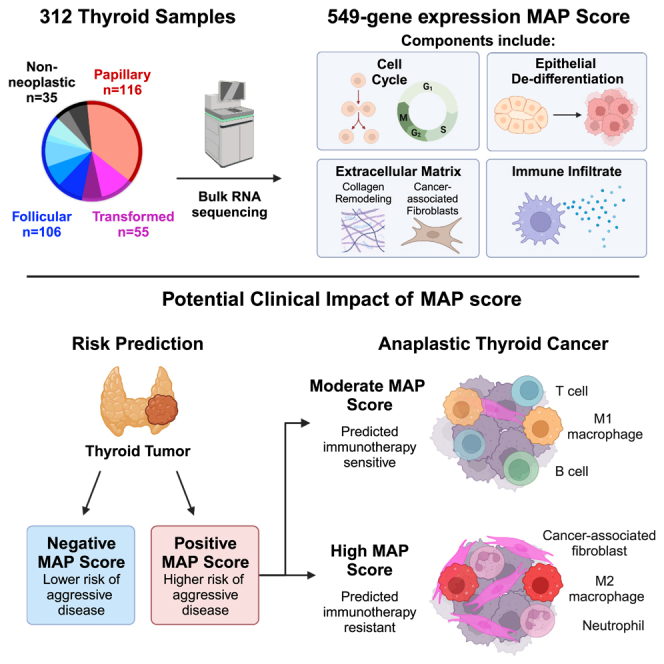
Graphical abstract
Highlights
-
•
Omics analysis to identify novel prognostic biomarkers in 312 thyroid lesions
-
•
Molecular Aggression and Prediction (MAP) score highlights the tumor microenvironment
-
•
MAP score combined with mutations may predict future thyroid cancer aggression
-
•
MAP score subdivides anaplastic tumors by predicted immunotherapy response
The thyroid tumor microenvironment is understudied and may provide novel biomarkers to inform disease progression. Xu et al. present a gene-expression-based signature score enriched for markers of tumor cell de-differentiation, cellular division, and tumor microenvironment populations that may predict aggressive thyroid cancer and immunotherapy response.
Introduction
Thyroid cancer is common, with both incidence and mortality rates increasing.1,2 Most malignant thyroid lesions are indolent, well-differentiated tumors such as papillary or follicular thyroid carcinomas (PTC and FTC, respectively). These tumors can be successfully treated with surgical resection of the thyroid followed by radioactive iodine.3,4 However, many thyroid cancers recur or progress after such standard-of-care treatment. Rarely, recurrence can even occur decades after initial therapy and may involve distant metastasis or transformation to poorly differentiated (PDTC) or anaplastic thyroid cancer (ATC).5 ATC is one of the most lethal cancers in existence. The median survival of patients with ATC is just 3–5 months—indicating a dire need to better understand drivers of thyroid cancer progression.6
DNA and RNA sequencing have revolutionized our understanding of many tumors, providing insight into underlying biology and drivers of aggressive disease. However, the genomic understanding of thyroid cancer has lagged behind other tumors. Until recently, thyroid cancer molecular testing was used almost exclusively for diagnostic purposes at the time of initial biopsy.3,7 Genomic studies have identified common driver mutations in well-differentiated thyroid cancers, allowing commercial genomic classifiers to distinguish malignant from benign lesions with high sensitivity, specificity, and accuracy.8,9,10,11,12,13 BRAF V600E and RAS mutations are mutually exclusive and represent the most common driver alterations in well-differentiated thyroid cancers. The frequency of these alterations has led to the molecular classification of thyroid cancers as either BRAF-like or RAS-like, based on the gene expression patterns of BRAF V600E and RAS-mutant PTCs.14 Other alterations detected by diagnostic molecular tests include gene fusions such as NTRK1/3, PAX8/PPARG, and RET; copy number alterations; microRNA dysregulation; and gene expression abnormalities.15,16,17
Despite these advances in molecular diagnostics, thyroid cancer prognostication and post-surgical treatment are still largely guided by clinical and histopathologic features. This cancer management is in stark contrast to the biomarker-driven personalized management of many other cancers, such as non-small cell lung cancer.18,19 The lack of molecular biomarker testing for thyroid cancer is due to our limited understanding of the drivers of advanced disease. While patients with BRAF-like tumors have slightly worse outcomes (5% mortality in BRAF-mutant PTC versus 1% in RAS-mutant PTC),20 the majority of BRAF-like thyroid cancers have an excellent prognosis. Recent large sequencing studies have implicated TP53, PIK3CA, and TERT promoter (TERTp) mutations in aggressive thyroid cancer, particularly in combination with BRAF V600E.21,22,23,24,25,26 This work has led to the development of the first commercial molecular-based test for high-risk disease.27 Despite this tremendous advance, there are still patients with recurrent, metastatic, and de-differentiated thyroid cancer that lack high-risk mutations. Additional biomarkers are needed to further enhance the risk-stratification and management of patients.
The role of the tumor microenvironment in cancer progression is an active area of investigation and has led to many advances in prognostication and therapy.28 However, there has been limited research in the microenvironment of thyroid cancer. To this end, recent work identified a subgroup of BRAF-like lesions enriched in cancer-associated fibroblasts (CAFs) that may have more aggressive behavior.29 Another study showed that in thyroid tumors driven by BRAF V600E mutation and PTEN loss, fibroblasts may promote progression by remodeling collagen in the tumor microenvironment.30 Other research has suggested roles of infiltrating immune cells such as macrophages in supporting aggressive thyroid cancer behaviors.31,32 As such, clinical trials are ongoing to evaluate the efficacy of checkpoint inhibitor therapy for anaplastic thyroid carcinoma.33,34,35,36,37,38 However, our knowledge of the stromal microenvironment across thyroid tumors remains limited.
In this study, we utilize a large patient cohort, enriched for aggressive thyroid tumors, from two tertiary medical centers and perform DNA/RNA sequencing, spatial transcriptomics, and multiplex immunofluorescence in order to identify and visualize biomarkers of aggressive thyroid malignancy. In doing so, we identify high-risk mutations as well as key stromal elements including CAFs and macrophages that are strongly associated with aggressive tumors and can be detected at the initial thyroid surgery. We generate a molecular signature, the Molecular Aggression and Prediction (MAP) score, which identifies tumor, stromal, and immune microenvironmental factors associated with aggressive disease. We demonstrate the successful use of this score, in combination with mutational profiling, to identify patients at risk for future aggressive thyroid cancer. Finally, we show the utility of this score in subdividing aggressive tumors that may respond to immunotherapy. Future clinical evaluation of the stromal microenvironment could potentially inform patient management and ultimately reduce thyroid cancer-related mortality.
Results
Mutational landscape of aggressive thyroid cancer
To identify gene mutations and fusions associated with aggressive thyroid cancer, we performed whole-exome and bulk RNA sequencing on 312 formalin-fixed paraffin-embedded (FFPE) resection samples from 251 patients with thyroid nodules, including non-neoplastic, neoplastic, and malignant lesions (Figures 1A and 1B) from two tertiary care centers. The cohort was enriched for aggressive lesions to include well-differentiated tumors with distant metastases and transformed thyroid cancers (ATCs and PDTCs). Samples from age-matched patients with well-differentiated cancers without distant metastases and patients with benign thyroid lesions were collected between the same date range (Figure 1A, Table S1). We next categorized patients as having either “indolent” or “aggressive” disease (Figure 1B, detailed definitions in STAR Methods). Sequencing analyses identified common driver thyroid cancer alterations at frequencies comparable to those previously reported (Figure 1C, Table S2).10,11,12,13,27
Figure 1.

Mutations associated with aggressive thyroid cancer
(A) Cohort summary quantifying number of samples within each diagnosis. Abbreviations: MNG, multinodular goiter; HT, Hashimoto thyroiditis; FA, follicular adenoma; OA, oncocytic adenoma; NIFTP, noninvasive follicular thyroid neoplasm with papillary-like nuclear features; EFVPTC, encapsulated follicular variant papillary thyroid carcinoma, OTC, oncocytic thyroid carcinoma; FTC, follicular thyroid carcinoma; PTC, papillary thyroid carcinoma; IFVPTC, infiltrative follicular variant papillary thyroid carcinoma, PDTC, poorly differentiated thyroid carcinoma; ATC, anaplastic thyroid carcinoma.
(B) Schematic representation showing patient disease categorization as well as pipeline used for sequencing data collection. 312 formalin-fixed, paraffin-embedded (FFPE) resection samples underwent high-throughput sequencing.
(C) Oncoplot showing mutational landscape of malignant thyroid lesions. The 20 most frequently mutated genes after filtering are displayed. Annotation bars above show diagnosis, tissue location of the lesion sequenced, sex of the patient, age of the patient at surgery, and patient disease categorization. Detected thyroid cancer fusions are also shown.
(D–F) Progression-free survival (PFS) plots for patients with malignant thyroid lesions with and without TERT promoter mutation (D), TP53 mutation (E), and PIK3CA mutation (F). p values were calculated with log rank test.
We assessed the frequency of TERTp, TP53, and PIK3CA mutations in our cohort, as they are known to be associated with distant metastasis27 and transformed thyroid cancers such as PDTC and ATC.39,40,41 Benign lesions were negative for these high-risk mutations, as expected (Table S2). TP53 mutations were most common in ATC tumors (27%). TERTp mutations were identified in patients categorized with “aggressive” disease across histologic subtypes: PDTC (33%), ATC (31%), FTC (20%), infiltrative follicular variant papillary thyroid carcinoma (IFVPTC, 14%), and PTC (40%). PIK3CA mutations were seen in PTC (9%), PDTC (19%), and ATC (12%, Table S2). Kaplan-Meier curves confirmed that TERTp, TP53, and PIK3CA mutations were all significantly correlated with shorter progression-free survival (PFS) and overall survival (Figures 1D–1F and S1A–S1C). Notably, ∼42% of well-differentiated tumor samples from patients with aggressive disease lacked mutations in TERTp, TP53, or PIK3CA. Taken together, our mutational analyses indicate that while TERTp, TP53, and PIK3CA are significantly associated with aggressive disease, there is still a significant proportion of clinically aggressive thyroid cancers that lack these common high-risk mutations.
Molecular Aggression and Prediction (MAP) score
We next explored previously identified gene expression signatures to assess their association with aggressive disease (Figures 2, S2, and S3). Since BRAF mutational status is associated with slightly worse outcomes in some studies,20 we began by calculating the BRAF-RAS score (BRS) for each tumor, per The Cancer Genome Atlas (TCGA) classification (Figures 2A, 2B, and S2A). Approximately half of our aggressive disease samples were BRAF-like (53%). However, for well-differentiated cancer samples, BRAF-like status alone was not significantly associated with worse PFS (Figure S2B). When transformed tumors (PDTC and ATC) were included, BRAF-like status was associated with shorter PFS, consistent with highly lethal ATCs being predominantly BRAF-like (Figure S2C). MAPK and PI3K signaling pathways, known to be upregulated in BRAF-like and RAS-like tumors with aggressive disease, were upregulated in transformed tumors. Thyroid differentiation genes were downregulated in transformed tumors and correlated with BRAF-like status, as expected (Figure S3). While these signatures correlated with worse survival of transformed tumors, they did not significantly predict aggressive disease in well-differentiated tumors.
Figure 2.

Molecular Aggression and Prediction (MAP) score
(A) Diagram outlining BRAF-RAS score (BRS) classification method. Positive BRS lesions were categorized as RAS-like, and negative BRS lesions were classified as BRAF-like.
(B) Boxplots showing BRS from local disease samples. Color indicates clinical behavior (pink, aggressive; black, indolent; gray, no clinical follow-up after sample collection). Abbreviations: FA, follicular adenoma; OA, oncocytic adenoma; FTC, follicular thyroid carcinoma; OTC, oncocytic thyroid carcinoma; EFVPTC, encapsulated follicular variant papillary thyroid carcinoma, NIFTP, noninvasive follicular thyroid neoplasm with papillary-like nuclear features; PTC, papillary thyroid carcinoma; IFVPTC, infiltrative follicular variant papillary thyroid carcinoma, PDTC, poorly differentiated thyroid carcinoma; ATC, anaplastic thyroid carcinoma.
(C) Diagram outlining method for identifying genes enriched in samples from patients with aggressive vs. indolent disease.
(D) Venn diagrams showing the overlap of genes that are upregulated in BRAF-like lesions (red), RAS-like lesions (blue), and aggressive disease lesions (gray). Thresholds for upregulation was an adjusted p value <0.05 and fold change of ≥4 (aggressive disease upregulated for BRAF-like Venn diagram) or ≥2 (BRAF-like upregulated, RAS-like upregulated, and aggressive disease upregulated for RAS-like Venn diagram).
(E) Boxplots of MAP score calculated from the 549 genes that overlap between BRAF-like and aggressive lesions in (C) (FTC, follicular thyroid carcinoma; OTC, oncocytic thyroid carcinoma; EFVPTC, encapsulated follicular variant papillary thyroid carcinoma, NIFTP, noninvasive follicular thyroid neoplasm with papillary-like nuclear features; PTC, papillary thyroid carcinoma; IFVPTC, infiltrative follicular variant papillary thyroid carcinoma, PDTC, poorly differentiated thyroid carcinoma; ATC, anaplastic thyroid carcinoma). Pink dots indicate lesions from patients with aggressive disease.
(F) Boxplots of MAP score in TCGA samples plotted by histology, extrathyroidal extension, and disease stage. Three outliers for MAP score were omitted for improved visualization of plots. p values calculated with Kruskal-Wallis test with pairwise Wilcoxon rank-sum test and Bonferroni’s correction.
(G) Gene ontology results for the 549 genes comprising MAP score, showing enrichment of extracellular matrix, immune, cell cycle, and epithelial differentiation processes. Statistical analysis of fold enrichment was performed with Fisher’s exact with false discovery rate correction.
(H) Summary diagram of MAP score components predicted to be enriched in gene ontology analysis.
To discover novel gene signatures associated with outcome, we performed differential gene expression analysis on tumors from patients categorized with either indolent or aggressive disease (Figure 2C). As well-differentiated tumors with BRAF-like gene expression have slightly worse prognosis, we also performed differential gene expression analysis on BRAF-like or RAS-like tumors. When comparing upregulates genes in BRAF-like and aggressive disease samples, we observed a greater gene overlap in aggressive and BRAF-like samples than with RAS-like samples (549 genes versus 8 genes, Figure 2D; Table S3). To further discriminate genes associated with both BRAF-like tumors and aggressive disease, we created a gene expression signature using the 549 genes upregulated in both aggressive and BRAF-like samples, termed the Molecular Aggression and Prediction (MAP) score. We compared this score across tumors from different histologic subtypes in our cohort. Positive MAP scores (>0) were seen for all ATCs, the majority of PDTCs, and a portion of well-differentiated thyroid cancers, predominantly from patients with aggressive disease (Figure 2E). We further validated the MAP score on a large external cohort of well-differentiated PTCs within TCGA. Positive MAP score correlated with aggressive PTC histologic variants, such as tall cell and diffuse sclerosing, as well as adverse pathologic features such as extrathyroidal extension and advanced disease stage (Figure 2F).
Gene ontology analysis of the MAP score genes was then used to better understand the biologic processes unique to these aggressive MAP-positive tumors. MAP-positive cancers showed enrichment of biological processes including extracellular matrix, immune-related processes, epithelial differentiation, and cell cycle processes (Figures 2G and 2H) in contrast to enrichment of thyroid metabolic processes seen only in RAS-like tumors (Figure S3H). Epithelial de-differentiation and increased mitotic activity are known features associated with thyroid cancer progression and part of the current diagnostic criteria for many aggressive thyroid tumors, providing further support for the gene ontology analysis.42,43,44 Altogether, the MAP score correlated with aggressive thyroid cancer subtypes and represented multiple biologic processes notably including remodeling of the tumor microenvironment.
MAP score identifies CAF-rich microenvironments
Based on the presence of extracellular matrix and immune-related genes in our MAP score, as well as the reported functional roles of CAFs in disease progression,45 we further explored the stromal infiltrate of tumors with positive MAP score. Differential gene expression comparing positive and negative MAP score samples in our cohort showed enrichment of inflammatory genes in MAP-positive samples (Figure 3A), including markers of specific immune cell infiltrates such as CAFs, M2 macrophages, and neutrophils (Figure 3B). To confirm the stromal infiltrate in our cohort, we predicted infiltrating cell populations from bulk RNA sequencing using the immune deconvolution tools TIMER, CIBERSORT, EPIC, and MCPCOUNTER. Again, we observed strong enrichment of CAFs, M2 macrophages, and neutrophils in MAP-positive tumors (Figures 3C and S4). To further validate the association of the MAP score with this unique stromal infiltrate, we utilized a large external cohort of well-differentiated PTC samples in the TCGA (Figures 3D and S5). We found enrichment of CAFs, neutrophils, and M2-macrophages in MAP-positive PTC tumors, with enrichment of CD8+ T cells in MAP-negative tumors (Figure S5).
Figure 3.

MAP score is associated with CAF, neutrophil, and M2 macrophage infiltrate in thyroid tumors
(A) Volcano plot showing differentially expressed genes (fold change >2, adjusted p value <0.05) between malignant localized thyroid lesions with positive (pink) and negative (blue) MAP score. Samples with Hashimoto thyroiditis were excluded. Select markers of extracellular matrix, cancer-associated fibroblasts, and key immune cell populations are labeled.
(B and C) Boxplots of all malignant thyroid lesions, excluding samples with Hashimoto thyroiditis, showing log-transformed CAF markers FAP and LRRC15, M2 macrophage polarization markers MRC1 and CD163, and neutrophil markers ELANE and FCGR3B from bulk RNA sequencing data (B) or log-transformed EPIC CAF score, CIBERSORT absolute value M2 macrophage score, and TIMER neutrophils score (C). Samples are categorized as negative MAP score (light blue) and positive MAP score (dark pink). p values were calculated with Wilcoxon rank-sum test.
(D) Heatmap of select deconvolution results from TCGA, an external well-differentiated thyroid cancer cohort. BRS, MAP score category, and MAP score annotations displayed on the top of the heatmap, followed by TIMER scores, CIBERSORT absolute value M1/M2 macrophage scores, and EPIC CAF scores. Samples are sorted by increasing MAP score from left to right.
(E) Boxplots of EPIC CAF score, CIBERSORT absolute value M2 macrophage score, and TIMER neutrophil score, with samples organized into the following thyroid lesion subtype groups: RAS-like (FTC, OTC, EFVPTC, and NIFTP), BRAF-like (PTC and IFVPTC), PDTC, and ATC. All scores are on a log2 scale. p values were calculated with Kruskal-Wallis test with pairwise Wilcoxon rank-sum test and Bonferroni’s correction.
(F) Clustering of transcriptomic data from a representative ATC spatial transcriptomics sample with spatial mapping of clusters (upper left), UMAP (lower left), and differential gene expression heatmap showing the top 10 markers for each of the clusters (right). Clusters are labeled as CAF, ATC tumor cells, and intermixed immune cells based on marker genes in the heatmap.
(G) SpaCET spatial deconvolution showing estimated spatial capture area cell fractions for CAF and macrophage for eight ATC samples.
(H) Boxplots of MAP scores in ATCs, split into groups with either low or high histologic quantification of CAFs, FAP+ CAFs, neutrophils, and MRC1+ macrophages. Representative histology of specific cell types is shown to the left of quantification. p values were calculated with Wilcoxon rank-sum test.
As MAP scores are highest in ATCs, we next assessed whether ATCs had higher CAF infiltrates compared to other thyroid cancers. Comparison of these infiltrates across major thyroid cancer subtypes revealed that ATCs had the highest predicted CAF, M2 macrophage, and neutrophil infiltrates. RAS-like well-differentiated cancers and PDTCs had the lowest predicted levels of these stromal cells (Figure 3E). To spatially confirm this infiltrate identified in ATCs from bulk sequencing data, we next performed spatial transcriptomics on eight ATC samples from our cohort. Clustering showed robust, distinct populations of tumor cells and CAFs in all ATC samples (Figure 3F) but did not clearly detect separate populations of other immune cell subsets. As spatial transcriptomics is not single-cell resolution, clustering was unable to detect smaller populations of intermixed immune cell subsets. To overcome this limitation, we used a spatial deconvolution algorithm, SpaCET, to deconvolute the immune cell populations present within individual spatial capture areas. Exploration of immune cell populations with SpaCET confirmed robust CAF and macrophage infiltrate in all eight ATC specimens (Figure 3G). As the gold-standard method of confirmation of neutrophil, CAF, and M2 macrophage infiltrates, we performed blinded pathologist review and scoring of H&E and immunofluorescence staining for fibroblast activation protein (FAP) (CAF marker) and MRC1 (M2 macrophage marker) in all ATCs of our cohort (Figure 3H). While all ATCs had positive MAP scores, samples with high levels of CAFs, neutrophils, and M2 macrophages had higher MAP positivity. Overall, these findings suggest a strong association between MAP score and CAF, M2 macrophage, and neutrophil infiltrates across thyroid cancer subtypes.
MAP score highlights ATCs that may respond to immunotherapy
Given the recent clinical trials of immunotherapy for transformed tumors (PDTCs and ATCs), we further investigated immune cell subsets within these thyroid cancer subtypes. Immune deconvolution of bulk RNA sequencing from transformed tumors revealed three striking patterns of immune cell infiltrate: immune dessert, lymphocyte rich, and CAF rich (Figure 4A). Regardless of MAP positivity, PDTCs showed low scores for immune infiltration, suggesting “immune desert” microenvironments. This finding is similar to prior reports of immune-cold PDTCs.21,46 In contrast, ATCs were rich in stomal and immune cells, displaying either a lymphocyte/M1 macrophage-rich or CAF/M2 macrophage-rich infiltrate. While both metastatic and thyroid-localized ATCs demonstrated lymphocyte-rich microenvironments, CAF-rich microenvironments were more commonly seen in ATC samples from the thyroid and surrounding soft tissues. The lymphocyte-rich stroma in ATC strongly correlated with moderate MAP score. Using a 50th percentile MAP score cutoff, we categorized ATCs as either having a moderate MAP score or a high MAP score and found a significant association with lymphocyte-rich versus CAF-rich microenvironments, respectively (Figures 4B and S6).
Figure 4.

MAP score is associated with tumor microenvironment composition in ATCs
(A) Heatmap of select deconvolution results for PDTCs and ATCs. Diagnosis, tissue location, aggressive disease, MAP score category, and MAP score annotations displayed on the top of the heatmap, followed by TIMER scores, M1/M2 absolute value CIBERSORT immune deconvolution scores, and EPIC CAF scores. Samples are arranged by increasing MAP score from left to right within each diagnosis. Representative histology shown for PDTC, lymphocyte-rich ATC, and CAF-rich ATC.
(B) Moderate and high MAP score ATC tumor categorization diagram (tumors split by 50th percentile MAP score), and boxplots of EPIC CAF score, CIBERSORT absolute M2 macrophage score, CIBERSORT absolute M1 macrophage score, and TIMER CD8+ T cell score, comparing moderate and high MAP score ATCs. All scores are on a log2 scale. p values were calculated with Wilcoxon rank-sum test.
(C) Representative multiplex IF image of ATC with MRC1+ macrophages and adjacent FAP+ fibroblasts. White arrows indicate MRC1+ cells. Green, pan-cytokeratin, white, MRC1, red, FAP, blue, nuclear. Quantification of staining below showing the relationship between FAP staining and MRC1 staining. R2 and p value generated from a linear model with FAP staining score as the independent variable.
(D) Linear model of M2 macrophage and fibroblast co-localization from SpaCET deconvolution of eight ATCs as a dependent variable of MAP score (left), with representative spatial capture area M2 macrophage and fibroblast non-parametric rho correlation plots of moderate and high MAP score ATCs (right).
(E) Representative images of lymphocyte deconvolution from spatial transcriptomics data of moderate and high MAP score tumors (left) and comparison of average lymphoid spatial capture fraction between moderate and high MAP score tumors for all eight spatial transcriptomic samples (right). p value was calculated with Wilcoxon rank-sum test.
(F) Representative CD3 stained samples showing histologically excluded or included T cells.
(G) TIDE exclusion score in moderate and high MAP score ATCs and association with CD3 staining. p values were calculated with Wilcoxon rank-sum test.
(H) TIDE score in moderate and high MAP score tumors. p value was calculated with Wilcoxon rank-sum test.
To further explore the spatial association of CAFs and M2 macrophages in ATC, we performed multiplex immunofluorescence for the CAF marker FAP and the M2 macrophage marker MRC1 across all ATCs in our cohort. We found a strong correlation between the abundance of MRC1-positive (MRC1+) macrophages and FAP-positive (FAP+) CAFs in ATCs. While the FAP+ CAFs abutted tumor cells, the MRC1+ macrophages were predominantly localized within the tumor stroma adjacent to fibroblasts (Figure 4C). To quantitatively analyze co-localization of CAFs and M2 macrophages, we evaluated the correlation between predicted CAF and M2 macrophage frequency for individual capture areas within our spatial transcriptomics data. ATC samples had significant spatial correlation between CAFs and M2 macrophages. However, the magnitude of the correlation was more pronounced in tumors with higher MAP scores, suggesting greater CAF/M2 macrophage co-localization within high MAP tumors (Figures 4D and S7A).
We next verified the abundance of infiltrating lymphocytes in moderate-MAP ATCs using spatial transcriptomics and immunohistochemical staining. Using our ATC spatial transcriptomic samples, we identified increased abundance of lymphoid populations in samples with moderate versus high MAP scores (Figures 4E, S7B, and S7C). We also performed immunohistochemical staining and blinded scoring of CD3 stains from whole tumor sections of all ATCs in our cohort. We found two patterns of T cell infiltrate with CD3 staining: CD3 inclusion and CD3 exclusion (Figure 4F). This histologic assessment strongly correlated with the T cell exclusion prediction algorithm, tumor immune dysfunction exclusion (TIDE), performed on the same ATC samples. TIDE is an immune deconvolution tool that uses bulk RNA sequencing data to provide estimates of T cell exclusion, dysfunction, and predicted response to immune checkpoint blockade (ICB) therapy.47 Our TIDE exclusion results and CD3 staining strongly supported the association of moderate MAP score with T cell inclusion and high MAP score with T cell exclusion (Figures 4F and 4G). Finally, we utilized TIDE to predict potential response to ICB immunotherapy. As anticipated, ATCs with moderate MAP score and T cell inclusion were predicted to respond to immunotherapy, whereas ATCs with high MAP score and T cell exclusion were predicted to be non-responders (Figure 4H). The data suggest that MAP scoring predicts ATC stromal infiltrate and potential response to ICB therapy.
MAP score for thyroid cancer outcome prediction
Thus far, we have calculated a MAP score that is enriched for microenvironment genes. We next assessed whether MAP score could be used as a robust predictor of aggressive disease. To perform outcome prediction, we used two cohorts: our cohort with enrichment for transformed and metastatic disease and the TCGA cohort, which is primarily composed of patients with non-metastatic (less aggressive) disease. The benefits of utilizing two cohorts were 2-fold, as it allowed (1) the ability to include an external cohort with the TCGA tumors and (2) the ability to include our cohort enriched in well-differentiated tumors with aggressive behavior such as distant metastases (26% of our patients vs. 1% of TCGA patients, Figure 5A). Survival analysis using our cohort with both well-differentiated and transformed tumors, as well as with well-differentiated tumors alone, showed that patients with positive MAP scores had significantly worse survival (Figures 5B and S8A). Despite having primarily patients with local disease, the TCGA cohort also showed a significant decrease in disease-free and overall survival in tumors with positive MAP score (Figures 5Cand S8B).
Figure 5.

MAP score is associated with disease progression and predicted response to immune checkpoint blockade therapy
(A) Diagram showing 5-year survival of patients with well-differentiated thyroid cancer and patients with transformed thyroid cancer. Table showing percent of samples that are metastatic in the internal cohort from Vanderbilt University Medical Center and University of Washington Medical Center and the external cohort from TCGA.
(B) PFS in patients with well-differentiated and transformed thyroid cancer (left), as well as patients with only well-differentiated thyroid cancer (right), with positive (pink) or negative (purple) MAP score. p values were calculated with log rank test.
(C) Disease-free survival in TCGA patients with well-differentiated thyroid cancer with positive (pink) or negative (purple) MAP score. p values were calculated with log rank test.
(D) Receiver operating characteristic curve showing association between aggression and TERTp/TP53/PIK3CA mutation (blue), MAP score (red), and TERTp/TP53/PIK3CA mutation + MAP score (green), for patients with well-differentiated and transformed thyroid cancer (left), well-differentiated thyroid cancer (center-left), well-differentiated thyroid cancer sampled prior to aggression (center-right), and well-differentiated thyroid cancer sampled prior to aggression excluding any samples with a mutation in TERTp, TP53, and PIK3CA (right). Area under the curve values with 95% confidence intervals are shown. Metastatic tumors were excluded.
To further assess the ability of the MAP score to predict disease progression, we performed generalized linear models with penalized maximum likelihood estimation on our cohort. Score performance was assessed on three groups of local disease malignant samples: all malignant samples, well-differentiated malignancies, and well-differentiated malignancies that were resected prior to any evidence of disease progression. Inclusion of malignancies resected prior to disease progression allowed for prediction of future disease risk. We compared these scores to the predictive capacity of three common high-risk mutations: TP53, TERTp, and/or PIK3CA. Both the MAP score and the mutation scores performed similarly and were found to be good predictors of aggression (Figures 5D and S8C and Table S4). Significantly, combining the MAP score with high-risk mutations provided the greatest predictive power by area under the receiver operating characteristic curve (Figure 5D, Table S4). In addition, the MAP score provided aggressive disease prediction in samples lacking these known high-risk mutations (Figure 5D, Table S4). Altogether, we show that the molecular prediction of disease outcome is improved with the inclusion of both high-risk mutations and gene signatures that incorporate stromal markers of aggressive disease. Molecular prediction of the stromal infiltrate could be highly useful in enhancing outcome prediction in thyroid cancer (Figure 6).
Figure 6.

Outcome and therapy prediction using MAP score
Summary diagram showing the potential role of MAP score for risk stratifying thyroid tumors.
Discussion
The primary focus of thyroid nodule molecular profiling has been on malignancy prediction, rather than prediction of disease progression, recurrence, or therapy response. Recent studies have made significant progress in predicting patients with higher-risk disease by focusing on high-risk alterations such as mutations in TERTp, TP53, and PIK3CA, often in combination with BRAF V600E.27 However, many patients with metastatic, recurrent, or progressive thyroid cancer lack such known high-risk mutational biomarkers. To better understand the pathogenesis of thyroid cancer progression and to identify additional biomarkers, we sequenced a diverse collection of thyroid lesions from a large patient cohort enriched for aggressive disease. As expected, TERTp, TP53, and PIK3CA mutations were associated with decreased PFS. However, our findings suggest that approximately 40% of patients with aggressive well-differentiated tumors lack these previously identified high-risk mutations. Based on these findings, we generated the MAP score, which was associated with outcome in both our cohort and the TCGA PTC cohort. We found that, when utilized in combination with known high-risk mutations, MAP score improves the prediction of thyroid cancer aggressiveness. Importantly, the MAP score could also potentially provide outcome prediction in patients lacking these mutations.
In addition to outcome prediction, the MAP score also offered an assessment of immune infiltrate, which could be useful in identifying ATC patients who might respond to ICB immunotherapy. Clinical trials have recently showed some moderate response of ATC to ICB therapy.33,34,35,36,37,38 Immune profiling with a molecular signature such as the MAP score could help identify ICB-responsive ATC patients. MAP-predicted differential immune infiltration also highlights important biology that may shed light on the drivers of aggressive disease. CAFs, macrophages, and neutrophils have been implicated as key regulators of anti-tumor immunity and have substantial crosstalk with tumor cells, indicating their ability to influence tumor growth and response to therapy.48 As such, the robust infiltration of CAFs, neutrophils, and M2 macrophages in MAP-high tumors may play a key role in thyroid cancer progression. Additional research is needed to explore whether differing CAF populations and/or immune infiltrate compositions could be used to inform the development of new targeted therapies for ATC patients.
In conclusion, our findings identify the stromal microenvironment as an important component of outcome in thyroid cancer. We show that incorporation of a molecular signature including stromal genes with standard mutational analysis could improve risk-stratification and may even predict immunotherapy response in ATC patients. In the future, we envision a testing platform utilizing both mutational and stromal microenvironment data for outcome and ICB response prediction. Continuing research on the stromal microenvironment of thyroid cancer has the potential to improve care of thyroid cancer patients, identify novel therapeutic targets for aggressive disease, and potentially help prevent ATC, one of the most aggressive forms of thyroid cancer. Similar molecular tests could potentially provide predictive value for other stromal-rich cancers. While more research is needed, assessment of stromal microenvironment genes has the potential to deepen our understanding of cancer biology, redefine tumor classification, and estimate poor outcome risk for patients across a wide range of solid tumors.
Limitations of the study
We note a few limitations of our study. First, bulk RNA sequencing and spatial transcriptomics have limited ability to subclassify minor immune cell populations and CAF subsets. Additional studies using single-cell sequencing methods will be essential for detailed classification of these stromal subpopulations.32 Second, whole-exome sequencing depth could have limited our ability to detect subclonal mutations or mutations in samples with lower tumor purity. Third, as none of the patients in our study were treated with immunotherapy, computational algorithms were used to predict potential ICB response. A larger cohort of patients receiving ICB therapy will be needed to assess whether the tumor’s stromal infiltrate can be used as an accurate predictor of ICB response. Fourth, while our cohort includes a diverse collection of thyroid tumors to study aggressive disease, larger prospective cohorts are needed to determine the real-world clinical utility of prognostic biomarkers. Finally, while the MAP score performed well in this resection-based study, the potential clinical utility of this gene score has not been assessed in fine-needle aspirate biopsy material. We have previously confirmed the robust identification of neutrophils, macrophages, and T cells using flow cytometry of thyroid cancer aspirate biopsy material (data not shown). However, large biopsy-based studies will be needed to assess the differential cell enrichment in aspirate biopsies and the modifications that would be needed for the MAP score to provide prognostic information in fine-needle aspirates.
STAR★Methods
Key resources table
| REAGENT or RESOURCE | SOURCE | IDENTIFIER |
|---|---|---|
| Antibodies | ||
| Recombinant rabbit monoclonal anti-fibroblast activation protein alpha (FAP) IgG, clone EPR20021 | Abcam | Cat# ab207178; RRID:AB_2864720 |
| Rat monoclonal anti-MRC1 IgG2a, clone MR5D3 | Thermo Fisher Scientific | Cat# MA5-16868; RRID:AB_2538346 |
| Polyclonal goat anti-rabbit IgG Alexa Fluor 647 | Molecular Probes | Cat# A-21245; RRID:AB_141775 |
| Polyclonal goat anti-rat IgG Cy3 | Abcam | Cat# ab6953; RRID:AB_955010 |
| Mouse monoclonal anti-pan cytokeratin IgG1 AF488, clone AE1/AE3 | Thermo Fisher Scientific | Cat# 53-9003-82; RRID:AB_1834350 |
| Biological samples | ||
| Human FFPE thyroid samples | Vanderbilt University Medical Center (VUMC) and the University of Washington Medical Center (UWMC) | N/A |
| Critical commercial assays | ||
| truXTRAC FFPE Total NA Kit | COVARIS | 520220 |
| Ultra II DNA Library Prep kit | NEB | E7645L |
| Visium Spatial Gene Expression Slide Kit | 10x Genomics | PN-1000188 |
| Deposited data | ||
| ExAC (Exome Aggregation Consortium) | Lek et al.49 | http://exac.broadinstitute.org/ |
| 1000G (1000 Genomes Project) | Lek et al.49 | https://www.internationalgenome.org/ |
| gnomAD (Genome Aggregation Database) | Karczewski et al.50 | https://gnomad.broadinstitute.org/ |
| GENCODE GRCh38.p13 genome | Frankish et al.51 | https://www.gencodegenes.org/human/release_38.html |
| Gene Ontology Consortium resource | Ashburner et al.,52 Aleksander et al.53 | http://geneontology.org/ |
| cBioPortal (TCGA Thyroid Carcinoma) | Network CGAR,14Gao et al.,54 Cerami et al.55 | https://www.cbioportal.org/ |
| Oligonucleotides | ||
| Primer: TERTp forward: 5- TAATACGACTCACTATAGGGCAC CCGTCCTGCCCCTTCACCTT-3′ |
Koelsche et al.56 | N/A |
| Primer: TERTp reverse: 5′- GTAAAACGACGGCCAGGGCTTCC CACGTGCGCAGCAGGA-3′ |
Koelsche et al.56 | N/A |
| Software and algorithms | ||
| Cutadapt (v2.10) | Martin et al.57 | https://cutadapt.readthedocs.io/en/v2.10/index.html |
| FastQC | Andrews et al.58 | www.bioinformatics.babraham.ac.uk/projects/fastqc |
| Burrows-Wheeler Aligner (v0.7.17-r1188) | Li et al.59 | https://bio-bwa.sourceforge.net/ |
| GATK v. 4.1.8.1 | McKenna et al.60 | https://gatk.broadinstitute.org/hc/en-us/sections/360009803432-4-1-8-1 |
| STAR (v2.7.8a) | Dobin et al.61 | https://github.com/alexdobin/STAR |
| featureCounts (v2.0.2) | Liao et al.62 | https://www.rdocumentation.org/packages/Rsubread/versions/1.22.2/topics/featureCounts |
| DESeq2 (v1.30.1) | Love et al.63 | https://bioconductor.org/packages/release/bioc/html/DESeq2.html |
| EnhancedVolcano (1.18) | Blighe et al.64 | https://bioconductor.org/packages/release/bioc/html/EnhancedVolcano.html |
| Heatmap3 | Zhao et al.65 | https://github.com/slzhao/heatmap3 |
| GSEA (v4.1.0) | Subramanian et al.66 | https://www.gsea-msigdb.org/gsea/index.jsp |
| TIMER2.0 | Li et al.67 | http://timer.cistrome.org/ |
| ggplot2 | Wickham et al.68 | https://ggplot2.tidyverse.org. |
| TIDE | Jiang et al.47 | http://tide.dfci.harvard.edu/ |
| ComplexHeatmap | Gu et al.69 | https://github.com/jokergoo/ComplexHeatmap |
| STAR-Fusion (v2.7.8a) | Hass et al.70 | https://github.com/STAR-Fusion/STAR-Fusion/releases |
| Integrated Genomics Viewer | Robinson et al.71 | https://software.broadinstitute.org/software/igv/ |
| Panther | Thomas et al.72 | https://pantherdb.org/ |
| Seurat 4.0 | Hao et al.73 | https://satijalab.org/seurat/ |
| SpaCET | Ru et al.74 | https://github.com/data2intelligence/SpaCET |
| maftools | Mayakonda et al.75 | https://github.com/PoisonAlien/maftools |
| brglm2 | Kosmidis et al.76 | https://github.com/ikosmidis/brglm2 |
| Code for analysis and figure generation | This paper | https://doi.org/10.5281/zenodo.8229499 |
Resource availability
Lead contact
Further information and requests for resources and reagents should be directed to and will be fulfilled by the lead contact, Vivian L. Weiss (vivian.l.weiss@vumc.org).
Materials availability
This study did not generate new unique reagents.
Experimental model and study participant details
Following Institutional Review Board approval from Vanderbilt University Medical Center (VUMC) and the University of Washington Medical Center (UWMC), all consecutive cases of advanced thyroid cancer (including well-differentiated tumors with distant metastases, ATCs, and PDTCs) resected at VUMC between 10/14/2005 and 1/14/2020, and well-differentiated malignancies with distant metastases at UWMC between 10/11/2002 and 7/14/2017 were included in the study. We define well-differentiated thyroid tumors as including Follicular Thyroid Carcinoma, FTC; Oncocytic Thyroid Carcinoma, OTC, Noninvasive Follicular Thyroid Neoplasm with Papillary-like Nuclear Features, NIFTP, Encapsulated Follicular Variant Papillary Thyroid Carcinoma, EFVPTC, Papillary Thyroid Carcinoma, PTC, and Infiltrative Follicular Variant Papillary Thyroid Carcinoma, IFVPTC. All such cases of aggressive thyroid cancers with sufficient FFPE tissues and tumor percentage were included in this study (N = 123 samples). Samples (collected during the same data range) from age-matched patients with well-differentiated malignant thyroid lesions without distant metastases (N = 112 samples), multinodular goiters (N = 21 samples), patients with clinically diagnosed Hashimoto thyroiditis (N = 14 samples), and benign neoplasms (N = 42 samples) were also included for comparison. In all, 312 samples from 251 different patients were included in this study (VUMC, N = 292 samples and UWMN, N = 20 samples). Among the patients there are 163 females. For analyses, samples were binned into non-neoplastic (MNG, HT), neoplastic (FA, OA), well-differentiated malignancies (FTC, OTC, EFVPTC, IFVPTC, PTC), and transformed malignancies (PDTC, ATC). As NITFP is not yet clearly defined as either benign or malignant, it was grouped with our well-differentiated malignancies. Diagnostic criteria are based on WHO and ATA guidelines. Each specimen’s histopathology was reviewed by three board-certified pathologists (VW, MM, KE).
Method details
Clinical data
Manual chart review was performed (GX, ML, JG, EH) to gather additional/pertinent patient demographics (e.g., race), clinical histories (e.g., prior exposures to ionizing radiation), treatment courses (e.g., types of surgeries), tumor details (e.g., size), and outcomes (e.g., survival).
Patient outcomes and survival analyses
Responses to therapy (typically surgery and radioactive iodine) and patient outcomes were categorized in accordance with the latest American Thyroid Association guidelines3 and are detailed below. Complex and equivocal cases were discussed (GX, ML, JG, VW) until unanimous consensus was achieved. For aggressive disease classification, patients were grouped into the two categories described below.
Indolent
Includes patients with no evidence of disease (NED), indeterminate disease, persistent disease, or recurrent disease in remission. NED was defined by undetectable thyroglobulin (Tg) level, lack of circulating anti-thyroglobulin antibodies (aThyG), and a thyroid ultrasound indicating no evidence of disease. Patients without imaging follow-up were determined to be NED by laboratory testing (undetectable Tg or aThyG) alone. Imaging alone (without labs) was only sufficient for NED if the patient had a hemithyroidectomy or no radioactive iodine. Indeterminate disease was defined by with stable/detectable Tg < 1.0 ng/mL, stimulated Tg < 10 ng/mL, positive aThyG levels that were not increasing, imaging without Tg labs, and/or inconclusive imaging. Persistent disease includes stable Tg > 1.0 ng/mL, stimulated Tg > 10 ng/mL, and/or a persistent lesion by imaging that did not increase in size over multiple years of follow-up. Recurrent disease in remission includes malignancies that could be measured (via imaging or laboratory testing) after a designation of NED but were treated with local intervention and followed by stable or decreasing tumor size or Tg.
Aggressive disease
Defined by local disease recurrence without stabilization of disease or remission following subsequent localized treatment; increasing lesion size after initial therapy; biopsy demonstrating transformation to ATC; or distant metastasis after initial therapy completion. Patients with transformed disease or metastatic disease at presentation were categorized as having aggressive disease.
Survival analyses
For progression-free survival (PFS) analyses, the interval between the completion of initial therapy to the date of progression was calculated. The date of disease progression was determined by the first date of either an increasing Tg (in an appropriately thyroid-stimulating hormone suppressed patient) or the increase in size of a lesion by imaging. All patients that were determined to be progressive by Tg had subsequent imaging evidence of progressive disease. For patients without progression, the date of last follow-up was used to determine PFS—and the data appropriately censored. Patients with no follow-up after therapy were omitted from analysis. Overall survival similarly was calculated from the completion of initial therapy to the date of death or date of last follow-up (also censored in the case of a living patient). For well-differentiated tumors, the date of initial therapy completion was either 1) the date of post-operative radioactive iodine administration or 2) the date of surgery for low-risk tumors that did not require post-operative radioactive iodine (e.g., NIFTP). For undifferentiated tumors (PDTC and ATC), the date of surgery was used as the initial therapy completion date.
DNA sequencing and mutational analysis
Nucleic acids were extracted using the COVARIS truXTRAC FFPE Total NA Kit per the manufacturer’s instructions (COVARIS, Woburn, MA). DNA libraries were built using the NEB Ultra II DNA Library Prep Kit per the manufacturer’s instructions (NEB, Ipswich, MA). Sequencing was performed at the Vanderbilt Technologies for Advanced Genomics (VANTAGE) core facility on an Illumina NovaSeq 6000 platform using the IDT xGen Exome Research Panel (Illumina, San Diego, CA). Raw 150 bp paired-end reads were trimmed to remove adapter sequences using Cutadapt (v2.10)57 and the quality of the reads before and after trimming was checked by FastQC.(www.bioinformatics.babraham.ac.uk/projects/fastqc).58 Trimmed reads were aligned to hg38 genome using Burrows-Wheeler Aligner (v0.7.17-r1188).59 GATK v. 4.1.8.1 was used to remove duplicate reads, perform base quality score recalibration and variants discovery.60 Variant calling was first performed on individual samples using HaplotypeCaller in gVCF mode, all samples were jointly genotyped, and variant filtering was performed with VQSR. Variant annotation was conducted with ANNOVAR (v2018-04-16).77 Variants with minor allele frequency ≥0.1% in at least one of the ExAC (Exome Aggregation Consortium),49 1000G (1000 Genomes Project),49 and gnomAD (Genome Aggregation Database)50 databases were filtered out. BRAF, RAS, TP53, and PIK3CA mutations were evaluated according to the standards and guidelines for the reporting of sequence variants in cancer by the Association for Molecular Pathology, American Society of Clinical Oncology, and the College of American Pathologists.78 Average depth and coverage of whole exome sequencing was 157X and 91X, respectively.
TERT promoter alterations C228T and C250T were probed using Sanger sequencing with primers [5- TAATACGACTCACTATAGGGCACCCGTCCTGCCCCTTCACCTT-3’ (forward+T7 tail) and 5′- GTAAAACGACGGCCAGGGCTTCCCACGTGCGCAGCAGGA-3’ (reverse+M13F tail)]56 and the HotStarTaq DNA Polymerase kit (QIAGEN, Hilden, Germany). Thermal cycling conditions were as follows: 95°C (15 min), followed by 35 cycles of 94°C (30 s), 56°C (30 s), and 72°C (20 s), followed by 72°C (10 min) and 4°C hold. Purified PCR products were analyzed using Sanger sequencing (GENEWIZ, South Plainfield, NJ).
RNA sequencing and tumor-infiltrating immune cell deconvolution
Nucleic acids were extracted using the COVARIS truXTRAC FFPE Total NA Kit as above (COVARIS, Woburn, MA). Illumina TruSeq mRNA sequencing libraries were prepared and sequenced at VANTAGE on a NovaSeq 6000 platform Raw (Illumina, San Diego, CA). Raw 150 bp paired-end reads were trimmed to remove adapter sequences using Cutadapt (v2.10)57 and aligned to the GENCODE GRCh38.p13 genome51 using STAR (v2.7.8a).61 GENCODE v38 gene annotations were provided to STAR to improve the accuracy of mapping. Quality control on both raw reads and adaptor-trimmed reads was performed using FastQC.58 featureCounts (v2.0.2)62 was used to count the number of mapped reads to each gene. Significantly differential expressed genes with FDR-adjusted p value <0.05 and absolute fold change >2.0 were detected by DESeq2 (v1.30.1)63 and visualized with R package EnhancedVolcano (1.18).64 The R package Heatmap365 was used for cluster analysis and visualization. Gene Ontology was performed on differentially expressed genes using the Gene Ontology Consortium resource.52,53 Gene set enrichment analysis was performed using GSEA (v4.1.0)66 on the msigdb v7.1 database. TIMER2.0 (http://timer.cistrome.org/), a web-based deconvolution program capable of estimating tumor-infiltrating immune cells based on gene expression profiles across diverse cancer types67 was used. TIMER 2.0 was run using THCA (Thyroid Carcinoma) as the cancer type gene signature. TIMER 2.0 immune deconvolution scores used include those from CIBERSORT-Abs,79 EPIC,79 and MCPCOUNTER.80 Descriptive results were plotted using the R package ggplot2.68 In addition, we used the computation tool TIDE (http://tide.dfci.harvard.edu/)47 to estimate immune checkpoint blockade response based on gene expression data. The TIDE response prediction module was run using the following settings: Cancer type = Other, Previous Immunotherapy = No. TIMER and TIDE score heatmaps were generated using R package ComplexHeatmap.69
Fusion analysis
The STAR-Fusion (v2.7.8a) pipeline70 was used to align and map paired-end RNA-seq reads to the human genome (GRCh38_gencode_v37) using parameters optimized to capture fusion transcripts.81 FusionInspector, a component of the STAR-Fusion suite was used to validate fusion transcripts in silico. Manual review of RNA data was performed using the Integrated Genomics Viewer71 and two additional RET fusions were identified by blasting soft clip reads to the human genome.
The following parameters were used to run STAR-Fusion:
STAR –genomeDir –outReadsUnmapped None –chimSegmentMin 12 –chimJunctionOverhangMin 8 –chimOutJunctionFormat 1 –alignSJDBoverhangMin 10 –alignMatesGapMax 100000 –alignIntronMax 100000 –alignSJstitchMismatchNmax 5 -1 5 5.
--runThreadN 8 –outSAMstrandField intronMotif –outSAMunmapped Within –alignInsertionFlush Right –alignSplicedMateMapLminOverLmate 0 –alignSplicedMateMapLmin 30 –outSAMtype BAM Unsorted –outSAMattrRGline ID:GRPundef –chimMultimapScoreRange 3 –chimScoreJunctionNonGTAG −4 –chimMultimapNmax 20 –chimNonchimScoreDropMin 10.
--peOverlapNbasesMin 12 –peOverlapMMp 0.1 –genomeLoad NoSharedMemory –twopassMode Basic.
Command.
STAR –genomeDir.
--outReadsUnmapped None.
--chimSegmentMin 12.
--chimJunctionOverhangMin 8.
--chimOutJunctionFormat 1.
--alignSJDBoverhangMin 10.
--alignMatesGapMax 100000.
--alignIntronMax 100000.
--alignSJstitchMismatchNmax 5 -1 5 5.
--runThreadN 8.
--outSAMstrandField intronMotif
--outSAMunmapped Within.
--alignInsertionFlush Right.
--alignSplicedMateMapLminOverLmate 0.
--alignSplicedMateMapLmin 30.
--outSAMtype BAM Unsorted.
--outSAMattrRGline ID:GRPundef.
--chimMultimapScoreRange 3.
--chimScoreJunctionNonGTAG −4.
--chimMultimapNmax 20.
--chimNonchimScoreDropMin 10.
--peOverlapNbasesMin 12.
--peOverlapMMp 0.1.
--genomeLoad NoSharedMemory
--twopassMode Basic.
Calculation of RNA scores
BRAF-RAS score calculation
The BRAF-RAS score (BRS) was calculated from a previously defined list of 71 genes14 using bulk RNA-sequencing data transformed into Z score format. 69 of the 71 genes in the originally published score were covered in the sequencing data and were used here. In brief, BRAF-mutant and RAS-mutant centroids were calculated and used to generate a BRS for each sample.
Calculating BRAF-mutant and RAS-mutant centroids
BRAF-mutant ([B]) and RAS-mutant ([R]) centroids were calculated from PTCs and FVPTCs with BRAF V600E and RAS mutations (NRAS, HRAS, or KRAS). The centroids consisted of vectors of the median expression of each of the 69 BRS genes for each group (BRAF or RAS mutant).
Calculating BRS for each sample
For each sample, a vector containing the expression of the 69 BRS genes was generated ([S]). The normalized squared Euclidean distance between [S] and [B] and [S] and [R] was calculated. Finally, the BRS was calculated as the difference between these normalized squared Euclidean distances such that a negative value indicated a BRAF-like sample and positive value a RAS-like sample, as shown below. Note that and indicate normalized squared Euclidean distances.
Thyroid differentiation score calculation
The thyroid differentiation score, or TDS, was calculated from the mRNA expression levels of 16 genes related to thyroid function and metabolism, as previously described.14 To calculate TDS, the variance stabilized expression data were subtracted by the median across all tumor samples. Next, the TDS was calculated from the average values across the 16 genes in each tumor.
ERK activity score calculation
The ERK score was calculated as previously described14 using the expression of 48-genes previously shown to be down-regulated with MEK inhibition (set A) and 4 genes up-regulated with MEK inhibition (set B).82 In brief, expression data for set A and set B across the cohort (excluding MNG and HT) was log2 transformed, and the Z score of the expression of each gene for each sample was calculated. For each sample, the Z-scores of set A genes were summed, and the Z-scores of set B genes were summed. The Z score sum of set B genes (up-regulated with MEK inhibition) was subtracted from the Z score sum of set A genes (down-regulated with MEK inhibition) to achieve a final ERK score for each sample.
PI3K-AKT-mTOR (PI3K) score calculation
The hallmark PI3K-AKT-mTOR signaling gene set83 was used to calculate a PI3K activity score. Across our cohort of RNA-sequencing data (MNG and HT excluded), the expression data for each of the 105 genes in the score was log2 transformed and Z-scores were calculated. For each sample, the activity score was calculated as the sum of the Z-scores for the 105 genes in the hallmark PI3K-AKT-mTOR signaling gene set.
MAP score calculation and enrichment analysis
MAP score was calculated from a list of 549 genes that were upregulated > 4-fold with an adjusted p value of <0.05 in aggressive patient samples (relative to indolent) and > 2-fold with an adjusted p value of <0.05 in BRAF-like (relative to RAS-like) patient samples. Across our cohort of RNA-sequencing data (MNG, FA, OA, HT excluded), the expression data for each of the 549 genes was log2 transformed and Z-scores were calculated. For each sample, the MAP score was calculated as the average Z score for the 549 genes. Enrichment analysis of the 549 MAP score gene list was performed using a Panther overrepresentation test (https://pantherdb.org/).72
Analysis of TCGA
Bulk RNA-sequencing, mutation, and clinical data from TCGA encompassing 496 PTCs14 was downloaded from cBioPortal.54,55 The clinical data included pre-calculated BRS and BRAF-like/RAS-like designations, disease free survival, and overall survival data. RNA gene-level expression values were downloaded from cBioPortal in RNA-Seq by Expectation Maximization (RSEM) and RSEM Z score formats.84 MAP score was calculated for TCGA samples as the average Z score across 520 genes upregulated in BRAF-like and aggressive lesion samples in our cohort. Twenty-nine genes were excluded from the original 549 gene list because they were not covered in the TCGA sequencing data. TIMER 2.0 immune deconvolution data for TCGA samples, containing TIMER, CIBERSORT-Abs,79 EPIC,79 and MCPCOUNTER80 algorithms, was downloaded from timer.cistrome.org.67 For Tumor Immune Dysfunction Exclusion (TIDE) analysis,47 RSEM formatted expression data were log2 transformed and the log-fold change ratio was calculated for each gene in each sample. A log-fold change expression matrix was uploaded to TIDE for response prediction.
Multiplex immunofluorescence (IF) of formalin-fixed paraffin-embedded (FFPE) tissue
Data generation
Five μm ATC tissue sections were cut from 33 FFPE blocks and stored at −20°C. Tissue sections were thawed overnight at room temperature and heated for 1 h at 60°C. Tissue sections were deparaffinized with xylene (2 × 15 min), ethanol (100% 2 × 5 minutes, 95% 1 × 5 minutes), and water (5 min) then washed with PBS. Antigen retrieval was performed by heating slides for 45 min in sodium citrate buffer (pH 6.0) in a rice cooker followed by 30 min at room temperature. Tissues were washed with PBS and blocked for 2 h with 10% goat serum in PBS (blocking buffer). Primary antibodies (Abcam ab207178 recombinant rabbit monoclonal anti-fibroblast activation protein alpha (FAP) IgG, clone EPR20021, 1:100; Invitrogen MA5-16868 rat monoclonal anti-MRC1 IgG2a, clone MR5D3, 1:25) were diluted in blocking buffer and incubated on tissue sections at 4°C for 16 h (Abcam, Cambridge, UK; Thermo Fisher, Waltham, MA). Tissue sections were washed with 0.05% Tween 20 in PBS. Secondary antibodies (Invitrogen A-21245 polyclonal goat anti-rabbit IgG Alexa Fluor 647 1:150; Abcam ab6953 polyclonal goat anti-rat IgG Cy3 1:150) and conjugated primary antibodies (eBioscience 53-9003-82 mouse monoclonal anti-pan cytokeratin IgG1 AF488, clone AE1/AE3, 1:100) were diluted in blocking buffer containing Hoechst 33342 nuclear stain (1:1000) and incubated on tissue sections at 37°C for 1 h (Abcam, Cambridge, UK; Thermo Fisher, Waltham, MA). 12 representative 20X and 12 representative 60X images were taken of each tissue section on a Nikon Spinning Disc confocal microscope.
Data analysis
Representative multiplex immunofluorescence images were scored by a practicing pathologist (VW). For each ATC tissue section, FAP staining of non-malignant cells were scored for intensity (0–3) and frequency (0–3). An overall FAP staining score was calculated as the product of the intensity and frequency scores (0–9). FAP staining scores of 0–1 were categorized as low. FAP staining scores of greater than 1 were categorized as high. The number of non-malignant MRC1 stained cells was counted on 12 20X images for each tissue section. An average of less than 1 MRC1+ cell per 20X field was categorized as low. Greater than 1 MRC1+ cell per 20X field was categorized as high.
Spatial transcriptomics for FFPE
The Visium FFPE platform was used to generate spatial transcriptomics data (10x Genomics, Pleasonton, CA).
Slide preparation
8 FFPE blocks of thyroid carcinomas with ATC histology were selected for Visium analysis. Following pathologist review (VW), 5 μm sections up to 6 mm × 6 mm in size were cut onto a Visium Gene Expression Slide (Visium Spatial Gene Expression Slide Kit, PN-1000188). After sectioning, the slide was incubated at 42°C and then stored in a desiccator until use.
Data generation
Following manufacturer’s protocols (Visium FFPE 10X Genomics), samples were deparaffinized, stained (hematoxylin and eosin), and scanned at 20X. 3 of 8 ATCs were stained with hematoxylin only due to a supply chain shortage of eosin. The Visium Human Transcriptome Probe Set v1.0 was hybridized to samples overnight at 50°C. Following RNA digestion and tissue permeabilization, sequencing libraries were prepared per manufacturer’s protocols. Sequencing was performed at a depth of >40,000 reads per spot, and >150 million reads per sample using the NovaSeq 6000 platform (Illumina, San Diego, CA).
Data analysis
Visium sequencing data was pre-processed with Space Ranger 2.0.0 (10X Genomics). Analysis of Space Ranger outputs was performed with Seurat 4.0.73 In brief, Seurat 4.0 was used to perform normalization, dimensionality reduction, and clustering. Dimensionality was determined by elbow plot. For clustering, resolution was set to 0.2. Designation of ATC histology was done by pathologist review (VW). Deconvolution of immune cell frequencies within individual capture areas was performed with the R package SpaCET.74 For determining capture area malignant cell fraction, the SpaCET PANCAN setting was chosen. ATC classification was based on current standard-of-care clinical practice as outlined by the WHO and ATA guidelines and was reviewed by a practicing pathologist (VW). Individual Visium samples were determined to be MAP-high or MAP-moderate based on the MAP score of the associated bulk RNA sequencing sample.
Quantification and statistical analysis
Oncoplots were generated with the R packages maftools75 and ComplexHeatmap.69 Kaplan-Meier survival curves were compared and tested using the log rank test. PFS time and overall survival time were calculated as described in survival analyses methods above. Continuous outcomes were summarized by group with boxplots and tested using Wilcoxon rank-sum test. Kruskal-Wallis test with subsequent pairwise Wilcoxon rank-sum tests with Bonferroni’s correction was used when comparing more than two groups. All statistical tests are two-sided unless otherwise specified. Logistic regression models were used to evaluate the association between aggressive disease and each predictive score. Penalized maximum likelihood with Jeffreys-prior penalty was used to allow for less biased and more stable estimation to account for the low number of events in some strata (R package brglm2).76 Area under the receiver operating characteristic curve (AUC) and corresponding 95% confidence interval (CI) were computed to assess the discrimination ability of a fitted model. All statistical analyses were performed in R version 4.1.2 (R Foundation, Vienna, Austria).
Acknowledgments
Overview figures were created using BioRender.com, with relevant licenses obtained. This research was made possible through the AACR. We thank the Vanderbilt Translational Pathology Shared Resource (TPSR) for their support in tissue sectioning and staining, and the Vanderbilt Technologies for Advanced Genomics (VANTAGE) core facility for their support of bulk DNA and RNA sequencing and spatial transcriptomics. We thank The Vanderbilt Cell Imaging Shared Resource (CISR) Core for providing support for confocal microscopy (5P30 CA68485–19, S10 OD023475-01A1, DK20593, DK58404, DK59637, and EY08126). This work was funded by the American Society of Cytopathology (Young Investigator Award to V.L.W.), American Thyroid Association (2019-0000000090 to V.L.W.), NIH (R35GM122516, R01CA244188 and R01CA272875 to E.L.; VCORCDP K12CA090625, K08CA240901, and R01CA272875 to V.L.W.; and F30CA281125 to M.A.L.), V Foundation for Cancer Research (Scholar Award to V.L.W.), Children's Cancer Research Fund (Research Award to V.L.W.), and American Cancer Society (133934-CSDG-19-216-01-TBG and RSG-22-084-01-MM to V.L.W.). This project was supported by CTSA award no. VR53076 for funds to support statistical analysis from the National Center for Advancing Translational Sciences. Its contents are solely the responsibility of the authors and do not necessarily represent official views of the National Center for Advancing Translational Sciences or the National Institutes of Health.
Author contributions
G.J.X. and M.A.L.: conceptualization, data curation, formal analysis, investigation, visualization, methodology, and writing–original draft. J.-N.G.: data curation and methodology. Q.S., S.C., B.D.L., and D.W.B.: formal analysis and methodology. E.C.H., M.L.T., and L.T.K.: data curation and writing–review. J.H.C., L.W., M.W.S.-C., L.M.D., Q.W., R.C., B.L., D.C.F., J.L.N., S.L.R., C.C.S., L.A.B., N.B., M.M., E.M.J., K.A.E., and B.A.M.: writing–review. C.J.P. and C.Y.K.: data curation. A.C.S. and T.P.S.: methodology. F.Y.: formal analysis, methodology, and investigation. E.L.: conceptualization and supervision. V.L.W.: conceptualization, data curation, formal analysis, investigation, visualization, methodology, supervision, funding acquisition, and writing–review and editing.
Declaration of interests
E.L. is a co-founder of StemSynergy Therapeutics, a company that seeks to develop inhibitors of major signaling pathways (including the Wnt pathway) for the treatment of cancer. E.M.J. reports other support from Abmeta, other support from Adventris, personal fees from Achilles, personal fees from DragonFly, personal fees from Parker Institute, personal fees from Surge, grants from Lustgarten, grants from Genentech, personal fees from Mestag, personal fees from Medical Home Group, grants from BMS, and grants from Break Through Cancer outside the submitted work.
Inclusion and diversity
We support inclusive, diverse, and equitable conduct of research.
Published: September 14, 2023
Footnotes
Supplemental information can be found online at https://doi.org/10.1016/j.xgen.2023.100409.
Supplemental information
Data and code availability
-
•
There are restrictions to the availability of patient clinical and sequencing data. This is a retrospective cohort, and it is not possible to consent these patients with historic samples, particularly those with highly aggressive and rapidly lethal disease. As such, the IRB has requested that we do not publicly share individual-level sequencing data from each patient. The data is securely stored within a Vanderbilt patient data system. Aggregate-level data reported in this paper will be shared by the lead contact (Dr. Vivian Weiss) upon request. Individual-level data is only available through collaboration following approval of the lead contact and The Vanderbilt University Medical Center IRB. If the lead contact should leave the institution, collaboration requests should be directed to the Pathology Department Chair (Dr. Alice Coogan, alice.coogan@vumc.org).
-
•
Code for all analyses is available at the following link on GitHub: https://github.com/xgj797/Molecular-Signature-Incorporating-Immune-Microenvironment-Enhances-Thyroid-Cancer-Outcome-Prediction, and in a frozen repository on Zenodo: https://doi.org/10.5281/zenodo.8229499.
-
•
Any additional information required to reanalyze the data reported in this paper is available from the lead contact upon request.
References
- 1.Lim H., Devesa S.S., Sosa J.A., Check D., Kitahara C.M. Trends in Thyroid Cancer Incidence and Mortality in the United States, 1974-2013. JAMA. 2017;317:1338–1348. doi: 10.1001/jama.2017.2719. [DOI] [PMC free article] [PubMed] [Google Scholar]
- 2.Rahib L., Smith B.D., Aizenberg R., Rosenzweig A.B., Fleshman J.M., Matrisian L.M. Projecting cancer incidence and deaths to 2030: the unexpected burden of thyroid, liver, and pancreas cancers in the United States. Cancer Res. 2014;74:2913–2921. doi: 10.1158/0008-5472.CAN-14-0155. [DOI] [PubMed] [Google Scholar]
- 3.Haugen B.R., Alexander E.K., Bible K.C., Doherty G.M., Mandel S.J., Nikiforov Y.E., Pacini F., Randolph G.W., Sawka A.M., Schlumberger M., et al. American Thyroid Association Management Guidelines for Adult Patients with Thyroid Nodules and Differentiated Thyroid Cancer: The American Thyroid Association Guidelines Task Force on Thyroid Nodules and Differentiated Thyroid Cancer. Thyroid. 2015;26:1–133. doi: 10.1089/thy.2015.0020. [DOI] [PMC free article] [PubMed] [Google Scholar]
- 4.Filetti S., Durante C., Hartl D., Leboulleux S., Locati L.D., Newbold K., Papotti M.G., Berruti A., ESMO Guidelines Committee Electronic address clinicalguidelines@esmoorg Thyroid cancer: ESMO Clinical Practice Guidelines for diagnosis, treatment and follow-up. Ann. Oncol. 2019;30:1856–1883. doi: 10.1093/annonc/mdz400. [DOI] [PubMed] [Google Scholar]
- 5.Hwangbo Y., Kim J.M., Park Y.J., Lee E.K., Lee Y.J., Park D.J., Choi Y.S., Lee K.D., Sohn S.Y., Kim S.W., et al. Long-Term Recurrence of Small Papillary Thyroid Cancer and Its Risk Factors in a Korean Multicenter Study. J. Clin. Endocrinol. Metab. 2017;102:625–633. doi: 10.1210/jc.2016-2287. [DOI] [PubMed] [Google Scholar]
- 6.Nagaiah G., Hossain A., Mooney C.J., Parmentier J., Remick S.C. Anaplastic thyroid cancer: a review of epidemiology, pathogenesis, and treatment. JAMA Oncol. 2011;2011 doi: 10.1155/2011/542358. [DOI] [PMC free article] [PubMed] [Google Scholar]
- 7.Ali S., Cibas E. 2 ed. Springer International Publishing; 2018. The Bethesda System for Reporting Thyroid Cytopathology. [Google Scholar]
- 8.Hu M.I., Waguespack S.G., Dosiou C., Ladenson P.W., Livhits M.J., Wirth L.J., Sadow P.M., Krane J.F., Stack B.C., Zafereo M.E., et al. Afirma Genomic Sequencing Classifier and Xpression Atlas Molecular Findings in Consecutive Bethesda III-VI Thyroid Nodules. J. Clin. Endocrinol. Metab. 2021;106:2198–2207. doi: 10.1210/clinem/dgab304. [DOI] [PMC free article] [PubMed] [Google Scholar]
- 9.Steward D.L., Carty S.E., Sippel R.S., Yang S.P., Sosa J.A., Sipos J.A., Figge J.J., Mandel S., Haugen B.R., Burman K.D., et al. Performance of a Multigene Genomic Classifier in Thyroid Nodules With Indeterminate Cytology: A Prospective Blinded Multicenter Study. JAMA Oncol. 2019;5:204–212. doi: 10.1001/jamaoncol.2018.4616. [DOI] [PMC free article] [PubMed] [Google Scholar]
- 10.Cohen Y., Xing M., Mambo E., Guo Z., Wu G., Trink B., Beller U., Westra W.H., Ladenson P.W., Sidransky D. BRAF mutation in papillary thyroid carcinoma. J. Natl. Cancer Inst. 2003;95:625–627. doi: 10.1093/jnci/95.8.625. [DOI] [PubMed] [Google Scholar]
- 11.Nikiforov Y.E., Nikiforova M.N. Molecular genetics and diagnosis of thyroid cancer. Nat. Rev. Endocrinol. 2011;7:569–580. doi: 10.1038/nrendo.2011.142. [DOI] [PubMed] [Google Scholar]
- 12.Xing M. Molecular pathogenesis and mechanisms of thyroid cancer. Nat. Rev. Cancer. 2013;13:184–199. doi: 10.1038/nrc3431. [DOI] [PMC free article] [PubMed] [Google Scholar]
- 13.Lemoine N.R., Mayall E.S., Wyllie F.S., Farr C.J., Hughes D., Padua R.A., Thurston V., Williams E.D., Wynford-Thomas D. Activated ras oncogenes in human thyroid cancers. Cancer Res. 1988;48:4459–4463. [PubMed] [Google Scholar]
- 14.Cancer Genome Atlas Research Network Integrated genomic characterization of papillary thyroid carcinoma. Cell. 2014;159:676–690. doi: 10.1016/j.cell.2014.09.050. [DOI] [PMC free article] [PubMed] [Google Scholar]
- 15.Nikiforova M.N., Mercurio S., Wald A.I., Barbi de Moura M., Callenberg K., Santana-Santos L., Gooding W.E., Yip L., Ferris R.L., Nikiforov Y.E. Analytical performance of the ThyroSeq v3 genomic classifier for cancer diagnosis in thyroid nodules. Cancer. 2018;124:1682–1690. doi: 10.1002/cncr.31245. [DOI] [PMC free article] [PubMed] [Google Scholar]
- 16.Nikiforova M.N., Tseng G.C., Steward D., Diorio D., Nikiforov Y.E. MicroRNA expression profiling of thyroid tumors: biological significance and diagnostic utility. J. Clin. Endocrinol. Metab. 2008;93:1600–1608. doi: 10.1210/jc.2007-2696. [DOI] [PMC free article] [PubMed] [Google Scholar]
- 17.Gopal R.K., Kübler K., Calvo S.E., Polak P., Livitz D., Rosebrock D., Sadow P.M., Campbell B., Donovan S.E., Amin S., et al. Widespread Chromosomal Losses and Mitochondrial DNA Alterations as Genetic Drivers in Hürthle Cell Carcinoma. Cancer Cell. 2018;34:242–255.e5. doi: 10.1016/j.ccell.2018.06.013. [DOI] [PMC free article] [PubMed] [Google Scholar]
- 18.Sicklick J.K., Kato S., Okamura R., Schwaederle M., Hahn M.E., Williams C.B., De P., Krie A., Piccioni D.E., Miller V.A., et al. Molecular profiling of cancer patients enables personalized combination therapy: the I-PREDICT study. Nat. Med. 2019;25:744–750. doi: 10.1038/s41591-019-0407-5. [DOI] [PMC free article] [PubMed] [Google Scholar]
- 19.Hays P. Springer; 2021. Translational Personalized Medicine: Molecular Profiling, Druggable Targets, and Clinical Genomic Medicine. [Google Scholar]
- 20.Xing M., Alzahrani A.S., Carson K.A., Viola D., Elisei R., Bendlova B., Yip L., Mian C., Vianello F., Tuttle R.M., et al. Association between BRAF V600E mutation and mortality in patients with papillary thyroid cancer. JAMA. 2013;309:1493–1501. doi: 10.1001/jama.2013.3190. [DOI] [PMC free article] [PubMed] [Google Scholar]
- 21.Landa I., Ibrahimpasic T., Boucai L., Sinha R., Knauf J.A., Shah R.H., Dogan S., Ricarte-Filho J.C., Krishnamoorthy G.P., Xu B., et al. Genomic and transcriptomic hallmarks of poorly differentiated and anaplastic thyroid cancers. J. Clin. Invest. 2016;126:1052–1066. doi: 10.1172/JCI85271. [DOI] [PMC free article] [PubMed] [Google Scholar]
- 22.Pozdeyev N., Gay L.M., Sokol E.S., Hartmaier R., Deaver K.E., Davis S., French J.D., Borre P.V., LaBarbera D.V., Tan A.C., et al. Genetic Analysis of 779 Advanced Differentiated and Anaplastic Thyroid Cancers. Clin. Cancer Res. 2018;24:3059–3068. doi: 10.1158/1078-0432.CCR-18-0373. [DOI] [PMC free article] [PubMed] [Google Scholar]
- 23.Xu B., Fuchs T., Dogan S., Landa I., Katabi N., Fagin J.A., Tuttle R.M., Sherman E., Gill A.J., Ghossein R. Dissecting Anaplastic Thyroid Carcinoma: A Comprehensive Clinical, Histologic, Immunophenotypic, and Molecular Study of 360 Cases. Thyroid. 2020;30:1505–1517. doi: 10.1089/thy.2020.0086. [DOI] [PMC free article] [PubMed] [Google Scholar]
- 24.Yoo S.K., Song Y.S., Lee E.K., Hwang J., Kim H.H., Jung G., Kim Y.A., Kim S.J., Cho S.W., Won J.K., et al. Integrative analysis of genomic and transcriptomic characteristics associated with progression of aggressive thyroid cancer. Nat. Commun. 2019;10:2764. doi: 10.1038/s41467-019-10680-5. [DOI] [PMC free article] [PubMed] [Google Scholar]
- 25.Mady L.J., Grimes M.C., Khan N.I., Rao R.H., Chiosea S.I., Yip L., Ferris R.L., Nikiforov Y.E., Carty S.E., Duvvuri U. Molecular Profile of Locally Aggressive Well Differentiated Thyroid Cancers. Sci. Rep. 2020;10:8031. doi: 10.1038/s41598-020-64635-8. [DOI] [PMC free article] [PubMed] [Google Scholar]
- 26.Jin M., Song D.E., Ahn J., Song E., Lee Y.M., Sung T.Y., Kim T.Y., Kim W.B., Shong Y.K., Jeon M.J., Kim W.G. Genetic Profiles of Aggressive Variants of Papillary Thyroid Carcinomas. Cancers. 2021;13 doi: 10.3390/cancers13040892. [DOI] [PMC free article] [PubMed] [Google Scholar]
- 27.Yip L., Gooding W.E., Nikitski A., Wald A.I., Carty S.E., Karslioglu-French E., Seethala R.R., Zandberg D.P., Ferris R.L., Nikiforova M.N., Nikiforov Y.E. Risk assessment for distant metastasis in differentiated thyroid cancer using molecular profiling: A matched case-control study. Cancer. 2021;127:1779–1787. doi: 10.1002/cncr.33421. [DOI] [PMC free article] [PubMed] [Google Scholar]
- 28.Xiao Y., Yu D. Tumor microenvironment as a therapeutic target in cancer. Pharmacol. Ther. 2021;221 doi: 10.1016/j.pharmthera.2020.107753. [DOI] [PMC free article] [PubMed] [Google Scholar]
- 29.Pu W., Shi X., Yu P., Zhang M., Liu Z., Tan L., Han P., Wang Y., Ji D., Gan H., et al. Single-cell transcriptomic analysis of the tumor ecosystems underlying initiation and progression of papillary thyroid carcinoma. Nat. Commun. 2021;12:6058. doi: 10.1038/s41467-021-26343-3. [DOI] [PMC free article] [PubMed] [Google Scholar]
- 30.Jolly L.A., Novitskiy S., Owens P., Massoll N., Cheng N., Fang W., Moses H.L., Franco A.T. Fibroblast-Mediated Collagen Remodeling Within the Tumor Microenvironment Facilitates Progression of Thyroid Cancers Driven by BrafV600E and Pten Loss. Cancer Res. 2016;76:1804–1813. doi: 10.1158/0008-5472.CAN-15-2351. [DOI] [PMC free article] [PubMed] [Google Scholar]
- 31.Fang W., Ye L., Shen L., Cai J., Huang F., Wei Q., Fei X., Chen X., Guan H., Wang W., et al. Tumor-associated macrophages promote the metastatic potential of thyroid papillary cancer by releasing CXCL8. Carcinogenesis. 2014;35:1780–1787. doi: 10.1093/carcin/bgu060. [DOI] [PubMed] [Google Scholar]
- 32.Lu L., Wang J.R., Henderson Y.C., Bai S., Yang J., Hu M., Shiau C.K., Pan T., Yan Y., Tran T.M., et al. Anaplastic transformation in thyroid cancer revealed by single cell transcriptomics. J. Clin. Invest. 2023;133:e169653. doi: 10.1172/JCI169653. [DOI] [PMC free article] [PubMed] [Google Scholar]
- 33.Dierks C., Seufert J., Aumann K., Ruf J., Klein C., Kiefer S., Rassner M., Boerries M., Zielke A., la Rosee P., et al. Combination of Lenvatinib and Pembrolizumab Is an Effective Treatment Option for Anaplastic and Poorly Differentiated Thyroid Carcinoma. Thyroid. 2021;31:1076–1085. doi: 10.1089/thy.2020.0322. [DOI] [PMC free article] [PubMed] [Google Scholar]
- 34.Dierks C., Ruf J., Seufert J., Kreissl M., Klein C., Spitzweg C., Kroiss M., Thomusch O., Lorenz K., Zielke A., Miething C. 1646MO Phase II ATLEP trial: Final results for lenvatinib/pembrolizumab in metastasized anaplastic and poorly differentiated thyroid carcinoma. Ann. Oncol. 2022;33:S1295. [Google Scholar]
- 35.Study of Cemiplimab Combined with Dabrafenib and Trametinib in People with Anaplastic Thyroid Cancer. https://ClinicalTrials.gov/show/NCT04238624.
- 36.Pembrolizumab D. Trametinib before Surgery for the Treatment of BRAF-Mutated Anaplastic Thyroid Cancer. https://ClinicalTrials.gov/show/NCT04675710
- 37.Lenvatinib and Pembrolizumab for the Treatment of Stage IVB Locally Advanced and Unresectable or Stage IVC Metastatic Anaplastic Thyroid Cancer. https://ClinicalTrials.gov/show/NCT04171622.
- 38.Atezolizumab with Chemotherapy in Treating Patients with Anaplastic or Poorly Differentiated Thyroid Cancer. https://ClinicalTrials.gov/show/NCT03181100.
- 39.Manzella L., Stella S., Pennisi M.S., Tirrò E., Massimino M., Romano C., Puma A., Tavarelli M., Vigneri P. New Insights in Thyroid Cancer and p53 Family Proteins. Int. J. Mol. Sci. 2017;18 doi: 10.3390/ijms18061325. [DOI] [PMC free article] [PubMed] [Google Scholar]
- 40.Lai W.A., Liu C.Y., Lin S.Y., Chen C.C., Hang J.F. Characterization of Driver Mutations in Anaplastic Thyroid Carcinoma Identifies. Cancers. 2020;12 doi: 10.3390/cancers12071973. [DOI] [PMC free article] [PubMed] [Google Scholar]
- 41.Landa I., Ganly I., Chan T.A., Mitsutake N., Matsuse M., Ibrahimpasic T., Ghossein R.A., Fagin J.A. Frequent somatic TERT promoter mutations in thyroid cancer: higher prevalence in advanced forms of the disease. J. Clin. Endocrinol. Metab. 2013;98:E1562–E1566. doi: 10.1210/jc.2013-2383. [DOI] [PMC free article] [PubMed] [Google Scholar]
- 42.Hiltzik D., Carlson D.L., Tuttle R.M., Chuai S., Ishill N., Shaha A., Shah J.P., Singh B., Ghossein R.A. Poorly differentiated thyroid carcinomas defined on the basis of mitosis and necrosis: a clinicopathologic study of 58 patients. Cancer. 2006;106:1286–1295. doi: 10.1002/cncr.21739. [DOI] [PubMed] [Google Scholar]
- 43.Volante M., Collini P., Nikiforov Y.E., Sakamoto A., Kakudo K., Katoh R., Lloyd R.V., LiVolsi V.A., Papotti M., Sobrinho-Simoes M., et al. Poorly differentiated thyroid carcinoma: the Turin proposal for the use of uniform diagnostic criteria and an algorithmic diagnostic approach. Am. J. Surg. Pathol. 2007;31:1256–1264. doi: 10.1097/PAS.0b013e3180309e6a. [DOI] [PubMed] [Google Scholar]
- 44.Ragazzi M., Ciarrocchi A., Sancisi V., Gandolfi G., Bisagni A., Piana S. Update on anaplastic thyroid carcinoma: morphological, molecular, and genetic features of the most aggressive thyroid cancer. Internet J. Endocrinol. 2014;2014 doi: 10.1155/2014/790834. [DOI] [PMC free article] [PubMed] [Google Scholar]
- 45.Biffi G., Tuveson D.A. Diversity and Biology of Cancer-Associated Fibroblasts. Physiol. Rev. 2021;101:147–176. doi: 10.1152/physrev.00048.2019. [DOI] [PMC free article] [PubMed] [Google Scholar]
- 46.Giannini R., Moretti S., Ugolini C., Macerola E., Menicali E., Nucci N., Morelli S., Colella R., Mandarano M., Sidoni A., et al. Immune Profiling of Thyroid Carcinomas Suggests the Existence of Two Major Phenotypes: An ATC-Like and a PDTC-Like. J. Clin. Endocrinol. Metab. 2019;104:3557–3575. doi: 10.1210/jc.2018-01167. [DOI] [PubMed] [Google Scholar]
- 47.Jiang P., Gu S., Pan D., Fu J., Sahu A., Hu X., Li Z., Traugh N., Bu X., Li B., et al. Signatures of T cell dysfunction and exclusion predict cancer immunotherapy response. Nat. Med. 2018;24:1550–1558. doi: 10.1038/s41591-018-0136-1. [DOI] [PMC free article] [PubMed] [Google Scholar]
- 48.Mao X., Xu J., Wang W., Liang C., Hua J., Liu J., Zhang B., Meng Q., Yu X., Shi S. Crosstalk between cancer-associated fibroblasts and immune cells in the tumor microenvironment: new findings and future perspectives. Mol. Cancer. 2021;20:131. doi: 10.1186/s12943-021-01428-1. [DOI] [PMC free article] [PubMed] [Google Scholar]
- 49.Lek M., Karczewski K.J., Minikel E.V., Samocha K.E., Banks E., Fennell T., O'Donnell-Luria A.H., Ware J.S., Hill A.J., Cummings B.B., et al. Analysis of protein-coding genetic variation in 60,706 humans. Nature. 2016;536:285–291. doi: 10.1038/nature19057. [DOI] [PMC free article] [PubMed] [Google Scholar]
- 50.Karczewski K.J., Francioli L.C., Tiao G., Cummings B.B., Alföldi J., Wang Q., Collins R.L., Laricchia K.M., Ganna A., Birnbaum D.P., et al. The mutational constraint spectrum quantified from variation in 141,456 humans. Nature. 2020;581:434–443. doi: 10.1038/s41586-020-2308-7. [DOI] [PMC free article] [PubMed] [Google Scholar]
- 51.Frankish A., Diekhans M., Jungreis I., Lagarde J., Loveland J.E., Mudge J.M., Sisu C., Wright J.C., Armstrong J., Barnes I., et al. GENCODE 2021. Nucleic Acids Res. 2021;49:D916–D923. doi: 10.1093/nar/gkaa1087. [DOI] [PMC free article] [PubMed] [Google Scholar]
- 52.Ashburner M., Ball C.A., Blake J.A., Botstein D., Butler H., Cherry J.M., Davis A.P., Dolinski K., Dwight S.S., Eppig J.T., et al. Gene ontology: tool for the unification of biology. The Gene Ontology Consortium. Nat. Genet. 2000;25:25–29. doi: 10.1038/75556. [DOI] [PMC free article] [PubMed] [Google Scholar]
- 53.Aleksander S.A., Balhoff J., Carbon S., Cherry J.M., Drabkin H.J., Ebert D., Feuermann M., Gaudet P., Harris N.L., Hill D.P., et al. The Gene Ontology knowledgebase in 2023. Genetics. 2023;224 doi: 10.1093/genetics/iyad031. [DOI] [PMC free article] [PubMed] [Google Scholar]
- 54.Gao J., Aksoy B.A., Dogrusoz U., Dresdner G., Gross B., Sumer S.O., Sun Y., Jacobsen A., Sinha R., Larsson E., et al. Integrative analysis of complex cancer genomics and clinical profiles using the cBioPortal. Sci. Signal. 2013;6:pl1. doi: 10.1126/scisignal.2004088. [DOI] [PMC free article] [PubMed] [Google Scholar]
- 55.Cerami E., Gao J., Dogrusoz U., Gross B.E., Sumer S.O., Aksoy B.A., Jacobsen A., Byrne C.J., Heuer M.L., Larsson E., et al. The cBio cancer genomics portal: an open platform for exploring multidimensional cancer genomics data. Cancer Discov. 2012;2:401–404. doi: 10.1158/2159-8290.CD-12-0095. [DOI] [PMC free article] [PubMed] [Google Scholar]
- 56.Koelsche C., Renner M., Hartmann W., Brandt R., Lehner B., Waldburger N., Alldinger I., Schmitt T., Egerer G., Penzel R., et al. TERT promoter hotspot mutations are recurrent in myxoid liposarcomas but rare in other soft tissue sarcoma entities. J. Exp. Clin. Cancer Res. 2014;33:33. doi: 10.1186/1756-9966-33-33. [DOI] [PMC free article] [PubMed] [Google Scholar]
- 57.Martin M. EMBnet; 2011. Cutadapt Removes Adapter Sequences from High-Throughput Sequencing Reads. [Google Scholar]
- 58.Andrews S. 2010. FastQC: A Quality Control Tool for High Throughput Sequence Data. [Google Scholar]
- 59.Li H., Durbin R. Fast and accurate long-read alignment with Burrows-Wheeler transform. Bioinformatics. 2010;26:589–595. doi: 10.1093/bioinformatics/btp698. [DOI] [PMC free article] [PubMed] [Google Scholar]
- 60.McKenna A., Hanna M., Banks E., Sivachenko A., Cibulskis K., Kernytsky A., Garimella K., Altshuler D., Gabriel S., Daly M., DePristo M.A. The Genome Analysis Toolkit: a MapReduce framework for analyzing next-generation DNA sequencing data. Genome Res. 2010;20:1297–1303. doi: 10.1101/gr.107524.110. [DOI] [PMC free article] [PubMed] [Google Scholar]
- 61.Dobin A., Davis C.A., Schlesinger F., Drenkow J., Zaleski C., Jha S., Batut P., Chaisson M., Gingeras T.R. STAR: ultrafast universal RNA-seq aligner. Bioinformatics. 2013;29:15–21. doi: 10.1093/bioinformatics/bts635. [DOI] [PMC free article] [PubMed] [Google Scholar]
- 62.Liao Y., Smyth G.K., Shi W. featureCounts: an efficient general purpose program for assigning sequence reads to genomic features. Bioinformatics. 2014;30:923–930. doi: 10.1093/bioinformatics/btt656. [DOI] [PubMed] [Google Scholar]
- 63.Love M.I., Huber W., Anders S. Moderated estimation of fold change and dispersion for RNA-seq data with DESeq2. Genome Biol. 2014;15:550. doi: 10.1186/s13059-014-0550-8. [DOI] [PMC free article] [PubMed] [Google Scholar]
- 64.Blighe K., Rana S., Lewis M. 2018. EnhancedVolcano: publication-ready volcano plots with enhanced colouring and labeling.https://bioconductor.org/packages/devel/bioc/vignettes/EnhancedVolcano/inst/doc/EnhancedVolcano.html [Google Scholar]
- 65.Zhao S., Guo Y., Sheng Q., Shyr Y. Heatmap3: an improved heatmap package with more powerful and convenient features. BMC Bioinf. 2014;15 doi: 10.1186/1471-2105-15-S10-P16. [DOI] [Google Scholar]
- 66.Subramanian A., Tamayo P., Mootha V.K., Mukherjee S., Ebert B.L., Gillette M.A., Paulovich A., Pomeroy S.L., Golub T.R., Lander E.S., Mesirov J.P. Gene set enrichment analysis: a knowledge-based approach for interpreting genome-wide expression profiles. Proc. Natl. Acad. Sci. USA. 2005;102:15545–15550. doi: 10.1073/pnas.0506580102. [DOI] [PMC free article] [PubMed] [Google Scholar]
- 67.Li T., Fu J., Zeng Z., Cohen D., Li J., Chen Q., Li B., Liu X.S. TIMER2.0 for analysis of tumor-infiltrating immune cells. Nucleic Acids Res. 2020;48:W509–W514. doi: 10.1093/nar/gkaa407. [DOI] [PMC free article] [PubMed] [Google Scholar]
- 68.Wickham H. Springer; 2016. ggplot2: Elegant Graphics for Data Analysis.https://ggplot2.tidyverse.org [Google Scholar]
- 69.Gu Z. Complex Heatmap Visualization. 2022;1:e43. doi: 10.1002/imt2.43. [DOI] [PMC free article] [PubMed] [Google Scholar]
- 70.Hass B., Dobin A., Stransky N., Li B., Yang X., Tickle T., Bankapur A., Ganote C., Doak T., Pochet N. STAR-Fusion: fast and accurate fusion transcript detection from RNA-seq. bioRxiv. 2017 doi: 10.1101/120295. Preprint at. [DOI] [Google Scholar]
- 71.Robinson J.T., Thorvaldsdóttir H., Winckler W., Guttman M., Lander E.S., Getz G., Mesirov J.P. Integrative genomics viewer. Nat. Biotechnol. 2011;29:24–26. doi: 10.1038/nbt.1754. [DOI] [PMC free article] [PubMed] [Google Scholar]
- 72.Thomas P.D., Ebert D., Muruganujan A., Mushayahama T., Albou L.P., Mi H. PANTHER: Making genome-scale phylogenetics accessible to all. Protein Sci. 2022;31:8–22. doi: 10.1002/pro.4218. [DOI] [PMC free article] [PubMed] [Google Scholar]
- 73.Hao Y., Hao S., Andersen-Nissen E., Mauck W.M., Zheng S., Butler A., Lee M.J., Wilk A.J., Darby C., Zager M., et al. Integrated analysis of multimodal single-cell data. Cell. 2021;184:3573–3587.e29. doi: 10.1016/j.cell.2021.04.048. [DOI] [PMC free article] [PubMed] [Google Scholar]
- 74.Ru B., Huang J., Zhang Y., Aldape K., Jiang P. Estimation of cell lineages in tumors from spatial transcriptomics data. Nat. Commun. 2023;14:568. doi: 10.1038/s41467-023-36062-6. [DOI] [PMC free article] [PubMed] [Google Scholar]
- 75.Mayakonda A., Lin D.C., Assenov Y., Plass C., Koeffler H.P. Maftools: efficient and comprehensive analysis of somatic variants in cancer. Genome Res. 2018;28:1747–1756. doi: 10.1101/gr.239244.118. [DOI] [PMC free article] [PubMed] [Google Scholar]
- 76.Kosmidis I., Kenne Pagui E.C., Konis K., Sartori N. 2023. brglm2: Bias Reduction in Generalized Linear Models.https://CRAN.R-project.org/package=brglm2 [Google Scholar]
- 77.Wang K., Li M., Hakonarson H. ANNOVAR: functional annotation of genetic variants from high-throughput sequencing data. Nucleic Acids Res. 2010;38:e164. doi: 10.1093/nar/gkq603. [DOI] [PMC free article] [PubMed] [Google Scholar]
- 78.Li M.M., Datto M., Duncavage E.J., Kulkarni S., Lindeman N.I., Roy S., Tsimberidou A.M., Vnencak-Jones C.L., Wolff D.J., Younes A., Nikiforova M.N. Standards and Guidelines for the Interpretation and Reporting of Sequence Variants in Cancer: A Joint Consensus Recommendation of the Association for Molecular Pathology, American Society of Clinical Oncology, and College of American Pathologists. J. Mol. Diagn. 2017;19:4–23. doi: 10.1016/j.jmoldx.2016.10.002. [DOI] [PMC free article] [PubMed] [Google Scholar]
- 79.Newman A.M., Liu C.L., Green M.R., Gentles A.J., Feng W., Xu Y., Hoang C.D., Diehn M., Alizadeh A.A. Robust enumeration of cell subsets from tissue expression profiles. Nat. Methods. 2015;12:453–457. doi: 10.1038/nmeth.3337. [DOI] [PMC free article] [PubMed] [Google Scholar]
- 80.Becht E., Giraldo N.A., Lacroix L., Buttard B., Elarouci N., Petitprez F., Selves J., Laurent-Puig P., Sautès-Fridman C., Fridman W.H., de Reyniès A. Estimating the population abundance of tissue-infiltrating immune and stromal cell populations using gene expression. Genome Biol. 2016;17:218. doi: 10.1186/s13059-016-1070-5. [DOI] [PMC free article] [PubMed] [Google Scholar]
- 81.Stransky N., Cerami E., Schalm S., Kim J.L., Lengauer C. The landscape of kinase fusions in cancer. Nat. Commun. 2014;5:4846. doi: 10.1038/ncomms5846. [DOI] [PMC free article] [PubMed] [Google Scholar]
- 82.Pratilas C.A., Taylor B.S., Ye Q., Viale A., Sander C., Solit D.B., Rosen N. (V600E)BRAF is associated with disabled feedback inhibition of RAF-MEK signaling and elevated transcriptional output of the pathway. Proc. Natl. Acad. Sci. USA. 2009;106:4519–4524. doi: 10.1073/pnas.0900780106. [DOI] [PMC free article] [PubMed] [Google Scholar]
- 83.Liberzon A., Birger C., Thorvaldsdóttir H., Ghandi M., Mesirov J.P., Tamayo P. The Molecular Signatures Database (MSigDB) hallmark gene set collection. Cell Syst. 2015;1:417–425. doi: 10.1016/j.cels.2015.12.004. [DOI] [PMC free article] [PubMed] [Google Scholar]
- 84.Li B., Dewey C.N. RSEM: accurate transcript quantification from RNA-Seq data with or without a reference genome. BMC Bioinf. 2011;12:323. doi: 10.1186/1471-2105-12-323. [DOI] [PMC free article] [PubMed] [Google Scholar]
Associated Data
This section collects any data citations, data availability statements, or supplementary materials included in this article.
Supplementary Materials
Data Availability Statement
-
•
There are restrictions to the availability of patient clinical and sequencing data. This is a retrospective cohort, and it is not possible to consent these patients with historic samples, particularly those with highly aggressive and rapidly lethal disease. As such, the IRB has requested that we do not publicly share individual-level sequencing data from each patient. The data is securely stored within a Vanderbilt patient data system. Aggregate-level data reported in this paper will be shared by the lead contact (Dr. Vivian Weiss) upon request. Individual-level data is only available through collaboration following approval of the lead contact and The Vanderbilt University Medical Center IRB. If the lead contact should leave the institution, collaboration requests should be directed to the Pathology Department Chair (Dr. Alice Coogan, alice.coogan@vumc.org).
-
•
Code for all analyses is available at the following link on GitHub: https://github.com/xgj797/Molecular-Signature-Incorporating-Immune-Microenvironment-Enhances-Thyroid-Cancer-Outcome-Prediction, and in a frozen repository on Zenodo: https://doi.org/10.5281/zenodo.8229499.
-
•
Any additional information required to reanalyze the data reported in this paper is available from the lead contact upon request.