Medical Sciences Correction for “Ablation of cytochrome P450 omega-hydroxylase 4A14 gene attenuates hepatic steatosis and fibrosis,” by Xiaoyan Zhang, Sha Li, Yunfeng Zhou, Wen Su, Xiongzhong Ruan, Bing Wang, Feng Zheng, Margaret Warner, Jan-Åke Gustafsson, and Youfei Guan, which was first published March 7, 2017; 10.1073/pnas.1700172114 (Proc. Natl. Acad. Sci. U.S.A. 114, 3181–3185).
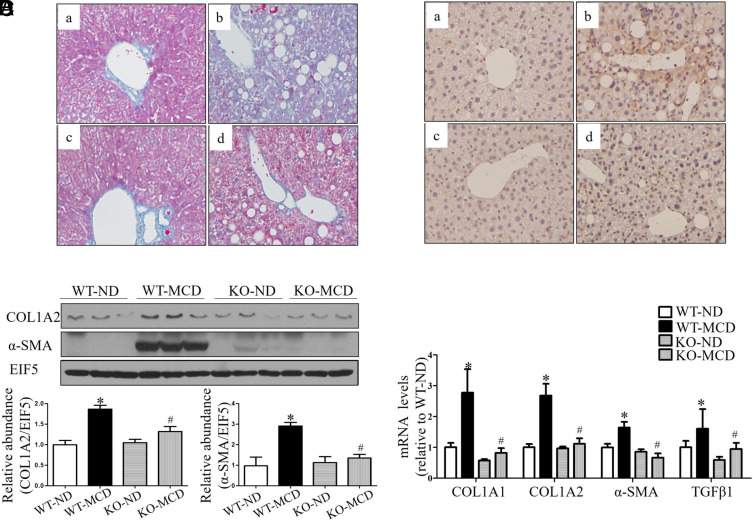
The authors note that Fig. 5C appeared incorrectly. In the published version, the image of EIF5 as an internal control for COL1A2, α-SMA protein expression was incorrectly inserted. The corrected figure and its legend appear below. The online version has been corrected.
Fig. 5.
“CYP4A14 deficiency ameliorated MCD-induced hepatic fibrosis. Male wild-type (WT) and cyp4a14−/− mice were fed with an ND (normal diet) or MCD diet for 8 wk. (A) Masson’s staining indicating that MCD-induced hepatic fibrosis was significantly attenuated in cyp4a14−/− mice. (a) WT on ND; (b) WT on MCD; (c) CYP4A14−/− on ND; (d) CYP4A14−/− on MCD. (Magnification: 200×.) (B) CYP4A14 gene deficiency markedly attenuated MCD-induced α-SMA protein expression in the livers as assessed by an immunostaining analysis. n = 5–7. (a) WT on ND; (b) WT on MCD; (c) CYP4A14−/− on ND; (d) CYP4A14−/− on MCD. (Magnification: 200×.) (C) Western blot assay demonstrating reduced protein levels of COL1A2 and αSMA in the livers of cyp4a14−/− mice. n = 3. (D) Quantitative RT-PCR analysis showing reduced mRNA levels of collagen 1a1, collagen 1a2, α-SMA, and TGFβ1 in the livers of cyp4a14−/− mice. mRNA levels of related genes of hepatic fibrosis, n = 5 to 7. *P < 0.05 vs. WT on ND; #P < 0.05 vs. WT on MCD. Data are presented as mean ± SEM.”


