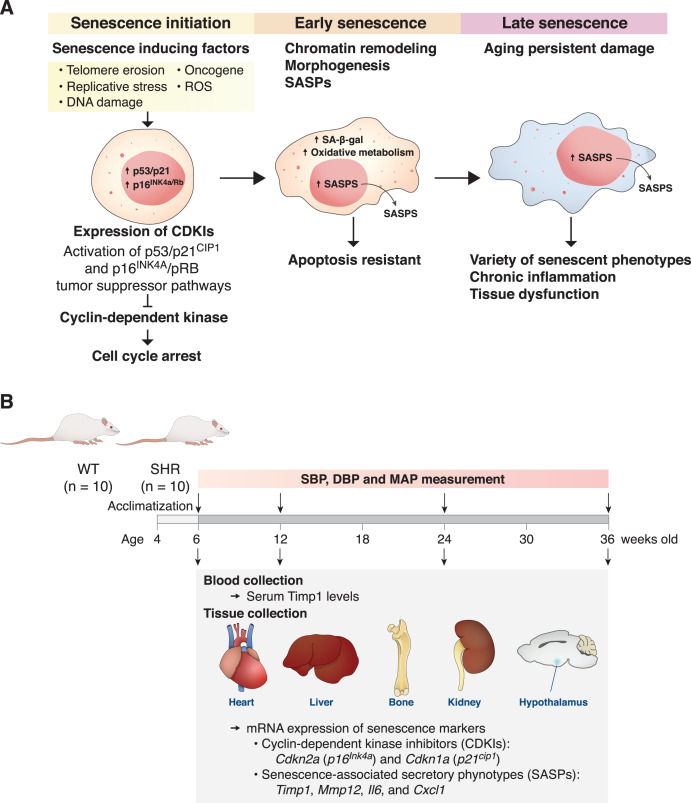
Figure 1. The mechanism of senescent cell progression and experimental timeline.
Diagram explains the mechanism of senescent cell progression from initiation to full senescence (A), and timeline of the present experiment (B), please see text for detail. CDKIs, cyclin-dependent kinase inhibitors; ROS, reactive oxygen species; SA-β-gal, senescence-associated β-galactosidase; SASPs, senescence-associated secretory phenotypes; SHR, spontaneously hypertensive rat; WT, normotensive wild-type rats; SBP, systolic blood pressure; DBP, diastolic blood pressure; MAP, mean arterial blood pressure.

