

Abstract
In this work, a numerical method is proposed to predict the electrokinetic phenomena and combined with an experimental study of the surface charge density () and zeta potential ( behavior is investigated for borosilicate immersed in KCl and NaCl electrolytes, and for imogolite immersed in KCl, CaCl2, and MgCl2 electrolytes. Simulations and experiments of the electrokinetic flows with electrolyte solutions were performed to accurately determine the electric double layer (EDL), , and at various electrolyte concentrations and pH. The zeta potential was experimentally determined and numerically predicted by solving the coupled governing equations of mass, species, momentum, and electrical field iteratively. Our numerical prediction shows that for borosilicate develops strong nonlinear behavior with the ion concentration following a power-law. Likewise, the obeys a nonlinear behavior, decreasing as the concentration increases. Moreover, for imogolite, both and the behave nonlinearly with the pH. The EDL for borosilicate and imogolite becomes thinner as the electrolyte concentration and pH increase; this behavior is caused by increased , resulting in the higher attraction of the free charges. The reported nonlinear behavior describes more accurately the interaction of the nanoparticle surface charge with the electrolytes and its effect on the electrolyte transport properties.
Keywords: Microchannel electrokinetic flow, Surface charge density and zeta potential, Electrical double layer, Nonlinear behavior
Nomenclature
Surface charge density,
Zeta potential,
Species concentration,
Time,
Diffusion coefficient,
Velocity,
Electrophoretic mobility,
Internal electric potential,
Electric field,
Species valence
Faraday constant,
Universal gas constant,
Temperature,
Fluid density,
Pressure,
Dynamic viscosity,
Free charge density,
External electric potential,
Electric current,
Electric conductivity,
Universal permittivity, )
Dielectric constant
Electroosmotic flow velocity,
Electrophoretic velocity,
1. Introduction
The electrokinetic (EK) involves the phenomena in which a liquid moves tangentially to a charged surface, where a better understanding gives rise to other related phenomenon such as electrophoresis, electroosmosis, and streaming potential. And gives rise to the foundation for many current advances in technological applications, such as microfluidic systems for lab-on-a-chip technologies [1], transportation in microchannel-based devices, chemical and biological detection [[2], [3], [4], [5]]; nanofluid preparation and stabilization studies [6,7]; soil analyses [8], and nanostructure materials for energy harvesting [[9], [10], [11], [12]]. Silica and silicate glass surfaces, for example, are the most common materials used to fabricate microchannels for chemical and biological transport processes [[13], [14], [15]]. Knowing the EK interaction between this type of material and different electrolytes results in better understanding and characterization of these processes. Moreover, this knowledge can improve fluid transport in micro and nanoscale microfluidic devices to accomplish better mixing and transport enhancement in microchannels [4,[16], [17], [18]].
In nanofluid preparation, one of the most challenging issues is achieving a stable dispersion of nanoparticles. Better knowledge of nanoparticle-fluid interaction can lead to more stable nanofluids and improved heat and mass transfer performance [6,7,19]. In which the EK phenomenon describes the ionic interaction between a material surface and a water-based solution, the EK phenomenon strongly influences the behavior of colloids in water [14,20,21] which is of crucial importance for the understanding of colloidal particle stability. E.g., the surface charge density and ion distribution over the particle's surface nearby area causes particles to repel each other by the electrostatic repulsion force. Hence preventing particle agglomeration and flocculation [22,23]. According to the electrokinetic theory and the first experimental discoveries, when the electrolytic solution contacts the solid surface wall, a spontaneous superficial electric charge--along with a surface charge density ()-- is generated, in which in aqueous media colloidal particles the surface charge for many natural materials it tends to be negatives [24]. In 1859 Georg Quincke [25] introduces the existence of a space charged outside the charged surface, of which the electric sign is opposite to the giving the first ideal for the electric double layer (EDL). Physically is a zone very close to the particle surface (the wall zone), containing ions with an opposite charge to the , is attracted to the wall, forming an immobile layer known as the Stern layer. Whereas ions with the same charge are repelled--generating a diffuse layer [26]. This structure is known as the electric double layer (EDL). Gouy (1910) [27] and Chapman (1913) [28] were the first to develop a theory to describe the behavior of this layer, giving rise to an important parameter to characterize EDL, the thickness of the diffuse layer usually called the Debye length () [29]. The surface that separates the Stern and the diffuse layers is known as the slip layer, and the value of the electric potential on this surface is known as the zeta potential ( [29]. The relative movement of ions between these two layers (caused by an applied external electric field), produces the EK flow. According to the theory from Gouy and Chapman, is an essential parameter that gives rise to, and characterizes, the EK phenomenon. Either positive or negative, is always present on the solid surface when in contact with a liquid [30].
Previous research has suggested that can depend on their ionic strength (electric conductivity or ion concentration), or the solution pH, modifying the active sites on the solid surface [31]. This dependence on the ion concentration can lead to values of and EK flow velocity that differ from those obtained when assuming constant [[32], [33], [34], [35]]. Previous work has reported correlations to model . Kang et al. [36] determined that the for NaCl solution and borosilicate is approximated well by a logarithm form. However, Luo et al. [37] and Fu et al. [38] assumed a constant to study the EK flow instability in order to improve mixing in a cross-shaped microchannel. The correct determination and features of , or the EK behavior, would provide essential information for a wide range of technological applications, such as from selecting electrolyte and microchannel materials in the application of EK flow to determining materials for energy harvesting.
Various analytical and numerical models have been proposed to investigate EK behavior. The Poisson-Nernst-Planck (PNP) theory is widely acknowledged and used to describe the influence of the ionic concentration gradients and electric field on the flux of ions. The most restricting challenge of the PNP model is appropriately defining the ion distribution that satisfies the electroneutrality condition, while simultaneously satisfying Poisson's equation [39,40]. The most common and widely used approach to solve the full nonlinear PNP equations, the EDL ion distribution, and imposing the electroneutrality condition is the Poisson-Boltzmann (PB) simplification [9,[41], [42], [43], [44], [45]]. In the PB approach, nonlinearity between the internal electrical field ( and the EDL ion distribution is approximated by a linear Boltzmann-type ion distribution. This approximation means that the EK phenomenon is not completely solved, neglecting the surface charge influence and its effect on the EK behavior. This assumption is limited by the equilibrium precondition, which assumes monovalent ions and symmetric electrolytes ( = = ; and = = ) [9,41,43]. In addition, the PB approach does not account for the ion motion (advection and diffusion) in the EDL formation [46]. Moreover, the PB approach is insufficient to predict the specific characteristics of the advection and diffusion motion of ions, because the Boltzmann ions distribution in the PB approach implies that the ions are distributed according to a thermodynamic equilibrium probability, such that the EDL can be assumed to be independent of the velocity field. This assumption is only valid for systems whose velocity is relatively low and does not affect the ion's movement. For the case of relatively medium-high velocity flow, it has been observed that the EDL field is strongly coupled to the velocity field. Therefore, the Nernst-Planck, Poisson, and Navier-Stokes equations must be solved simultaneously to determine the local ions concentration, electric double layer field, and velocity field [46]. Ninham and Parsegian (1970) [47] used a mathematical formulation (Elliptic Jacobian functions) to solve the fully non-linear PB equation, in which the authors assume an exponential function to emulate the charge density and internal electrical potential behavior for a biological cell. The results obtained can be extended from a monovalent to the divalent electrolyte, concluding that, for a more realistic representation of the cell surface may be necessary to include and recognize that ionizable groups are distributed over a region and not confined to a plane layer, and better knowledge and understanding of the thickness of the charged layer.
In recent years with the use of computational tools, the Lattice-Boltzmann method (LBM) has demonstrated the ability to capture liquid flow features in microscopic complex microchannels and to model electrokinetic flows (EKF) in straight microchannels with complex boundary conditions [[48], [49], [50]]. However, these studies have focused mainly on simulating the mixing of species by EK flow instabilities and not on the ion motion and its effect on the EDL formation and distribution, which requires the ion behavior near the boundaries [51].
Fig. 1 shows the systematic bibliographic review result using VOSviewer with the article's titles and abstracts from the SCOPUS database. Fig. 1 a) shows the review result grouped in three clusters collecting topics related to the electrokinetic experimental investigation (red), numerical study (green), and technological application (blue), and their respective interrelation represented by the links and, Fig. 1 b) shows each cluster's weight, e.g., the PB simplification formulation to simulate the phenomenon related to EK has a higher weight and presents more co-relationship. On the contrary, the numerical simulation using a fully coupled formulation based on the fundamental conservation laws and not considering the PB simplification shows a lower weight. From this perspective, a lower intensity level shows that there is a gap in knowledge and physical aspects to explore. In addition, the Lab-on-chip technology has been investigated over the last decade, and most of these works are focused on electroosmosis and electrophoresis flow for particle selection and separation, which further EK phenomenon studies are required concerning a better understanding and properties behavior characterization. Following this train of thought, the present work aims to simulate and predict the complete EK phenomena behavior, taking into account the ion advection, diffusion, and electromigration for a wide variety of electrolytes (Monovalent or divalent and asymmetric electrolytes) and pH conditions, and to analyze the EDL behavior, determining the nonlinear dependence on ionic strength and pH of surface charge density and zeta potential.
Fig. 1.

Global overview of the systematic article's titles and abstracts analysis using two queries, Q1 electrokinetic phenomenon.; and Q2 Poisson-Nernst-Planck equations. a) is the result grouped in three mains clusters. b) is the heat map showing each cluster's weight.
To address the difficulties of accurately modeling the ion distribution within the EDL (free charge density ), surface charge density (), and zeta potential () behavior for electrolytes without being constrained by the PB simplification, a proper set of governing equations, numerical simulations methodology, and experimental techniques are required. For numerical simulations, the conservation of mass and momentum equations (in terms of the velocity field), were used here, as well as the external applied electrical field, the conservation of species in terms of ion concentrations that consider electromigration, diffusion, and convection, the conservation of electric current, Ohm's Law, and an appropriated expression for due to the ions' electromigration--with no assumptions. For borosilicate immersed in KCl and NaCl, and imogolite immersed in KCl, CaCl2 and MgCl2 the electroosmotic velocity (EOF) and were experimentally measured and calculated using the Helmholtz–Smoluchowski expression, for different concentrations and pH, respectively. Wich experimental values was used as fitting parameter to determine numerically corresponding to each experimental scenario, as well as other features such as internal electric potential (, ion concentrations in the EDL, and their effect on the surface electrical properties.
This article is focused on solving and predicting the EK phenomenon behavior using a fully coupled formulation based on the fundamental conservation laws without PB simplification. For this instance, the EK phenomenon is solved completely, taking into account the ion motion, the advection, diffusion, and electromigration for a wide variety of electrolytes (Monovalent or divalent and asymmetric electrolytes) and pH condition by introducing as the unique parameter. This paper is organized as follows: First, a general coupled scheme is proposed to predict the EK phenomenon which can overcome the noted limitations, including the EDL formation and the ability to establish a relationship to predict the behavior of for a variety of solid and electrolyte configurations. Next, a more accurate approach to determine the EDL and nonlinear behavior is presented to improve EK understanding, suitable for various microfluidic and nanofluidic applications such as those in micromixers, drug transport devices for particle detection, and nanofluid preparation. Section 2 presents a detailed description of the coupled nonlinear equations, based on the complete PNP equations, considering convection and electromigration of ions. These equations are solved by coupling with the Navier-Stokes, electrostatic and current conservation equations. Ion distribution and EDL formation are solved without resorting to PB simplification. Instead, ion distribution in EDL is determined by satisfying the electroneutrality condition, coupled with Poisson's equation and . In this proposed approach, the EK flow velocity and pressure fields are calculated using free-charged ion density distribution in the EDL, and the external electric field, as the driving force term. Under these considerations, all variables must be determined simultaneously by solving the complete set of equations in a coupled way.
Section 2 describes the numerical procedure for accurately simulating and capturing the EDL, zeta potential, and surface charge density in microchannels with different electrolytes. Section 3 presents experimental procedure, electrolyte solution preparation and zeta potential measurements. Section 4, present and discusses the experimental and numerical results, specifically the EK numerical simulations with experimental data fitting. Zeta potential and surface charge density results for borosilicate immersed into KCl and NaCl electrolytes at different ion concentrations, and imogolite immersed into divalent electrolyte solutions at different pH values, as discussed. Last, Section 5 offers conclusions, emphasizing the contributions of this work and the next research steps.
2. Governing equations and numerical model and methodology
This section provides the governing equations and the numerical model developed to simulate the EK phenomenon in microchannels. To address the challenge of modeling ion distribution and surface charge, and to accurately predict the Electric Double Layer (EDL), a broad numerical scheme was developed, based on the complete set of Poisson-Nernst-Planck (PNP) equations, without using the Poisson-Boltzmann (PB) approximation. This scheme was fully coupled with the equations for momentum conservation and charge transport in electrolytes, resulting in a highly nonlinear system.
2.1. Governing equations
The governing equations that describe electrokinetic flow in a microchannel consist to solve simultaneously the mathematical models for fluid motion, ionic mass transport and the external electric field generated by the applied electric current. Therefore a set of the fundamental conservation laws for incompressible fluids are considered: The fluid model motion considered the conservation of momentum and mass equations for incompressible Newtonian fluids are given by (1), (2), respectively, where is the fluid density, is the dynamic viscosity, is the velocity and is the pressure.
| (1) |
| (2) |
The last term of equation (1) is the driving force for the fluid motion, given by the distribution of the ion free charge density in the EDL and the external electric field induced by the applied electric potential as [52]. Since a direct current (DC) is applied to generate the motion of the particles flow into the zeta meter to measure the experimental zeta potential, the is determined by solving the conservation of the electric current equation (3), where is the electric charge density that remains constant, and therefore , and is the electric current; here is the current induced by the diffusion of cations and anions, is the current produced by the electromigration of the ions [53], and is the electric current resulting from the applied to the medium characterized by its electrical conductivity [38].
| (3) |
Assuming that and are negligible compared to the applied external current, is approximately two orders of magnitude smaller than , equation (3) becomes . Using Ohm's Law , equation (3) eventually becomes [52].
The ionic mass transport model corresponds to a general multi-ionic species mass conservation, equation (4), considering the ionic species convection and electromigration motion, describing the movement of the ions within the internal electric field.
| (4) |
Where is the ion concentration and the subscript refers to the ion's species (cation, ), negative (anion, ); and are the electrophoretic mobility and diffusive coefficients of the species, respectively; is the electrical field, calculated as the gradient of the internal electric potential , given by [52]. The electrophoretic mobility of the ions was determined using the Nernst-Einstein relation, given by where is the valence of the ion, is the Faraday constant, R is the universal gas constant, and is the temperature of the background electrolyte [39]. Since two species with different values of , , and for each species are considered, a more general approach was proposed to determine the ion's movement considering the electroneutrality condition into the physical domain, which depends on the ion concentration, the velocity field and the internal electric potential, as shown by (4). eq. (4) presents +1 unknown variables, the ions' concentration , and the internal electrical potential . The ions' spatial distribution within the EDL due to the ions' electromigration conducted to the free charge density must satisfy the electro neutrality condition that is, 0, where , and are unknown. To determine , previous investigations have mainly used the classic PB charge distribution approximation to approximate the ion distribution and [9,[41], [42], [43]]. However, this simplification and linearization can be used only for a monovalent and binary ionic solution, where , , and the mobility of both species are similar, as are the mass diffusivities of the species [42,54]. Therefore, the Poisson equation, eq. (5) corresponds to the third equation, which coupled with equation (4) provides the solution to describe the ions distributed within the EDL due to the ions' electromigration, providing information of to solve equation (1). And the can be determined by the solid surface charge density as the only adjustable parameter by applying Gauss's Law as surface boundary condition given by [55,56]
| (5) |
where is the medium dielectric constant and is the constant of permittivity of free space. In (5), and are unknown. All the variables in this model , , , , and had to simultaneously satisfy equations (1), (2), (3), (4), (5), which are highly nonlinear and coupled. There are eight independent variables and eight scalar governing equations. To solve this nonlinear coupled system, the following iterative procedure was developed: For each time , where was the initial time, and was the final time, the procedure began with an initial guess value of in (5), which made it possible to calculate and . Using the final form of (3), , with the applied , was determined. Then, using (1), (2), (4) and the electro neutrality condition, the initial values of , and were ascertained. Using the Helmholtz-Smoluchowski expression , where is the space average velocity, the initial zeta potential value was calculated and compared to our experimental or theoretical values when there was no experimental information. If the relative error between the numerical and experimental values was not small, the proposed initial value was adjusted to a new value and the entire calculation procedure repeated.
2.2. Computational domain and boundary conditions
Fig. 2 shows the domain for both numerical simulations and physical experiments for characterization and validation, which was based on the Sze's experiment apparatus [33]. It consisted of a parallel-plate microchannel confined between an inlet and outlet reservoirs, with longitudinal streamwise- length l, crosswise- length h, and transversal spanwise-- length w, and gravity acted in the negative -direction see Fig. 2 a) and b). Previous investigations showed that, although the physical domain was a 3D domain given the electrokinetic flow, it showed symmetric behavior in the -direction and a 2D two-directional nature (-and-). To save computational resources without losing or missing all the electrokinetic flow features, 2D time-dependent simulations were performed for a wide range of physical properties and parameters. The boundaries were indicated as 1, 2, 3 and 4 in the clockwise direction is showing in Fig. 2 c). Boundary ① was set up as the symmetric condition. The boundaries ②, ③ and ④ were outlet, wall, and inlet, respectively. A detailed description of boundary condition values is shown in Table 1.
Fig. 2.

Physical and computational domains for this investigation. Image a) is physical domain for the electrokinetic flow through a straight microchannel based on the Sze's experiment configuration [33]. Image b) shows 2D computational domain location and dimensions in the microchannel (because experiments demonstrated symmetric behavior of the flow with respect to z = 0, and y = h). Image c) is chosen 2D computational domain and boundaries, indicated as 1, 2, 3 and 4. EK flow is from the left to right.
Table 1.
Initial and boundary conditions for proposed model.
| Equation | Initial and boundary conditions | ||
|---|---|---|---|
| Momentum conservation (1) and (2) |
|
||
| Electric current conservation (3) |
|
||
| Ion concentration conservation (4) |
|
||
| Electrostatic (5) |
|
Table 1 shows the initial and boundary conditions applied to the 2D computational domain and represented by equations (6)–(9). For equations (1), (2), at the fluid is at rest, and there is atmospheric pressure at the inlet and outlet. For , nonslip and symmetry are applied at and , respectively; the atmospheric pressure remains at the inlet and outlet. For equation (3), the external potential at is throughout the entire domain, and for at the inlet and at the outlet, at and are electric insulation . For equation (4), the ion concentration at is C bulk and is specified for all the boundaries for . And in (5), the internal potential is zero at in the entire domain. For at the inlet and outlet are zero charge , respectively; at , is given by the surface charge density as and is considered as solution bulk given by zero charge.
The fully coupled model equations (1), (2), (3), (4), (5) were simultaneously solved using the finite element method, and an iterative process, fully described in a later section, to determine all the variables that satisfy equations (1), (2), (3), (4), (5). The iterative procedure began with an initial guess value of to calculate initial values of , , and . Then, the initial value of is updated until all the variables converge. To ensure mesh independence and confidence in the numerical results, several simulations with different meshes were performed to accurately capture the values of the variables. A relative error between consecutive meshes of an increasing number of nodes and elements was defined to determine independent mesh behavior. The chosen mesh included 1.250.407 triangular cubic elements, with the smallest element size being 4 .
3. Experimental procedure
This section provides the experimental procedure carried out in the present work including the preparation of electrolyte samples and the procedure for the measurement of the zeta potential.
3.1. Preparation of electrolyte solution
Solutions of KCl and NaCl (analytical grade), with molar concentrations ranging from 0.1 to 10 were prepared using deionized water (2.2 2 % ; pH = 6.8 0.2) by dilution of a 100 stock solution of KCl and 100 stock solution of NaCl. The borosilicate was ground to a fine powder and then mixed with the KCl and NaCl electrolytes. A similar ground procedure was performed for the imogolite and its addition to the KCl, MgCl2 and CaCl2 electrolytes. Once prepared, all solutions were bottled and stored at 15 °C before conducting the measurements, as detailed in the followed section.
3.2. Zeta potential measurements
The zeta potential at different levels of ion concentrations was measured using the ZM 4.0, Zeta-Meter Inc., whose operation is based on the principle of microelectrophoresis. The was determined using the Helmholtz-Smoluchowski expression, equation (10) [33,34,57] by measuring the borosilicate's electrophoretic velocity. The EK interaction between borosilicate and the electrolyte was created by adding approximately 10 of powdered borosilicate into 200 of electrolyte solution, and approximately 50 ml of the mixture is deposited into the Zeta-Meter positive and negative cell. An electric potential was applied to generate an external electric field ( = 600 ), producing the charged particles to flow to the negative cell. Fig. 3 shows a schematic of the experimental procedure for the measurement.
| (10) |
In equation (10), is the electrophoretic velocity of the particle, = 78.5 and 8.854, respectively [33]. The pH of the electrolytes was measured using the pH meter (Hanna Instrument, model pH 21). The pH for both electrolytes was about 5.4 0.1 for KCl and 5.8 0.2 for NaCl. The electric conductivity of the electrolyte was measured using the conductivity meter (Hanna Instruments, model EC 215) at a constant temperature (24 °C) maintained by a cooling circulation bath (JSR, model JSRC-13C). Table 2 shows the average electrical conductivities and the standard deviation for NaCl and KCl solutions in different molar concentrations, for which measurements were repeated three times at a controlled temperature.
Fig. 3.

Schematic of the experimental procedure for zeta potential measurements.
Table 2.
Electric conductivity at 2 °C for KCl and NaCl electrolytes. The.
|
Concentration |
NaCl |
KCl |
|---|---|---|
|
|
|
|
| 0.1 | 21.52 0.43 | 26.52 0.53 |
| 0.2 | 32.60 0.65 | 45.61 0.91 |
| 0.4 | 62.02 1.24 | 78.77 1.58 |
| 0.6 | 92.56 1.85 | 104.75 2.09 |
| 0.8 | 120.19 2.40 | 131.39 2.63 |
| 1.0 | 141.73 2.83 | 182.79 3.66 |
| 1.5 | 229.32 4.59 | 274.33 5.49 |
| 2.0 | 321.44 6.43 | 390.71 7.81 |
| 3.0 | 463.24 9.26 | 533.62 |
| 4.0 | 588.14 12.14 | 627.87 12.56 |
This section provides the experimental and numerical results discussion. Zeta potential and surface charge density results for borosilicate immersed into KCl and NaCl electrolytes at different ion concentrations and imogolite immersed into divalent electrolyte solutions at different pH values.
4.1. Numerical model validation and comparison with PB simplification and existing results
For validation, the numerical results of internal electrical potential , from this model, produced by the ion's movement within the EDL and the EK flow velocity, were compared with results from the literature, obtained using PB simplification. First, the and EK flow velocity profiles were presented for a microchannel of height h. for steady state conditions. The profile from the solid wall to the solution bulk of the analytical PB simplification distribution is given by equation (11) [54].
| (11) |
where is the distance from the surface in contact with the electrolyte to the solution bulk, h is the microchannel height, , , and is the Debye length by assuming the PB simplification.
Fig. 4 shows the internal electric potential profile for KCl and NaCl for 1 mM and 10 mM as a function of the distance from the wall obtained numerically ( and
and  ), and analytically using the PB assumption solution (solid and dashed lines). Both results showed a decreasing behavior of from the maximum value on the surface wall (), caused by a higher ion concentration, towards the bulk solution, where the internal electric potential reached a zero value () due to the electroneutrality condition, equation (5) [39,54].
Fig. 4.

Internal electric potential profile for KCl and NaCl for 1 and 10 mM as a function of the y-distance from the wall. and represent the numerical solution; solid and dashed line are analytic PB assumption solution. Close-up shows EK phenomenon and EDL configuration.
Next, two additional sets of simulations were performed to verify and validate the nonlinear coupled model. The first set of simulations corresponded to an EOF in a plane channel of width which was performed according to the physical parameters reported by Wang et al. [42]. The EOF velocity profiles obtained with this work model for different microchannel widths were compared with results using the PB simplification reported by Wang et al. [42] (dashed line). Fig. 5 shows that these velocity profiles displayed the typical flat shape for a developed EOF. The average flow velocity relative error between these results and those reported by Wang was less than 2.5 %.
Fig. 5.

Electroosmotic flow (EOF) velocity profiles for different microchannel width h, square symbols represent the numerical solution for 0.1 mM KCl electrolyte, = 500 v/m, and = 1.25 × 10⁻³ C/m2. Dashed lines are numerical solutions reported by Wang et al. [42] for the same conditions obtained using PB approximation. Each solution presents the typical shape of the EOF profile.
In the second set of simulations, the surface charge density and the microchannel height h = 0.6 were maintained invariant, while the applied was varied to investigate the influence of on the EK features.
Table 3 shows numerical results of the average EOF velocity and the zeta potential , calculated using the Helmholtz-Smoluchowski expression [57] for different values of . Note that the increase of the produced only an increment of the EOF average velocity, while the value remained unchanged. This result means that the zeta potential did not change with the variation of applied . Based on the numerical simulation results shown in Fig. 3, Fig. 4, this coupled nonlinear numerical model and methodology were appropriate to simulate, characterize and predict the EK flow features. It was also verified that the microchannel height did not affect the EK flow average velocity. Moreover, Table 3 demonstrates that the average velocity increase was related to the increase of the applied , while the zeta potential remained constant. Therefore, the surface charge density seems to be the only parameter to define EK flow features in terms of internal potential and its effect on the ion concentration and velocity fields.
Table 3.
Numerical result of average EOF velocity and for 1.0 mM KCl electrolyte, with different .
|
|
Average EOF velocity | Zeta potential |
|---|---|---|
| 500 | 4.4 | −12.65 |
| 1000 | 8.8 | −12.65 |
| 6000 | 52.8 | −12.66 |
| 13000 | 114.5 | −12.67 |
4.2. Numerical results of zeta potential and surface charge density and experimental comparisons
This section presents numerical results of the zeta potential and surface charge density of borosilicate with potassium chloride (KCl) and sodium chloride (NaCl) solutions, and imogolite with potassium chloride (KCl), calcium chloride (CaCl2) and magnesium chloride (MgCl2). Experimentally measured zeta potential and electrophoretic mobility were used to obtain the converged value of the iterative methodology, to solve the coupled nonlinear governing equations and validate the numerical results. Zeta potential and surface charge density numerical and experimental results are discussed for borosilicate immersion into concentrated KCl and NaCl electrolytes at different concentrations, and of electromobility, surface charge density and zeta potential for imogolite suspended in divalent electrolyte solutions of CaCl2 and MgCl2 at different pH values.
4.2.1. Zeta potential and surface charge for borosilicate immersed in different concentrated KCl and NaCl electrolyte
Time dependent 2D numerical simulations were conducted to accurately obtain the zeta potential and surface charge density , and ion distribution within the EDL, and to compare them with existing experimental information of and . Mesh size was optimized to accurately resolve the main features of ion distribution, internal potential profile and surface charge density at the solid surface. A quadratic Lagrange polynomial was chosen to represent the behavior of the variables in each element of the computational domain. The ions’ diffusive coefficients and valences were obtained from the literature, with 1.957 , 2.032 , 1.33 , = 1, = 1 and = 1 [42]. The fluid electric conductivity σ was experimentally measured σ, and and were those of the water at the temperature of the experiment. The applied external electric field = 600 was based on the zeta potential experimental values.
Fig. 6 shows the experimental data of the zeta potential for borosilicate in NaCl and KCl background electrolyte. The empty symbols ( NaCl and KCl) represent this experimental data; black, green, and blue dots are data reported by other investigators [[32], [33], [34]]. For a binary electrolyte, Hunter [16] suggested a power-law model to describe the variation of with the ion concentration, which obeys the expression ; where is the ions’ concentration, it corresponds to a binary electrolyte in which , and and are constants that fit the experimental data. Table 4 shows the expression to describe the behavior for KCl and NaCl, equations (12) and (13)respectively; and the values of and obtained from the experimental data and the fitting curve result of the nonlinear regression analysis with 95 % confidence. In Fig. 5 it can be seen that the results obtained with the model presented good agreement with the experimental data and reasonable agreement with results reported by Gu et al. [32], Sze et al. [33] and Venditti et al. [34]. In their work, the zeta potential of borosilicate, in contact with different electrolytes at similar concentrations, was determined experimentally by monitoring the change of the electric current produced by the electrolyte displacement driven by the EOF velocity, and using the Helmholtz–Smoluchowski, equation (10). The good agreement shown in Fig. 6 confirms that the proposed model is suitable to represent and describe the investigated phenomenon. According to the double layer theory, the value of the zeta potential is considered an electric potential () to be located very close to the beginning of the diffuse layer (the Stern layer) [29]. Given the magnitude of increases with the diffuse layer thickness increment. Therefore, it observes a variation of the zeta potential due to the EDL decrease. Based on the experimental results, it indicates that the diminution of the EDL is due to; on the one hand, in the case of the same type of electrolyte, it is due to the increase in the concentration of the ionic species. On the other hand, in the case of different kinds of electrolytes, the zeta potential variation is mainly due to the size of the counterion, verifying what was observed and reported in previous studies, in which the negative is due to negative [58] and its variation is due to the electrolyte concentration, as the electrolyte concentration was increased, the zeta potential is decreased [59]. And also is due to the influence of the counterions size, as the counterions size lager is increased, the EDL thickness is increased [51]. Tadros and Lyklema [60] experimented using a counter charge-surface charge balance, and an analytical study investigated the of silica, reported that the increases in the order of the counterion size. An explanation of this observation is due to the cation penetration inside the pores of the layer, the extent of which depends to a large extent on the cation volume. The numerical results obtained in the present work indicate that the difference in the size of the counterion, in addition to the , it also generates a diminution in the thickness of the EDL, as shown in the close-up picture. There shows, the EDL thickness for KCl is larger than the NaCl. Therefore, the magnitude also obeys the same trends, in which the EDL thickness increases according to the larger counterions size.
Fig. 6.

Experimental data of zeta potential for borosilicate in NaCl and KCl electrolytes. is NaCl, is KCl from the experiment data; dashed and solid lines show the borosilicate zeta potential nonlinear behavioral trends in NaCl and KCl solutions, respectively. Black, green, and blue dots are data reported by other investigators [[32], [33], [34]]. Close-up shows internal potential () profile and the EDL thickness produced by KCl (dash line), and NaCl (solid line) electrolytes respectively. (For interpretation of the references to colour in this figure legend, the reader is referred to the Web version of this article.)
Table 4.
Power law models of zeta potential for borosilicate in contact with different electrolyte.
| Zeta potential models | |||
|---|---|---|---|
| Background electrolyte | Solid | Model proposed | Eq. |
| KCl | borosilicate | (12) | |
| NaCl | borosilicate | (13) | |
The experimental zeta potential value was used as the convergence parameter in these numerical simulations and to obtain a better understanding of the ion concentration role over and the EDL formation. Table 5, Table 6, show the experimental and numerical zeta potentials as a function of the ion concentration for borosilicate in contact with KCl and NaCl electrolytes, respectively. For both electrolytes, the relative error between the numerical and experimental values are smaller than 0.31 % for borosilicate in contact with KCl electrolyte, and smaller than 0.64 % for borosilicate in contact with NaCl electrolyte, demonstrating good agreement between the numerical solution results and the experimental values. Table 5, Table 6 also show the decreasing behavior of as the ion concentration increased for borosilicate in contact with KCl and NaCl, respectively. In both cases, decreased as the ion concentration increased.
Table 5.
Surface charge density determined by experimental zeta potential adjustment with KCl electrolyte.
| Borosilicate in contact with KCl electrolyte | |||||
|---|---|---|---|---|---|
| Concentration | * |
*Particle velocity | † |
† |
error % |
| 0.1 | −89.53 | 3.038 | −89.33 | −4.39 | 0.22 |
| 0.2 | −86.68 | 2.911 | −86.48 | −5.33 | 0.23 |
| 0.4 | −83.32 | 2.818 | −83.20 | −6.57 | 0.14 |
| 0.6 | −79.61 | 2.694 | −79.51 | −7.25 | 0.13 |
| 0.8 | −78.97 | 2.689 | −78.79 | −8.08 | 0.23 |
| 1.0 | −77.86 | 2.672 | −77.69 | −8.72 | 0.22 |
| 1.5 | −71.64 | 2.446 | −71.49 | −9.18 | 0.21 |
| 2.0 | −66.43 | 2.286 | −66.30 | −9.33 | 0.20 |
| 3.0 | −64.01 | 2.186 | −63.81 | −10.72 | 0.31 |
| 4.0 | −61.37 | 2.110 | −61.27 | −11.51 | 0.16 |
Note: *Experimental results. †Numerical results, present work. % is relative error between experimental and numerical .
Table 6.
Surface charge density determined by experimental zeta potential adjustment, NaCl electrolyte.
| Borosilicate in contact with NaCl electrolyte | |||||
|---|---|---|---|---|---|
| Concentration | * |
*Particle velocity | † |
† |
error % |
| 0.1 | −36.24 | 1.428 | −36.16 | −1.11 | 0.22 |
| 0.2 | −34.51 | 1.279 | −34.43 | −1.39 | 0.23 |
| 0.4 | −32.82 | 1.222 | −32.72 | −1.77 | 0.30 |
| 0.6 | −30.42 | 1.137 | −30.48 | −1.96 | 0.20 |
| 0.8 | −28.01 | 1.048 | −28.19 | −2.04 | 0.64 |
| 1.0 | −27.90 | 1.052 | −27.86 | −2.23 | 0.14 |
| 1.5 | −26.81 | 1.006 | −26.75 | −2.60 | 0.22 |
| 2.0 | −24.93 | 0.941 | −24.86 | −2.74 | 0.28 |
| 3.0 | −24.75 | 0.931 | −24.71 | −3.33 | 0.16 |
| 4.0 | −24.31 | 0.918 | −24.30 | −3.75 | 0.04 |
Note: *Experimental results. †Numerical results, present work. % is relative error between the experimental and numerical .
Fig. 7 shows behavior in terms of the ion concentration for borosilicate in contact with KCl () and NaCl electrolytes (). Note that was more likely to acquire a negative sign (a typical behavior for borosilicate) because of the silanol group's dissociation on the silicate surface in contact with water [31]. Moreover, it was possible to observe that the addition of the KCl and NaCl ions affected the electrical activity between the liquid and the borosilicate surface, with KCl exhibiting a higher affinity than NaCl to acquire higher surface charge. The behavior of for borosilicate with both electrolytes obeyed a power-law function to the ion concentration, with , where is the ion concentration and and are constants fitting parameters. The constant value of 0.32 corresponds to the base value of for borosilicate in contact with deionized water, reported by Squires and Brenner [61] and verified by Behrens and Grier [31]. Which were calculated by performing a non-linear curve fit using the Levenberg-Marquardt method, which is characterized in that it is possible to find a solution even if it starts very far from the final minimum [62,63]. The maximum tolerance set was 1 × 10⁻⁶, with a confidence region of 95 %. Table 7 shows the proposed power-law function to describe the behavior for KCl and NaCl, equations (14) and (15)respectively; and the respective and values obtained through the curve fit.
Fig. 7.
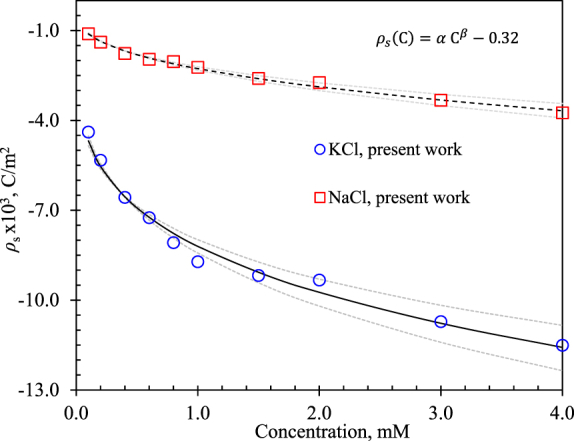
Numerical results of surface charge density obtained from experimental zeta potential fitting of borosilicate in contact with KCl () and NaCl electrolytes (). Solid and the dashed lines show behavior trend of with 95 % confidence bounds (clearer dashed lines) as a function of ion concentration.
Table 7.
Power law models of surface charge density for borosilicate in contact with KCl and NaCl electrolytes.
| Surface charge density model | |||
|---|---|---|---|
| Background electrolyte | Solid | Model proposed | Eq. |
| KCl | borosilicate | (14) | |
| NaCl | borosilicate | (15) | |
Note that most of the data were fitted inside the limit of certainty where the correlation coefficients were 0.98 and 0.99 for the KCl and NaCl, respectively. Table 5, Table 6 show a lower particle velocity for KCl and NaCl electrolytes, respectively, as the ion concentration increased in the experimental range. This velocity reduction seems to have been caused by EDL thinning, which produced a lower EK flow drive force ( which then led to slower EK velocity, as will be discussed below.
Fig. 8 a) shows the internal electric potential profile from the surface wall, () to the solution bulk () for ion concentrations ranging from 0.1 to 4.0 mM. As the ion concentration increased, the EDL and Debye length () became thinner. A thinner EDL led to less , meaning that at constant, the product was lower, reducing the EK flow driving force and consequently slowing EK flow velocity.
Fig. 8.

a) Internal potential φ profile produced by electromigration of potassium ions (K+) due to negatively charged surface for different levels of ion concentration. Close-up shows internal potential φ profile produced by electromigration of sodium ions (Na+); arrow indicates EDL thinning direction. b) Normalized free charge density distribution , produced by different surface charge density on borosilicate–KCl with different levels of ion concentrations. Close-up shows normalized free charge density distribution for borosilicate in contact with NaCl.
Previous authors reported similar EDL thinning behavior. Brown et al. [59] experimentally quantified the average thickness of the Stern layer at the silica (SiO2) nanoparticle/aqueous NaCl electrolyte interface using an X-ray photoelectron spectroscopy (XPS); they observed that as the electrolyte concentration was increased, the surface charge density also increased. A decrease in the zeta potential was observed, indicating a thinner EDL. Bohinc et al. [51] used the fourth-order Runge-Kutta method to solve the simplified Poisson-Boltzmann (PB) scheme and numerically quantify the EDL's average thickness. Their study showed that EDL increased with the size of the counterions and the decrease of the electrolyte ions' concentration, whereas changing the surface charge may cause a variation in EDL thickness--either a decrease or an increase.
Based on the numerical predictions, EDL slimming (a thinner EDL), is mainly due to the increased , which produces a higher attractive electric force to the counterions towards the charged surface (e.g., K+). This higher attractive force causes a higher attraction of free charge, resulting in a more compact EDL that reduces the free charge density and the internal electric potential , leading to a lower and smaller electrokinetic flow velocity. As shown in the close-up picture, similar behavior was obtained for Na + ions. Fig. 8 b) shows the normalized free charge density distribution produced for borosilicate in contact with KCl as a function of ion concentrations. The close-up shows normalized free charge density distribution for borosilicate in contact with NaCl. This figure shows that as the ion concentration increased, the normalized free charge density / decreased, in all mentioned figures the arrow indicates the decrease or thinning direction. Thus, these numerical results, Fig. 6, Fig. 7, Fig. 8 provide a simple and intuitive image of EDL behavior which explains the concurrent increase in surface charge density, but a decrease in surface and zeta potentials, as the electrolyte concentration was increased.
4.2.2. Surface charge density of imogolite suspended in divalent electrolyte solutions (CaCl2 and MgCl2) at different pH values
This section describes the and behavior of imogolite, a nanotubular aluminosilicate, in contact with the divalent electrolytes () calcium chloride (CaCl2) and magnesium chloride (MgCl2). The imogolite's experimental electrophoretic mobility (), reported by Arancibia-Miranda et al. [8] was used as a parameter to validate these numerical simulations and the iterative process. The relationship between and the zeta potential given by (16) is derived from the Helmholtz-Smoluchowski equation (10) by knowing the particle's electrophoretic velocity and the applied electric field [64,65].
| (16) |
Additional numerical simulations were performed using data from the electrophoretic mobility of the imogolite in contact with KCl to verify that the iteration scheme was consistent and to provide reliable results. Once the consistency of the model was verified, the imogolite behavior was simulated with the divalent electrolytes CaCl2 and MgCl2, in which the diffusive coefficient and valences of the calcium and magnesium ions were those reported in the literature: 7.9 , 7.1 , 2 and 2 [66]. The and values of the electrolyte were assumed to be those of water at the corresponding temperature.
Table 8, Table 9 show numerical and experimental results of the electrophoretic mobility and zeta potential for imogolite in contact with 1.0 and 5.0 of CaCl2 and 1.0 and 5.0 of MgCl2, respectively, with increasing pH values. After the iteration adjustment, the average relative error between the experimental and numerical results was less than 0.24 % for electrophoretic mobility, and less than 0.23 % for the zeta potential, indicating excellent agreement between both approaches and validating the nonlinear couple model and iterative methodology of this investigation. It was determined that the extra positive ions might be the reason for a positive in the imogolite surface and, consequently, a positive value of the .
Table 8.
Imogolite – CaCl2 electrolyte surface charge density by experimental electrophoretic mobility adjustment.
|
imogolite in contact with 1.0 of CaCl2 electrolyte | |||||
|---|---|---|---|---|---|
| pH | * | † | *mV | †mV | † |
| 5.3 | 4.05 | 4.06 | 58.93 | 59.09 | 8.12 |
| 6.0 | 3.71 | 3.72 | 53.97 | 54.14 | 7.21 |
| 6.8 | 3.24 | 3.25 | 47.14 | 47.30 | 6.07 |
| 7.0 | 3.16 | 3.16 | 45.90 | 45.96 | 5.86 |
| 7.8 | 2.43 | 2.43 | 35.37 | 35.37 | 4.34 |
| 8.0 | 2.33 | 2.33 | 33.82 | 33.87 | 4.13 |
| 8.9 | 2.43 | 2.42 | 35.36 | 35.22 | 4.32 |
| 9.5 | 2.56 | 2.55 | 37.21 | 37.07 | 4.57 |
| 10.0 | 2.65 | 2.64 | 38.45 | 38.45 | 4.76 |
| 10.9 |
2.86 |
2.86 |
41.54 |
41.61 |
5.21 |
| imogolite in contact with 5.0 of CaCl2 electrolyte | |||||
| pH |
* |
† |
*mV |
†mV |
† |
| 5.0 | 4.35 | 4.33 | 63.20 | 62.98 | 19.89 |
| 5.9 | 3.97 | 3.96 | 57.64 | 57.67 | 17.58 |
| 6.9 | 3.60 | 3.60 | 52.39 | 52.38 | 15.43 |
| 7.6 | 2.97 | 2.97 | 43.11 | 43.21 | 12.12 |
| 7.9 | 2.54 | 2.54 | 36.93 | 36.97 | 10.13 |
| 8.2 | 2.77 | 2.77 | 40.33 | 40.33 | 11.18 |
| 8.6 | 2.99 | 2.98 | 43.43 | 43.45 | 12.20 |
| 9.2 | 3.29 | 3.28 | 47.77 | 47.80 | 13.71 |
| 9.4 | 3.61 | 3.61 | 52.41 | 52.51 | 15.47 |
| 10.5 | 3.71 | 3.72 | 53.97 | 54.15 | 16.12 |
Note: *Experimental results, Arancibia – Miranda et al. [8]. †Numerical results, present work.
Table 9.
Imogolite – MgCl2 electrolyte surface charge density by experimental electrophoretic mobility adjustment.
|
imogolite in contact with 1.0 of MgCl2 electrolyte | |||||
|---|---|---|---|---|---|
| pH | * | † | *mV | †mV | † |
| 5.3 | 3.37 | 3.35 | 49.01 | 48.82 | 6.28 |
| 6.1 | 2.46 | 2.45 | 35.69 | 35.65 | 4.36 |
| 6.7 | 2.31 | 2.31 | 33.52 | 33.61 | 4.09 |
| 7.6 | 1.90 | 1.90 | 27.62 | 27.62 | 3.33 |
| 7.7 | 1.88 | 1.87 | 27.31 | 27.29 | 3.29 |
| 8.1 | 1.79 | 1.79 | 26.07 | 26.15 | 3.15 |
| 8.2 | 1.64 | 1.65 | 23.90 | 24.01 | 2.89 |
| 8.8 | 1.54 | 1.54 | 22.35 | 22.42 | 2.70 |
| 9.2 | 1.71 | 1.70 | 24.82 | 24.84 | 2.99 |
| 9.5 |
1.88 |
1.87 |
27.30 |
27.21 |
3.28 |
| imogolite in contact with 5.0 of MgCl2 electrolyte | |||||
| pH |
* |
† |
*mV |
†mV |
† |
| 5.3 | 3.20 | 3.20 | 46.49 | 46.53 | 13.19 |
| 6.4 | 2.50 | 2.49 | 36.29 | 36.32 | 9.89 |
| 6.9 | 2.03 | 2.02 | 29.49 | 29.45 | 7.90 |
| 7.3 | 1.92 | 1.91 | 27.94 | 27.86 | 7.46 |
| 7.8 | 1.71 | 1.70 | 24.86 | 24.80 | 6.63 |
| 8.1 | 1.54 | 1.53 | 22.38 | 22.33 | 5.97 |
| 8.6 | 1.22 | 1.22 | 17.74 | 17.73 | 4.76 |
| 9.1 | 1.52 | 1.51 | 22.08 | 21.99 | 5.88 |
| 9.8 | 2.09 | 2.09 | 30.45 | 30.37 | 8.16 |
| 10.2 | 2.33 | 2.33 | 33.85 | 33.96 | 9.19 |
Note: *Experimental results, Arancibia – Miranda et al. [8]. †Numerical results, present work.
Fig. 9 a) and b) show the internal electric potential profile for the imogolite in contact with CaCl2 and MgCl2 electrolytes, respectively, both corresponding to divalent electrolytes, for four pH values, from the imogolite's surface ) to the solution bulk ( 200 ). The internal electric potential and the free charge density distributions thinned as pH increased in the range of the simulations, similar to the interaction of the electrolytes with the borosilicate microchannel described in 4.2.1. As discussed in the previous section, the electrolyte ion motion and EDL formation are numerically well predicted by this iterative procedure and are in a very good agreement with all the experimental cases reported for the pH and ion concentrations range. Note that the internal electric potential profile depicts the same decreasing behavior -from a maximum value at the solid surface (mainly due to the positive surface charge density) to zero voltage at the solution bulk-satisfying the electroneutrality condition. The above results show that the numerically predicted surface charge density values match well the experimentally obtained values.
Fig. 9.

Internal electric potential profile of imogolite in contact with different electrolyte. a) and b) internal potential φ profile produced by electromigration due to positively charged surface of imogolite in contact with 1.0 CaCl2 and 1.0 MgCl2 electrolytes, respectively, for pH values in the range of (5.3–9.5). Inset shows free charge density ρf near the surface produced by electromigration due to positively charged surface of imogolite, for the same range of pH.
Fig. 10 a) and b) show numerical predictions as a function of the electrophoretic velocity of imogolite in contact with three different types of electrolytes, CaCl2, MgCl2, and KCl, for 1.0 mM and 5.0 mM, respectively, for different pH. Depict seemingly linear behavior between the imogolite's and the electrophoretic mobility for 1.0 mM and 5.0 mM, respectively. Imogolite in contact with divalent cations (CaCl2 and MgCl2) presents only positive for the pH range of this investigation. However, with KCl as the background electrolyte, the imogolite acquired a positive sign as the pH turned from alkalic to acidic. It is noteworthy that a similar response was observed and reported in previous work by this group in the study of nanoparticles' stability by zeta potential for the nanofluid thermal conductivity enhancement [44,45], in which the positive surface charge is due to the thermodynamic equilibrium between the hydrogen (H+) ions surface reactive groups [47]. According to the simulation results, the cation's affinity to occupy the active surface site expressed by the amount of the under similar pH conditions could be ordered in the following sequence (K+ < Mg2+ < Ca2 +). Because of the good agreement between numerical results provided by the nonlinear coupled model and the experimental results, the proposed model and iterative procedure could be useful for characterizing the nonlinear electrokinetic behavior of both the zeta potential and free charge density for a variety of electrolytes and microchannel materials.
Fig. 10.

Numerical results of surface charge density of imogolite immersed in different electrolytes and pH using experimental electrophoretic velocity as a fitting parameter. a) shows surface charge density for electrolytes with 1.0 mM ion concentration, from pH 3.7 to 10.5. b) shows surface charge density for electrolytes with 5.0 mM ion concentration, from pH 3.7 to 11. Both show linear behavior between the surface charge density of the imogolite and the electrophoretic velocity. Symbols  ,
,  and correspond to CaCl2, MgCl2, and KCl electrolytes, respectively.
Fig. 11 shows numerical and experimental results of the zeta potential and surface charge density behavior for imogolite immersed in KCl, MgCl2, and CaCl2 electrolyte solutions. Fig. 11 a) and b) show the zeta potentials for 1.0 mM and 5.0 mM concentrations of KCl, MgCl2, and CaCl2. The experimental and numerical results match very well because the measured experimental values were used as a convergence criterion to determine the numerical values of all quantities using this simulation methodology. We observe that the zeta potential presents a nonlinear behavior as a function of the pH for both ion concentrations, reaching a minimum value for a pH of approximately 8.5 for MgCl2 and CaCl2, and a maximum value at a pH of about 4 for KCl, for both ion concentrations. Fig. 11 c) and d) show numerical results of the surface charge density for 1.0 mM and 5.0 mM concentrations of KCl, MgCl2, and CaCl2. The experimental surface charge density was numerically determined by matching the experimental and numerical values of the zeta potential, or the electrophoretic mobility, since both quantities were the product of the surface charge density. The surface charge density for CaCl2 and MgCl2 decreases as the pH increases, up to a pH of about 8.5, and then increases while remaining positive for both ion concentrations for the entire pH range. This is due to fact that the Ca and Mg ions have a valence of +2 that tends to saturate the free spaces on the imogolite surface, preventing the charge sign change. The surface charge density for KCl decreases continuously as the pH increases and becomes negative for a pH higher than (approximately) 10.5 for both ion concentrations.
Fig. 11.

a) and b) Numerical and experimental results of zeta potential for imogolite immerse in KCl, MgCl2 and CaCl2 electrolyte solutions for ion concentrations of 1.0 mM and 5.0 mM, respectively. Fig. 11 c) and d) show numerical results of surface charge density for 1.0 mM and 5.0 mM ion concentrations of KCl, MgCl2 and CaCl2.
5. Conclusions
A numerical and experimental investigation has been presented for the nonlinear behavior of the surface charge density and zeta potential in both borosilicate and imogolite, immersed in four different electrolytes, KCl, NaCl, MgCl2 and CaCl2, at different concentrations and pH values. The nonlinear coupled governing equations were fully solved using a finite element method and iterative scheme to predict the internal electrical potential and within the electric double-layer EDL, without using Poisson-Boltzmann simplifications. Agreement between the numerical predictions and the experimental results was very good for borosilicate, with maximum relative errors of 0.31 % and 0.64 % for KCl and NaCl, respectively. Both the zeta potential and the surface charge density for borosilicate follow a nonlinear law power.
The zeta potential for borosilicate developed strong nonlinear behavior with the ion concentration, and it obeyed the power law and for KCl and NaCl, respectively. The surface charge density decreased as the concentration increased and conformed with the expression and for KCl and NaCl, respectively.
For imogolite immersed in KCl, CaCl2 and MgCl2, the zeta potential and the surface charge density also behave nonlinearly with the pH. For CaCl2 and MgCl2 electrolytes, both and exhibit a minimum, unlike for KCl. The minimum values of the zeta potential for MgCl2 and CaCl2 are approximately 20 and 35 mV for both ions’ concentration, respectively, whereas the minimum values of the surface charge density for MgCl2 and CaCl2 are approximately 3 and 4 mC/m2, respectively, for ions concentration of 1.0 mM and, of approximately 5 and 10 mC/m2, for ions concentration of 5 mM.
The proposed numerical model accurately predicted and described the nonlinear behavior of the interaction of the nanoparticle surface charge with the electrolytes and its effect on the transport properties of the nanoparticles, and the electrolyte solutions for separation or flow mixing processes. Lastly, the EDL thinned as the ion concentrations and pH increased; this thinner EDL resulted from the increase of which in turn caused a higher attraction of the free charges.
Data availability statement
Data will be made available on request.
Additional information
No additional information is available for this paper.
CRediT authorship contribution statement
Daming Chen: Conceptualization, Formal analysis, Investigation, Methodology, Software, Visualization, Writing – original draft, Writing – review & editing. Nicolas Arancibia-Miranda: Formal analysis, Methodology, Resources, Writing – review & editing. Mauricio Escudey: Formal analysis, Methodology, Resources, Writing – review & editing. Jiao Fu: Formal analysis, Software, Visualization, Writing – original draft, Writing – review & editing. Qin Lu: Formal analysis, Visualization, Writing – original draft, Writing – review & editing, Software. Cristina H. Amon: Formal analysis, Supervision, Writing – original draft, Writing – review & editing. Daniela Galatro: Formal analysis, Supervision, Writing – original draft, Writing – review & editing. Amador M. Guzmán: Formal analysis, Supervision, Writing – original draft, Writing – review & editing.
Declaration of competing interest
The authors declare that they have no known competing financial interests or personal relationships that could have appeared to influence the work reported in this paper.
Acknowledgements
The authors are grateful for the financial support of ANID/formerly CONICYT Doctoral Scholarship. CEDENNA, Financiamiento Basal para Centros Científicos y Tecnoloǵicos de Excelencia, FONDECYT. STECTEC and Micro and Nanofluidic Centers, Chile. ATOMS Lab at the University of Toronto. Our thanks to Moran Bercovici and the research group at Microfluidics Technologies Laboratory, Technion–Israel Institute of Technology, for their valuable contributions.
Contributor Information
Daming Chen, Email: daming.chen@usach.cl.
Jiao Fu, Email: jiao_fu@foxmail.com.
Amador M. Guzmán, Email: amador.guzman@utoronto.ca.
References
- 1.Stone H.A., Stroock A.D., Ajdari A. Engineering flows in small devices. Annu. Rev. Fluid Mech. 2004;36:381–411. doi: 10.1146/annurev.fluid.36.050802.122124. [DOI] [Google Scholar]
- 2.Pennathur S., Santiago J.G. Electrokinetic transport in nanochannels. 1.Theory. Anal. Chem. 2005;77:6772–6781. doi: 10.1021/ac050835y. [DOI] [PubMed] [Google Scholar]
- 3.Pennathur S., Santiago J.G. Electrokinetic transport in nanochannels. 2. Experiments. Anal. Chem. 2005;77:6782–6789. doi: 10.1021/ac0508346. [DOI] [PubMed] [Google Scholar]
- 4.Song L., Jagdale P., Yu L., Liu Z., Zhang C., Gao R., Xuan X. Electrokinetic instabilities in co-flowing ferrofluid and buffer solutions with matched electric conductivities. Microfluid. Nanofluidics. 2018;22:0. doi: 10.1007/s10404-018-2148-z. [DOI] [Google Scholar]
- 5.Agostino F.J., Krylov S.N. Advances in steady-state continuous-flow purification by small-scale free-flow electrophoresis. TrAC - Trends Anal. Chem. 2015;72:68–79. doi: 10.1016/j.trac.2015.03.023. [DOI] [Google Scholar]
- 6.Prasher R., Phelan P.E., Bhattacharya P. Effect of aggregation kinetics on the thermal conductivity of nanoscale colloidal solutions (nanofluid) Nano Lett. 2006;6:1529–1534. doi: 10.1021/nl060992s. [DOI] [PubMed] [Google Scholar]
- 7.Chen D., Martínez V.A., Vasco D.A., Guzmán A.M. Experimental investigation of viscosity, enhanced thermal conductivity and zeta potential of a TiO2 electrolyte – based nanofluid. Int. Commun. Heat Mass Transf. 2020;118 doi: 10.1016/j.icheatmasstransfer.2020.104840. [DOI] [Google Scholar]
- 8.Arancibia-Miranda N., Silva-Yumi J., Escudey M. Effect of cations in the background electrolyte on the adsorption kinetics of copper and cadmium and the isoelectric point of imogolite. J. Hazard Mater. 2015;299:675–684. doi: 10.1016/j.jhazmat.2015.08.007. [DOI] [PubMed] [Google Scholar]
- 9.Iozzo D.A.B., Tong M., Wu G., Furlani E.P. Numerical analysis of electric double layer capacitors with mesoporous electrodes: effects of electrode and electrolyte properties. J. Phys. Chem. C. 2015;119:25235–25242. doi: 10.1021/acs.jpcc.5b08409. [DOI] [Google Scholar]
- 10.Xu Y., Chen P., Peng H. Generating electricity from water through carbon nanomaterials. Chem. Eur J. 2018;24:6287–6294. doi: 10.1002/chem.201704638. [DOI] [PubMed] [Google Scholar]
- 11.Chen X., Xu B., Liu L. Nanoscale fluid mechanics and energy conversion. Appl. Mech. Rev. 2014;66 doi: 10.1115/1.4026913. [DOI] [Google Scholar]
- 12.Xie J., Wang L., Chen X., Yang P., Wu F., Huang Y. The emerging of hydrovoltaic materials as a future technology: a case study for China. Green Energy Environ. 2020:1–21. doi: 10.5772/intechopen.90377. [DOI] [Google Scholar]
- 13.Duffy D.C., McDonald J.C., Schueller O.J.A., Whitesides G.M. Rapid prototyping of microfluidic systems in poly(dimethylsiloxane) Anal. Chem. 1998;70:4974–4984. doi: 10.1021/ac980656z. [DOI] [PubMed] [Google Scholar]
- 14.Hsu W.-L., Daiguji H., Dunstan D.E., Davidson M.R., Harvie D.J.E. Electrokinetics of the silica and aqueous electrolyte solution interface: viscoelectric effects. Adv. Colloid Interface Sci. 2016;234:108–131. doi: 10.1016/j.cis.2016.05.001. [DOI] [PubMed] [Google Scholar]
- 15.Alibakhshi M.A., Xie Q., Li Y., Duan C. Accurate measurement of liquid transport through nanoscale conduits. Sci. Rep. 2016;6 doi: 10.1038/srep24936. [DOI] [PMC free article] [PubMed] [Google Scholar]
- 16.Feng H., Wong T.N., Che Z., Marcos Chaotic micromixer utilizing electro-osmosis and induced charge electro-osmosis in eccentric annulus. Phys. Fluids. 2016;28 doi: 10.1063/1.4952971. [DOI] [Google Scholar]
- 17.Azimi S., Nazari M., Daghighi Y. Developing a fast and tunable micro-mixer using induced vortices around a conductive flexible link. Phys. Fluids. 2017;29 doi: 10.1063/1.4975982. [DOI] [Google Scholar]
- 18.Kateb M., Fathipour M., Kolahdouz M. Effect of electrolyte concentration and symmetry on the heterogeneous surface charge in an electrically gated nanochannel. SN Appl. Sci. 2020;2:1–8. doi: 10.1007/s42452-020-2973-z. [DOI] [Google Scholar]
- 19.Liang Q., Xu J., Deng T., Tao P., Lee C., Chen Y., Yu F., Liang X. Dispersion stability of thermal nanofluids. Prog. Nat. Sci. Mater. Int. 2017;27:531–542. doi: 10.1016/j.pnsc.2017.08.010. [DOI] [Google Scholar]
- 20.Saville D.A. Electrokinetic effects with small particles. Annu. Rev. Fluid Mech. 1977;9:321–337. doi: 10.1146/annurev.fl.09.010177.001541. [DOI] [Google Scholar]
- 21.Morgan H., Green N.G. RESEARCH STUDIES PRESS LTD; Baldock, Hertfordshire, England: 2003. AC Electrokinetics: Colloids and Nanoparticles. [Google Scholar]
- 22.Paul R.R., Hiemenz C. Third Edit; New York: 1997. Principles of Colloid and Surface Chemistry. [Google Scholar]
- 23.Myers D. second ed. John Wiley & Sons, Inc.; New York: 1999. Surfaces, Interfaces, and Colloids. [Google Scholar]
- 24.Wall S. The history of electrokinetic phenomena. Curr. Opin. Colloid Interface Sci. 2010;15:119–124. doi: 10.1016/j.cocis.2009.12.005. [DOI] [Google Scholar]
- 25.Quincke G. Ueber die Fortführung materieller Theilchen durch strömende Elektricität. Ann. Phys. 1861;189:513–598. doi: 10.1002/andp.18611890802. [DOI] [Google Scholar]
- 26.Probstein R.F. second ed. John Wiley & Sons, Inc.; New York: 1994. Physicochemical Hydrodynamics. [Google Scholar]
- 27.Gouy M. Sur la constitution de la charge électrique à la surface d’un électrolyte. J. Phys. Théorique Appliquée. 1910;9:457–468. doi: 10.1051/jphystap:019100090045700. [DOI] [Google Scholar]
- 28.Chapman D.L. A contribution to the theory of electrocapillarity, London, Edinburgh. Dublin Philos. Mag. J. Sci. 1913;25:475–481. doi: 10.1080/14786440408634187. [DOI] [Google Scholar]
- 29.Hunter R.J. 1981. Zeta Potential in Colloid Science: Principles and Applications. [DOI] [Google Scholar]
- 30.Butt H.-J., Graf K., Kappl M. WILEY-VCH Verlag GmbH & Co. KGaA; Weinheim: 2003. Physics and Chemistry of Interfaces. [Google Scholar]
- 31.Behrens S.H., Grier D.G. The charge of glass and silica surfaces. J. Chem. Phys. 2001;115:6716–6721. doi: 10.1063/1.1404988. [DOI] [Google Scholar]
- 32.Gu Y., Li D. The zeta-potential of glass surface in contact with aqueous solutions. J. Colloid Interface Sci. 2000;226:328–339. doi: 10.1006/jcis.2000.6827. [DOI] [Google Scholar]
- 33.Sze A., Erickson D., Ren L., Li D. Zeta-potential measurement using the Smoluchowski equation and the slope of the current-time relationship in electroosmotic flow. J. Colloid Interface Sci. 2003;261:402–410. doi: 10.1016/S0021-9797(03)00142-5. [DOI] [PubMed] [Google Scholar]
- 34.Venditti R., Xuan X., Li D. Experimental characterization of the temperature dependence of zeta potential and its effect on electroosmotic flow velocity in microchannels. Microfluid. Nanofluidics. 2006;2:493–499. doi: 10.1007/s10404-006-0100-0. [DOI] [Google Scholar]
- 35.Almutairi Z.A., Glawdel T., Ren C.L., Johnson D.A. A Y-channel design for improving zeta potential and surface conductivity measurements using the current monitoring method. Microfluid. Nanofluidics. 2009;6:241–251. doi: 10.1007/s10404-008-0320-6. [DOI] [Google Scholar]
- 36.Kang K.H., Park J., Kang I.S., Huh K.Y. Initial growth of electrohydrodynamic instability of two-layered miscible fluids in T-shaped microchannels. Int. J. Heat Mass Transf. 2006;49:4577–4583. doi: 10.1016/j.ijheatmasstransfer.2006.04.026. [DOI] [Google Scholar]
- 37.Luo W.J. Effect of ionic concentration on electrokinetic instability in a cross-shaped microchannel. Microfluid. Nanofluidics. 2009;6:189–202. doi: 10.1007/s10404-008-0316-2. [DOI] [Google Scholar]
- 38.Fu L.M., Yang R.J., Lin C.H., Chien Y.S. A novel microfluidic mixer utilizing electrokinetic driving forces under low switching frequency. Electrophoresis. 2005;26:1814–1824. doi: 10.1002/elps.200410222. [DOI] [PubMed] [Google Scholar]
- 39.Bazant M.Z., Chu K.T., Bayly B.J. Current-voltage relations for electrochemical thin films. SIAM J. Appl. Math. 2005;65:1463–1484. doi: 10.1137/040609938. [DOI] [Google Scholar]
- 40.Højgaard Olesen L., Bazant M.Z., Bruus H. Strongly nonlinear dynamics of electrolytes in large ac voltages. Phys. Rev. E - Stat. Nonlinear Soft Matter Phys. 2010;82:1–30. doi: 10.1103/PhysRevE.82.011501. [DOI] [PubMed] [Google Scholar]
- 41.Guo Z., Zhao T.S., Shi Y. A lattice Boltzmann algorithm for electro-osmotic flows in microfluidic devices. J. Chem. Phys. 2005;122:1–10. doi: 10.1063/1.1874813. [DOI] [PubMed] [Google Scholar]
- 42.Wang M., Pan N., Wang J., Chen S. Lattice Poisson-Boltzmann simulations of electroosmotic flows in charged anisotropic porous media. Commun. Comput. Phys. 2007;2:1055–1070. doi: 10.1016/j.jcis.2005.09.042. [DOI] [Google Scholar]
- 43.Peng R., Li D. Electroosmotic flow in single PDMS nanochannels. Nanoscale. 2016;8:12237–12246. doi: 10.1039/C6NR02937J. [DOI] [PubMed] [Google Scholar]
- 44.Borji M.S., Jamaati J., Bahiraei M. Investigating simultaneous effects of temperature, surface heterogeneity and geometry on fluid mixing in electroosmotic flow considering temperature dependent properties by Nernst–Planck Poisson method. Commun. Nonlinear Sci. Numer. Simul. 2023;121 doi: 10.1016/j.cnsns.2023.107238. [DOI] [Google Scholar]
- 45.Aslyamov T., Janssen M. Analytical solution to the Poisson–Nernst–Planck equations for the charging of a long electrolyte-filled slit pore. Electrochim. Acta. 2022;424 doi: 10.1016/j.electacta.2022.140555. [DOI] [Google Scholar]
- 46.Li D. First, Elsevier; London: 2004. Electrokinetics in Microfluidics. [DOI] [Google Scholar]
- 47.Ninham B.W., Parsegian V.A. Electrostatic potential between surfaces bearing ionizable groups in ionic equilibrium with physiologic saline solution. J. Theor. Biol. 1971;31:405–428. doi: 10.1016/0022-5193(71)90019-1. [DOI] [PubMed] [Google Scholar]
- 48.Wang Z.L., Tang D.W., Liu S., Zheng X.H., Araki N. Thermal-conductivity and thermal-diffusivity measurements of nanofluids by 3ω method and mechanism analysis of heat transport. Int. J. Thermophys. 2007;28:1255–1268. doi: 10.1007/s10765-007-0254-3. [DOI] [Google Scholar]
- 49.Yau H.T., Wang C.C., Cho C.C., Chen C.K. A numerical investigation into electroosmotic flow in microchannels with complex wavy surfaces. Therm. Sci. 2011;15:87–94. doi: 10.2298/TSCI11S1087Y. [DOI] [Google Scholar]
- 50.Guan Y., Yang T., Wu J. Mixing and transport enhancement in microchannels by electrokinetic flows with charged surface heterogeneity. Phys. Fluids. 2021;33 doi: 10.1063/5.0047181. [DOI] [Google Scholar]
- 51.Bohinc K., Kralj-Iglič V., Iglič A. Thickness of electrical double layer. Effect of ion size. Electrochim. Acta. 2001;46:3033–3040. doi: 10.1016/S0013-4686(01)00525-4. [DOI] [Google Scholar]
- 52.Halliday Resnick. ninth ed. John Wiley & Sons, Inc.; USA: 2011. Fundamentals of Physics. [Google Scholar]
- 53.Levine I.N. Vol 2, fifth ed. Mc Graw Hill; Madrid, España: 2004. Fisicoquímica. [Google Scholar]
- 54.Newman J., Thomas-Alyea K.E. John Wiley & Sons, Inc.; New Jersey: 2004. Electrochemical Systems, Thrid Edit. [Google Scholar]
- 55.Ai Y., Zhang M., Joo S.W., Cheney M.A., Qian S. Effects of electroosmotic flow on ionic current rectification in conical nanopores. J. Phys. Chem. C. 2010;114:3883–3890. doi: 10.1021/jp911773m. [DOI] [Google Scholar]
- 56.White H.S., Bund A. Ion current rectification at nanopores in glass membranes. Langmuir. 2008;24:2212–2218. doi: 10.1021/la702955k. [DOI] [PubMed] [Google Scholar]
- 57.Park H.M., Lee W.M. Helmholtz-Smoluchowski velocity for viscoelastic electroosmotic flows. J. Colloid Interface Sci. 2008;317:631–636. doi: 10.1016/j.jcis.2007.09.027. [DOI] [PubMed] [Google Scholar]
- 58.Li S., Leroy P., Heberling F., Devau N., Jougnot D., Chiaberge C. Influence of surface conductivity on the apparent zeta potential of calcite. J. Colloid Interface Sci. 2016;468:262–275. doi: 10.1016/j.jcis.2016.01.075. [DOI] [PubMed] [Google Scholar]
- 59.Brown M.A., Goel A., Abbas Z. Effect of electrolyte concentration on the stern layer thickness at a charged interface. Angew. Chemie - Int. Ed. 2016;55:3790–3794. doi: 10.1002/anie.201512025. [DOI] [PubMed] [Google Scholar]
- 60.Tadros T.F., Lyklema J. Adsorption of potential-determining ions at the silica-aqueous electrolyte interface and the role of some cations. J. Electroanal. Chem. 1968;17:267–275. doi: 10.1016/0368-1874(68)89503-6. [DOI] [Google Scholar]
- 61.Squires T.M., Brenner M.P. Like-charge attraction and hydrodynamic interaction. Phys. Rev. Lett. 2000;85:4976–4979. doi: 10.1103/PhysRevLett.85.4976. [DOI] [PubMed] [Google Scholar]
- 62.Jakeš J. A numerical method of fitting a multiparameter nonlinear function to experimental data in the L1 norm. Appl. Math. 1988;33:161–170. doi: 10.21136/am.1988.104299. [DOI] [Google Scholar]
- 63.Marquardt D.W. An algorithm for least-squares estimation of nonlinear parameters. J. Soc. Ind. Appl. Math. 1963;11:431–441. https://www.jstor.org/stable/2098941 [Google Scholar]
- 64.Alroudhan A., Vinogradov J., Jackson M.D. Zeta potential of intact natural limestone: impact of potential-determining ions Ca, Mg and SO4. Colloids Surfaces A Physicochem. Eng. Asp. 2016;493:83–98. doi: 10.1016/j.colsurfa.2015.11.068. [DOI] [Google Scholar]
- 65.Garcia-Schwarz G., Rogacs A., Bahga S.S., Santiago J.G. On-chip isotachophoresis for separation of ions and purification of nucleic acids. J. Vis. Exp. 2012:1–8. doi: 10.3791/3890. [DOI] [PMC free article] [PubMed] [Google Scholar]
- 66.Cussler E.L. Third. Cambrigde University Press; New York: 2007. Fundamentals of Mass Transfer. [DOI] [Google Scholar]
Associated Data
This section collects any data citations, data availability statements, or supplementary materials included in this article.
Data Availability Statement
Data will be made available on request.