Abstract
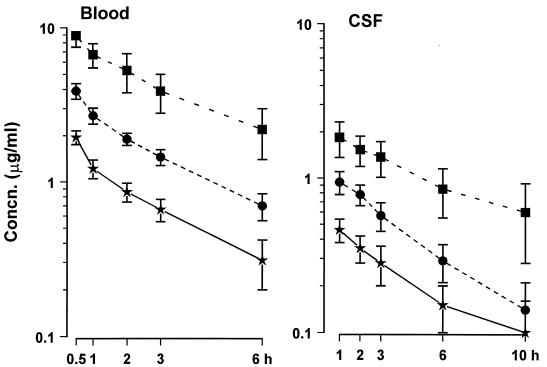
The purpose of this study was to evaluate the cerebrospinal fluid (CSF) pharmacodynamics of a new fluoroquinolone, gatifloxacin (AM-1155), in experimental pneumococcal meningitis. The penetration of gatifloxacin into CSF, calculated as the percentage of the area under the concentration-time curve (AUC) in CSF over the AUC in blood, was 46 to 56%. Gatifloxacin showed linear pharmacokinetics in CSF, and 1 h after intravenous dosages of 7.5, 15, or 30 mg/kg of body weight, peak CSF concentrations were 0.46 ± 0.08 (mean ± standard deviation), 0.94 ± 0.16, and 1.84 ± 0.5 μg/ml, respectively. The elimination half-life of gatifloxacin in CSF was 3.8 to 5.6 h (compared with 2.7 to 3.2 h in blood). There was a significant interrelationship among the highest measured values of gatifloxacin in blood and CSF/minimal bactericidal concentration (Cpeak/MBC), the time antibiotic concentrations exceeded the MBC (T > MBC), and AUC/MBC (r = 0.94); in single-dose experiments, each correlated significantly with the bacterial killing rate. Divided-dose regimens, resulting in greater T > MBC values but lower Cpeak/MBC ratios, were more effective in terms of bacterial clearance compared with corresponding single-dose regimens. Gatifloxacin therapy was as effective as currently recommended regimens (e.g., a combination of ceftriaxone and vancomycin) against this highly cephalosporin-resistant pneumococcal strain. The bactericidal activity of gatifloxacin in CSF was closely related to the AUC/MBC ratio, but maximal activity was achieved only when drug concentrations exceeded the MBC for the entire dosing interval.
Current recommendations for empiric therapy of bacterial meningitis in areas with a high prevalence of penicillin-resistant pneumococci include the combination of vancomycin and ceftriaxone (16). However, an effective single agent that could be given once or twice daily would be preferable. New fluoroquinolones have a wide antibacterial spectrum against gram-positive and gram-negative bacteria, including penicillin-resistant pneumococci, and good penetration into cerebrospinal fluid (CSF). As single agents, they have been shown to be effective in experimental meningitis and in a recent clinical meningitis study (6, 14).
Gatifloxacin (AM-1155) is a new fluoroquinolone with broader in vitro and in vivo activities than those of older quinolones (7, 8, 20). The pharmacokinetic properties of gatifloxacin are similar to those of other quinolones. Gatifloxacin is rapidly absorbed and distributed to target tissues, demonstrates a linear pharmacokinetic profile in serum, and has a comparatively long serum elimination half-life (t1/2) (7 to 8 h) in humans (11). The low protein binding (approximately 20%) and high lipophilicity (octanol-water partition coefficient, 1.14) predict favorable penetration into CSF (15). In experimental animals with noninflamed meninges, the penetration of gatifloxacin into CSF and brain ranged between 13 and 50% (15). Gatifloxacin is active in rodents with systemic infections caused by various gram-positive and gram-negative bacteria (7, 8), but there are no data on the use of gatifloxacin in the therapy of meningitis.
This study was conducted to determine the pharmacodynamic profile of gatifloxacin in the CSF and to evaluate its effectiveness in the therapy of experimental meningitis caused by cephalosporin-resistant Streptococcus pneumoniae.
MATERIALS AND METHODS
Bacterial strain.
A highly penicillin- and cephalosporin-resistant strain of S. pneumoniae type 6B, originally isolated from a patient with bacterial meningitis (4), was used in all experiments. The MICs and minimal bactericidal concentrations (MBCs) of antibiotics for this strain were measured by standard National Committee for Clinical Laboratory Standards microdilution methods (12).
Meningitis model.
The rabbit meningitis model, originally described by Dacey and Sande (2), was used. Meningitis was induced in young New Zealand White male rabbits weighing 1.8 to 2.2 kg by direct inoculation of 250 μl of a bacterial suspension (104 to 105 CFU) into the cisterna magna. Once meningitis was established (16 to 18 h later), rabbits were anesthetized with ketamine (50 mg/kg of body weight) and acepromazine (4 mg/kg) and immobilized in stereotactic frames, and a spinal needle was introduced into the cisterna magna.
Antibacterial therapy was started after collection of the first CSF sample. Animals were restrained under anesthesia in the stereotactic frames, and the spinal needle remained in the cisterna for the first 3 h to ensure nontraumatic collection of CSF. To maintain hydration, 20 ml of 0.9% sodium chloride was given subcutaneously to all animals while in the frames, and one dose of flunixin meglumine (1.1 mg/kg) was given intramuscularly for analgesia.
Treatment.
All antibiotics were given intravenously via a marginal ear vein. Gatifloxacin (Bristol-Myers Squibb, Wallingford, Conn.) was diluted in sterile water (10 mg/ml), and 5 μl of concentrated hydrochloric acid was added to each 10 ml to improve solubility. The solution was further diluted in normal saline to a concentration of 3 mg/ml. In the first set of experiments, gatifloxacin was given as a single intravenous injection of 7.5, 15, or 30 mg/kg. To avoid high peak concentrations and to extend the time antibiotic concentrations exceeded the MBC (T > MBC), in the second set of experiments multiple doses of gatifloxacin were given in one of two regimens: 7.5 mg/kg followed by 5 and 2.5 mg/kg, each 3 h apart, or three doses of 10 mg/kg given every 5 h (q5h). Gatifloxacin therapy (three doses of 15 mg/kg/q5h) was compared with the following treatment regimens: trovafloxacin (Pfizer Inc., Groton, Conn.), 15 mg/kg; vancomycin (Abbott Laboratories, Chicago, Ill.), 20 mg/kg; and ceftriaxone (Roche, Nutley, N.J.), 125 mg/kg. Animals received three doses of trovafloxacin or vancomycin (given 5 h apart) or one dose of ceftriaxone intravenously. Antibiotic dosages were chosen to simulate serum and CSF peak concentrations achieved in humans. Each treatment group consisted of 7 to 10 animals.
Sample collection.
For single-dose pharmacokinetic studies, 150 μl of CSF was collected 1, 2, 3, 6, and 10 h and 400 μl of serum was collected 0.5, 1, 2, 3, and 6 h after the initiation of therapy. In multiple-dosing studies, only peak and trough CSF concentrations were measured. All samples were stored at −70°C and assayed within 2 months. Visibly bloody CSF samples were not analyzed.
Bacterial concentrations in CSF were measured before and 6, 10, and 24 h after initiation of therapy by plating undiluted and serial dilutions of CSF on sheep blood agar and incubating in 5% CO2 at 35°C for 24 h. The lower limit of detection was 10 CFU/ml, and specimens with <10 CFU/ml were assigned a value of 1 (0 log10) CFU/ml. Bacterial killing rates (BKR) were calculated as the difference between bacterial concentrations at the start of therapy and 10 h later divided by time (10 h). No evidence of antibiotic carryover was detected with gatifloxacin concentrations of 2 μg/ml.
Antibiotic assay.
Gatifloxacin concentrations were determined by disk diffusion bioassay (19) with Bacillus subtilis ATCC 6633. Gatifloxacin standards between 0.1 and 2.0 μg/ml were prepared in rabbit CSF or serum. Samples with concentrations higher than 2.0 μg/ml were diluted to fit within the standard curve range. The lower limit of detection was 0.1 μg/ml. The intra- and interassay coefficients of variations were 2.0 and 2.4% for CSF and 7.9 and 4.2% for serum, respectively.
Pharmacokinetic and pharmacodynamic indices.
The highest measured values of gatifloxacin in blood and CSF were designated peak concentrations (Cpeak). Pharmacokinetic analysis was performed with the computer program TopFit V2. A two-compartment model (with lag time of 1 min) was used for calculations of blood pharmacokinetic indices, and a noncompartmental model was used for calculations of CSF pharmacokinetics. Weighting was not applied in the models, because data had a constant absolute error (5). Because of infrequent sampling in the α phase, the t1/2 and area under the concentration-time curves (AUC) for serum were calculated based on the mean values for each dosage group. AUC were estimated to the last quantifiable concentration with the logarithmic trapezoidal rule and extrapolated to infinity with the terminal-phase rate constant. The percentage of T > MBC was calculated as described by Schentag et al. (18). The relationships between pharmacodynamic indices (T > MBC, the ratio of CSF Cpeak to MBC [Cpeak/MBC], and the AUC/MBC ratio) and BKR were fitted to a linear regression or sigmoid Emax model as appropriate with the computer program WinNonlin version 1.5. For the latter model, the following formula was used: E = (Emax × Cγ)/(Cγ + ECγ50), where E is estimated BKR, Emax is the maximum BKR, C is the mean Cpeak/MBC or AUC/MBC ratio, EC50 is the C producing half-maximal BKR, and γ is the Hill coefficient indicating the slope of the sigmoid curve.
Statistics.
Continuous variables were expressed as means ± standard deviations. Penetration of gatifloxacin through the blood-CSF barrier (expressed as a percentage) was calculated as the ratio of CSF to serum concentrations 1 h after drug administration or as the ratio of CSF to blood AUC0–∝. The Student t test and analysis of variance (ANOVA) were used to compare continuous normally distributed variables, and the Mann-Whitney test was used for nonparametric data.
RESULTS
In vitro susceptibility.
The respective MICs and MBCs of the study antibiotics for S. pneumoniae were as follows: 4 and 4 μg/ml (ceftriaxone), 0.25 and 0.25 μg/ml (vancomycin), 0.06 and 0.125 μg/ml (trovafloxacin), and 0.125 and 0.25 μg/ml (gatifloxacin).
Single-dose pharmacokinetics.
The concentration-time curves of gatifloxacin in CSF and serum after a single intravenous injection are shown in Fig. 1. Linear pharmacokinetics were observed in body fluids. A good linear correlation was found between the administered dosages and CSF Cpeak (r = 0.84; P = 0.0001), AUC (r = 0.81; P = 0.0001), and T > MBC (r = 0.79; P = 0.0001). Pharmacokinetic indices are summarized in Table 1. The elimination t1/2 of gatifloxacin in CSF was significantly longer after a dose of 30 mg/kg than after 15 mg/kg (ANOVA; P < 0.05), and the t1/2 in CSF was 1.2- to 1.7-fold greater than in blood. When calculated as the ratio of AUCCSF to AUCblood, the penetration of gatifloxacin into CSF was greater than when calculated as the ratio of CSF to blood concentration at 1 h. Larger doses of gatifloxacin tended to result in relatively lower penetration, but this was significant only when penetration was calculated as the ratio of CSF to blood concentration at 1 hour (ANOVA; P < 0.05).
FIG. 1.
Concentration (Concn.)-time curves of gatifloxacin in blood and CSF after a single dose. Gatifloxacin doses, 7.5 (★), 15 (•), or 30 (■) mg/kg, were given intravenously at 0 h. Data are shown as means ± standard deviations. The MBC of the S. pneumoniae strain used in experiments was 0.25 μg/ml.
TABLE 1.
Pharmacokinetic indices of single-dose gatifloxacin therapy in rabbits with experimental pneumococcal meningitis
| Dose (mg/kg), n | Index for CSF (mean ± SD)
|
Index for blood
|
Mean ± SD of C1h CSF/C1h serum (%) | AUCCSF/AUCserum (%) | ||||
|---|---|---|---|---|---|---|---|---|
| Cpeak (μg/ml) | AUC (μg/ml · h) | t1/2 (h) | Mean ± SD of Cpeak (μg/ml) | AUCa (μg/ml · h) | t1/2 (h)a | |||
| 7.5, 8 | 0.46 ± 0.08 | 3.5 ± 1.2 | 3.8 ± 1.4 | 1.9 ± 0.2 | 6.3 | 2.68 | 38.0 ± 5.9 | 56 |
| 15, 8 | 0.94 ± 0.16 | 5.5 ± 1.4 | 3.4 ± 0.7 | 3.9 ± 0.4 | 13.5 | 2.71 | 34.8 ± 3.3 | 49 |
| 30, 7 | 1.84 ± 0.5 | 17.1 ± 8.0 | 5.6 ± 2.0b | 8.9 ± 1.5 | 37.7 | 3.2 | 27.3 ± 4.9c | 46 |
Based on mean values.
P < 0.05 compared with 15 mg/kg (ANOVA).
P < 0.05 compared with 7.5 and 15 mg/kg (ANOVA).
Pharmacodynamics of single-dose therapy.
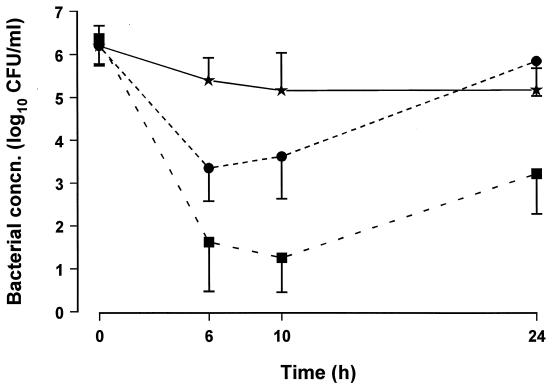
The bactericidal effectiveness of gatifloxacin was dose dependent (Fig. 2). Bacterial regrowth occurred after 6 h in animals treated with 15 mg/kg and after 10 h in those treated with 30 mg/kg.
FIG. 2.
Bacterial concentrations (concn.) in CSF in animals treated with a single dose of gatifloxacin of 7.5 (★), 15 (•), or 30 (■) mg/kg.
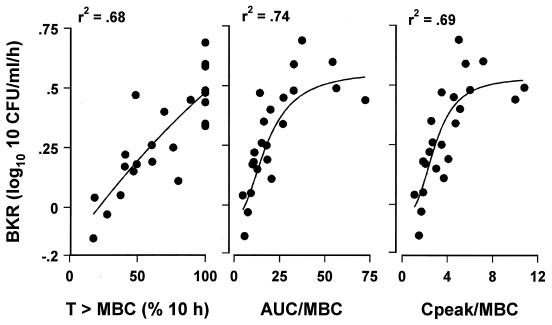
The pharmacodynamic indices of single-dose gatifloxacin are summarized in Table 2. The three CSF pharmacodynamic indices, T > MBC, AUC/MBC ratio, and Cpeak/MBC, were highly interrelated (r = 0.94), and each correlated significantly with BKR (Fig. 3). The relationships between BKR and AUC/MBC or Cpeak/MBC ratios were best described by the sigmoid Emax model (r2 = 0.74 and 0.69, respectively); the T > MBC correlated best with BKR by linear regression (r2 = 0.68). The maximal BKR of 0.55 CFU/ml/h was reached with AUC/MBC of 40, Cpeak/MBC of 6, and T > MBC values of 100% (Fig. 3). The AUC/MBC and Cpeak/MBC ratios producing 50% of the maximal BKR were 14.4 and 2.8, respectively.
TABLE 2.
Pharmacodynamic indices (means ± standard deviations) of gatifloxacin in CSF after single-dose therapy
| Dose (mg/kg), n | T > MBC (h) | AUC/MBC ratio | Cpeak/MBC ratio |
|---|---|---|---|
| 7.5, 8 | 4.2 ± 1.7 | 12.2 ± 5.0 | 1.8 ± 0.3 |
| 15, 8 | 7.6 ± 1.9 | 22.1 ± 5.6 | 3.8 ± 0.6 |
| 30, 7 | 14.1 ± 6.7 | 68.5 ± 32.1 | 7.0 ± 1.9 |
FIG. 3.
Relationship between BKR (ΔLog10 CFU per milliliter per hour) and T > MBC (percentage of 10-h interval), AUC/MBC (ratio of AUC0–10 and MBC) or Cpeak/MBC in CSF in the first 10-h period. Animals were treated with a single dose of gatifloxacin of 7.5, 15, or 30 mg/kg. Linear regression analysis was used to express the relationship between T > MBC and BKR. The correlation between BKR and AUC/MBC or Cpeak/MBC was fitted to a sigmoid Emax model.
Bacteriologic efficacy of divided-dose regimens.
The pharmacodynamic indices after divided dosing are summarized in Table 3. Divided-dose regimens resulted in half the peak CSF concentrations but 40 to 60% greater T > MBC values than those for the same total dosage given as a single injection. The AUC/MBC values were similar for divided- and single-dose regimens. Comparison of treatment regimens with similar AUC/MBC values (group 1 versus 2 and group 3 versus 4) and Cpeak/MBC values (group 1 versus 4) indicated that regimens with greater T > MBC values (groups 2 and 4) were significantly more effective. Comparison of treatment regimens with similar T > MBC values (groups 2 and 3) indicated that bacterial clearance for these groups was not significantly different (P = 0.1) (Table 3).
TABLE 3.
Pharmacodynamic indices in CSF over a 24-h period after different dosing regimens
| Group (regimen) | No. of animals | Cpeak/ MBC | AUC/ MBC ratio | T > MBC (% of 24 h) | ΔLog10 CFU/ml (mean ± SD) |
|---|---|---|---|---|---|
| 1 (15 mg/kg/q24h) | 8 | 3.8 | 22.1 | 29.5 | −0.24 ± 0.82 |
| 2 (7.5 + 5 + 2.5 mg/kg 3 h apart)a | 6 | 2.1 | 16.6 | 47.5 | −1.6 ± 0.72b |
| 3 (30 mg/kg/q24h) | 7 | 7.0 | 68.5 | 54 | −3.2 ± 1.3 |
| 4 (10 mg/kg/q5h)a | 7 | 4.0 | 58.4 | 79 | −6.4 ± 0.56c |
A total of three doses were given.
P = 0.039 versus group 1.
P = 0.009 versus group 3.
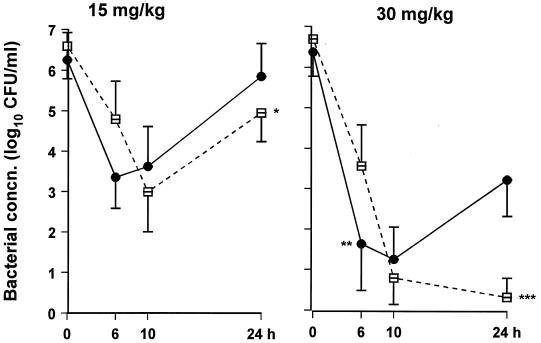
The bacteriologic effectiveness of divided- compared with that of single-dose therapy is demonstrated in Fig. 4. During the first 10 h, there was no difference in bacterial clearance between single- or divided-dose regimens of 15 mg/kg. However, a single dose of 30 mg/kg resulted in greater bacterial killing in the first 6 h compared with the divided-dose regimen (P = 0.01). At the end of 24 h of therapy, both divided-dose regimens demonstrated greater bacterial clearance than the corresponding single-dose regimens (P = 0.04 for 15 mg/kg and P = 0.002 for 30 mg/kg) (Table 3 and Fig. 4).
FIG. 4.
Bacterial concentrations (concn.) in CSF after single or divided doses of gatifloxacin. A total of 15 (left) or 30 (right) mg/kg of gatifloxacin was given as a single dose at 0 h (•) or in divided doses (□) as follows: 7.5 mg/kg followed by 5 mg/kg and 2.5 mg/kg, each 3 h apart (left), or three doses of 10 mg/kg q5h (right) (∗, P = 0.039; ∗∗, P = 0.01, and ∗∗∗, P = 0.002 compared with the same total dose given as a single injection).
Comparison of gatifloxacin with other antibiotics.
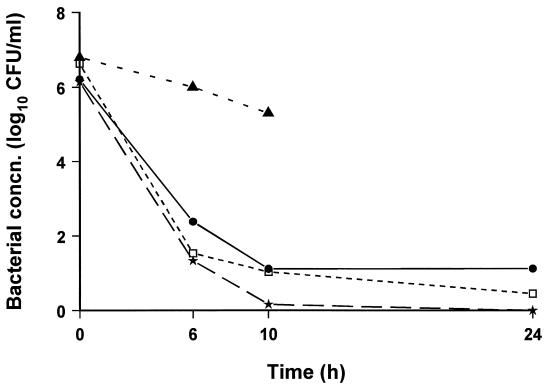
The bacteriologic effectiveness, including initial BKR, of gatifloxacin, trovafloxacin, and combined ceftriaxone and vancomycin therapies was not significantly different (Fig. 5).
FIG. 5.
Bacterial concentrations (concn.) in CSF after gatifloxacin (★) or trovafloxacin (□) (15 mg/kg/q5h) or a combination of ceftriaxone (125 mg/kg/q24h) and vancomycin (20 mg/kg/q5h) (•) therapy. Three doses of each antibiotic (except ceftriaxone) were given starting 16 to 18 h after inoculation with S. pneumoniae. Control animals (▴) died or were euthanized within 12 h.
DISCUSSION
The new fluoroquinolone, gatifloxacin, demonstrated excellent penetration into CSF and was highly effective as a single agent in the therapy of experimental meningitis caused by highly cephalosporin-resistant S. pneumoniae. The MICs of gatifloxacin for 15 strains of S. pneumoniae fall within a narrow range (0.20 to 0.39 μg/ml) (8), and although only one pneumococcal strain was used in this study, it is likely that the findings apply to other strains.
The penetration of gatifloxacin into CSF is species dependent (15) and has not been determined in humans. The blood-CSF penetration expressed as the ratio of simultaneous CSF and serum concentrations can be misleading because antibiotic time-concentration curves in CSF lag behind those in serum. The ratio of AUCCSF/AUCserum better characterizes CSF penetration (13). In this study, the ratio of the AUC values (46 to 56%) was higher than that of 1-h concentrations (27 to 38%), suggesting that the latter ratio actually underestimates penetration.
The Cpeak/MIC and AUC/MIC ratios have been shown to be the pharmacodynamic indices that best correlate with the bacteriologic efficacy of quinolones in Pseudomonas aeruginosa infections in vitro and in vivo (3, 10). MBCs rather than MICs were used in this study, because bactericidal activity is important for clearance of organisms from CSF (17). The concentration-dependent bacterial killing by various quinolones, with the exception of trovafloxacin, has been demonstrated in experimental pneumococcal meningitis (14). However, in that study, antibiotic therapy was given as a continuous infusion over a 7-h period, thereby maintaining CSF drug concentrations above the MBC for the entire study period. Also, the correlation of BKR with other pharmacodynamic indices such as AUC/MBC and T > MBC was not presented. In another study by the same investigators, the BKR of trovafloxacin was significantly greater during the first 5 h after doses of 30 mg/kg compared with those after 10 mg/kg; the investigators suggested that bacterial killing was concentration dependent, but the correlation between BKR and Cpeak/MBC was not specifically reported (9). We also demonstrated that higher dosages resulted in larger CSF concentrations and in greater initial bacterial killing. However, the high dosages also resulted in longer T > MBC and greater AUC/MBC values. It is difficult to determine which pharmacodynamic value best predicts bacteriologic efficacy in single-dose experiments because T > MBC, Cpeak/MBC, and AUC/MBC are highly interrelated (r = 0.94 in our study) and the AUC is especially difficult to manipulate independently.
By administering gatifloxacin in divided doses, we could lower Cpeak and extend the time that antibiotic concentrations remained above the MBC without changing the AUC. In our model, divided-dose regimens were clearly more effective than the same dose given as a single injection. In animals with similar CSF Cpeak/MBC or AUC/MBC ratios, bacterial killing was greater in those with greater T > MBC values. However, when T > MBC was maintained at 100%, Cpeak/MBC still correlated with initial BKR, indicating that the influence of drug concentration on bacterial clearance is superimposed on the effect of T > MBC. The important influence that T > MBC had on the bactericidal activity of gatifloxacin was probably the result of the absence of a postantibiotic effect in the CSF. These findings support a previous study in which trovafloxacin therapy was bactericidal only while drug concentrations were maintained above the MBC (9). In contrast, in a study of levofloxacin therapy in systemic Pseudomonas infection in neutropenic mice, T > MIC was found to be unimportant (3).
Experimental studies of pneumonia, peritonitis, and sepsis and clinical trials evaluating fluoroquinolone therapy have shown that AUC/MIC ratios of ≥100 and Cpeak/MIC ratios of 8 to 10 are almost always associated with satisfactory outcomes (1). We found that the same relationships applied in the CSF; AUC/MBC and Cpeak/MBC ratios of 40 and 6, respectively, produced maximal BKR. These ratios would be twofold greater if they were calculated with MICs rather than MBCs.
The CSF pharmacokinetic profile of gatifloxacin in humans is unknown, but predictions can be made based on the data in the present study and on available human serum pharmacokinetic data (11). Gatifloxacin is eliminated from CSF by simple diffusion (15), and the CSF t1/2 is longer than that in serum (1.2- to 1.7-fold longer in the present study). The serum elimination t1/2 of gatifloxacin in humans is 7 to 8 h (11); the estimated t1/2 in CSF is 10 to 12 h. Assuming that the CSF penetration of gatifloxacin in humans is similar to that in rabbits (at least 30%) and that, as in the present study, peak concentrations in CSF of 1 μg/ml would be adequate, peak serum concentrations of 3 to 4 μg/ml in humans should be targeted. Such concentrations can be achieved after oral doses of 400 mg (11). Because of the long elimination t1/2, once- or twice-daily administration of gatifloxacin should be sufficient in humans. This hypothesis requires verification by clinical pharmacokinetic studies in humans with meningitis.
In conclusion, gatifloxacin was effective as a single agent for the therapy of experimental cephalosporin-resistant pneumococcal meningitis. In the CSF the antibacterial activity of gatifloxacin correlated well with AUC/MBC. Because the AUC/MBC is dependent on T > MBC and Cpeak/MBC, it was not surprising that these latter indices also correlated with bactericidal activity. For maximal bactericidal efficacy in meningitis, the concentrations of gatifloxacin should be maintained above the MBC for the entire dosing interval.
ACKNOWLEDGMENTS
This study was supported in part by a grant from Bristol-Myers Squibb. I. Lutsar is a recipient of a fellowship award of the European Society for Pediatric Infectious Diseases, supported by Lederle-Praxis Biologicals.
REFERENCES
- 1.Craig W. Pharmacokinetic/pharmacodynamic parameters: rationale for antibacterial dosing of mice and men. Clin Infect Dis. 1998;26:1–12. doi: 10.1086/516284. [DOI] [PubMed] [Google Scholar]
- 2.Dacey R G, Sande M A. Effect of probenecid on cerebrospinal fluid concentration of penicillin and cephalosporin derivates. Antimicrob Agents Chemother. 1974;6:437–441. doi: 10.1128/aac.6.4.437. [DOI] [PMC free article] [PubMed] [Google Scholar]
- 3.Drusano G L, Johnson D E, Rosen M, Standiford H C. Pharmacodynamics of a fluoroquinolone antimicrobial agent in a neutropenic rat model of Pseudomonas sepsis. Antimicrob Agents Chemother. 1993;37:483–490. doi: 10.1128/aac.37.3.483. [DOI] [PMC free article] [PubMed] [Google Scholar]
- 4.Friedland I R, Shelton S, Paris M, Rinderknecht K, Ehrett K, Krischer K, McCracken G H. Dilemmas in diagnosis and management of cephalosporin-resistant Streptococcus pneumoniae meningitis. Pediatr Infect Dis J. 1993;12:196–200. doi: 10.1097/00006454-199303000-00004. [DOI] [PubMed] [Google Scholar]
- 5.Gabrielson J, Weiner D. Parameter estimation. In: Gabrielson J, Weiner D, editors. Pharmacokinetic and pharmacodynamic data analysis: concepts and applications. 2nd ed. Stockholm, Sweden: Swedish Pharmaceutical Press; 1997. pp. 31–57. [Google Scholar]
- 6.Hopkins S, Williams D, Dunne M, Marinovich L, Edeline M, Utt E, Dutse A I. Presented at the 36th Interscience Conference on Antimicrobial Agents and Chemotherapy. 1996. A randomized controlled trial of oral or IV trovafloxacin vs. ceftriaxone in the treatment of epidemic meningococcal meningitis, abstr. LB-21. [Google Scholar]
- 7.Hosaka M, Kinoshita S, Toyama T, Otsuki M, Nishino T. Antibacterial properties of AM-1155, a new 8-methoxy quinolone. J Antimicrob Chemother. 1995;36:293–301. doi: 10.1093/jac/36.2.293. [DOI] [PubMed] [Google Scholar]
- 8.Hosaka M, Yasue T, Fukuda H, Tomizawa H, Aoyama H, Hirai K. In vitro and in vivo antibacterial activities of AM-1155, a new 6-fluoro-8-methoxy quinolone. Antimicrob Agents Chemother. 1992;36:2108–2117. doi: 10.1128/aac.36.10.2108. [DOI] [PMC free article] [PubMed] [Google Scholar]
- 9.Kim Y S, Liu Q, Chow L, Täuber M G. Trovafloxacin in treatment of rabbits with experimental meningitis caused by high-level penicillin-resistant Streptococcus pneumoniae. Antimicrob Agents Chemother. 1997;41:1186–1189. doi: 10.1128/aac.41.5.1186. [DOI] [PMC free article] [PubMed] [Google Scholar]
- 10.Madras-Kelly K J, Ostergaard B E, Hovde L B, Rotschafer J C. Twenty-four-hour area under the concentration-time curve/MIC ratios as a generic predictor of fluoroquinolone antimicrobial effect by using three strains of Pseudomonas aeruginosa and in vitro pharmacodynamic model. Antimicrob Agents Chemother. 1996;40:627–632. doi: 10.1128/aac.40.3.627. [DOI] [PMC free article] [PubMed] [Google Scholar]
- 11.Nakashima M, Uematsu T, Kosuge K, Kusajima H, Ooie T, Masuda Y, Ishida R, Uchida H. Single- and multiple-dose pharmacokinetics of AM-1155, a new 6-fluoro-8-methoxy quinolone, in humans. Antimicrob Agents Chemother. 1995;39:2635–2640. doi: 10.1128/aac.39.12.2635. [DOI] [PMC free article] [PubMed] [Google Scholar]
- 12.National Committee for Clinical Laboratory Standards. Methods for dilution antimicrobial susceptibility tests for bacteria that grow aerobically. 3rd ed. Approved standard. NCCLS publication no. M7-A3. Villanova, Pa: National Committee for Clinical Laboratory Standards; 1993. [Google Scholar]
- 13.Nau R, Prange H W. Estimation of steady state antibiotic concentration in cerebrospinal fluid from single dose kinetics. Eur J Clin Pharmacol. 1996;49:407–409. doi: 10.1007/BF00203787. [DOI] [PubMed] [Google Scholar]
- 14.Nau R, Schmidt T, Kaye K, Froula J L, Täuber M G. Quinolone antibiotics in therapy of experimental pneumococcal meningitis. Antimicrob Agents Chemother. 1995;39:593–597. doi: 10.1128/AAC.39.3.593. [DOI] [PMC free article] [PubMed] [Google Scholar]
- 15.Ooie T, Suzuki H, Terasaki T, Sugiyama Y. Comparative distribution of quinolone antibiotics in cerebrospinal fluid and brain in rats and dogs. J Pharmacol Exp Ther. 1996;278:590–596. [PubMed] [Google Scholar]
- 16.Paris M M, Ramilo O, McCracken G H. Management of meningitis caused by penicillin-resistant Streptococcus pneumoniae. Antimicrob Agents Chemother. 1995;39:2171–2175. doi: 10.1128/aac.39.10.2171. [DOI] [PMC free article] [PubMed] [Google Scholar]
- 17.Scheld W M, Sande M A. Bactericidal versus bacteriostatic antibiotic therapy of experimental pneumococcal meningitis in rabbits. J Clin Investig. 1983;71:411–419. doi: 10.1172/JCI110785. [DOI] [PMC free article] [PubMed] [Google Scholar]
- 18.Schentag J J, Nix D E, Adelman M H. Mathematical examination of dual individualization principles. I. Relationship between AUC above MIC and area under the inhibitory curve of cefomenoxime, ciprofloxacin, and tobramycin. DICP-Ann Pharmacother. 1991;25:1050–1057. doi: 10.1177/106002809102501003. [DOI] [PubMed] [Google Scholar]
- 19.Simon H J, Yin E J. Microbioassay of antimicrobial agents. Appl Microbiol. 1970;19:573–579. doi: 10.1128/am.19.4.573-579.1970. [DOI] [PMC free article] [PubMed] [Google Scholar]
- 20.Wakabayashi E, Mitsuhashi S. In vitro antibacterial activity of AM-1155 a novel 6-fluoro-8-methoxy quinolone. Antimicrob Agents Chemother. 1994;38:594–601. doi: 10.1128/aac.38.3.594. [DOI] [PMC free article] [PubMed] [Google Scholar]


