

Abstract
The anti-inflammatory secretome of mesenchymal stromal cells (MSCs) is lucrative for the treatment of osteoarthritis (OA), a disease characterized by low-grade inflammation. However, the precise effects of the MSC secretome on patient-derived OA tissue is lacking. To investigate these effects, alginate encapsulated MSCs are co-cultured with patient-derived OA cartilage explants for 8 days. Proteoglycan distribution in OA cartilage explants examined by Safranin O staining is markedly improved when cultured with MSC microbeads as compared to control OA explants cultured alone. Total sulfated glycosaminoglycan (sGAG) content in OA explants is significantly increased upon co-culture with MSC microbeads on day 8. The sGAG released into the culture media is unchanged by the presence of MSC microbeads, suggesting de novo sGAG synthesis in OA explants. Co-culture with MSC microbeads increased the DNA content and Ki67+ cells in OA explants, indicating proliferation. An increase in secreted cytokines IL-10, HGF, and sFAS assessed by multiplex cytokine assay, increased TIMP1 levels, and reduction in percent apoptotic cells in OA explants is noted. Together, data demonstrates that paracrine factors secreted by alginate encapsulated MSCs microbeads in response to OA cartilage, create an anabolic, proliferative, and anti-apoptotic microenvironment inducing endogenous regeneration in clinically relevant, patient-derived OA cartilage.
1. Introduction
Osteoarthritis (OA) is characterized by progressive degradation of the cartilage tissue mediated by low-grade, chronic inflammation[1]. The secreted trophic factors of mesenchymal stromal cells (MSCs) are reported to be anti-inflammatory and immunomodulatory in diseases such as Graft-versus-host disease and Chron’s disease, the pathogenesis of which are inflammation-driven[2,3]. This revelation has prompted several MSC-based clinical trials for the treatment of inflammatory orthopedic diseases, particularly OA[4,5]. While intra-articular delivery of MSCs alleviated the progression of OA in small animal models[6], human clinical trials have largely shown mixed results in terms of efficacy [7,8]. Studies implicate insufficient MSC dosage[7,9] and low viability and persistence of MSCs in vivo[10] for mixed clinical outcomes.
Apart from therapeutic efficacy, direct injection of MSCs into the joint has also raised concerns of MSC transformation and/or differentiation into undesirable cell phenotypes that could engraft in the host tissue or transmigrate via circulation to other non-arthritic joints[11,12]. Some studies have tried to circumvent this issue by the administration of MSC-derived secretory cargo alone such as exosomes, extracellular vesicles or microparticles [13–15]. A higher dosage may, therefore, be required in vivo along with multiple in situ injections to obtain the desired therapeutic effect[13]. However, it remains possible that the MSCs need to be exposed to the diseased tissue - to dampen inflammation specific to that disease with the precise paracrine factors. For this, a cellular therapy involving the delivery of MSC in situ but in a vehicle that protects them from damage, death or transformation may be beneficial. Therefore, an optimal design would be a vehicle that sequesters MSCs to allow only a limited interaction between the MSCs and host tissue and therefore is protective while delivering the desired secreted paracrine factors to the target tissue.
MSC-derived secretory factors have demonstrably reduced inflammation and promoted regeneration in OA-like models of cytokine-treated cartilage in vitro or in animal models[13,15,16]. However, MSC-based immunomodulatory studies on patient-derived OA cartilage are lacking. Injectable microfluidics-based assembly of MSCs into microbeads can grant increased survivability as well as a potent niche for focused dissemination of paracrine factors and offers greater positional control for targeted delivery in situ[17,18]. With this rationale, we utilized a microfluidic platform to encapsulate MSCs in alginate hydrogel microbeads and explore their therapeutic potential in dampening inflammation and inducing regeneration in patient-derived OA cartilage ex vivo. We hypothesized that MSC microbeads would enhance local paracrine delivery of secreted factors while they adapt to the OA microenvironment, thus creating conditions conducive for improving the cartilage phenotype in a pre-clinically relevant explant model of human OA cartilage.
2. Results and Discussion
2.1. Microfluidic platform for MSC microbeads generation
One of the concerns of MSC injections into the joint is the dissemination of MSCs into non-target areas, thus hampering their therapeutic potency in situ[19]. Additionally, the injection of “naked” MSCs in the joint makes them susceptible to damage, cell death, phenotype transformation, or differentiation[11]. To that end, microencapsulation of MSCs in alginate hydrogel, an inert and biocompatible material, has been shown to improve their overall immunomodulatory capacity in vivo [17,20,21] by prolonging in vivo half-life and viability of MSCs, thus ensuring a sustained release of exogenous factors [17]. Also, encapsulation of MSC in alginate hydrogels can create conditions where Ca++ may be released from the alginate inside the hydrogels. Since hyperstimulation of calcium-sensing receptor (CaSR) in MSC has been shown to skew its differentiation potential[22,23], the overall MSC phenotype may also be influenced through alginate microencapsulation. We, therefore, chose to utilize microencapsulated MSCs to test their effect on diseased human cartilage. The rationale was that an increase in overall survival will allow the MSC to get primed in response to the OA microenvironment, thereby increasing their immunomodulatory efficacy.
Here, we describe a non-planar microfluidics-based platform for microencapsulation of MSCs in alginate (Figure 1A), which separates the paracrine effects of MSCs from their chondrogenic differentiation potential or other cell-to-cell contact effects. The device is comprised of four inlets for injecting calcium infused oil emulsion (I1), sodium alginate solution without cells (I2), MSCs (I3), and aqueous extraction fluid (I4) At the flow-focusing junction (Figure 1A), alginate solutions formed spherical droplets as a result of interfacial tension between aqueous solutions and oil emulsion. Alginate solution in the beads was gelled to form a hydrogel while flowing in the channels due to the diffusion of Ca2+ from the oil emulsion. Gelled microbeads were extracted on-chip from an oil phase to the aqueous phase since the enhanced stay in the oil phase lowers the cell viability. MSCs containing microbeads were finally collected from outlet O2. The size of the microbeads ranged between 350–400 μm and 100–150 MSCs were encapsulated per microbead.
Figure 1: MSC microencapsulation in alginate and co-culture schematic.
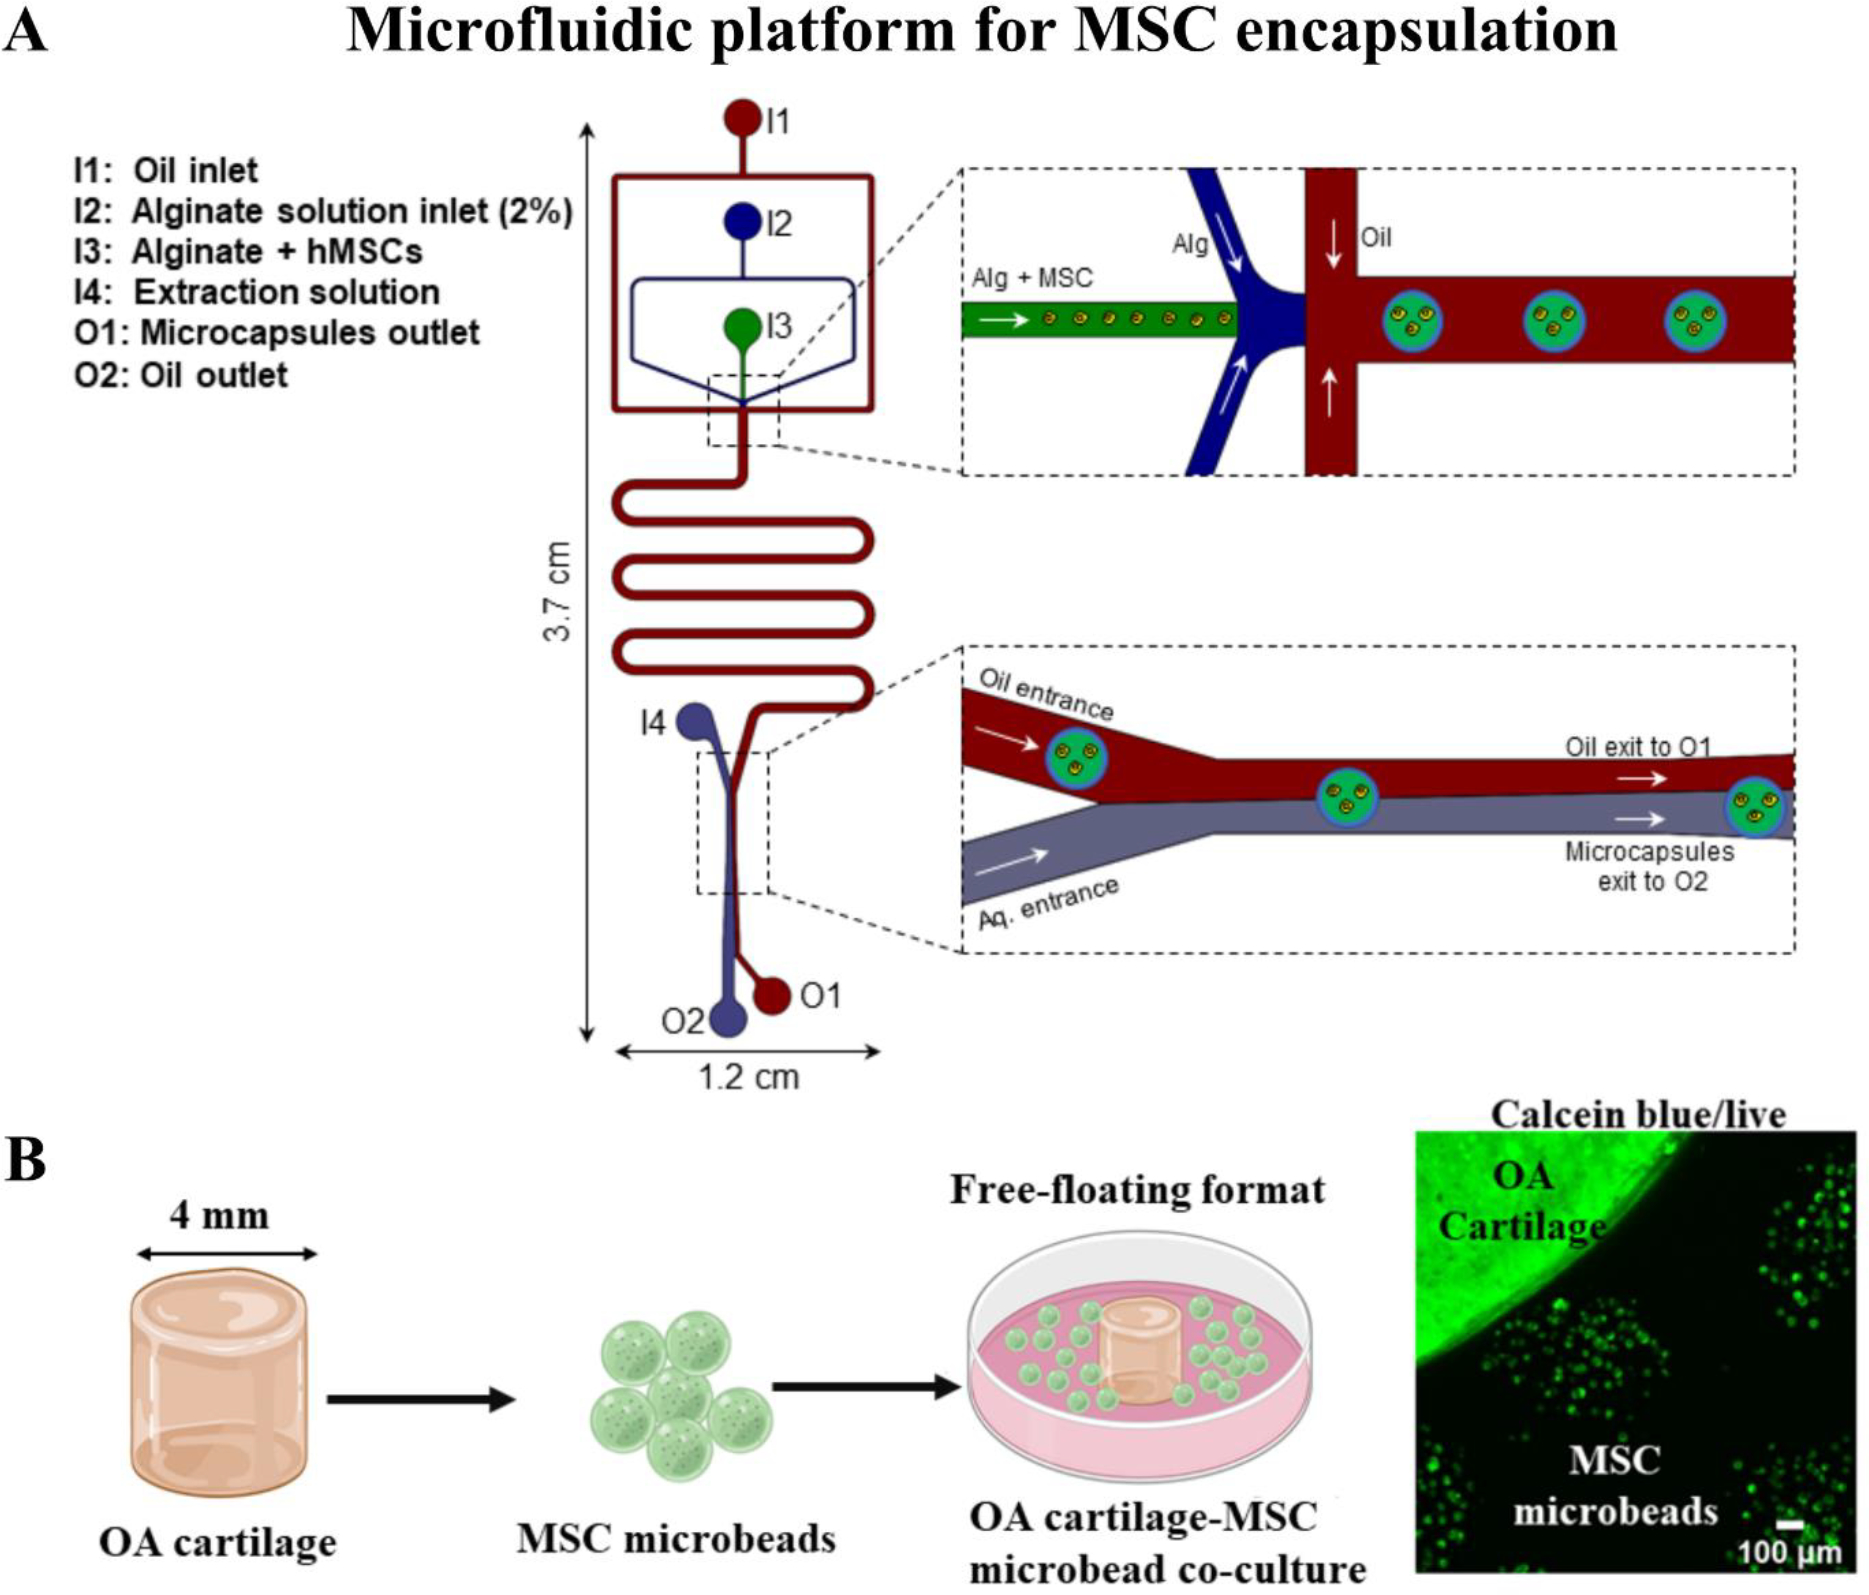
(A) Illustration of the polydimethylsiloxane (PDMS) based microfluidic device employed to generate MSC encapsulated in 2% (w/v) alginate. (B) Schematic depicting co-culture of MSC microbeads with OA cartilage explants. 4mm OA cartilage explants (from 6 patients) were co-cultured with MSC microbeads (2 donors) for 8 days. Cell viability staining with calceinAM depicted live MSCs inside the microbeads on day 8 of co-culture with OA cartilage explants.
2.2. MSC microbeads co-cultured with OA cartilage explants direct paracrine-mediated endogenous sGAG synthesis
OA cartilage is characterized by a loss of proteoglycans such as sGAGs. To test any beneficial effect of MSC secretome actively primed in response to OA tissue, MSC microbeads were co-cultured with intact OA cartilage explants harvested from the tissue discards of 7 individual patients undergoing total joint arthroplasty (IRB protocol IRB-35067 approved on 23rd April 2019). 10 explants per OA cartilage tissue were used and the setup is depicted in the figure schematic (Figure 1B). OA cartilage explants designated as OA1, OA2, OA3 were co-cultured with microbeads harboring MSCs from donor 1 (36-year old), and OA4, OA5, OA6, OA7 were co-cultured with microbeads harboring MSCs from donor 2 (24-year old). Proteoglycan content in the OA cartilage explants was assessed histologically by Safranin O staining and biochemically by measuring sGAG content via DMMB assay after co-coculture and removal of MSC microbeads. On days 4 and 8 of co-culture with MSC microbeads, the OA cartilage explants from all 7 patient samples showed enhanced cross-sectional deposition of proteoglycans as compared to the corresponding control OA cartilage explants cultured without MSC microbeads (Figure 2A, Figure S1 Supporting Information). Semi-quantification of 15 different safranin O stained sections across the depth of OA cartilage explants showed a significant increase (p=0.003 on day 4 and p=0.03 on day 8) in the percent Safranin O stained area in all OA explants that were co-cultured with MSC microbeads as compared to controls (Figure 2B). The quality of the OA cartilage in the safranin O stained sections (n=7 patient samples) was assessed by OsScore[24,25] with slight modifications (Figure 2C). Histological features for mineral, blood vessels and basal integration were excluded from scoring as the OA cartilage explants used in our study were not harvested from sites where such features are expected. OA explants co-cultured with MSC microbeads demonstrated significantly higher scores as compared to corresponding controls on days 4 and 8 of culture (p=0.016).
Figure 2: Co-culture of MSC microbeads with OA cartilage explants.

(A) Safranin O staining of 5 μm sections of OA cartilage explants cultured on day 4 and day 8 of culture. OA explants cultured alone, without MSC microbeads, served as respective controls. Representative images of OA explants from 3 individual patients are shown. Scale bar represents 200 μm. (B) Percent Safranin O stained area in 15 different sections from OA explants (from 3 different patients) cultured with or without MSC microbeads each on days 4 and 8 semi-quantified by ImageJ. (C) Histological scoring (modified OsScore) of safranin O stained OA cartilage explants (7 patient samples) on day 4 and day 8 of culture with or without MSC microbeads. (D) Sulfated glycosaminoglycans (sGAG) in OA cartilage explants (averaged triplicate for each of the 3 patients) upon culture with MSC microbeads were measured by 1,9-dimethylmethylene blue (DMMB) assay and normalized to weight (mg) of the corresponding explant. OA cartilage explants cultured alone without MSC microbeads served as controls. (D) Percent decrease in sGAG content in OA explants cultured with or without MSC microbeads from day 4 to day 8 of culture (n=3). Statistical significance is calculated by Welch’s t-test. (F) Percent sGAG loss into the medium from the explants on day 4 and day 8 as calculated by DMMB assay (n=3 spent media from 3 different OA explant wells). Culture media was changed on day 4 for all samples, therefore, the GAG loss observed on day 8 was not cumulative. (E) Pearson’s correlation test between percent Safranin O stained area and sGAG content in corresponding OA explants cultured with or without MSC microbeads on days 4 and 8 (n=12). All graphical data is represented as mean ± standard deviation. Statistical significance was determined by Wilcoxon signed rank test (C), two-way ANOVA with post-hoc Sidak test for (D, E), Tukey’s test for (B); ‘*’, and ‘ns’ represents ‘p<0.05’ and non-significant comparison.
The sGAG content in the OA cartilage cultured with or without MSC microbeads did not change significantly from the seed OA explants (initial pool harvested from patient tissue discards) from three patients on day 0 to day 4 of culture (Figure 2D). No significant changes in sGAG content of OA explants cultured with or without MSC microbeads were noticeable on day 4 whereas a significant increase (p=0.02) was observed on day 8 of culture in OA explants co-cultured with MSC microbeads. To ascertain whether this was due to endogenous synthesis or increased retention of sGAGs by the cartilage, the sGAGs in the spent culture media of MSC microbead-OA cartilage co-cultures were measured and compared with respective controls on day 4 and 8 of culture. The percent of sGAG lost into the media was not significantly different between OA cartilage explants cultured with or without MSC microbeads, showing that the increased proteoglycan content was due to increased synthesis and not increased retention of GAG (Figure 2E). Overall, these results indicated that MSC microbeads improved proteoglycan content in OA explants.
2.3. MSC microbeads increase cellular content in OA cartilage
Since the increased endogenous synthesis of proteoglycans could be indicative of either an enhanced production by existing chondrocytes or an increase in GAG secreting cells, we sought to investigate the DNA content in OA cartilage co-cultured with or without MSC microbeads, using picogreen assay (Figure 3). On day 4, the dsDNA content per mg of tissue in OA cartilage explants co-cultured with MSC microbeads (n=3) was not significantly different from the control OA cartilage explants (Figure 3A). However, on day 8 of culture, the dsDNA content in OA explants co-cultured with MSC microbeads was ~2-fold higher in treated versus control explants (39.69 ± 19.83 ng dsDNA/mg vs. 16.12 ± 5.31 ng dsDNA/mg). Further, the dsDNA content in OA cartilage explants co-cultured with MSC microbeads significantly increased from 4.04 ± 2.81 ng dsDNA/mg tissue on day 4 to 39.69 ± 19.83 ng dsDNA/mg tissue on day 8 of culture (p=0.001), whereas the dsDNA content did not differ significantly in control OA cartilage explants over the culture period.
Figure 3: DNA content.

DNA content of (A) OA cartilage explants and (B) MSCs on days 4 and 8 of unconfined co-culture of MSC microbeads with OA cartilage explants (3 patients) as measured by picogreen assay. Data are represented as mean ± standard deviation. Statistical significance was calculated by two-way ANOVA with post-hoc Sidak test for pairwise comparisons and represented by p values (*<0.05, **<0.01, ***<0.001, ns or unmarked =not significant).
Meanwhile, in microencapsulated MSCs (2 donors, three independent experiments), the dsDNA content of MSCs was 2.04-fold higher (p=0.001) when cultured in the presence of OA cartilage as compared to control MSC microbeads (cultured alone) on day 4. However, on day 8, the dsDNA content of MSCs co-cultured with OA explants reduced (p=0.006) to the levels observed in control MSC microbeads (Figure 3B). Overall, the cellular content in the OA cartilage tissue increased when the explants were grown in the presence of MSC microbeads. However, in co-cultures, MSCs’ cellular content did not significantly increase stabilized to levels observed without co-culture with OA cartilage on day 8 following an initial increase on day 4 of co-culture. The MSC secretome, via exosomal microRNAs, has been shown to induce proliferation in OA chondrocytes [26,27]. The proliferative response observed in OA cartilage explants could, therefore, be attributed to the interplay between the MSC secretome and OA microenvironment.
2.4. MSC microbeads induce cell proliferation in OA cartilage
An increase in dsDNA content is an indicator of cell proliferation. As the highest increase in dsDNA content in OA explants was observed on day 8 of co-culture with MSC microbeads, immunofluorescent staining for Ki-67 positive cells in the OA cartilage was performed to identify proliferating cells following 8 days in culture. In the absence of MSC microbeads, few Ki-67 positive cells were observed in the OA cartilage explants (n=3) whereas the number of Ki-67+ cells noticeably increased in OA cartilage explants cultured in the presence of MSC microbeads (Figure 4A). Notably, proliferating cells were primarily observed in the superficial to middle zones of OA cartilage, being absent in the deeper zones of cartilage tissue when cultured either in the presence or absence of MSC microbeads (Figure 4B). Quantification of Ki-67 positive cells in the explants revealed a significant increase (p=0.003) in the percentage of proliferating cells in OA cartilage explants co-cultured with MSC microbeads (40.66 ± 6.43%) when compared to the OA cartilage explants grown in the absence of MSC microbeads (3.86 ± 3.20%) (Figure 4C). Therefore, the paracrine effects from the MSC microbeads promoted the proliferation of chondrocyte populations residing in the superficial and middle zones in the OA cartilage. Superficial to middle zones of cartilage is known to harbor chondrocyte progenitor-like cells (CPCs), known for their high proliferative, migratory, and chondrogenic differentiation capacity[28–30]. It is therefore likely that these CPCs are the target populations for the paracrine trophic factors secreted by MSC microbeads.
Figure 4: Immunofluorescent staining of OA cartilage explants for Ki67.

5 μm sections of OA cartilage explants co-cultured with MSC microbeads for 8 days in unconfined format were stained with Ki67 antibody (red) to identify proliferating cells. Nuclei were stained with Hoechst (teal). Representative images (n=3 individual patients) of the (A) superficial to middle zones and (B) middle to deep zones of cartilage are shown. OA explants cultured alone without MSC microbeads served as respective controls. (C) Quantification of the number of Ki67-positive cells in the explants by ImageJ (n=10 different sections from 3 different OA patient tissues). Data represent the mean ± standard deviation of percent Ki67-positive cells. Statistical significance of average positive cells per patient between groups was calculated by one-way ANOVA followed by Welch’s t-test. ‘**’ denotes p-value <0.001.
2.5. Secretome of MSC microbeads modulates the inflammatory profile in OA cartilage
We next sought to profile the secretomes of OA cartilage explants cultured in the presence or absence of MSC microbeads to understand what changes were induced by the MSC-secretome. As inflammation has been implicated as one of the many factors leading to cartilage degeneration and progression into OA, we chose a 72-plex autoantibody assay (Luminex) comprised of cytokines, chemokines, and growth factors that directly or indirectly regulate inflammation. Individual patient-wise comparison of the secretory profiles of the OA cartilage explants depicted heterogeneity in their base-line secretomes as well as in their response to MSC microbeads (Figure 5A). Although there are evident differences between the secretory profile of encapsulated MSCs from 2 donors, their response to OA cartilage appeared similar. Among all analytes, statistically significant differences were observed in three analytes, IL10, HGF and sFAS among the secretomes of OA cartilage and OA explants co-cultured with MSC microbeads. The average MFI of IL10, HGF and sFAS was significantly higher in OA cartilage explants co-cultured with MSC microbeads when compared to OA cartilage explants alone (Figure 5B–D). IL-10, an anti-inflammatory cytokine, is reported to suppress synovial inflammation[31] in vitro, and the upregulation of IL-10 is shown to be a key mechanism by which treatment with small drug molecule, kartogenin, attenuates OA progression in mice[32]. HGF, hepatocyte growth factor, secreted by adipose-derived MSCs when co-cultured with human OA chondrocytes is shown to maintain healthy chondrocyte phenotype in vitro[33]. Thus, increased levels of IL-10 and HGF is indicative of an anabolic response stemming from the interplay between MSC and OA explant secretomes. FAS ligand, an inducer of apoptosis, exists in two forms: membrane-bound FAS ligand (FASL) and soluble FAS (sFAS). The cleavage of mFAS and subsequent release of sFAS by matrix metalloproteinases was previously thought to be indicative of apoptosis signaling. However, recent studies have indicated that sFAS and mFAS may have opposing roles in FAS-mediated apoptosis[34–36] and could be context and disease-dependent. Nevertheless, the administration of sFAS has shown therapeutic effects as evidenced by abrogation of liver damage in mice[37] and modulation of inflammation in rheumatoid arthritis[38]. To ascertain whether the increased levels of sFAS observed in the co-culture secretome contributed to a change in the number of apoptotic cells, in situ TUNEL assay was performed on OA cartilage explants.
Figure 5. Multiplex autoantibody assay of the secretome of OA cartilage-MSC microbeads co-culture.

Spent media collected on day 4 of co-culture of MSC microbeads with OA cartilage explants (n=7 individual patients), respective OA cartilage explants cultured alone, and MSC microbeads cultured alone (2 donors) were subjected to 72-plex autoantibody assay or Luminex assay. (A) Heatmap represents the natural log values of the raw median fluorescence intensity (MFI) of each of the 72 analytes measured. One-way ANOVA was performed with Bonferroni correction on the analytes followed by a post-hoc Tukey’s test to compare differences between samples and statistically significant analytes, namely (B) IL-10, (C) HGF and (D) sFAS are shown. Data represent mean±standard deviation. P-value <0.05 and <0.01 are denoted by * and ** respectively.
To test if apoptosis was decreased, we performed in situ TUNEL assays on the cartilage explant sections. We noted markedly fewer apoptotic cells in the cartilage explants that were co-cultured with MSC microbeads when compared to the OA cartilage alone (Figure 6A). The percent of apoptotic cells significantly (p=0.04) reduced from 41.40±10.35 % in OA cartilage explants to 19.61±4.83% in OA explants co-cultured with MSC microbeads on day 4 of culture (Figure 6B). As a result of the MSC secretome, secreted factors related to the TNF-induced cell-death signaling pathways were dampened in OA cartilage. Congruent with the prior published studies in chondrocytes [13,14], our results also show that the trophic factors secreted by MSCs are anti-apoptotic.
Figure 6. Apoptotic cell staining by TUNEL assay.

(A) Representative images (n=3 OA patient samples) of apoptotic cells (purple) identified by TUNEL assay. Scale bar represents 200 μm for 10X images. Insets represent 20X images. Nuclei (teal) were stained with DAPI. (B) Percent of apoptotic cells were counted using ImageJ (n=11 for OA, n=9 for OA+MSC microbeads from different sections of 3 different patient explants per condition). Statistical significance was calculated by Welch’s t-test and represented by p-value. * indicates p-value <0.05.
2.6. Secretome of MSC microbeads induces ECM remodeling in OA cartilage
In addition to cytokines and chemokines, matrix metalloproteinases (MMPs) and their inhibitors (TIMPs) play a vital role in the pathogenesis of OA. The balance of the degradative MMPs and their inhibitors TIMPs are indicative of the state of ECM remodeling in cartilage, with high levels of MMPs compared to TIMPs being implicated in matrix degradation and disease progression in OA. Therefore, the levels of select MMPs and TIMPs were quantified in the secretome of OA cartilage cultured in the presence or absence of MSC microbeads by multiplexed sandwich-ELISA array (Figure 7A). We observed higher levels of MMP-2, MMP-9, TIMP-1, and TIMP-2 in OA cartilage explants co-cultured with MSC microbeads (Figure 7B). The levels of matrix metalloproteinases MMP-1, MMP-3, MMP-8, MMP-10, and MMP-13 did not change after co-culture (Figure 7 C, E, F, H, I), whereas the levels of MMP-2 (p=0.09 × 10⁻³) and MMP-9 (p=0.01) significantly increased (Figure D, G).
Figure 7. Multiplexed sandwich ELISA array for secreted levels of MMPs and TIMPs.

(A) Scanned image of the MMPs and TIMPs in the media collected on day 4 as detected and measured using Quantibody® Human Metalloproteinase Antibody Array. (B) Heatmap of z-scores of the quantified MMPs and TIMPs in OA cartilage explants cultured with or without MSC microbeads. Average secreted levels (pg/ml) of (C) MMP1, (D) MMP-2, (E) MMP-3, (F) MMP-8, (G) MMP-9, (H) MMP-10 and (I) MMP-1, (J) TIMP-1, (K) TIMP-2 and (L) TIMP-4 is represented as mean ± standard deviation of 3 OA patient samples. Statistical significance was analyzed by one-way ANOVA with Bonferroni correction on the analytes followed by a post-hoc Tukey’s test and significant comparisons were represented by p-value. *, **, ns indicates p-value <0.05, <0.01 or not significant respectively.
MMPs play a complex role in ECM remodeling and have pleiotropic effects. While MMP 3 and 13 that are known to be critical players in OA were not altered by the MSC secretome, there was an increase in MMP-2 and MMP-9 secreted by the OA cartilage in the presence of MSC microbeads. These MMPs are structurally distinct from other MMPs, degrade only denatured collagen [39,40], and can proteolytically release TGFβ from inactive extracellular complexes, thereby aiding in cell migration and wound healing[41]. This may indicate active extracellular remodeling in OA cartilage in response to the MSC secretome-induced proliferative effects on the cartilage tissue.
Notably, the levels of tissue inhibitors of matrix metalloproteinases TIMP-1 were significantly elevated (p=0.04) in the secretome of OA cartilage explants when co-cultured with MSC microbeads (Figure 7J). The levels of TIMP-2 showed a higher trend but were not statistically significant between the two groups and neither were levels of TIMP-4 (Figure 7K, L). TIMP-1 inactivates collagen-degrading MMPs[39] and also inhibits aggrecanases[40] and proteoglycan depletion in cartilage thereby tipping the delicate balance of cartilage homeostasis[41]. Together, the results demonstrated that MSC microbeads also modulate the secretion of ECM remodeling enzymes and their inhibitors.
3. Comments and conclusion
In summary, our study demonstrates that the secretome of microencapsulated MSCs primed to OA cartilage ex vivo orchestrated an anabolic response capable of promoting intrinsic regenerative capacity in OA. These data provide support for the existence of endogenous cells capable of regeneration in end-stage OA cartilage. Although our study focused on MSC-OA cartilage interplay, the in vivo OA joint environment is more complex, with the OA cartilage residing in proximity to inflamed synovium that harbors immune cells. Therefore, future studies should investigate the paracrine effects of MSCs microbeads in combination with immune cells.
4. Experimental Section
4.1. Cartilage explant harvest and culture
Human osteoarthritic cartilage samples were harvested from the surgical knee tissue discards (femoral condyles) of patients (n=7) undergoing total knee arthroplasty according to approved human subjects institutional review board protocols at Stanford University. Cylindrical explants (8mm or 4mm diameter, 1–2 inches thickness) were extracted from the cartilage samples using standard biopsy punches (Integra, NJ, USA). Cartilage explants were cultured in DMEM-F12 medium supplemented with 10% fetal bovine serum (FBS), 25 μg/ml ascorbic acid, 1X glutamine, and 1X antibiotic-antimycotic solution prior to experimentation.
4.2. MSC culture
MSCs were purchased from Lonza (donor1: 36-year-old, donor2: 24-year-old, catalog no. PT-2501, Lonza, USA) and expanded in MSC growth medium: DMEM supplemented with 10% fetal bovine serum (FBS), 10 ng/ml FGF-2, and 1X antibiotic-antimycotic solution in a CO2 incubator (37 °C and 5% CO2).
4.3. Encapsulation of MSCs in alginate microbeads
Polydimethylsiloxane (PDMS) based non-planar microfluidic devices were fabricated as described previously [42]. The microfluidic device consisted of 4 inlets (I1: Oil inlet, I2: Shell inlet, I3: Core inlet, I4: Aqueous inlet), and 2 outlets (O1: Oil outlet, and O2: Microbeads outlet) as shown in Figure 1. To fabricate the microfluidic device, first, a silicon master with patterned microfluidic channels was prepared to utilize the 3-layer SU8 fabrication technique. 100 μm thick layer of photoresist (SU8 2050, Microchem) was coated on a 4-inch silicon wafer. Wafer was then soft-baked, followed by exposure to UV light through the shadow mask for core channel. After post-exposure baking, an additional layer of 50 μm of SU8 2050 was coated and baked. Thereafter, the wafer was exposed to UV light with a different shadow mask to pattern the shell channel. Finally, the third layer for oil and separation channels was also patterned. All three exposures were aligned by utilizing an EVG620 mask aligner. In the end, SU8 pattern was developed in SU8 developer solution. Next, to make PDMS microfluidic devices, a pre-polymer PDMS solution (10:1 ratio of polymer to the curing agent - SYLGARD 184) was poured onto the silicon wafer, degassed, and baked at 65 °C for minimum 3 hrs. Thereafter, two PDMS slabs with identical channel design were then plasma treated for 30 s using Harrick PDC-32G plasma cleaner and aligned under the microscope to form an assembled device. The devices were kept at 65 °C for at least 2 days to make them sufficiently hydrophobic for experiments. To generate alginate beads, purified [43] sodium alginate (2% w/v, Sigma catalog no. A2033) solution was injected from the shell channel (from inlet I2). Cell suspension solution containing MSCs (cell density 6 × 10⁶ cells/ml) and alginate (2% w/v) was prepared and injected via core channel (from inlet I3) into the microfluidic device. All solutions were prepared in 0.3 M D-Mannitol (Sigma) solution and buffered with 10 mM HEPES (Sigma) to maintain physiological pH. To crosslink alginate microspheres, stable emulsion composed of mineral oil (Sigma catalog no. M8410) and aqueous calcium chloride solution (1 gm/ml) was prepared by sonication for 1 min using a Branson Sonifier (SPAN 80 was used as emulsifying agent). All the solutions were injected into the microfluidic device using 4 syringe pumps (Harvard Apparatus and New Era Pumps) to generate microbeads. Flow rates for core, shell, oil, and aqueous extracting fluids (1% sodium carboxymethyl cellulose solution) were 120 μl/hr, 220 μl/hr, 4 ml/hr, and 4ml/hr, respectively. Outlets were connected to a 50 ml tube containing the medium to collect the microbeads. Thereafter, microbeads were washed 3 times with Mannitol solution, suspended in MSC growth medium and cultured in an incubator.
4.4. Study design
MSC microbeads were co-cultured with OA cartilage explants as follows: 4mm OA cartilage explants from 3 patients were placed (1 explant per well) in 48 well tissue culture plates. At least 10 explants per patient were used for the co-culture. To each well containing one cartilage explant, MSC microbead suspension (100–150 MSCs per microbead) was added uniformly such that the final distribution of MSC microbeads was approximately 200 microbeads per well. Cartilage explants cultured alone, without the MSC microbeads, served as controls. Cartilage explants with or without MSC microbeads were grown in DMEM-F12 medium supplemented with 10% fetal bovine serum (FBS), 25 μg/ml ascorbic acid, 1X glutamine and 1X antibiotic-antimycotic solution for 8 days and sampled at day 4 and day 8 of culture. MSC microbeads and OA cartilage explants cultured separately served as controls.
4.5. Histological assessments
OA cartilage explants on days 4 and 8 of culture, were fixed in 4% paraformaldehyde and cryopreserved in 30% sucrose solution, followed by embedding in OCT and cryosectioning. 5 μm sections were stained with hematoxylin (Sigma) for nuclear staining, followed by Safranin O (catalog no 731583, Sigma) for proteoglycans and counter-stained with fast green (catalog no. F7258, Sigma). Stained sections were visualized by an upright microscope (Olympus) at 10X magnification. For OA cartilage explants from 3 different donors, at least 5 sections were stained for each and one representative image was presented. Safranin O distribution was semi-quantified by calculating the percent Safranin O stained area in 5 representative tissue sections acquired from different depths of the OCT embedded OA explants by ImageJ, for each donor (n=3) in control and co-culture conditions.
Histological scoring on the safranin O stained sections (n=7 patient samples) was performed based on the OsScore method (3 sections per patient sample per culture condition) with slight modifications. Histological features namely, tissue morphology, matrix staining, surface architecture and chondrocyte cultures were included whereas mineral, blood vessels and basal integration were excluded from the measurements. Scoring was performed by 2 observers, one of whom was blinded.
4.6. 1,9-dimethylmethylene blue (DMMB) and picogreen assays
OA cartilage tissue (3 explants per patient), on days 4 and 8 of culture in control and co-culture wells, were weighed and then digested in papain digestion buffer (5 mM L-cysteine, 100 mM Na2HPO4, 5 mM EDTA, 125 μg/ml Papain, pH 7.5) overnight at 65 °C. Following digestion, the samples were centrifuged at 21000g for 5 minutes at room temperature. The supernatant was then used for DMMB and picogreen assays.
Sulfated glycosaminoglycans (sGAGs) content in the OA cartilage explants as well as in the spent culture medium on days 4 and 8 of culture was measured by DMMB assay. To note, culture media was changed on day 4 for all samples, therefore, quantification of sGAG in the media on day 8 was not cumulative. 20 μl of the sample was mixed with 200 μl of DMMB solution (16 mg DMMB dye dissolved in an aqueous solution of 0.03M NaCl, 40 mM glycine, 9.5% 0.1M acetic acid, pH 3.0) and absorbance was measured at 525 nm immediately. sGAGs in the samples was quantified using chondroitin-4 sulfate as standard. Quantified sulfated GAG content in OA cartilage explants was normalized to the weight of corresponding explants. The DNA content in OA explants was measured by picogreen assay (Quant-iT™ PicoGreen™ dsDNA Assay Kit, Invitrogen) per manufacturer’s instructions using the papain digest supernatant of the OA explants. For picogreen assay of the cartilage explants, the ds DNA measured per explant was normalized to the weight of the corresponding explant measured before papain digestion. All measurements were conducted in triplicates per patient-derived OA cartilage sample in control and co-culture conditions each and reported as averages per patient sample.
4.7. Confocal microscopy
OA cartilage explants co-cultured with or without MSC microbeads in unconfined culture formats were fixed in 4% paraformaldehyde on day 8 of culture and cryopreserved in 30% sucrose solution, followed by embedding in OCT and cryosectioning. 5 μm sections on poly-L-lysine-coated glass slides were permeabilized with 0.25% Triton X-100 for 10 minutes. Following permeabilization and copious washing in PBS, the sections were blocked with 2% goat serum for 2 hours at room temperature. After blocking, the sections were incubated with a primary antibody, anti-human Ki67 antibody (1:250, catalog no. 14-5699-82, eBioscience™) overnight at 4 °C. Following primary antibody incubation, the slides were washed in PBS thrice and incubated with goat anti-mouse Alexa fluor 546 secondary antibody at a dilution of 1:500 for 2 hours at room temperature. The slides were then washed thrice in PBS, incubated in Hoechst 33342 (2μg/ml, catalog no H3570, Invitrogen) for 15 minutes, and finally mounted with aqueous mounting medium. The stained sections were visualized under a confocal microscope (Zeiss LSM780) at 20X magnification. The number of Ki67+ cells was enumerated using ImageJ software using 10 different stained sections per sample.
4.8. Multiplex autoantibody assay
Culture media collected on day 4 of culture (in technical duplicates per patient-derived OA per control or co-culture condition) was centrifuged at 10,000 × g for 10 min at 4°C was snap-frozen in liquid nitrogen until submission to the Human Immune Monitoring Center at Stanford University for conducting the multiplex autoantibody assay. Human 76-plex kits were purchased from eBiosciences/Affymetrix and used per manufacturer’s instructions with slight modifications. Briefly, beads added to a 96-well plate were washed in a Biotek ELx405 washer. Samples were diluted 3 times and added to the plate containing the mixed antibody-linked beads. The samples were then incubated at room temperature for 1 hour followed by overnight incubation at 4°C with shaking on an orbital shaker at 500–600 rpm. The plates were washed in a Biotek ELx405 washer following incubation, biotinylated detection antibody was added, and the plate was incubated for 75 minutes at room temperature with shaking. The plate was washed again and incubated with streptavidin-PE for 30 minutes at room temperature, followed by washing and finally adding the reading buffer to the wells. Duplicate measurements of each sample were recorded using a Luminex 200 instrument with a lower bound of 50 beads per sample per cytokine. Custom assay control beads (Radix Biosolutions) were added to all wells. The raw MFI read-outs of all samples were analyzed and visual representation was performed using the Complex Heatmap package in R software.
4.9. TUNEL assay
OA cartilage co-cultured with or without MSC microbeads (in technical triplicates per patient-derived OA per control or co-culture condition) were cryo-sectioned and apoptotic cells were stained by TUNEL assay per instructions provided by in situ cell death detection kit (catalog no 11684795910, Roche Inc.) with slight modifications. Briefly, pre-fixed and cryoprotected tissues were cut into 5μm sections on ploy-L-lysine-coated glass slides. Slides were then re-hydrated and permeabilized with 0.25% Triton-X-100 in PBS for 10 minutes at room temperature. After washing, the slides covered and incubated with TUNEL reaction mixture (1-part enzyme solution to 10-parts label solution provided in the kit) at 37 °C for 1 hour. Slides were then washed twice in PBS, mounted in UltraCruz mounting medium, and viewed under a fluorescence microscope (Zeiss Axio Observer.Z1, Zeiss). The number of TUNEL positive cells was enumerated using ImageJ software using 10 different stained sections from 3 different OA patient explants of control and co-culture conditions each.
4.10. Multiplexed sandwich-ELISA array
Culture media collected on day 4 of culture (in technical duplicates per patient-derived OA per control or co-culture condition) was tested for ECM remodeling-related proteins using Quantibody® Human Metalloproteinase Antibody Array (QAH-MMP-1-1, Raybiotech) per manufacturer’s instructions. The sandwich-ELISA based array consisted of 7 matrix metalloproteinases (MMP) MMP-1, MMP-2, MMP-3, MMP-8, MMP-9, MMP-10, and MMP-13, and 3 tissue inhibitors of MMPs (TIMPs) TIMP-1, TIMP-2, and TIMP-4. The spent culture media of OA cartilage explants co-cultured with or without MSC microbeads was first diluted twice in molecular-grade water. Standards were prepared by reconstituting the standard vial supplied in the kit and serially diluting in sample diluent buffer as instructed. The array glass slide was air-dried, and each well was blocked by incubating in sample diluent for 30 minutes at room temperature. The sample diluent buffer was decanted and 100 μl of standards or the diluted samples were added to respective wells on the array glass slide to incubate for overnight at 4°C. Next, the contents were decanted from each well and washed 5 times in wash buffers. To the array wells, 80μl of biotinylated detection antibody cocktail was added and incubated at room temperature for 2 hours. Following copious washing, 80μl of Cy3-equivalent dye-conjugated streptavidin was added to each well and incubated for 1 hour at room temperature in the dark. The array wells were washed 5 times with wash buffer and dried completely before scanning and quantification. Signals were visualized and measured using GenePix Personal 4100A scanner (Molecular Devices, CA, USA). Concentrations of the MMPs and TIMPs were calculated using respective standard curves, z-score was calculated and visually represented by ComplexHeatmap in R software. All measurements were conducted in duplicates for each of the 3 patient-derived OA cartilage samples in control and co-culture conditions each and reported as averages per patient sample.
4.11. Statistical Analyses
All graphical data were represented as mean ± standard deviation. Statistical analyses were performed using Graphpad Prism 8.0 software. For DMMB (n=3 OA patient samples per condition) and picogreen assays(n=3 OA patient samples per condition), a two-way ANOVA was performed to compare differences between two samples at two different time points, followed by post-hoc Sidak test for pairwise comparisons. Two-way ANOVA with Tukey post-hoc test was used to calculate statistical significance between Safranin O stained images semi-quantified by ImageJ (n=3 OA patient samples, 15 sections per sample) at two-time points between two groups. Wilcoxon signed rank test was performed for measuring statistical significance between OsScores. For confocal imaging quantification (n=3 OA patient samples, 10 sections per sample for Ki67 saining, 9–11 sections per sample for TUNEL assay), the statistical difference between samples was analyzed by one-way ANOVA and pairwise statistical significance between groups was calculated by Welch’s t-test. For multiplex autoantibody assay (n=7 OA patient samples, n=2 MSC donors) and multiplexed ELISA array(n=3 OA patient samples), a one-way ANOVA was performed with Bonferroni correction on the analytes followed by a post-hoc Tukey’s test to compare differences between samples. P values greater than 0.05 were considered significant for all statistical tests and represented as *, ** or *** for p values greater than 0.05, 0.01 or 0.001 respectively.
Supplementary Material
Acknowledgments
The authors would like to thank Yael Rosenberg-Hasson at the Stanford Human Immune Profiling Center for help with the multiplex autoantibody assay. Funding information is as follows: NB is supported by NIH/NIAMS grants R01 AR070865 and R01 AR070864, NS is supported by AR070865.
References
- [1].Robinson WH, Lepus CM, Wang Q, Raghu H, Mao R, Lindstrom TM, Sokolove J, Nat Rev Rheumatol 2016, 12, 580. [DOI] [PMC free article] [PubMed] [Google Scholar]
- [2].Le Blanc K, Tammik L, Sundberg B, Haynesworth SE, Ringden O, Scand J Immunol 2003, 57, 11. [DOI] [PubMed] [Google Scholar]
- [3].Di Nicola M, Carlo-Stella C, Magni M, Milanesi M, Longoni PD, Matteucci P, Grisanti S, Gianni AM, Blood 2002, 99, 3838. [DOI] [PubMed] [Google Scholar]
- [4].Ezquer F, Morales P, Quintanilla ME, Santapau D, Lespay-Rebolledo C, Ezquer M, Herrera-Marschitz M, Israel Y, Sci Rep 2018, 8, 4325. [DOI] [PMC free article] [PubMed] [Google Scholar]
- [5].González MA, Gonzalez-Rey E, Rico L, Büscher D, Delgado M, Arthritis Rheum 2009, 60, 1006. [DOI] [PubMed] [Google Scholar]
- [6].Park SA, Reilly CM, Wood JA, Chung DJ, Carrade DD, Deremer SL, Seraphin RL, Clark KC, Zwingenberger AL, Borjesson DL, et al. , Cytotherapy 2013, 15, 1498. [DOI] [PubMed] [Google Scholar]
- [7].Gupta PK, Chullikana A, Rengasamy M, Shetty N, Pandey V, Agarwal V, Wagh SY, Vellotare PK, Damodaran D, Viswanathan P, et al. , Arthritis Res Ther 2016, 18, 301. [DOI] [PMC free article] [PubMed] [Google Scholar]
- [8].Lamo-Espinosa JM, Mora G, Blanco JF, Granero-Moltó F, Nuñez-Córdoba JM, Sánchez-Echenique C, Bondía JM, Aquerreta JD, Andreu EJ, Ornilla E, et al. , J Transl Med 2016, 14, 246. [DOI] [PMC free article] [PubMed] [Google Scholar]
- [9].Jo CH, Lee YG, Shin WH, Kim H, Chai JW, Jeong EC, Kim JE, Shim H, Shin JS, Shin IS, et al. , Stem Cells 2014, 32, 1254. [DOI] [PubMed] [Google Scholar]
- [10].Wang H, Cao F, De A, Cao Y, Contag C, Gambhir SS, Wu JC, Chen X, Stem Cells 2009, 27, 1548. [DOI] [PMC free article] [PubMed] [Google Scholar]
- [11].Lefèvre S, Knedla A, Tennie C, Kampmann A, Wunrau C, Dinser R, Korb A, Schnäker E-M, Tarner IH, Robbins PD, et al. , Nat Med 2009, 15, 1414. [DOI] [PMC free article] [PubMed] [Google Scholar]
- [12].Breitbach M, Bostani T, Roell W, Xia Y, Dewald O, Nygren JM, Fries JWU, Tiemann K, Bohlen H, Hescheler J, et al. , Blood 2007, 110, 1362. [DOI] [PubMed] [Google Scholar]
- [13].Zhang S, Chuah SJ, Lai RC, Hui JHP, Lim SK, Toh WS, Biomaterials 2018, 156, 16. [DOI] [PubMed] [Google Scholar]
- [14].Liu Y, Lin L, Zou R, Wen C, Wang Z, Lin F, Cell Cycle 2018, 17, 2411. [DOI] [PMC free article] [PubMed] [Google Scholar]
- [15].Ruiz M, Toupet K, Maumus M, Rozier P, Jorgensen C, Noël D, Biomaterials 2020, 226, 119544. [DOI] [PubMed] [Google Scholar]
- [16].Cosenza S, Toupet K, Maumus M, Luz-Crawford P, Blanc-Brude O, Jorgensen C, Noël D, Theranostics 2018, 8, 1399. [DOI] [PMC free article] [PubMed] [Google Scholar]
- [17].Mao AS, Shin J-W, Utech S, Wang H, Uzun O, Li W, Cooper M, Hu Y, Zhang L, Weitz DA, et al. , Nature Mater 2017, 16, 236. [DOI] [PMC free article] [PubMed] [Google Scholar]
- [18].Stucky EC, Schloss RS, Yarmush ML, Shreiber DI, Cytotherapy 2015, 17, 1353. [DOI] [PMC free article] [PubMed] [Google Scholar]
- [19].Roffi A, Nakamura N, Sanchez M, Cucchiarini M, Filardo G, IJMS 2018, 19, 3322. [DOI] [PMC free article] [PubMed] [Google Scholar]
- [20].Mao AS, Özkale B, Shah NJ, Vining KH, Descombes T, Zhang L, Tringides CM, Wong S-W, Shin J-W, Scadden DT, et al. , Proc Natl Acad Sci USA 2019, 116, 15392. [DOI] [PMC free article] [PubMed] [Google Scholar]
- [21].Follin B, Juhl M, Cohen S, Pedersen AE, Kastrup J, Ekblond A, Tissue Eng Part B: Rev 2016, 22, 322. [DOI] [PMC free article] [PubMed] [Google Scholar]
- [22].Sarem M, Heizmann M, Barbero A, Martin I, Shastri VP, Proc Natl Acad Sci USA 2018, 115, E6135. [DOI] [PMC free article] [PubMed] [Google Scholar]
- [23].Stevens MM, Marini RP, Schaefer D, Aronson J, Langer R, Shastri VP, Proc Natl Acad Sci 2005, 102, 11450. [DOI] [PMC free article] [PubMed] [Google Scholar]
- [24].Roberts S, McCall IW, Darby AJ, Menage J, Evans H, Harrison PE, Richardson JB, Arthritis Res Ther 2003, 5, R60. [DOI] [PMC free article] [PubMed] [Google Scholar]
- [25].Rutgers M, van Pelt MJP, Dhert WJA, Creemers LB, Saris DBF, Osteoarthritis Cartilage 2010, 18, 12. [DOI] [PubMed] [Google Scholar]
- [26].Mao G, Zhang Z, Hu S, Zhang Z, Chang Z, Huang Z, Liao W, Kang Y, Stem Cell Res Ther 2018, 9, 247. [DOI] [PMC free article] [PubMed] [Google Scholar]
- [27].Sun H, Hu S, Zhang Z, Lun J, Liao W, Zhang Z, J Cell Biochem 2019, 120, 171. [DOI] [PubMed] [Google Scholar]
- [28].Dowthwaite GP, Journal of Cell Science 2004, 117, 889. [DOI] [PubMed] [Google Scholar]
- [29].Alsalameh S, Amin R, Gemba T, Lotz M, Arthritis & Rheumatism 2004, 50, 1522. [DOI] [PubMed] [Google Scholar]
- [30].Pretzel D, Linss S, Rochler S, Endres M, Kaps C, Alsalameh S, Kinne RW, Arthritis Res Ther 2011, 13, R64. [DOI] [PMC free article] [PubMed] [Google Scholar]
- [31].Broeren MGA, de Vries M, Bennink MB, Arntz OJ, van Lent PLEM, van der Kraan PM, van den Berg WB, van den Hoogen FHJ, Koenders MI, van de Loo FAJ, Arthritis Res Ther 2016, 18, 186. [DOI] [PMC free article] [PubMed] [Google Scholar]
- [32].Kwon JY, Lee SH, Na H-S, Jung K, Choi J, Cho KH, Lee C-Y, Kim SJ, Park S-H, Shin D-Y, et al. , Sci Rep 2018, 8, 13832. [DOI] [PMC free article] [PubMed] [Google Scholar]
- [33].Maumus M, Manferdini C, Toupet K, Peyrafitte J-A, Ferreira R, Facchini A, Gabusi E, Bourin P, Jorgensen C, Lisignoli G, et al. , Stem Cell Research 2013, 11, 834. [DOI] [PubMed] [Google Scholar]
- [34].Schneider P, Holler N, Bodmer J-L, Hahne M, Frei K, Fontana A, Tschopp J, J Exp Med 1998, 187, 1205. [DOI] [PMC free article] [PubMed] [Google Scholar]
- [35].Matsumoto H, Murakami Y, Kataoka K, Notomi S, Mantopoulos D, Trichonas G, Miller JW, Gregory MS, Ksander BR, Marshak-Rothstein A, et al. , Cell Death Dis 2015, 6, e1986. [DOI] [PMC free article] [PubMed] [Google Scholar]
- [36].Hohlbaum AM, Moe S, Marshak-Rothstein A, J Exp Med 2000, 191, 1209. [DOI] [PMC free article] [PubMed] [Google Scholar]
- [37].Matsuki Y, Li L, Hsu H-C, Yang PA, Zheng R, Edwards CK, Chaudry IH, Zhang H-G, Mountz JD, Cell Death Differ 2002, 9, 626. [DOI] [PubMed] [Google Scholar]
- [38].Kim W-U, Kwok S-K, Hong K-H, Yoo S-A, Kong J-S, Choe J, Cho C-S, Arthritis Res Ther 2007, 9, R42. [DOI] [PMC free article] [PubMed] [Google Scholar]
- [39].Page-McCaw A, Ewald AJ, Werb Z, Nat. Rev. Mol. Cell Biol. 2007, 8, 221. [DOI] [PMC free article] [PubMed] [Google Scholar]
- [40].Cawston TE, Young DA, Cell Tissue Res 2010, 339, 221. [DOI] [PubMed] [Google Scholar]
- [41].Yu Q, Stamenkovic I, Genes Dev. 2000, 14, 163. [PMC free article] [PubMed] [Google Scholar]
- [42].Agarwal P, Zhao S, Bielecki P, Rao W, Choi JK, Zhao Y, Yu J, Zhang W, He X, Lab Chip 2013, 13, 4525. [DOI] [PMC free article] [PubMed] [Google Scholar]
- [43].Sondermeijer HP, Witkowski P, Woodland D, Seki T, Aangenendt FJ, van der Laarse A, Itescu S, Hardy MA, J Biomater Appl 2016, 31, 510. [DOI] [PMC free article] [PubMed] [Google Scholar]
Associated Data
This section collects any data citations, data availability statements, or supplementary materials included in this article.