Abstract
Purpose:
To investigate the relationships among docosahexaenoic acid (DHA) intake, nutrient intake, and maternal characteristics on pregnancy outcomes in a phase III randomised clinical trial designed to determine the effect of a DHA dose of 1000 mg/day compared to 200 mg/day on early preterm birth (<34 weeks gestation).
Methods:
A secondary aim of the phase III randomised trial was to explore the relationships among pregnancy outcomes (maternal red blood cell phospholipid (RBC-PL) DHA at delivery, preterm birth, gestational age at delivery, labor type, birth anthropometric measures, low birth weight, gestational diabetes, pre-eclampsia, and admission to a neonatal intensive care unit) in participants (n=1100). We used Bayesian multiple imputation and linear and logistic regression models to conduct an analysis of five general classes of predictor variables collected during the trial: a) DHA intake, b) nutrient intake from food and supplements, c) environmental exposure to tobacco and alcohol, d) maternal demographics, and e) maternal medical history.
Results:
DHA supplementation lowered the risk of preterm birth and NICU admission, and increased gestation and birth weight as observed in the primary analysis. Higher maternal RBC-PL-DHA at delivery was associated with DHA supplementation and formal education of a bachelor’s degree or higher. DHA supplementation and maternal age were associated with a higher risk of gestational diabetes. Total vitamin A intake was associated with longer gestation, while fructose and intake of the long chain omega-6 fatty acid, arachidonic acid, were associated with shorter gestation. Risk of preterm birth was associated with a history of low birth weight, preterm birth, pre-eclampsia, and NICU admission.
Conclusion:
Bayesian models provide a comprehensive approach to relationships among DHA intake, nutrient intake, maternal characteristics, and pregnancy outcomes. We observed previously unreported relationships between gestation duration and fructose, vitamin A, and arachidonic acid that could be the basis for future research.
Keywords: DHA, pregnancy, preterm birth, fructose, arachidonic acid, vitamin A
INTRODUCTION
Adverse pregnancy outcomes are major obstetric healthcare concerns and pose significant risk for perinatal morbidity, mortality, and long-term disability (1). Many studies have identified individual predictors of preterm birth, low birth weight, gestational age, gestational diabetes, pre-eclampsia, and neonatal intensive care unit (NICU) admission, however, none has comprehensively evaluated all of these outcomes simultaneously and in an agnostic manner. Bayesian regression models offer the opportunity to examine the relationship of multiple maternal characteristics to a variety of pregnancy outcomes in such manner. A secondary aim of our randomised, multi-site trial comparing the effects of two doses of docosahexaenoic acid (DHA) on early preterm birth (<34 weeks’ gestation) was to utilize the extensive information collected on each participant during the trial to examine predictors of multiple pregnancy outcomes (2). At the conclusion of that trial, 1000 mg per day DHA was superior to 200 mg per day DHA in reducing both early preterm birth and preterm birth (<37 weeks’ gestation), especially among women who entered pregnancy with low DHA status, defined as a red blood cell phospholipid (RBC-PL) DHA <6% of total fatty acids (3).
The primary objective of this secondary efficacy analysis was to employ Bayesian multiple regression models and deviance information criteria to examine the association between DHA supplementation during pregnancy and pregnancy outcomes (maternal RBC-PL DHA at delivery, preterm birth, gestational age at delivery, labor type, birth anthropometric measures, low birth weight, gestational diabetes, pre-eclampsia, and admission to a neonatal intensive care unit). A secondary objective was to examine maternal nutrient intake, environmental exposure to tobacco and alcohol, demographics, and maternal medical history as predictors of pregnancy outcomes while controlling for the effects of DHA status.
METHODS
Study design and participants.
In this randomized, multi-center, double-blind trial, 1100 women were recruited from three academic medical centers in the United States (University of Kansas, Ohio State University and University of Cincinnati) to study the effect of assignment to a DHA dose of 200 or 1000 mg/day on early preterm birth <34 weeks gestation. The study protocol and statistical analysis plan are both accessible at https://r2d2.kumc.edu/ADORE/index.jsp. Details of the trial design and execution (response adaptive randomization, participant flowchart, blinding, adverse events) are published (2, 3). Exclusion criteria were strictly limited by the USA Food and Drug Administration requirement to conduct the study under an Investigational New Drug (IND#129,482); i.e., multifetal gestation, unwillingness to discontinue a daily DHA supplement of 200 mg or more, or allergic to any component of DHA (including algae) or vegetable oil. All 1100 women who enrolled in the primary trial were included in this secondary efficacy analysis. Both the primary, intention-to-treat results of that trial (3) and the effects of adherence to the higher dose (4) on early and late preterm birth are published.
Red blood cell phospholipid fatty acids.
Maternal RBC-PL DHA was determined at baseline and delivery as a weight percent of total fatty acids. The procedures used for extracting and isolating phospholipids from red blood cells, trans-methylation of fatty acids with boron trifluoride and methanol, and separation and quantification of individual fatty acid methyl esters by gas chromatography are published in the report of the primary trial results (3).
Dietary intake.
Dietary intake was assessed at baseline using the National Cancer Institute’s (NCI) Diet History Questionnaire-II (DHQ-II) or up to three 24-hour dietary recalls. The DHQ-II is a food frequency questionnaire (FFQ) that was developed by the Risk Factor Assessment Branch of the NCI’s Epidemiology and Genomics Research Program (5). It consists of 134 items asking about dietary intake including questions about portion size, and it has been validated to assess overall dietary intake (6–8). Questionnaires were analyzed using the Nutrient and Food Group Database (9) and Diet*Calc software (10) which are both available for download from the NCI website (11, 12).
Because the DHQ-II was not validated for the Latino population at the time the study began, all participants who self-identified as Latina were asked to complete three 24-h dietary recalls, except 33 Latina participants recruited before the 24-hour dietary recall methodology was incorporated into the trial, shown to represent usual individual dietary intakes (13), with trained staff members using a multiple-pass approach (14). Five distinct passes were used. The first pass recorded a quick list with all food and beverage items consumed by the participant from midnight to midnight of the previous day. The second pass asked a series of questions to prompt participants to remember any food of beverage omitted (for example, beverages, alcoholic drinks, sweets, snacks, fruits, breads and rolls). The third pass asked for the time participants began eating or drinking each food or beverage as well as how they would call each eating occasion. In the fourth step, participants were asked for specific details about each item listed including the amount consumed, method of preparation, brand of the food, and any additional ingredients (for example, adding sugar to beverages). The final pass consisted of probing questions for commonly forgotten foods and reviews all the details for completeness and correctness (14). Participants were provided with physical serving utensils and a Food Amounts Booklet in their preferred language to assist in estimating portion sizes consumed (15, 16). To reflect the marketplace throughout the study, dietary intake data were collected using Nutrition Data System for Research (NDSR) software versions 2016, 2017, and 2019 developed by the Nutrition Coordinating Center (NCC), University of Minnesota, Minneapolis, MN, however, the final calculations were completed using NDSR version 2019. The NDSR time-related database updates analytic data while maintaining nutrient profiles true to the version used for data collection (17–19).
Pregnancy outcomes.
Pregnancy-related outcomes were obtained from hospital records including gestational age at delivery, labor type (spontaneous or other), infant birth weight, length, and head circumference; and pregnancy-related complications of gestational diabetes and pre-eclampsia. Gestational age was determined by ACOG guidelines (20). To address risk or protective predictors for pregnancy outcomes, we considered predictor variables from five general classes collected as part of the primary trial: a) DHA intake, b) diet (intake of nutrients and foods), c) environmental exposure to tobacco and alcohol, d) participants demographics and e) maternal medical history (Appendix A). DHA intake as a class of maternal characteristics was derived from baseline DHA status, baseline DHA intake and trial daily DHA supplementation. Trial daily DHA supplementation was calculated as the number of capsules taken daily multiplied by the DHA assigned (200mg for the control group and 1000mg for the treatment group) divided by the number of days pregnant.
Bayesian analysis.
Prior to the conduct of regression analyses, possible co-linearity among continuous predictor variables within each predictor class were first standardized by subtracting the mean and dividing by the standard deviation and then examined with Pearson’s correlation coefficient. Predictors with a Pearson’s correlation coefficient greater than 0.9 were removed from the model within each predictor class. For example, 15 out of 30 nutrients were removed, leaving 15 with correlations <0.9.
Values for each one of the continuous predictors were standardized by subtracting the mean and dividing by the standard deviation. Standardized continuous predictors were used to run the multiple regression and to obtain standardized regression coefficients. Because standardization puts different predictors on the same scale, the coefficients can be compared directly and the most important predictor variable in the regression model identified (21). A one standard deviation change in the predictor variable is significant. Statistical significance is achieved if the z-score is greater than 1.645 or less than −1.645.
Bayesian linear regression models were based on the normal distribution for continuous outcome variables. For categorical/binary outcome variables, Bayesian logistic regression models were used. By taking a Bayesian approach, we were able to draw statistical inference based on the posterior distribution (22). Noninformative priors were imposed on the regression coefficient and variance parameters. All analyses were by intention-to-treat. Participants who withdrew or were lost to follow-up were treated as missing and multiple imputations were performed for both predictor and outcome variables within the Bayesian model. We used Markov chain Monte Carlo (MCMC) methods for all Bayesian analyses using program R 4.0.3 and package rjags (23) that calls on program JAGS 4.3.0, and figures were produced using the package ggplot2 (24). JAGS code is provided in Appendix B. All analyses were fitted using 1,000 adaptations, and 10,000 burn-in draws of MCMC simulations, followed by 3 chains for 50,000 draws with no thinning for statistical inference.
Because our primary goal was to understand the relationship between DHA intake and pregnancy outcomes, DHA status (baseline RBC-PL-DHA, baseline DHA intake) and daily DHA supplement intake were always included as predictor variables in the best models for all pregnancy outcomes. Daily DHA supplement intake was estimated from the amount of DHA/capsule (after the study was unblinded) and the number of capsules consumed/day. Capsule count was based on the number returned to the investigational pharmacy or recorded by staff from questions to participants. The sole exception was that DHA status was not included in the best model for labor type.
Because each of the four other classes of maternal characteristics (e.g., nutrient intake) had multiple components, we explored 25 = 32 possible subsets of the five general classes of predictors to determine which regression model was the best for each pregnancy outcome to reduce computational time as opposed to running 246 ≈ 7 × 10¹³ different models for subset selection, The 32 subsets of predictors considered for the model selection procedure are shown in Table 1.
Table 1.
Subsets of Predictors in Model Selection
| Predictor classes | # of predictors | Description of predictor classes |
|---|---|---|
|
| ||
| DHA during pregnancy | 1 | one predictor from DHA class |
| Class 1 | 3 | DHA |
| Class 2 | 31 | nutrients |
| Class 3 | 3 | exposures |
| Class 4 | 9 | demographics |
| Class 5 | 20 | maternal medical history |
| Class 1 & 2 | 33 | DHA, nutrients |
| Class 1 & 3 | 5 | DHA, exposures |
| Class 1 & 4 | 11 | DHA, demographics |
| Class 1 & 5 | 22 | DHA, maternal medical history |
| Class 2 & 3 | 33 | nutrients, exposure |
| Class 2 & 4 | 39 | nutrients, demographics |
| Class 2 & 5 | 50 | nutrients, maternal medical history |
| Class 3 & 4 | 11 | exposure, demographics |
| Class 3 & 5 | 22 | exposure, maternal medical history |
| Class 4 & 5 | 28 | demographics, maternal medical history |
| Class 1 & 2 & 3 | 35 | DHA, nutrients, exposure |
| Class 1 & 2 & 4 | 41 | DHA, nutrients, demographics |
| Class 1 & 2 & 5 | 52 | DHA, nutrients, maternal medical history |
| Class 1 & 3 & 4 | 13 | DHA, exposure, demographics |
| Class 1 & 3 & 5 | 24 | DHA, exposure, maternal medical history |
| Class 1 & 4 & 5 | 30 | DHA, demographics, maternal medical history |
| Class 2 & 3 & 4 | 41 | nutrients, exposure, demographics |
| Class 2 & 3 & 5 | 52 | nutrients, exposure, maternal medical history |
| Class 2 & 4 & 5 | 58 | nutrients, demographics, maternal medical history |
| Class 3 & 4 & 5 | 30 | exposure, demographics, maternal medical history |
| Class 1 & 2 & 3 & 4 | 43 | DHA, nutrients, exposure, demographics |
| Class 1 & 2 & 3 & 5 | 54 | DHA, nutrients, exposure, maternal medical history |
| Class 1 & 2 & 4 & 5 | 60 | DHA, nutrients, demographics, maternal medical history |
| Class 1 & 3 & 4 & 5 | 32 | DHA, exposure, demographics, maternal medical history |
| Class 2 & 3 & 4 & 5 | 60 | nutrients, exposure, demographics, maternal medical history |
| Class 1 & 2 & 3 & 4 & 5 | 62 | DHA, nutrients, exposure, demographics, maternal medical history |
To save computational power, we ran 32 models for only 4 outcomes (maternal RBC-PL DHA, birth weight, gestational age, and labor type) then fit the best model for birth weight onto birth length, birth head circumference and LBW; and the best model for gestational age onto preterm birth, gestational diabetes, pre-eclampsia, and neonatal intensive care unit (NICU) admission.
We utilized a global fit index called Deviance Information Criteria (DIC) based on the simulated draws from the posterior distribution that approximates a model’s out-of-sample predictive performance to determine which variables to keep in the final model. DIC can be applied generally to compare the predictive performance of both Bayesian normal and logistic regression models (25). The DICs from 32 Bayesian models were compared for each outcome variable. Differences in DICs greater than 7 were used to choose the preferred model (26). If differences in DICs of the top 3 models were less than 7, the results from the best three were compared as a sensitivity analysis. In general, the Bayesian model with the lowest DIC was chosen to be the best model for statistical inference.
Ethical standards.
The trial was approved by the Institutional Review Board at The University of Kansas Medical Center with reliance by the University of Cincinnati, Ohio State University and Nationwide Children’s Institutional Review Boards and registered with ClinicalTrials.gov (NCT02626299). All participants gave their informed consent in writing prior to their inclusion in the study. We adhered to the protocol for the primary study, which was published prior to the conduct of the study and is accessible at https://r2d2.kumc.edu/ADORE/index.jsp.
RESULTS
Descriptive statistics for outcome variables are presented in Table 2 and predictor variables are presented in Table 3. In Table 3, 15 nutrients were removed to handle co-linearity for modeling (identified by an asterisk). Descriptive statistics are based on the raw data for both predictor and outcome variables and include mean and standard deviation for continuous variables and frequency count and percentage for categorical variables. All 1100 women who enrolled for the primary trial were included in the analyses using Bayesian multiple imputation.
Table 2.
Summary Statistics for Outcomes
| Continuous outcomes | mean (SD) |
| Maternal RBC at birth | 8.84 (3.14) |
| Gestational age (days) at delivery | 270.9 (13.8) |
| Birth weight (g) at delivery | 3296.7 (558.5) |
| Birth length (cm) at delivery | 50 (4) |
| Birth head circumference (cm) at delivery | 33.9 (2.4) |
|
| |
| Categorical outcomes | count (%) |
| Low birth weight (<2500 g) | |
| Yes | 63 (5.7%) |
| No | 965 (87.7%) |
| Unknown | 72 (6.5%) |
| Pre-term birth (<37 weeks) | |
| Yes | 98 (8.9%) |
| No | 934 (84.9%) |
| Unknown | 68 (6.2%) |
| Gestational diabetes | |
| Yes | 120 (10.9%) |
| No | 937 (85.2%) |
| Unknown | 43 (3.9%) |
| Pre-eclampsia | |
| Yes | 66 (6.0%) |
| No | 966 (87.8%) |
| Unknown | 68 (6.2%) |
| Neonatal ICU admission | |
| Yes | 108 (9.8%) |
| No | 924 (84.0%) |
| Unknown | 68 (6.2%) |
| Spontaneous labor | |
| Yes | 285 (25.9%) |
| No | 747 (67.9%) |
| Unknown | 68 (6.2%) |
Table 3.
Summary Statistics for Predictors
| Class 1: DHA | Mean (SD) | Class 3: Exposures | mean (SD) |
| Total DHA Supplement (mg/day) | 428.3 (366.1) | Alcohol drinks 6 months prior to pregnancy (count/day) | 1.5 (2.3) |
| Maternal RBC-PL DHA level at enrollment (% total fatty acids) | 6.38 (1.77) | Smoking status 6 months prior to pregnancy | Yes n (%) 142 (12.9%) |
| Estimated DHA intake at enrollment from DHA FFQ (mg/day) | 148.7 (126.9) | ||
|
| |||
| Class 2: Nutrients | mean(SD) | Class 4: Demographics | mean(SD) |
| *Arginine (g/day) | 4 (4) | Maternal age at enrollment (years) | 30.2 (5.6) |
| *Available carbohydrate (g/day) | 259 (268) | Marital status | |
| Betaine (mg/day) | 161 (179) | Married/Partnered n (%) | 704 (64.0%) |
| Caffeine (mg/day) | 131 (160) | Other n (%) | 396 (36.0%) |
| Calcium (mg/day) | 1213 (1299) | Household income | |
| *Cholesterol (mg/day) | 306 (272) | $50,000 and over n (%) | 512 (46.5%) |
| Choline (mg/day) | 346 (310) | Other n (%) | 588 (53.5%) |
| *Food folate (mcg/day) | 335 (304) | Health insurance status | |
| Fructose (g/day) | 42 (64) | Insured n (%) | 911 (82.8%) |
| *Iron (mg/day) | 15 (14) | Uninsured n (%) | 189 (17.2%) |
| *Lysine (g/day) | 5 (5) | Maternal education level | |
| *Magnesium (mg/day) | 337 (258) | Bachelor's degree or higher n (%) | 495 (45.0%) |
| Omega-3 fatty acids (g/day) | 1.73 (1.62) | Other n (%) | 605 (55.0%) |
| PFA 20:4/ Arachidonic (mg/day) | 96 (123) | Paternal education level | |
| PFA 22:6/Docosahexaenoic (mg/day) | 59 (74) | Bachelor's degree or higher n (%) | 412 (37.5%) |
| Retinol (mcg/day) | 510 (542) | Other n (%) | 688 (62.5%) |
| *Riboflavin/Vitamin B2 (mg/day) | 2 (2) | Maternal race/ethnicity | |
| *Selenium (mcg/day) | 101 (87) | Black n (%) | 256 (23.3%) |
| *Sodium (mg/day) | 3196 (2886) | Other n (%) | 844 (76.7%) |
| Sucrose (g/day) | 48 (61) | Infant sex | |
| *Thiamin/Vitamin B1 (mg/day) | 2 (1) | Male n (%) | 532 (48.4%) |
| *Total dietary fiber (g/day) | 21 (17) | Female n (%) | 500 (45.5%) |
| Total folate (mcg/day) | 447 (373) | Unknown n (%) | 68 (6.2%) |
| *Total protein (g/day) | 78 (73) | ||
| Total vitamin A activity/Retinol Equivalents (mcg/day) | 1302 (1528) | ||
| Vitamin B12 (mcg/day) | 6 (7) | ||
| *Vitamin B6 (mg/day) | 2 (3) | ||
| Vitamin D/calciferol (mcg/day) | 5 (7) | ||
| Vitamin E/International Units (IU/day) | 16 (19) | ||
| *Zinc (mg/day) | 12 (12) | ||
| Class 5: Maternal Health History | mean (SD) |
| BMI at enrollment | 28.2 (7.3) |
| Gestational weight gain (lb) | 31.1 (18.9) |
| Gestational age at enrollment (weeks) | 16.8 (2.6) |
| Gravida/number of pregnancies | 2.7 (1.9) |
| Number of early preterm births | 0.16 (0.48) |
| Systolic blood pressure at enrollment (mm Hg) | 115.2 (12.4) |
| Diabetes blood pressure at enrollment (mm Hg) | 68.2 (9.4) |
| Highest diastolic blood pressure during pregnancy (mm Hg) | 75.8 (11.2) |
| Highest Systolic blood pressure during pregnancy (mm Hg) | 131.7 (14) |
| Iron status/hemoglobin at enrollment (g/dl) | 12.7 (1.0) |
| Iron status/hemoglobin at mid-pregnancy (g/dl) | 11.5 (1.0) |
| Cervical length between 18–22 weeks gestation (cm) | 4.1 (2.7) |
| Estimated blood loss at delivery (mL) | 429.2 (341.4) |
| Infant APGAR scores at 1 minute of life | 7.9 (1.6) |
| Infant APGAR scores at 5 minutes of life | 8.8 (0.7) |
| Preterm delivery (<37 weeks gestation) | |
| Yes n (%) | 98 (8.9%) |
| No n (%) | 1002 (91.1%) |
| Gestational diabetes | |
| Yes n (%) | 68 (6.2%) |
| No n (%) | 1032 (93.8%) |
| Meconium | |
| Yes n (%) | 121 (11.0%) |
| No n (%) | 979 (89.0%) |
| Illicit drug use | |
| Yes n (%) | 90 (8.2%) |
| No n (%) | 1010 (91.8%) |
For each of the eleven pregnancy outcomes, posterior mean with Bayesian 95% credible intervals for estimated regression coefficients of significant predictors are provided in Tables 4a and 4b. For selected pregnancy outcomes, forest plots are shown in Figures 1 through 11: Figure 1 shows the significant predictors for maternal RBC-PL-DHA at delivery; Figure 2 for gestational age; Figures 3 to 6 for birth anthropometrics; Figure 7 for preterm birth; Figures 8 to 10 for gestational diabetes, pre-eclampsia and NICU admission; and Figure 11 for spontaneous labor. For all the tables and figures, a predictor is favorable if it has an effect in the direction of a better pregnancy outcome (e.g., longer gestational age), and unfavorable if it has an effect in the direction of a worse pregnancy outcome (e.g., a higher chance of getting gestational diabetes). In each case where BMI is a significant predictor, it should be understood as a likely effect of an overweight BMI (above 25) given that the mean BMI for the cohort was 28.2.
Table 4a.
Standardized Normal Regression Coefficients Expressed as Posterior Mean and 95% Credible Intervals
| Predictor | Maternal RBC at delivery | Gestational age (day) | Birth weight (g) | Birth length (m) | Head circumference (cm) | |
|---|---|---|---|---|---|---|
| Total DHA Supplement per day | 1.36 (1.22, 1.51) | 0.69 (−0.07, 1.44) | 29.07 (−3.4, 61.64) | - | - | |
| Maternal RBC-PL DHA level at enrollment | 0.65 (0.48, 0.82) | 1.01 (0.11, 1.92) | - | - | - | |
| Maternal age at enrollment (years) | 0.3 (0.12, 0.48) | −1.78 (−2.71, −0.85) | - | - | - | |
| Maternal education (Bachelor's degree or higher) | 0.66 (0.17, 1.15) | - | - | - | - | |
| BMI at enrollment | −0.48 (−0.66, −0.3) | - | 88.91 (50.33, 127.3) | 0.39 (0.1, 0.68) | 0.33 (0.15, 0.51) | |
| Diastolic blood pressure at enrollment | 0.21 (0.03, 0.4) | - | - | - | - | |
| iron status / hemoglobin at mid-pregnancy | 0.4 (0.22, 0.59) | - | - | - | - | |
| cervical length between 18–22 weeks gestation | −0.37 (−0.55, −0.18) | - | - | −0.24 (−0.51, 0.03) | - | |
| Fructose (g/day) | - | −1.22 (−2.58, 0.14) | −78.28 (−157, 0.71) | - | - | |
| PFA 20:4/Arachidonic (mg/day) | - | −1.76 (−3.32, −0.2) | - | - | - | |
| Total vitamin A activity/Retinol Equivalents (mcg/day) | - | 1.48 (0.05, 2.9) | - | - | - | |
| Infant sex (Male) | - | −1.56 (−3.03, −0.09) | - | 0.65 (0.18, 1.12) | 0.38 (0.09, 0.67) | |
| Gestational weight gain | - | 1.76 (0.96, 2.56) | 153.8 (119.3, 188.2) | 0.71 (0.45, 0.96) | 0.37 (0.22, 0.53) | |
| Number of preterm births | - | −1.3 (−2.28, −0.33) | −66.58 (−105.7, −27.69) | −0.5 (−0.81, −0.19) | - | |
| Highest systolic blood pressure during pregnancy | - | −2.58 (−3.66, −1.49) | −94.25 (−139.5, −48.46) | - | −0.33 (−0.54, −0.12) | |
| Infant APGAR scores at 1 minute of life | - | −2.16 (−3.23, −1.03) | - | - | - | |
| Infant APGAR scores at 5 minutes of life | - | 6.03 (5, 7.01) | 50.73 (6.46, 94.81) | 0.85 (0.5, 1.2) | 0.33 (0.09, 0.58) | |
| Gestational diabetes (yes) | - | −2.89 (−6.14, 0.36) | - | - | - | |
| Meconium (yes) | - | 3.21 (0.92, 5.51) | 158.8 (69.07, 248.9) | 0.71 (−0.03, 1.44) | - | |
| iron status / hemoglobin at enrollment | - | - | 39.37 (−0.74, 79.38) | - | - | |
| Marital status (Married/Partnered) | - | - | - | 0.73 (0.04, 1.42) | 0.52 (0.09, 0.95) | |
| Maternal race (Black) | - | - | - | −0.68 (−1.42, 0.06) | −0.71 (−1.17, −0.25) | |
| Systolic blood pressure at enrollment | - | - | - | −0.35 (−0.68, −0.03) | - |
Table 4b.
Standardized Logistic Regression Coefficients Expressed as Posterior Mean and 95% Credible Intervals
| Predictor | Low Birth Weight (<2500g) | Preterm birth (<37wks) | Gestational diabetes | Pre-eclampsia | Neonatal ICU admission | Spontaneous labor |
|---|---|---|---|---|---|---|
| Total DHA Supplement per day | −0.38 (−0.72, −0.05) | - | 0.2 (−0.01, 0.41) | - | −0.32 (−0.6, −0.07) | - |
| Maternal RBC-PL DHA level at enrollment | - | −0.4 (−0.68, −0.12) | - | - | −0.62 (−0.91, −0.34) | - |
| Maternal age at enrollment (years) | - | - | 0.35 (0.13, 0.58) | - | - | - |
| Maternal education (Bachelor's degree or higher) | - | - | - | - | - | - |
| BMI at enrollment | −0.28 (−0.6, 0.03) | - | - | - | - | −0.19 (−0.39, 0) |
| Diastolic blood pressure at enrollment | - | - | - | - | - | - |
| iron status / hemoglobin at mid-pregnancy | - | - | - | - | - | - |
| cervical length between 18–22 weeks gestation | - | - | - | - | - | - |
| Fructose (g/day) | 0.34 (0.16, 0.52) | 0.2 (−0.04, 0.41) | - | - | - | - |
| PFA 20:4/Arachidonic (mg/day) | - | - | - | - | - | - |
| Total vitamin A activity/Retinol Equivalents (mcg/day) | - | - | - | - | - | - |
| Infant sex (Male) | - | - | 0.36 (−0.06, 0.79) | - | - | - |
| Gestational weight gain | −0.52 (−0.83, −0.23) | −0.26 (−0.49, −0.04) | −0.51 (−0.74, −0.29) | - | - | - |
| Number of preterm births | 0.18 (−0.02, 0.37) | 0.27 (0.1, 0.43) | - | - | - | - |
| Highest systolic blood pressure during pregnancy | 0.63 (0.39, 0.86) | 0.44 (0.25, 0.64) | - | 1.04 (0.79, 1.31) | 0.6 (0.4, 0.8) | −0.31 (−0.56, −0.08) |
| Infant APGAR scores at 1 minute of life | - | - | - | - | - | - |
| Infant APGAR scores at 5 minutes of life | −0.24 (−0.43, −0.03) | −0.45 (−0.7, −0.21) | - | - | −0.64 (−0.92, −0.38) | - |
| Gestational diabetes (yes) | - | - | 2.02 (1.44, 2.62) | 1.09 (0.19, 1.94) | - | - |
| Meconium (yes) | −1.67 (−3.56, −0.28) | −1.19 (−2.32, −0.23) | −1.12 (−2.13, −0.25) | - | - | - |
| Smoking status 6 months prior to pregnancy (yes) | - | - | - | - | - | −0.7 (−1.27, −0.17) |
| Gestational age at enrollment (weeks) | - | - | - | - | - | −0.13 (−0.28, 0.02) |
| Estimated blood loss at delivery (mL) | - | - | - | - | - | −0.39 (−0.6, −0.19) |
Figure 1.
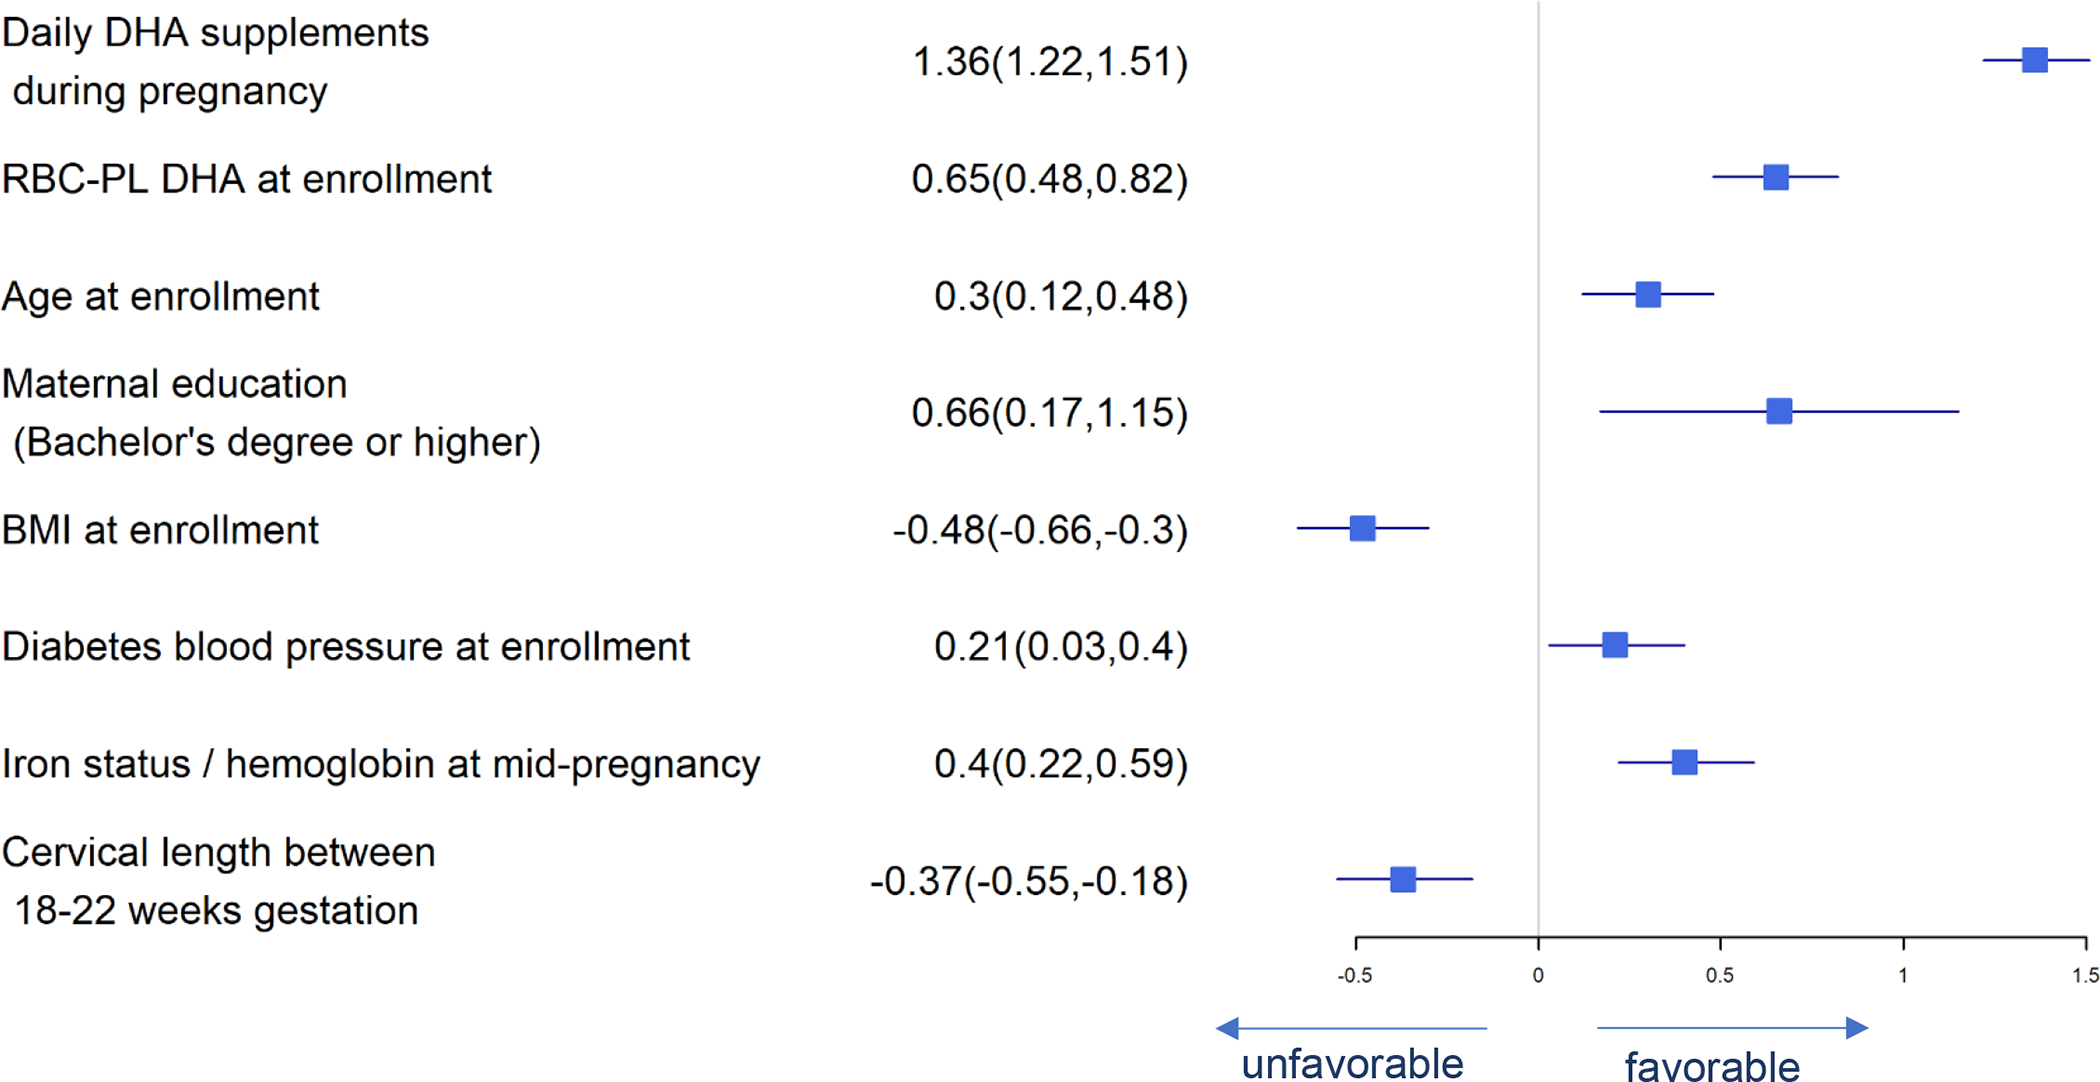
Forest Plot of Significant Predictors for Maternal RBC-PL DHA at Delivery
Figure 11.

Forest Plot of Significant Predictors for Spontaneous Labor
Figure 2.
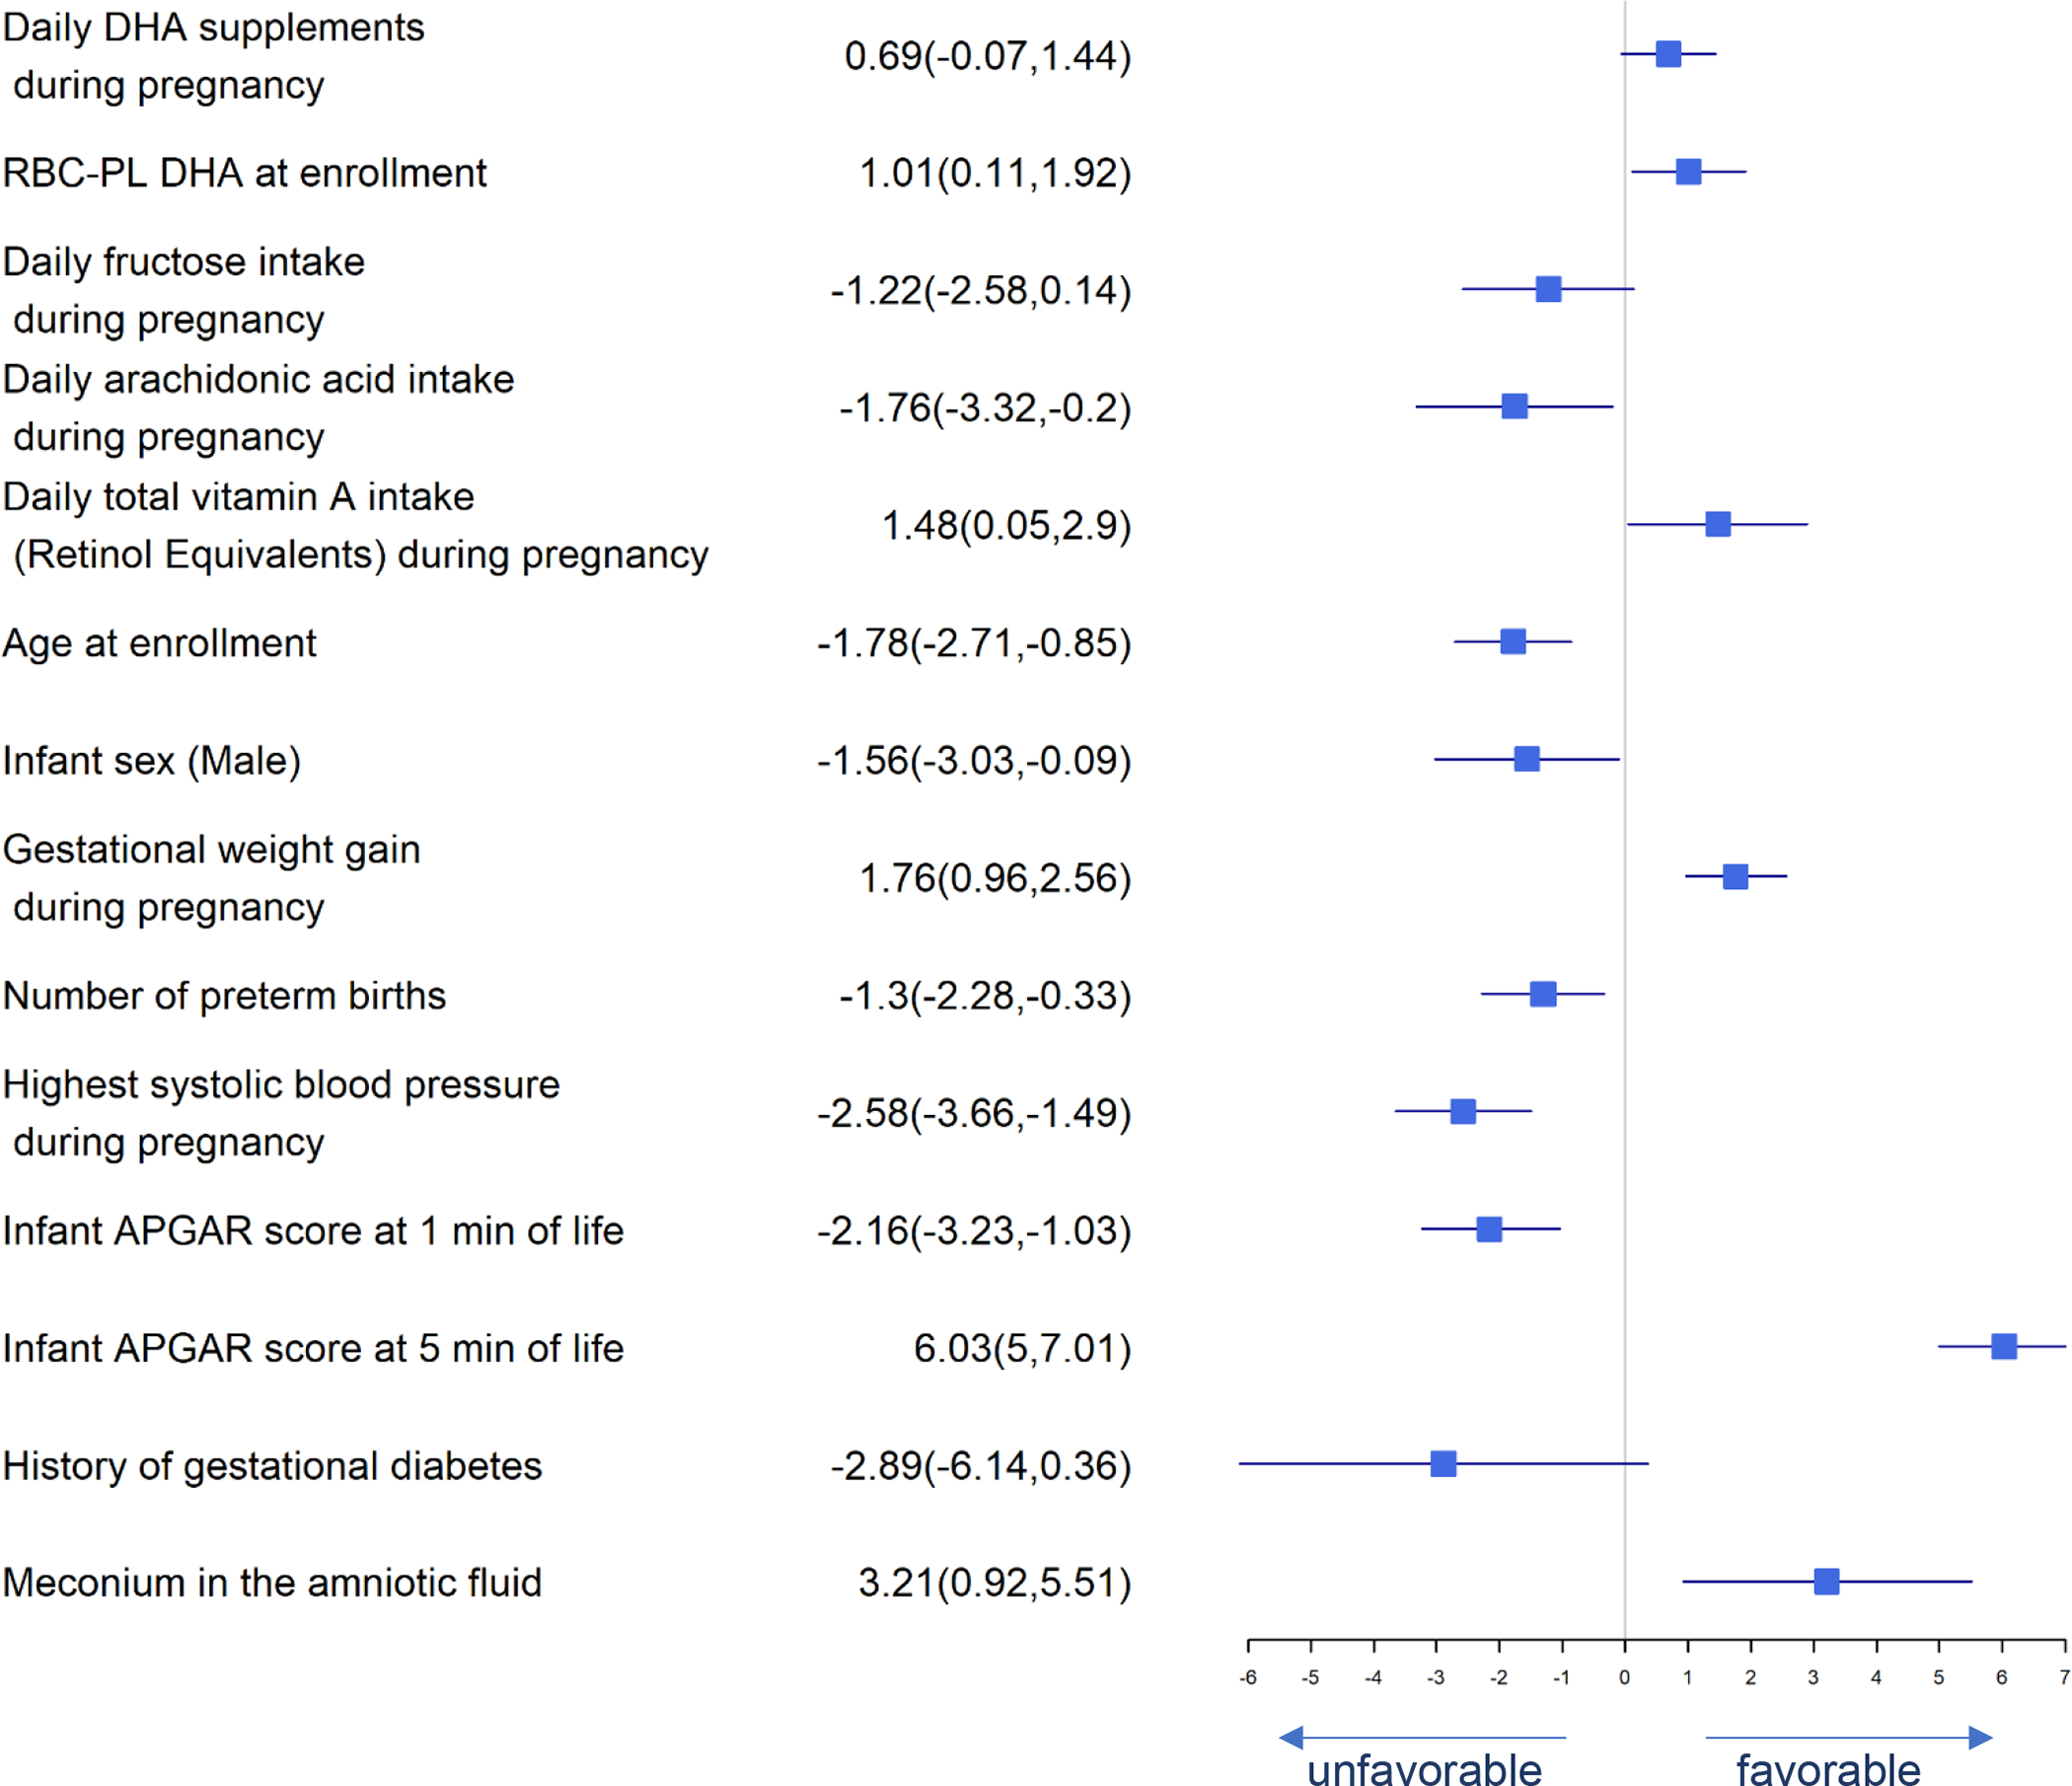
Forest Plot of Significant Predictors for Gestational Age
Figure 3.
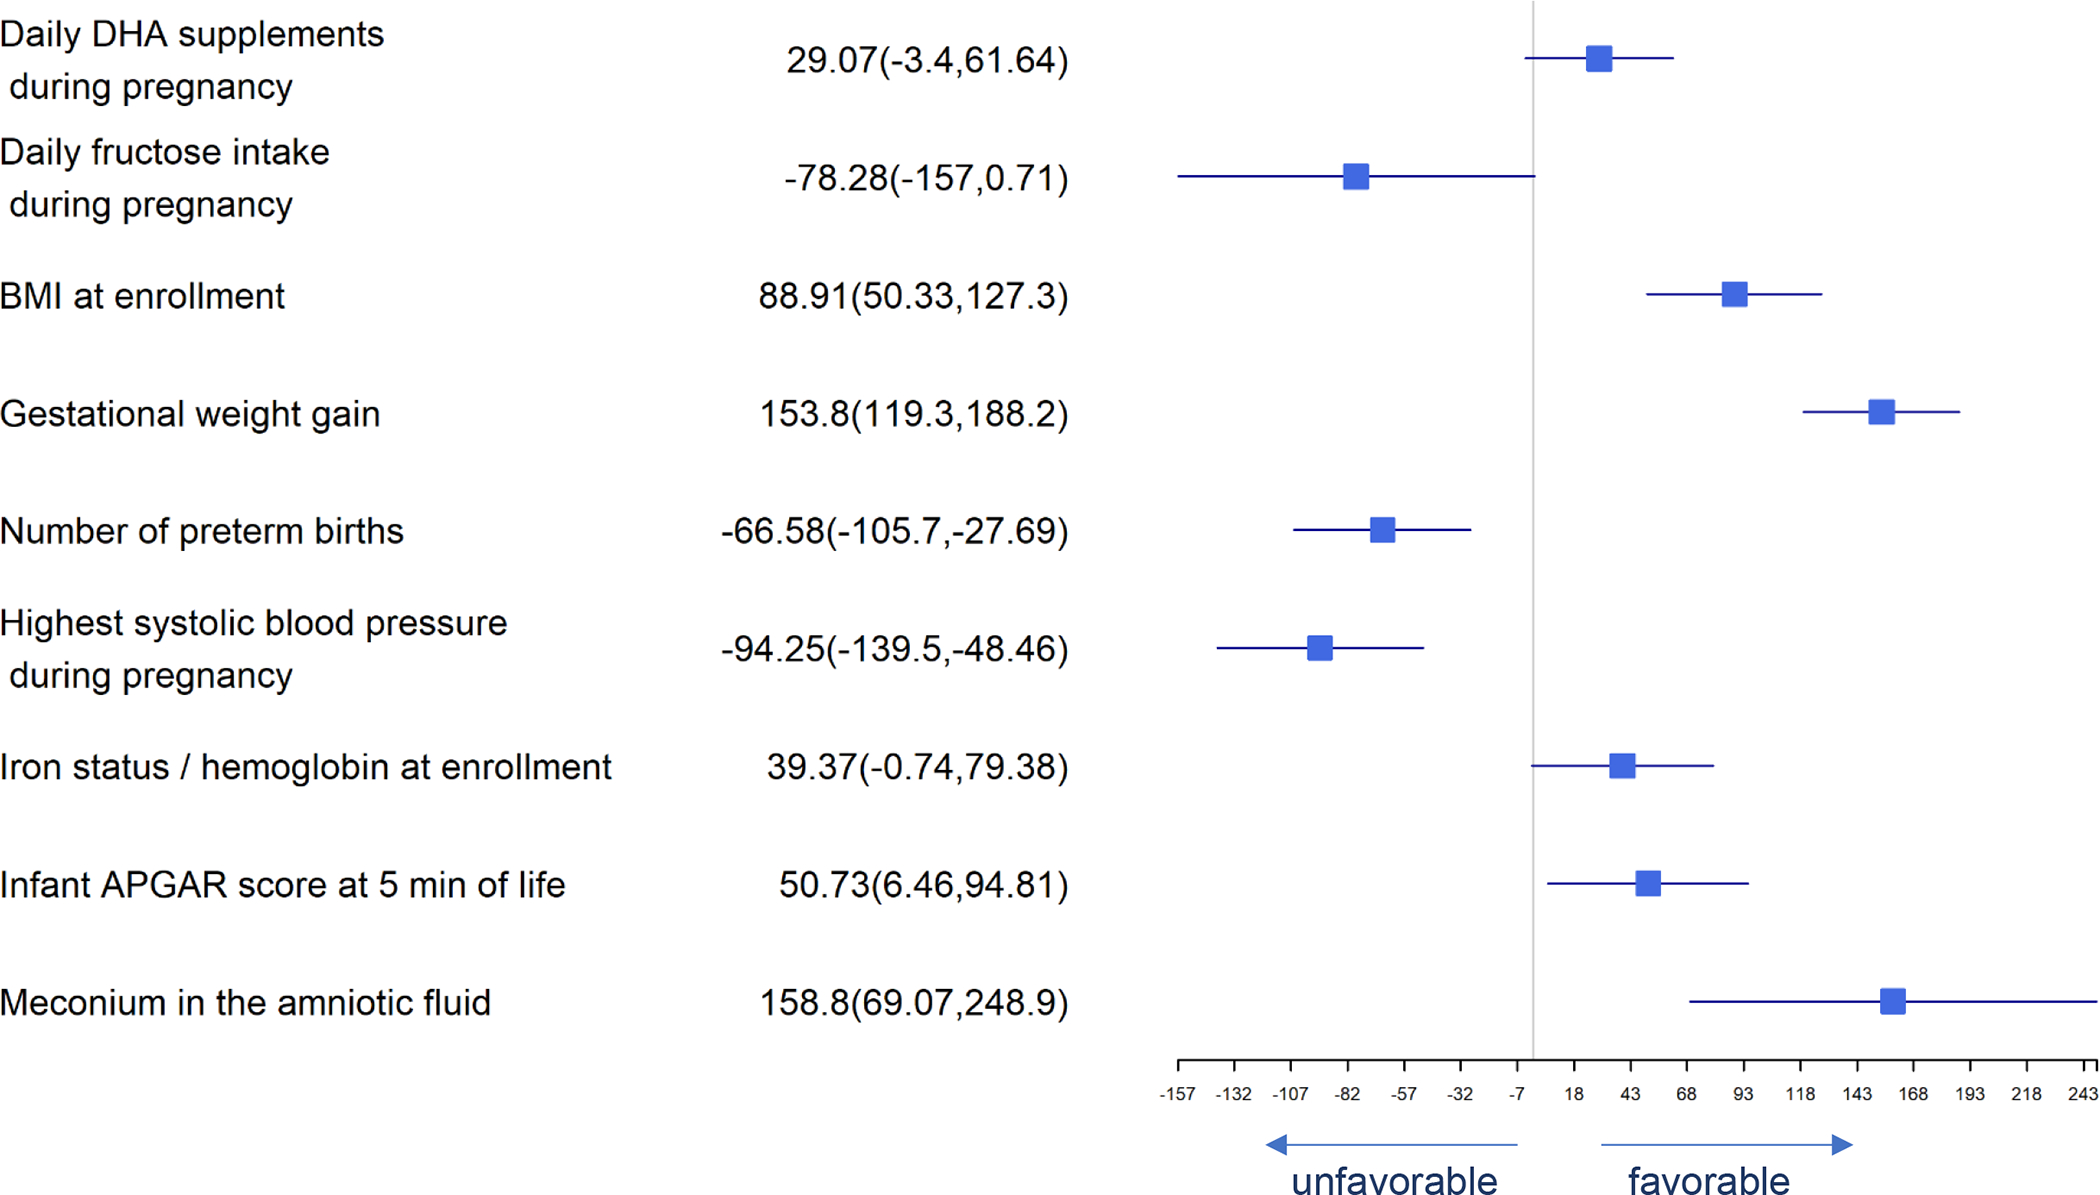
Forest Plot of Significant Predictors for Birth Weight
Figure 6.
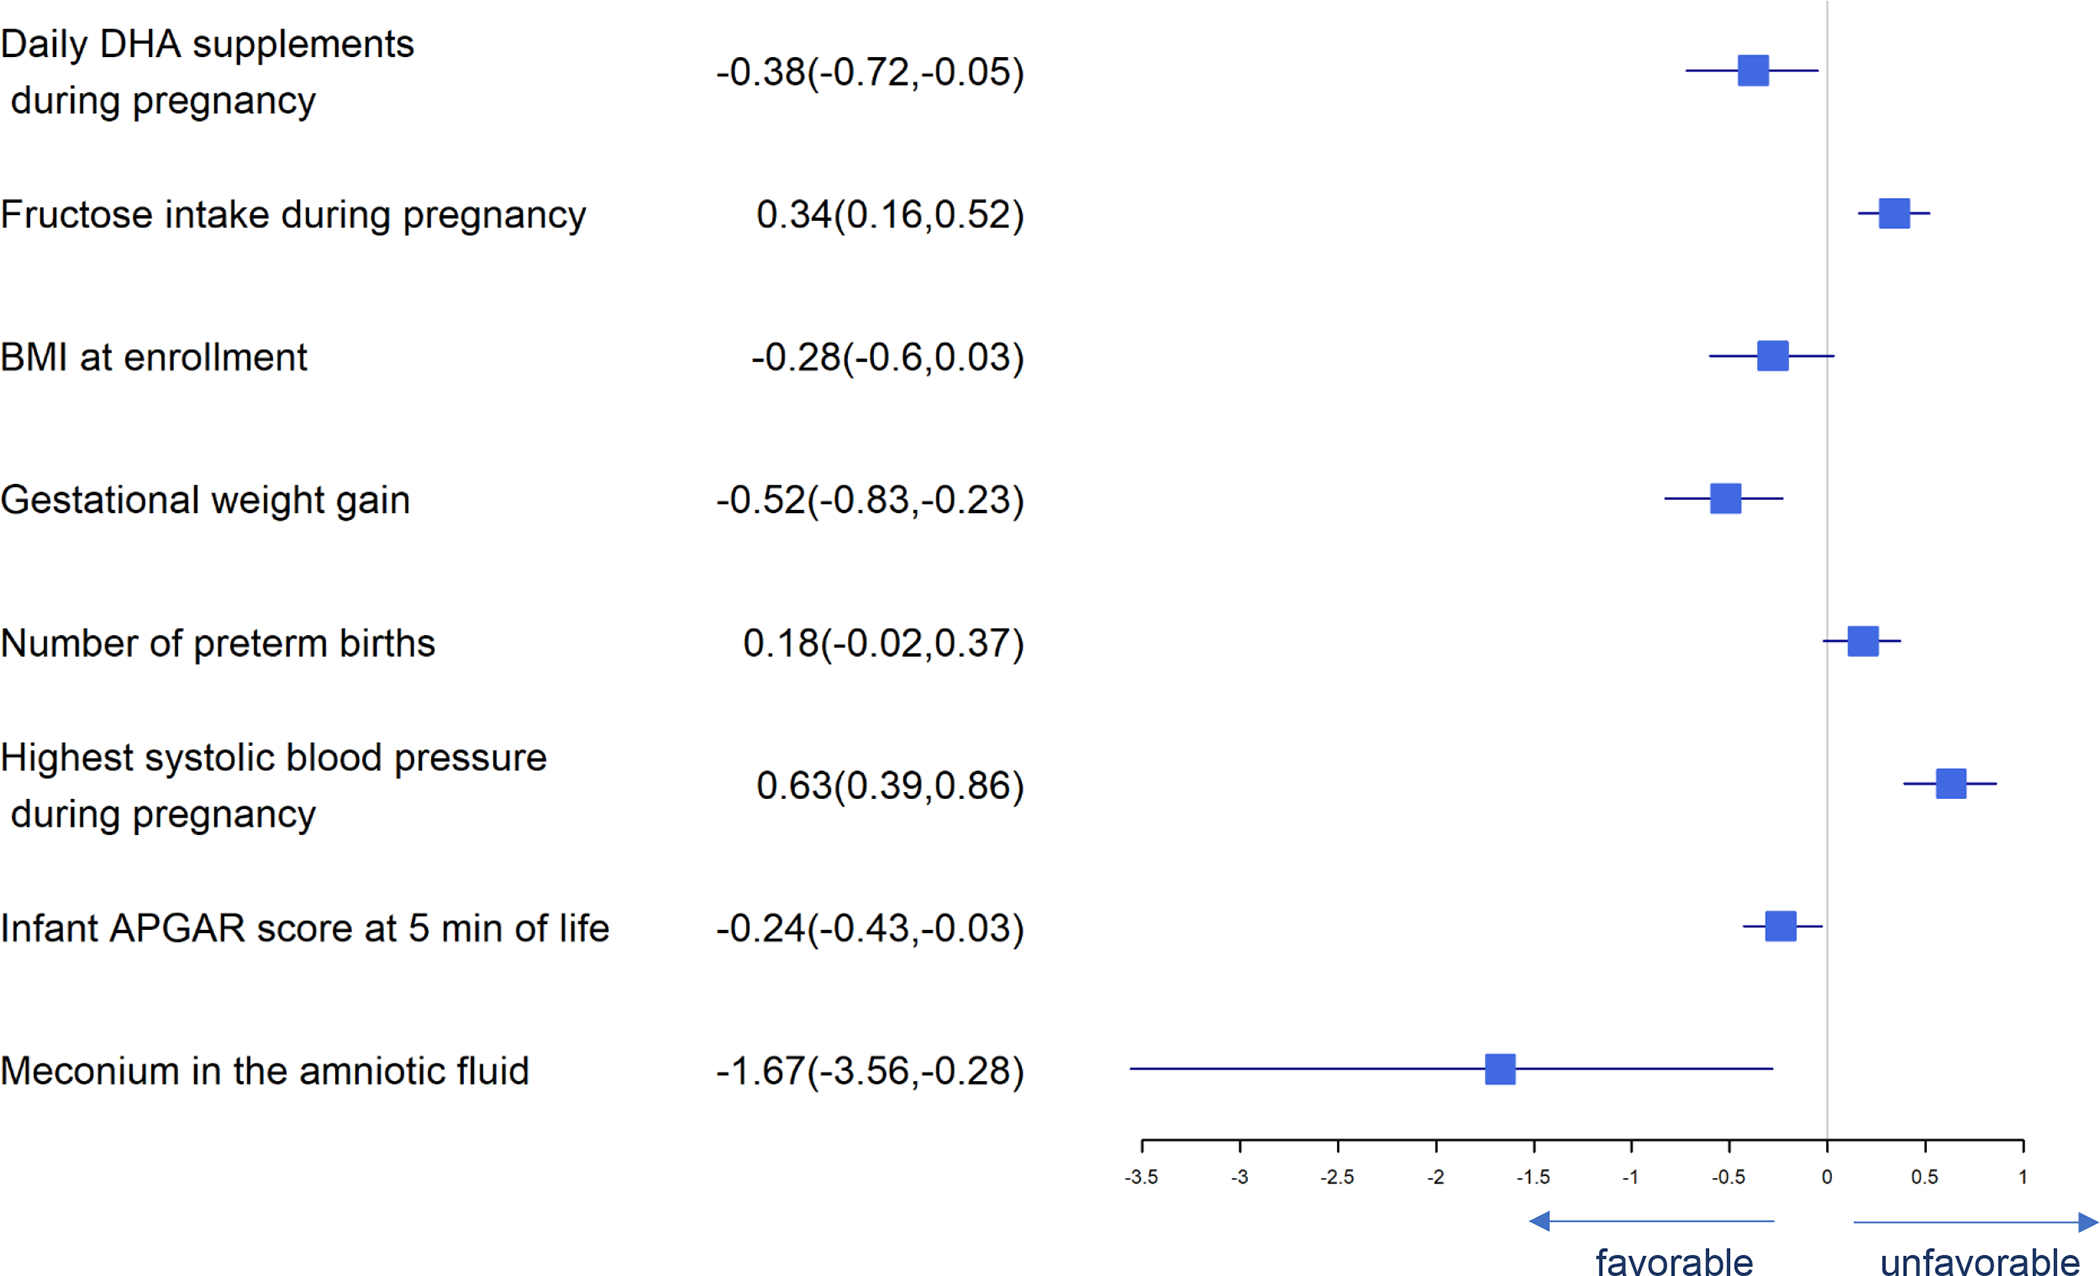
Forest Plot of Significant Predictors for Low Birth Weight (<2500 g)
Figure 7.
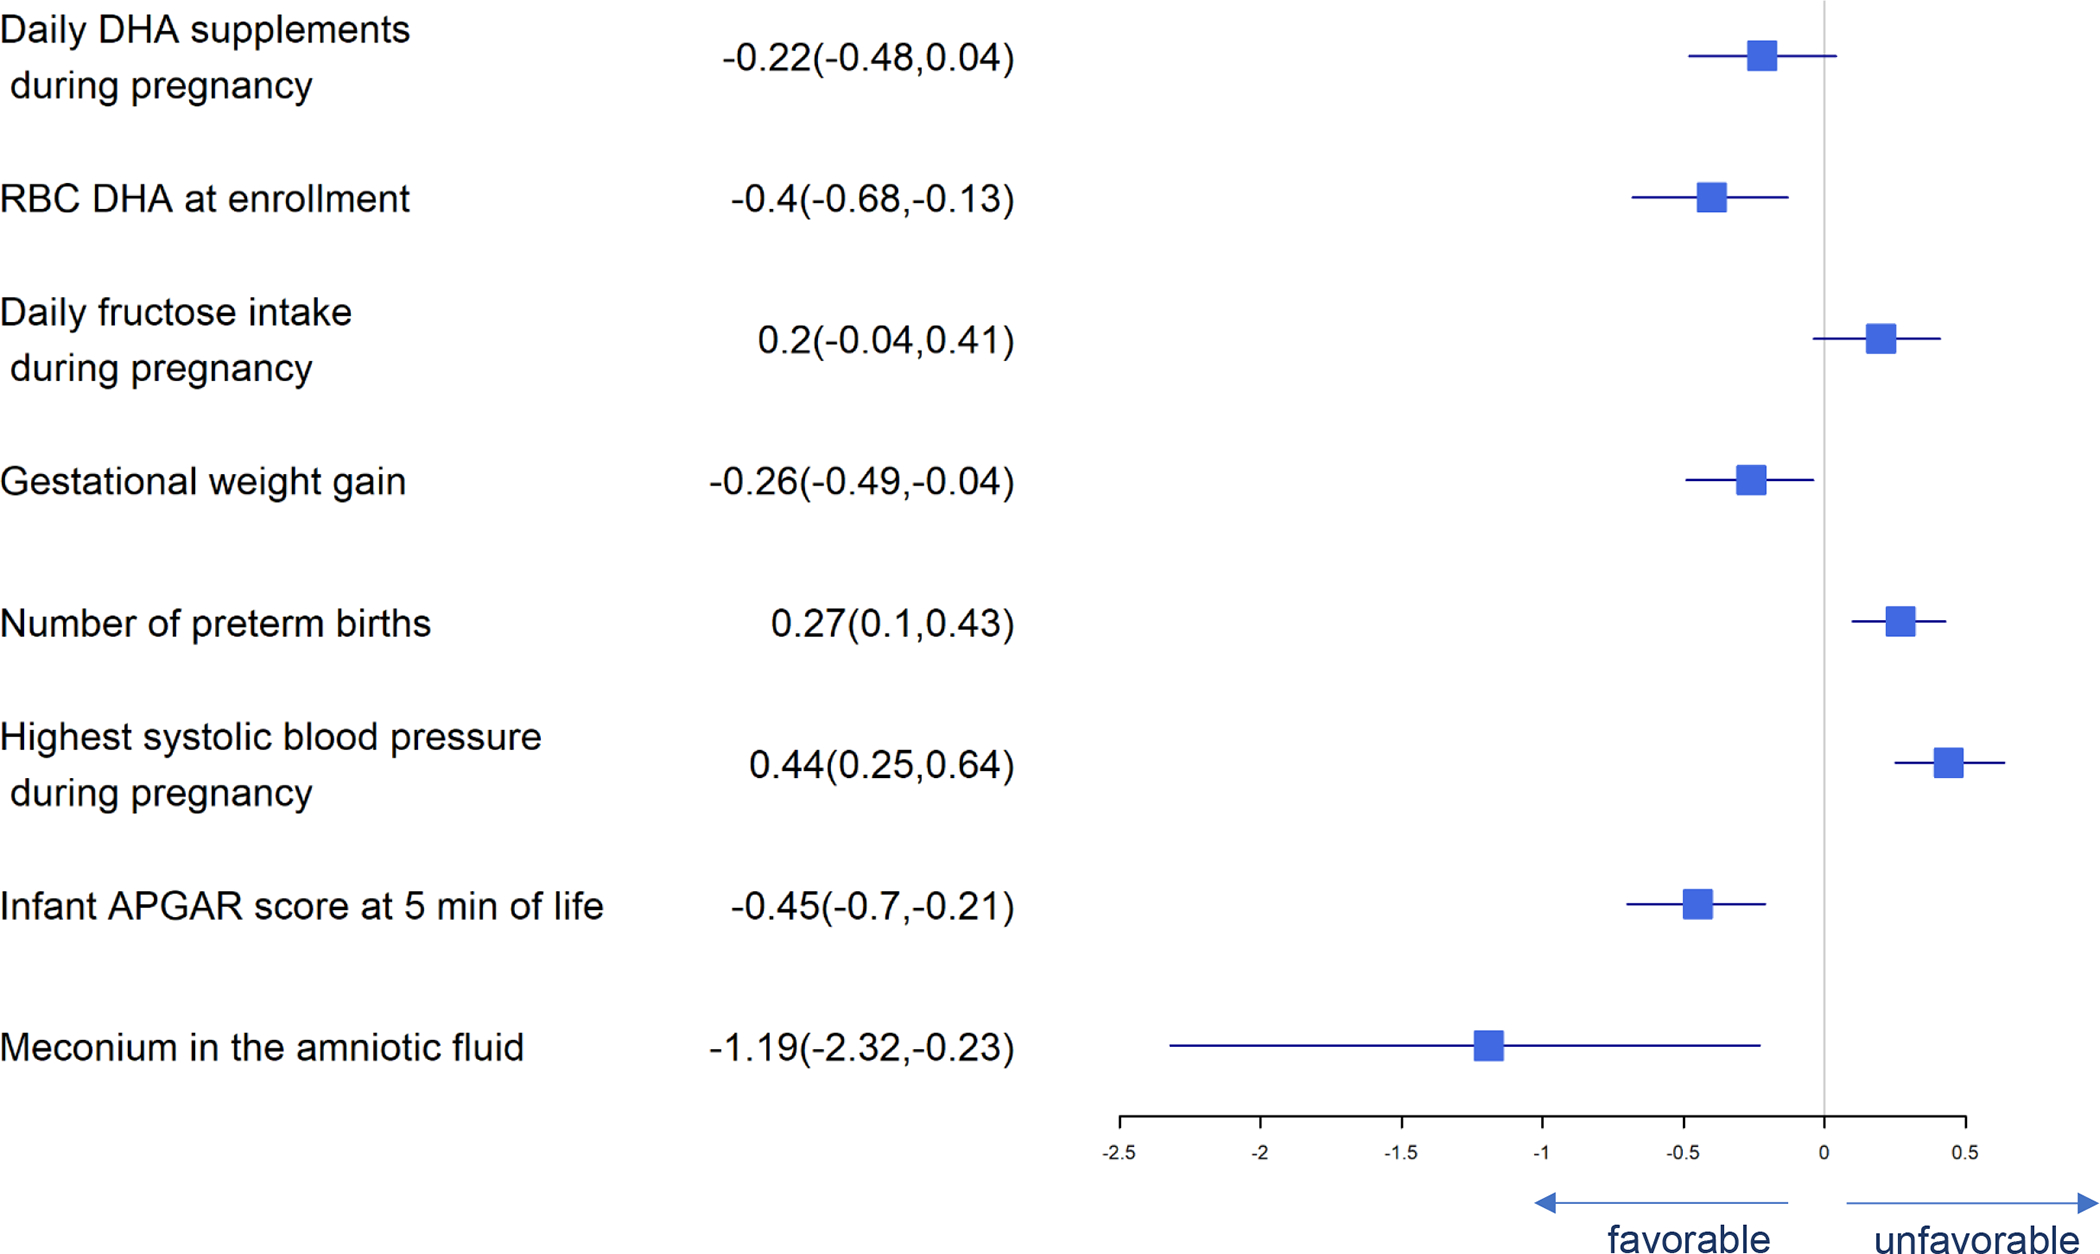
Forest Plot of Significant Predictors for Preterm Birth (< 37 weeks)
Figure 8.
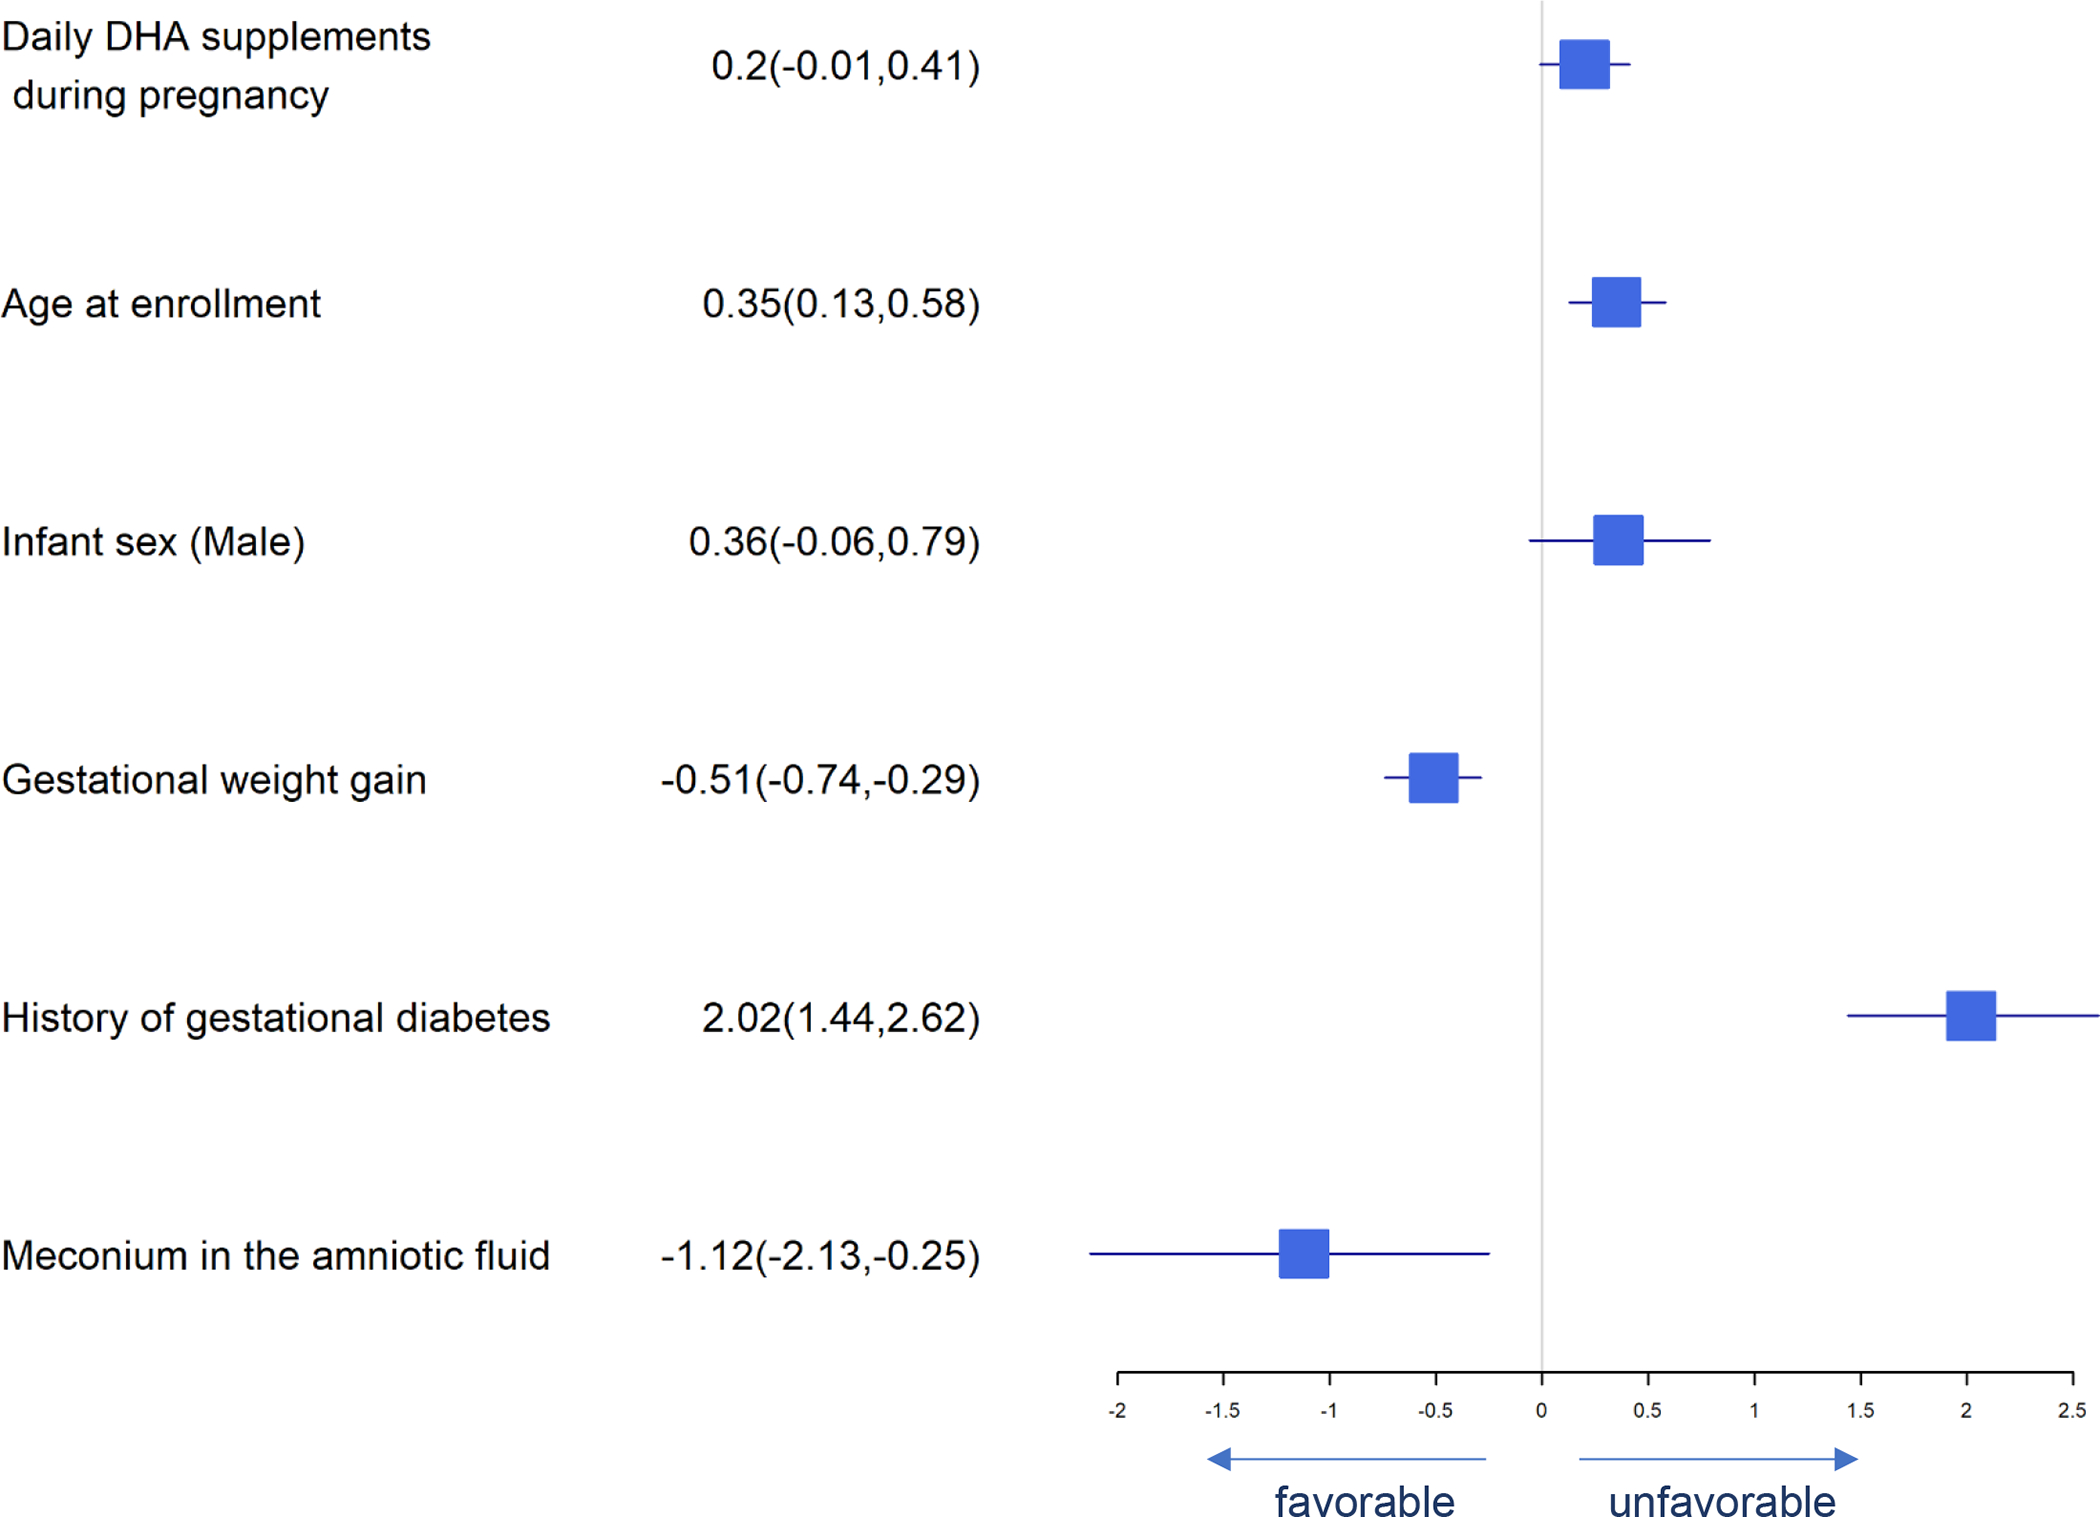
Forest Plot of Significant Predictors for Gestational Diabetes
Figure 10.
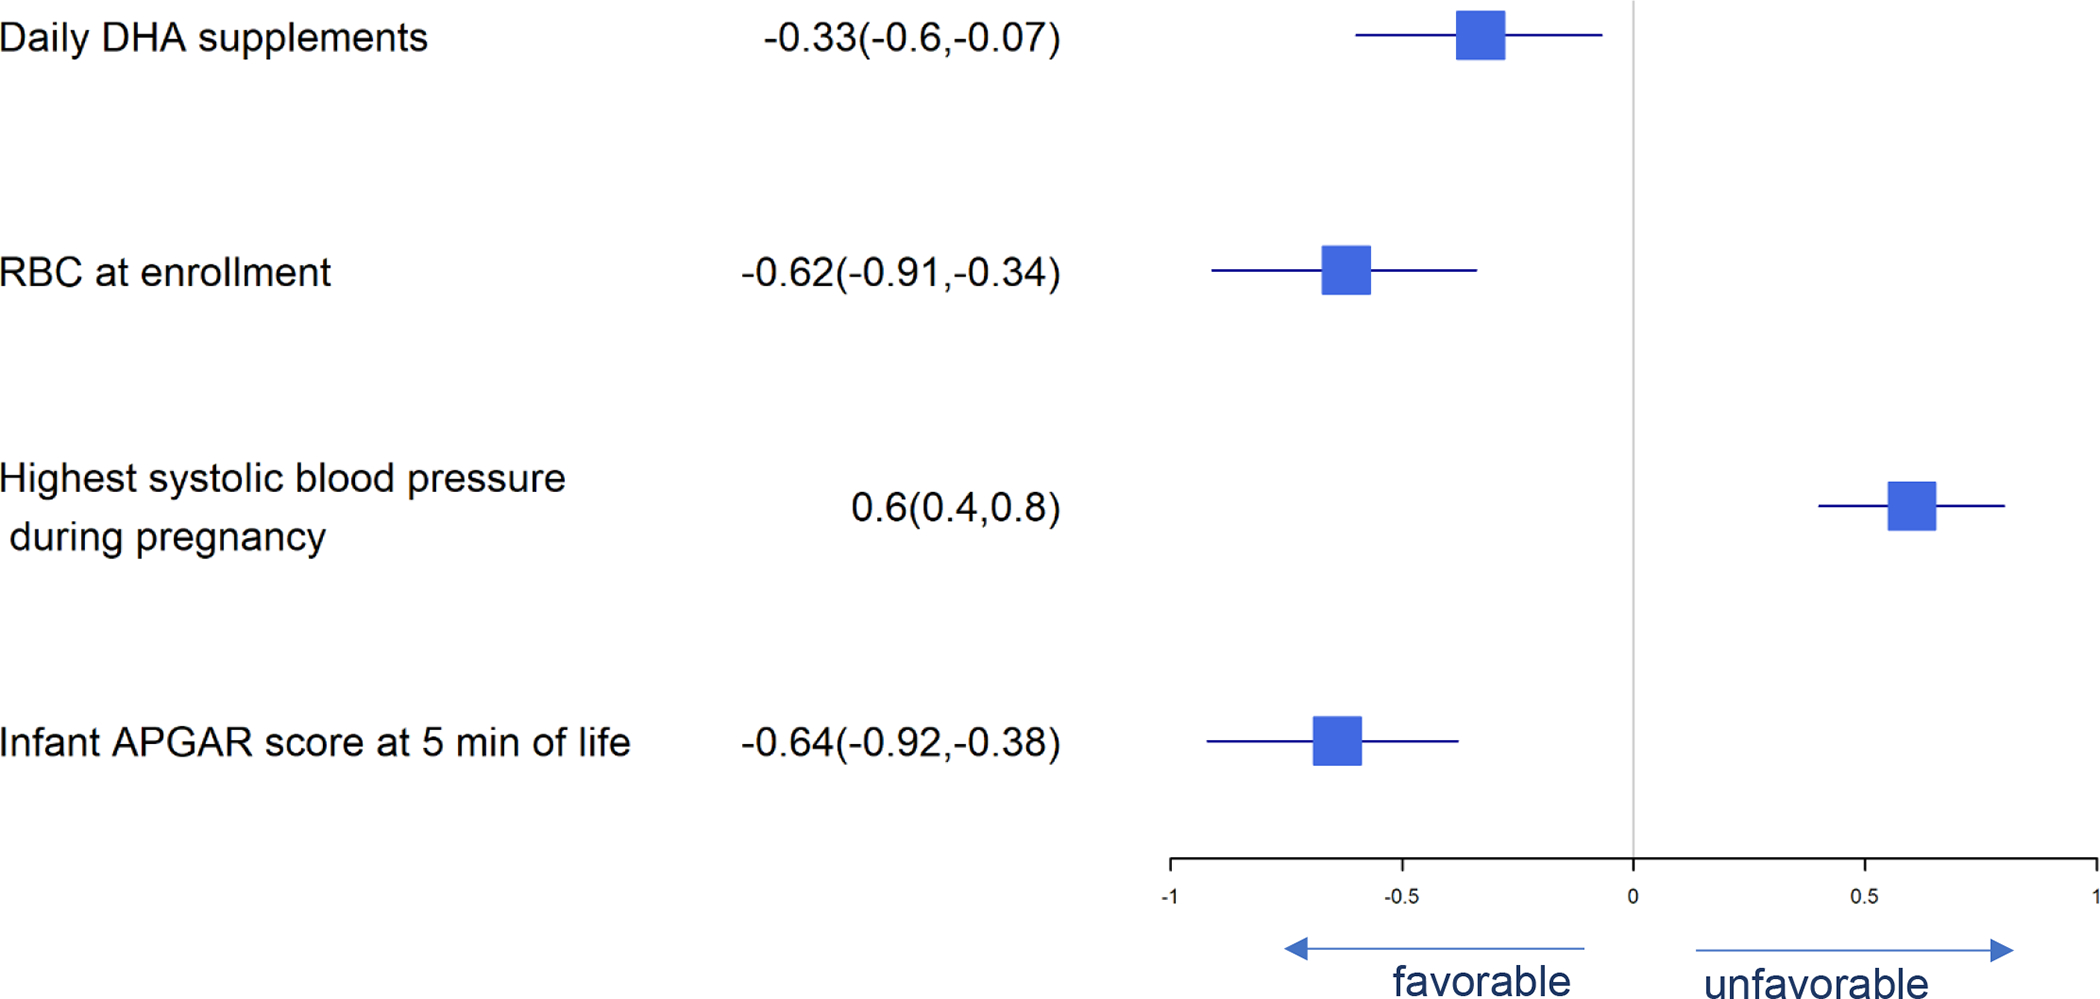
Forest Plot of Significant Predictors for Neonatal ICU Admission
As shown in Figure 1, average daily DHA supplement intake is the most important predictor of maternal-PL DHA at delivery: every standard deviation increase in daily DHA supplement intake during pregnancy results in 1.36 standard deviation increase in maternal RBC-PL DHA at delivery and there is a 95% chance that the maternal RBC-PL DHA at delivery increases by 1.22 to 1.51 with one additional standard deviation increase of the daily consumption of DHA supplement when controlled for confounders. Some predictors including maternal RBC-PL DHA at baseline, maternal age, maternal educational level equivalent to or higher than a bachelor’s degree, diabetes, blood pressure, and mid-pregnancy hemoglobin were positively associated with maternal RBC-PL DHA at delivery, while higher BMI at enrollment and cervical length between 18–22 weeks gestation were negatively associated with maternal RBC-PL DHA at delivery.
In Figure 2, daily DHA supplement intake, daily total vitamin A intake (retinol equivalents) during pregnancy, baseline maternal RBC-PL DHA level, gestational weight gain, APGAR score at 5 minutes, and meconium use in amniotic fluid were predictors of longer gestational age, while fructose intake, arachidonic acid intake, maternal age, male infant, number of previous preterm births, highest blood pressure during pregnancy, neonatal APGAR scores at 1 minute of life and previous medical history of gestational diabetes were associated with shorter gestational age.
Significant predictors for birth weight are presented in Figure 3. DHA supplement intake, higher BMI at enrollment, gestational weight gain, iron status at baseline, neonatal APGAR scores at 5 minutes and meconium in amniotic fluid were associated with greater birth weight while daily fructose intake, number of previous preterm births and highest systolic blood pressure in pregnancy were associated with lower birth weight. Many of these same predictors affected birth length and head circumference similarly (Figures 4 and 5). Consistent with our finding that DHA could improve neonatal birth weight measured on a continuous scale, daily consumption of supplemental DHA during pregnancy was also found to be associated with lowering the risk of LBW (<2500 g). Higher BMI at enrollment, gestational weight gain, infant APGAR scores at 5 minutes, and meconium in the amniotic fluid present were independently associated with lower log odds of birth weight <2500 g while the number of prior preterm births, highest systolic blood pressure during pregnancy and daily fructose consumption were associated with higher log odds of birth weight <2500 (Figure 6).
Figure 4.
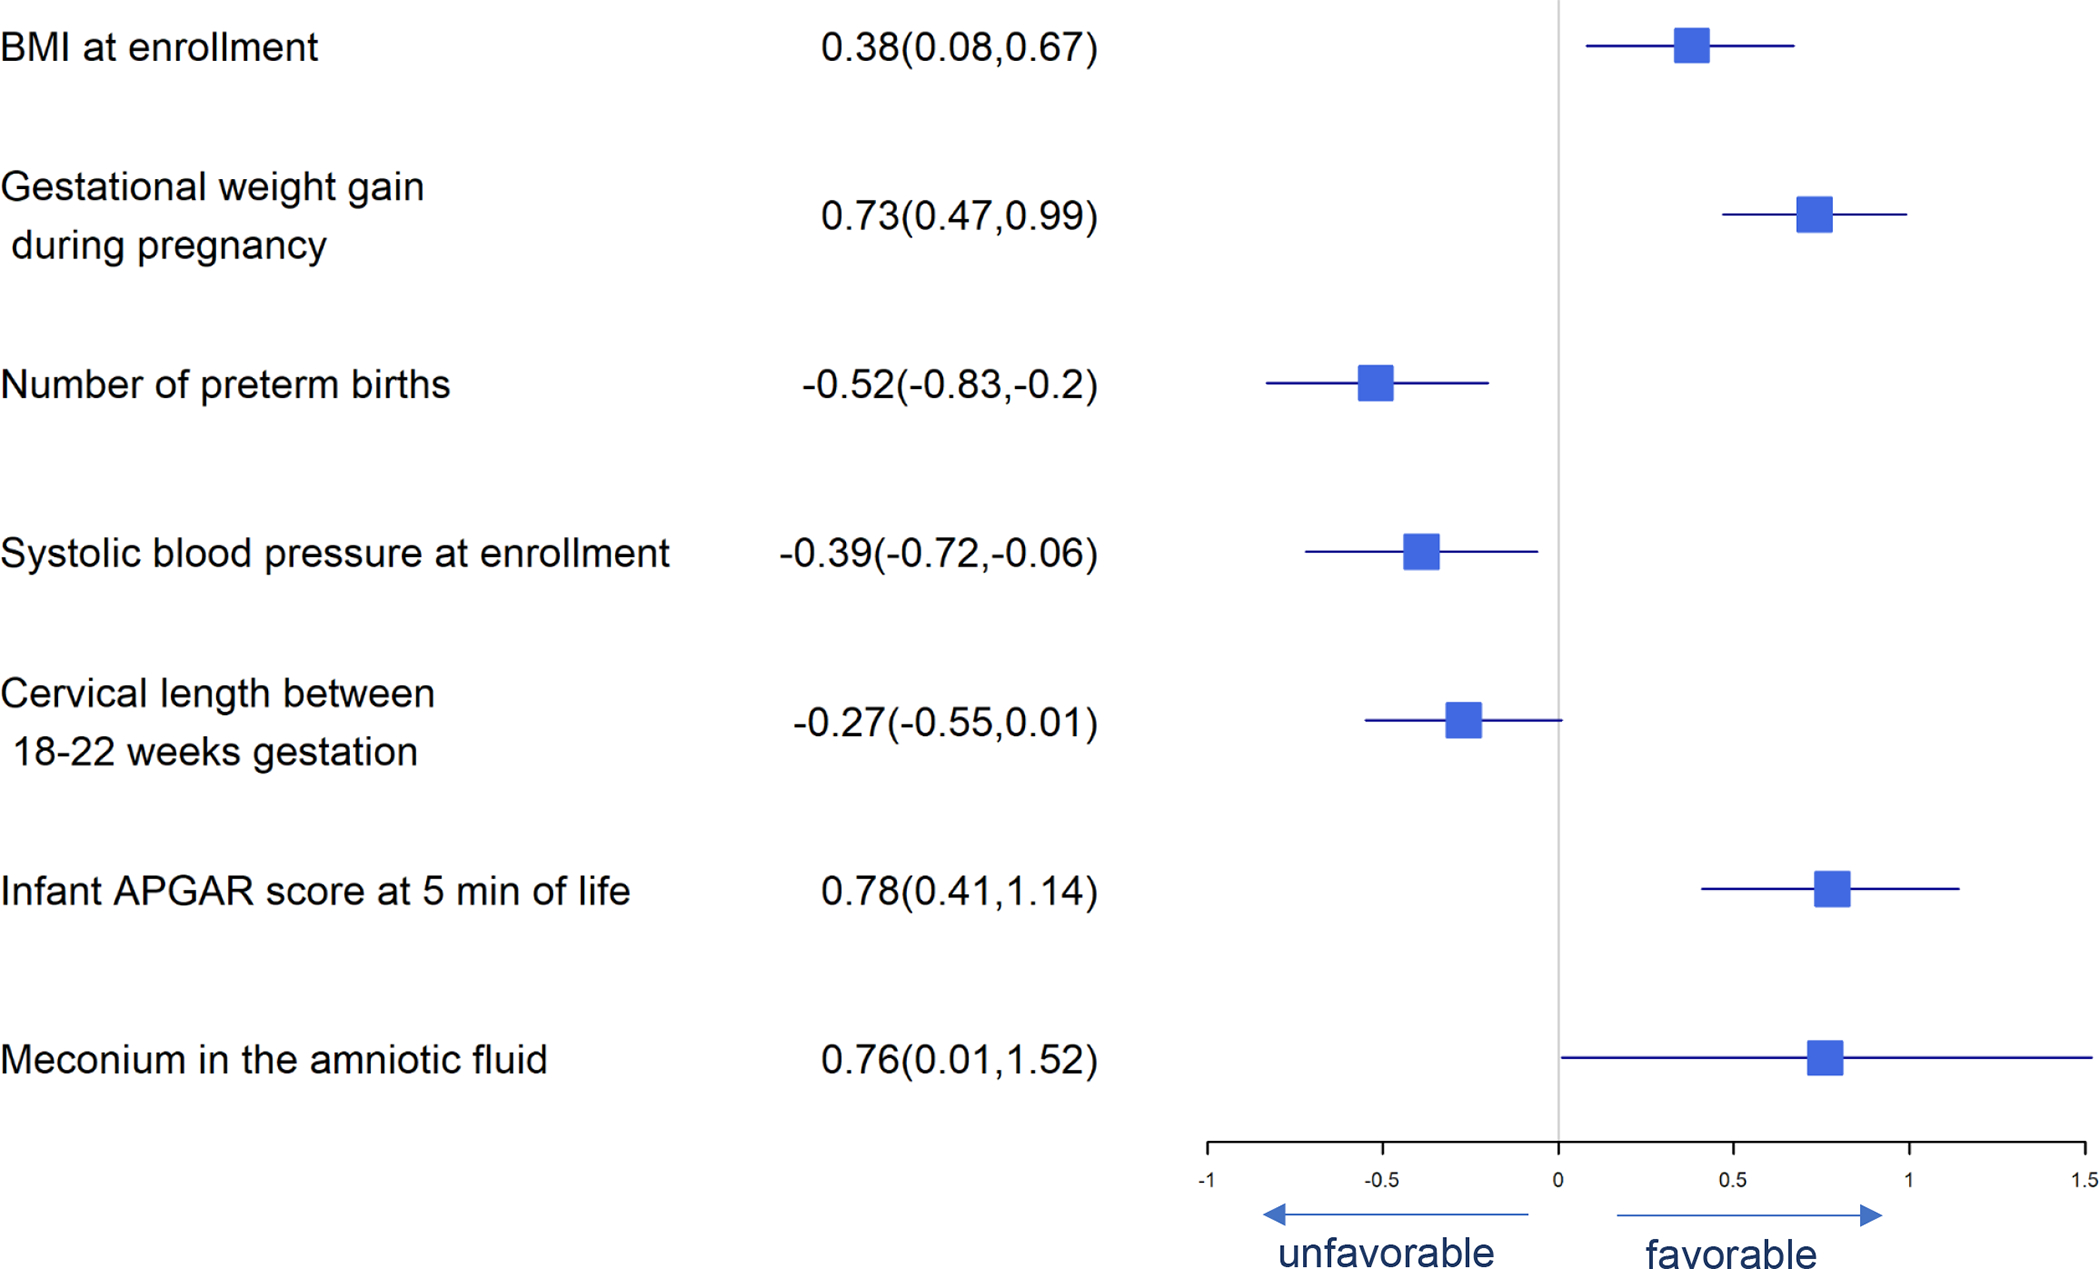
Forest Plot of Significant Predictors for Birth Length
Figure 5.
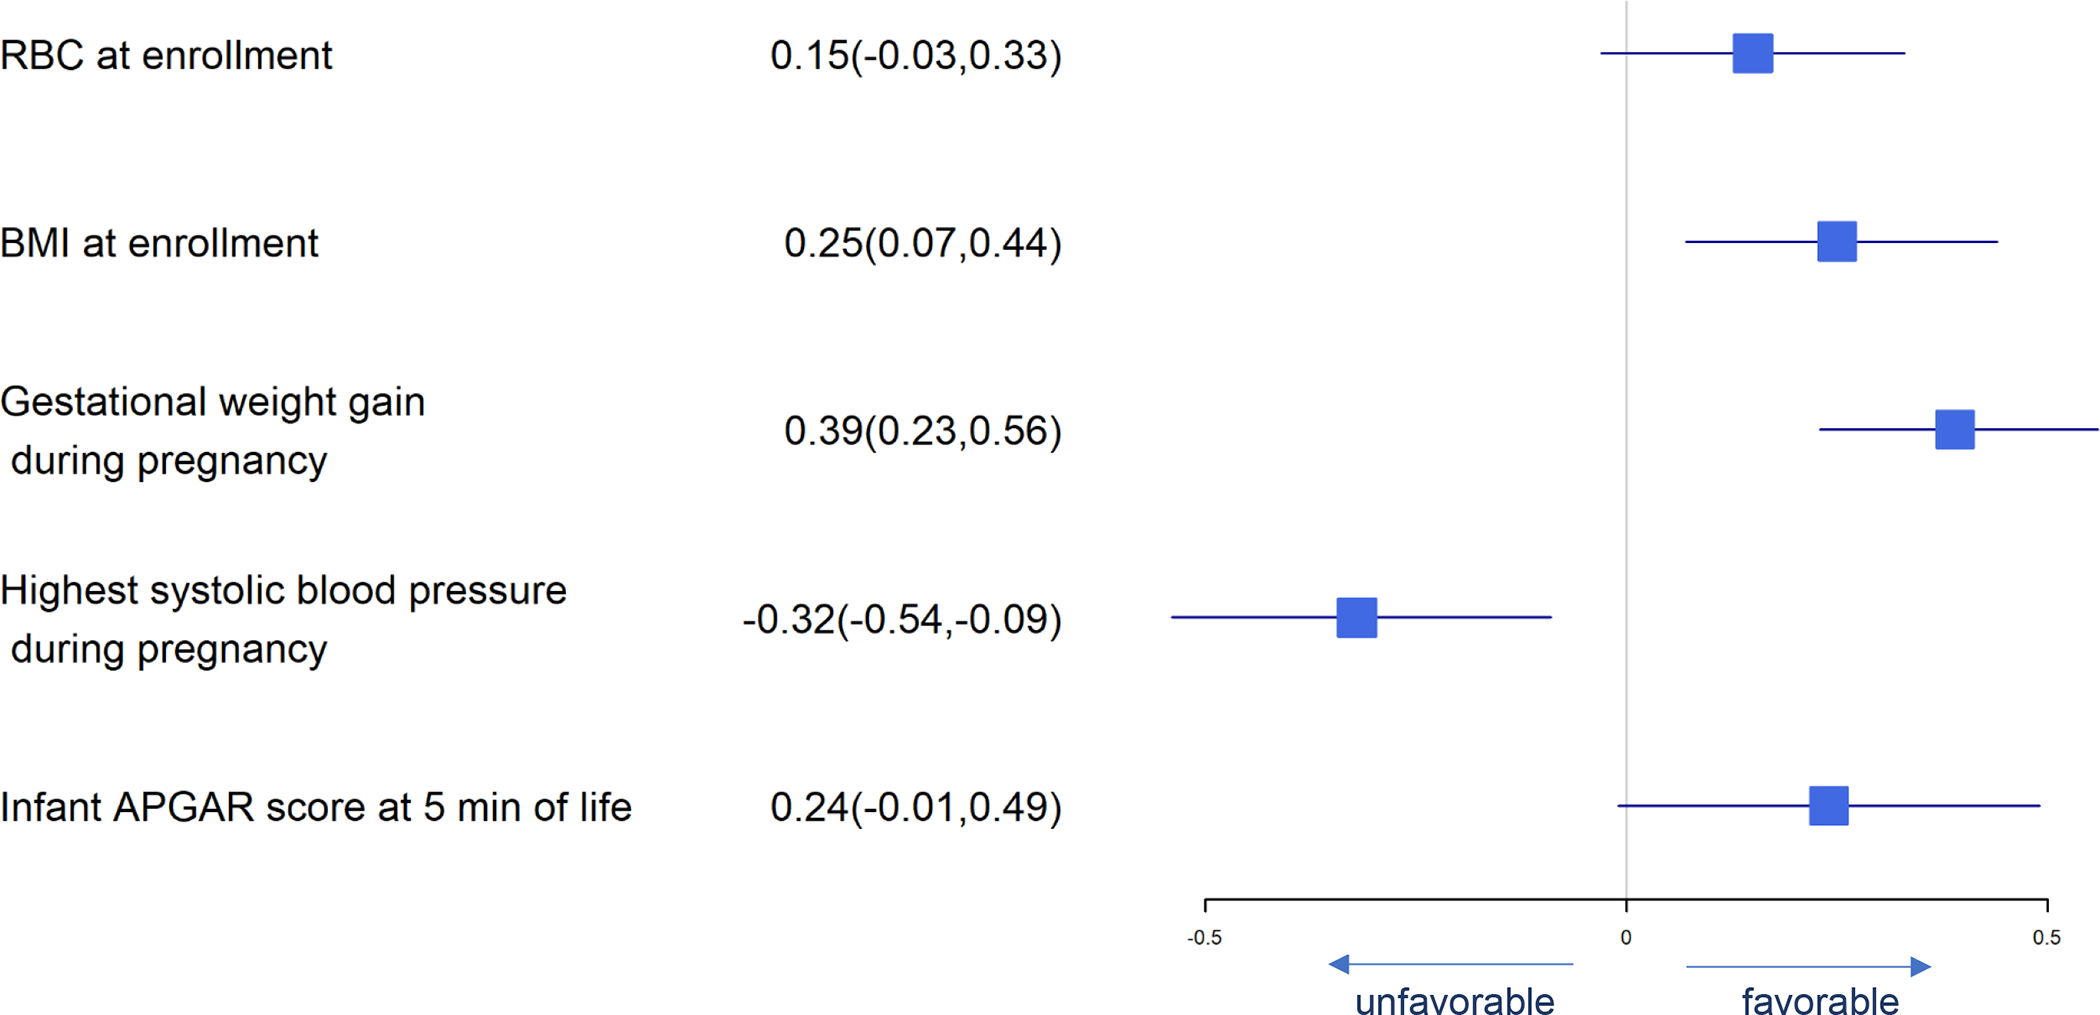
Forest Plot of Significant Predictors for Birth Head Circumference
Predictors of preterm birth (<37 weeks gestation) are presented in Figure 7. Daily DHA supplement intake, RBC-PL DHA at baseline, gestational weight gain, infant APGAR score at 5 minutes, and meconium in the amniotic fluid present were independently associated with lower risk of preterm birth while fructose intake, number of previous preterm births and highest systolic blood pressure were independently associated with higher risk of preterm birth.
Significant predictors for pregnancy-associated complications are presented in Figures 8–10. Predictors of gestational diabetes were daily DHA supplement intake, age at enrollment, male fetus and history of gestational diabetes while gestational weight gain and meconium predicted less gestational diabetes (Figure 8). Pre-eclampsia was predicted by highest systolic blood pressure and history of gestational diabetes (Figure 9). Infant admission to the NICU was predicted by highest maternal systolic blood pressure while daily DHA supplement intake, baseline RBC-PL-DHA and higher 5 min Apgar predicted lower likelihood of NICU admission (Figure 10).
Figure 9.

Forest Plot of Significant Predictors for Pre-eclampsia
We examined labor type (spontaneous vs. other). Higher maternal BMI at enrollment, higher maximum systolic blood pressure during pregnancy, smoking 6 months prior to pregnancy, older gestational age at enrollment and higher blood loss at delivery predicted lower chances of having a spontaneous labor prior to birth (Figure 11).
Maternal education of a bachelor’s degree or higher was associated with lower the risk of gestational diabetes, pre-eclampsia, and NICU admission. A history of gestational diabetes was associated with increased risk of both gestational diabetes and pre-eclampsia.
DISCUSSION
DHA RBC-PL DHA (DHA status) at baseline and daily DHA supplement intake after enrollment independently favored higher RBC-PL-DHA at delivery, longer gestation, less preterm birth, and reduced likelihood of NICU admission. DHA status at baseline also predicted larger head circumference, while daily DHA supplement intake predicted higher birth weight, lower risk of low birth weight (<2500g), and increased risk of gestational diabetes. Age, years of formal education and higher mid-pregnancy iron status were associated with higher postpartum RBC-PL DHA, which is an indicator of adherence but that could also reflect better nutrition and health overall.
The agnostic analysis found several novel associations between maternal nutrient intake including negative associations between fructose and arachidonic acid intake and a positive association of vitamin A intake with gestation duration. Fructose intake was also a predictor of lower birth weight and preterm birth. While these relationships with fructose intake have not been reported previously, a study published in 2011 linked maternal fructose intake to lower placental weight when the fetus was female (27). The protective effect of total vitamin A on gestational age, is consistent with the finding of Salcedo-Bellido et al (28).
The agnostic analysis also found generally well-known associations including an association between higher APGAR score at 5 minutes and lower odds of preterm birth, NICU admission, and lower birth weight; and an association between preterm birth and history of low birth weight, preterm birth, pre-eclampsia, and NICU admission. The association between DHA intake and preterm birth was first identified in the 1980s by Olsen and collaborators (29, 30), who observed longer gestation age, higher birth weight, and lower preterm birth (<37 weeks’ gestation) in the fish-eating community of the Faroe Islands compared to Denmark. A 2018 Cochrane Review found strong evidence DHA and eicosapentaenoic acid, another omega-3 fatty acid found in seafood, reduced birth by <34 weeks gestation by 42%, birth <37 weeks gestation by 11%, and increased gestation duration overall (29). Strong evidence means no further trials are needed to establish causality (31).
Long-chain omega-3 fatty acids such as DHA and EPA have been suggested to have the potential to reduce gestational diabetes (32) and pre-eclampsia (33). The increased risk of gestational diabetes with DHA supplementation in this study is, therefore, surprising. As we have reported, 9.8% (48/489) of women in the 200 mg/day DHA and 12.6% (68/540) in the 1000 mg/day DHA group were diagnosed with gestational diabetes (3). Overweight may also have contributed to the high incidence of gestational diabetes, although the mean BMI did not differ between DHA assignment groups (28.2 and 28.3, respectively) (3). The higher risk of gestational diabetes could be related to the fact that DHA decreased preterm birth and increased gestation duration which allowed more time for gestational diabetes to emerge. Latino participants have a high incidence of gestational diabetes (34) and the proportion of Latinas in the 200 mg/d was lower (20.8%, 109/524) than in the 1000 mg/d group (23.6%, 136/576) (3). While an increased incidence of gestational diabetes merits continued evaluation, a 2018 Cochrane review that included 12 randomized clinical trials found no effect of omega-3 supplementation on gestational diabetes (31). Moreover, assignment to the higher DHA dose (1000 mg compared to 200 mg) reduced the overall incidence of serious adverse events and decreased preterm birth, including birth before 34 weeks gestation, and NICU admissions, which are the most expensive and consequential to short and long term health (3).
Women with higher systolic blood pressure are known to be at risk for a variety of adverse maternal and fetal outcomes (35). Consistent with this, we found the highest systolic blood pressure recorded during pregnancy for each participant was a predictor risk for lower birth weight, length and head circumference, birth weight <2500 g, birth <37 weeks gestation, pre-eclampsia, and newborn NICU admission.
Observational studies have looked for relationships among maternal factors and adverse pregnancy outcomes, particularly birth <37 weeks gestation. A 2012 March of Dimes report (36) identified multiple associations with preterm birth, including a history of preterm birth and diabetes, underweight and obesity, infectious diseases, tobacco use, heavy alcohol use, and being under 17 or over 40 years of age (36). Better nutrition, environmental and occupational health, and education for women are related to better pregnancy outcomes (36). Another study conducted in Italy associated birth <37 weeks with higher maternal BMI, employment and abortion history and cesarean section (37). Our results confirm those of other reports that have evaluated risk of preterm birth in relationship to demographic and socioeconomic factors such as race/ethnicity, low socioeconomic and education status, maternal age > 30 years, and single marital status (38, 39).
While we did not find a direct association between higher BMI and preterm birth, a much larger cohort study of 9,282,486 U.S. mother–infant pairs from births between 2016 and 2018 found an association between maternal pre-pregnancy overweight (BMI 25.0–29.9 kg/m2) and obesity BMI (≥30.0 kg/m2) with higher likelihood of preterm birth and a lower APGAR score at 5 minutes (40).
The Bayesian method used is a strength of our study, because the methods provide a more intuitive interpretation and offer a variety of flexible options for analyzing complex data compared to the frequentist paradigm used for most clinical and non-clinical studies (41, 42). The Bayesian 95% credible interval can be interpreted as the interval containing the true interest parameter with 95% probability (41). The Bayesian framework allowed the inclusion of all participants because missing observations were imputed in an automatic manner, treated as unknown stochastic nodes just like any other parameters in the model for which posterior distributions are calculated (43). To perform Bayesian multiple imputation, prior distributions were assigned to missing observations so the Bayesian model generated values from the posterior predictive distribution for missing data (44). The Bayesian multiple imputation method was applied to both predictor and outcome variables, allowing all participants to be included in the dataset, improving estimation accuracy, reducing estimation bias, and restoring loss (45–47).
A limitation of our study is that the results may not be generalizable to all populations. Our method of estimating DHA intake probably overestimated actual daily DHA intake because not all participants returned their capsule bottles and we had to rely on subjective evidence of capsule intake for some participants.
In conclusion, by using Bayesian methodology on a large and extensively characterized cohort of pregnancies, we confirm a cause-and-effect relationship between DHA intake and gestational age, birth weight and preterm birth rate that is already well demonstrated (29). In addition, we identify several novel associations between gestation duration and intake of fructose, arachidonic acid and vitamin A that could be the target for nutritional modification in future studies. Last, we confirm well-known associations between maternal characteristics and pregnancy outcomes that have not been addressed simultaneously in a single study of pregnancy outcome.
DATA AVAILABILITY
We will share deidentified data from the study including data from individual participants with a signed data access agreement that includes the study principal investigators and is contingent on their approval of the planned use of the data. As the data are entered into an electronic system, a specific request to SEC (scarlson@kumc.edu) or BJG (bgajewski@kumc.edu) would be needed to generate a data output for other investigators. Our study protocol has been published and the protocol update as well as statistical analysis plan are available from SEC or BJG.
Supplementary Material
FUNDING
The trial was funded by the National institutes of Health Eunice Kennedy Shriver Child Health and Human Development (R01HD08292) and the Office of Dietary Supplements. Life’s DHA™-S oil in capsules and placebo capsules were provided by DSM Nutritional Products LLC, Switzerland.
Footnotes
CONFLICT OF INTEREST
CJV, BJG and SEC were the principal investigators for the primary clinical trial. SEC has collaborated with DSM, the company that donated the capsules for the primary clinical trial but has no other conflicts of interest. All other authors have no conflicts of interest. YW conducted the Bayesian analysis as partial fulfillment for her PhD dissertation in the Department of Biostatistics and Data Science. She also wrote the manuscript with the assistance of SEC and BJG.
REFERENCES
- 1.Unterscheider J, O’Donoghue K, Daly S, Geary MP, Kennelly MM, McAuliffe FM, et al. Fetal growth restriction and the risk of perinatal mortality–case studies from the multicentre PORTO study. BMC Pregnancy and Childbirth. 2014;14(1):63. [DOI] [PMC free article] [PubMed] [Google Scholar]
- 2.Carlson SE, Gajewski BJ, Valentine CJ, Rogers LK, Weiner CP, Defranco EA, et al. Assessment of DHA on reducing early preterm birth: the ADORE randomized controlled trial protocol. BMC Pregnancy and Childbirth. 2017;17(1). [DOI] [PMC free article] [PubMed] [Google Scholar]
- 3.Carlson SE, Gajewski BJ, Valentine CJ, Kerling EH, Weiner CP, Cackovic M, et al. Higher dose docosahexaenoic acid supplementation during pregnancy and early preterm birth: A randomised, double-blind, adaptive-design superiority trial. EClinicalMedicine. 2021;36:100905. [DOI] [PMC free article] [PubMed] [Google Scholar]
- 4.Carlson SE, Gajewski BJ, Valentine CJ, Sands SA, Brown AR, Kerling EH, et al. Early and late preterm birth rates in participants adherent to randomly assigned high dose docosahexaenoic acid (DHA) supplementation in pregnancy. Clin Nutr. 2023;42(2):235–43. [DOI] [PMC free article] [PubMed] [Google Scholar]
- 5.National Institutes of Health EaGRP, National Cancer Institute. Diet History Questionnaire 2020. [Google Scholar]
- 6.Program NCIEaGR. Background on Diet History Questionnaire II (DHQ-II) for U.S. & Canada 15 Oct 2020. [Available from: https://epi.grants.cancer.gov/dhq2/about/. [Google Scholar]
- 7.Subar AF, Thompson FE, Kipnis V, Midthune D, Hurwitz P, McNutt S, et al. Comparative validation of the Block, Willett, and National Cancer Institute food frequency questionnaires : the Eating at America’s Table Study. Am J Epidemiol. 2001;154(12):1089–99. [DOI] [PubMed] [Google Scholar]
- 8.Thompson FE, Subar AF, Brown CC, Smith AF, Sharbaugh CO, Jobe JB, et al. Cognitive research enhances accuracy of food frequency questionnaire reports: results of an experimental validation study. Journal of the American Dietetic Association. 2002;102 2:212–25. [DOI] [PubMed] [Google Scholar]
- 9.National Cancer Institute, Epidemiology and Genomics Research Program. DHQ-II Nutrient Database.
- 10.National Cancer Institute, Epidemiology and Genomics Research Program. Diet*Calc Analysis Program 2012. [Version 1.5.0]. [Google Scholar]
- 11.National Cancer Institute, Epidemiology and Genomics Research Program. Diet History Questionnaire II (DHQ II): Diet*Calc Software 2020. [Available from: https://epi.grants.cancer.gov/dhq2/dietcalc/. [Google Scholar]
- 12.National Cancer Institute, Epidemiology and Genomics Research Program. Development of the DHQ II and C-DHQ II Nutrient & Food Group Database 2020. [Available from: https://epi.grants.cancer.gov/dhq2/database/. [Google Scholar]
- 13.Miller PE MD, Harala PL, Pettit JM, Smiciklas-Wright H, Hartman TJ. Development and evaluation of a method for calculating the Healthy Eating Index-2005 using the Nutrition Data System for Research. Public Health Nutrition. 2011;14(2):306–13. [DOI] [PubMed] [Google Scholar]
- 14.Johnson RK DP, Goran MI. Comparison of multiple-pass 24-hour recall estimates of energy intake with total energy expenditure determined by the doubly labeled water method in young children. Journal of the American Dietetic Association. 1996;96:1140–4. [DOI] [PubMed] [Google Scholar]
- 15.Van Horn LV SP, Moag-Stahlberg A, Obarzanek E, Hartmuller VW, Farris RP, Kimm SYS, Frederick M, Snetselaar L, Liu K . The Dietary Intervention Study in Children (DISC): Dietary assessment methods for 8- to 10-year-olds. 1993;93:1396–403. [DOI] [PubMed] [Google Scholar]
- 16.Anater AS, Catellier DJ, Levine BA, Krotki KP, Jacquier EF, Eldridge AL, et al. The Feeding Infants and Toddlers Study (FITS) 2016: Study Design and Methods. The Journal of Nutrition. 2018;148:1516S–24S. [DOI] [PMC free article] [PubMed] [Google Scholar]
- 17.Schakel SF, Sievert YA, Buzzard IM. Sources of data for developing and maintaining a nutrient database. J Am Diet Assoc. 1988;88(10):1268–71. [PubMed] [Google Scholar]
- 18.Schakel SF, Buzzard IM, Gebhardt SE. Procedures for Estimating Nutrient Values for Food Composition Databases. Journal of Food Composition and Analysis. 1997;10(2):102–14. [Google Scholar]
- 19.Schakel SF. Maintaining a Nutrient Database in a Changing Marketplace: Keeping Pace with Changing Food Products—A Research Perspective. Journal of Food Composition and Analysis. 2001;14(3):315–22. [Google Scholar]
- 20.Management of Suboptimally Dated Pregnancies. Committee Opinion No. 688.: Obstetrics & Gynecology; 2017. [Available from: https://www.acog.org/clinical/clinical-guidance/committee-opinion/articles/2017/03/management-of-suboptimally-dated-pregnancies. [DOI] [PubMed]
- 21.Editor MB. How to Identify the Most Important Predictor Variables in Regression Models: Minitab; 2016. [Available from: https://blog.minitab.com/en/adventures-in-statistics-2/how-to-identify-the-most-important-predictor-variables-in-regression-models. [Google Scholar]
- 22.Van De Schoot R, Depaoli S, King R, Kramer B, Märtens K, Tadesse MG, et al. Bayesian statistics and modelling. Nature Reviews Methods Primers. 2021;1(1). [Google Scholar]
- 23.Plummer M rjags: Bayesian Graphical Models using MCMC. R package version 4–10 ed 2019. [Google Scholar]
- 24.Wickham H ggplot2: Elegant Graphics for Data Analysis: Springer-Verlag; New York; 2016. [Google Scholar]
- 25.Piironen J, Vehtari A. Comparison of Bayesian predictive methods for model selection. Statistics and Computing. 2017;27(3):711–35. [Google Scholar]
- 26.Spiegelhalter DJ, Best NG, Carlin BP, Van Der Linde A. Bayesian measures of model complexity and fit. Journal of the Royal Statistical Society: Series B (Statistical Methodology). 2002;64(4):583–639. [Google Scholar]
- 27.Vickers MH, Clayton ZE, Yap C, Sloboda DM. Maternal Fructose Intake during Pregnancy and Lactation Alters Placental Growth and Leads to Sex-Specific Changes in Fetal and Neonatal Endocrine Function. Endocrinology. 2011;152(4):1378–87. [DOI] [PubMed] [Google Scholar]
- 28.Salcedo-Bellido I, Martínez-Galiano JM, Olmedo-Requena R, Mozas-Moreno J, Bueno-Cavanillas A, Jimenez-Moleon JJ, et al. Association between Vitamin Intake during Pregnancy and Risk of Small for Gestational Age. Nutrients. 2017;9(12). [DOI] [PMC free article] [PubMed] [Google Scholar]
- 29.Olsen SF, Hansen HS, Jensen B, Sørensen TIA. Pregnancy duration and the ratio of long-chain n-3 fatty acids to arachidonic acid in erythrocytes from Faroese women. Journal of Internal Medicine. 1989;225. [DOI] [PubMed] [Google Scholar]
- 30.Olsen SF, Sørensen JD, Secher NJ, Hedegaard M, Henriksen TB, Hansen HS, et al. Randomised controlled trial of effect of fish-oil supplementation on pregnancy duration. Lancet. 1992;339(8800):1003–7. [DOI] [PubMed] [Google Scholar]
- 31.Middleton P, Gomersall JC, Gould JF, Shepherd E, Olsen SF, Makrides M. Omega-3 fatty acid addition during pregnancy. Cochrane Database Syst Rev. 2018;11(11):Cd003402. [DOI] [PMC free article] [PubMed] [Google Scholar]
- 32.Silva-Zolezzi I, Samuel TM, Spieldenner J. Maternal nutrition: opportunities in the prevention of gestational diabetes. Nutr Rev. 2017;75(suppl 1):32–50. [DOI] [PMC free article] [PubMed] [Google Scholar]
- 33.Burchakov DI, Kuznetsova IV, Uspenskaya YB. Omega-3 Long-Chain Polyunsaturated Fatty Acids and Preeclampsia: Trials Say “No,” but Is It the Final Word? Nutrients. 2017;9(12). [DOI] [PMC free article] [PubMed] [Google Scholar]
- 34.Shah NS, Wang MC, Freaney PM, Perak AM, Carnethon MR, et al. Trends in gestational diabetes at first live birth by race and ethnicity in the US, 201–2019. JAMA 2021; 326(7):660–669. [DOI] [PMC free article] [PubMed] [Google Scholar]
- 35.Teng H, Wang Y, Han B, Liu J, Cao Y, Wang J, et al. Gestational systolic blood pressure trajectories and risk of adverse maternal and perinatal outcomes in Chinese women. BMC Pregnancy Childbirth. 2021;21(1):155. [DOI] [PMC free article] [PubMed] [Google Scholar]
- 36.March of Dimes Born Too Soon: Estimated Rates of Preterm Birth per 100 Live Births [Available from: https://www.marchofdimes.org/mission/global-preterm.aspx.
- 37.Di Renzo GC, Giardina I, Rosati A, Clerici G, Torricelli M, Petraglia F. Maternal risk factors for preterm birth: a country-based population analysis. Eur J Obstet Gynecol Reprod Biol. 2011;159(2):342–6. [DOI] [PubMed] [Google Scholar]
- 38.Platt MJ. Outcomes in preterm infants. Public Health. 2014;128(5):399–403. [DOI] [PubMed] [Google Scholar]
- 39.Goldenberg RL, Culhane JF, Iams JD, Romero R. Epidemiology and causes of preterm birth. Lancet. 2008;371(9606):75–84. [DOI] [PMC free article] [PubMed] [Google Scholar]
- 40.Zong X, Wang H, Yang L, Guo Y, Zhao M, Magnussen CG, et al. Maternal Pre-pregnancy Body Mass Index Categories and Infant Birth Outcomes: A Population-Based Study of 9 Million Mother-Infant Pairs. Front Nutr. 2022;9:789833. [DOI] [PMC free article] [PubMed] [Google Scholar]
- 41.Dunson DB. Commentary: Practical Advantages of Bayesian Analysis of Epidemiologic Data. American Journal of Epidemiology. 2001;153(12):1222–6. [DOI] [PubMed] [Google Scholar]
- 42.Chow S-C, Chang M Adaptive design methods in clinical trials – a review. Orphanet Journal of Rare Diseases. 2008;3(1):11. [DOI] [PMC free article] [PubMed] [Google Scholar]
- 43.Lunn D, Jackson C, Best N, Thomas A, Spiegelhalter D. Chapter 9: Issues in Modelling. The BUGS Book: Chapman and Hall/CRC; 2012. [Google Scholar]
- 44.Gómez-Rubio V Bayesian Inference with INLA. Boca Raton, FL.: Chapman & Hall/CRC Press; 2020. [Google Scholar]
- 45.Graham JW, Olchowski AE, Gilreath TD. How Many Imputations are Really Needed? Some Practical Clarifications of Multiple Imputation Theory. Prevention Science. 2007;8(3):206–13. [DOI] [PubMed] [Google Scholar]
- 46.Desai M, Esserman DA, Gammon MD, Terry MB. The use of complete-case and multiple imputation-based analyses in molecular epidemiology studies that assess interaction effects. Epidemiologic Perspectives & Innovations. 2011;8(1):5. [DOI] [PMC free article] [PubMed] [Google Scholar]
- 47.White IR, Carlin JB. Bias and efficiency of multiple imputation compared with complete-case analysis for missing covariate values. Statistics in Medicine. 2010;29(28):2920–31. [DOI] [PubMed] [Google Scholar]
Associated Data
This section collects any data citations, data availability statements, or supplementary materials included in this article.
Supplementary Materials
Data Availability Statement
We will share deidentified data from the study including data from individual participants with a signed data access agreement that includes the study principal investigators and is contingent on their approval of the planned use of the data. As the data are entered into an electronic system, a specific request to SEC (scarlson@kumc.edu) or BJG (bgajewski@kumc.edu) would be needed to generate a data output for other investigators. Our study protocol has been published and the protocol update as well as statistical analysis plan are available from SEC or BJG.


