

Abstract
In aerobic glycolysis, oxygen is abundant, and yet cells metabolize glucose without using it, decreasing their ATP per glucose yield by 15-fold. During task-based stimulation, aerobic glycolysis occurs in localized brain regions, presenting a puzzle: why produce ATP inefficiently when, all else being equal, evolution should favor the efficient use of metabolic resources? The answer is that all else is not equal. We propose that a tradeoff exists between efficient ATP production and the efficiency with which ATP is spent to transmit information. Aerobic glycolysis, despite yielding little ATP per glucose, may support neuronal signaling in thin (< 0.5 μm), information-efficient axons. We call this the efficiency tradeoff hypothesis. This tradeoff has potential implications for interpretations of task-related BOLD “activation” observed in fMRI. We hypothesize that BOLD “activation” may index local increases in aerobic glycolysis, which support signaling in thin axons carrying “bottom-up” information, or “prediction error”—i.e., the BIAPEM (BOLD increases approximate prediction error metabolism) hypothesis. Finally, we explore implications of our hypotheses for human brain evolution, social behavior, and mental disorders.
Keywords: brain metabolism, aerobic glycolysis, mitochondria, informational efficiency, axon diameter, BOLD fMRI, gamma oscillation, norepinephrine, predictive coding, prediction error, depression, autism
“At its biological core, life is a game of turning energy into offspring” (Pontzer, 2015, p. 170). This pithy statement reflects the observation that evolutionary fitness is supported by energetic efficiency—i.e., the efficient production of cellular energy (i.e., ATP) from metabolites (e.g., glucose; Table 1). By increasing energetic efficiency, animals make surplus energy available for important activities (e.g., mating and the care of offspring), and, at the same time, they decrease the frequency with which they must seek additional nutrients in their environment (potentially bringing themselves into contact with predators or other threats; Pontzer, 2015; S. J. Simpson & Raubenheimer, 2012). Darwin proposed that evolution should “economize in every part of the organization” as “it will profit the individual not to have its nutriment wasted on building up [a] useless structure,” (Darwin, 1859/2001, p. 137), and, consistent with this idea, recent biological research has emphasized the importance of energetic efficiency within the systems, organs, and tissues of an organism (Cisek, 2019; Hasenstaub et al., 2010; Levy & Baxter, 2002; Niven & Laughlin, 2008; Sterling & Laughlin, 2015; Weibel, 1998, 2000).
Table 1.
Relevant forms of efficiency.
| Name | Units | Example |
| Energetic efficiency [of glucose metabolism] | ATP/glucose | Energetic efficiency refers to the ratio of energy produced relative to potential energy available. In cellular respiration, energetic efficiency is initially low in glycolysis (the 1st stage of cellular respiration, providing a net yield of 2 ATP / glucose), but increases in oxidative phosphorylation (oxphos; the 2nd stage of cellular respiration) when the precursors supplied by glycolysis are metabolized into ~30 additional ATP/glucose. If those same precursors are converted to lactate and released into the bloodstream, then local energetic efficiency of glucose metabolism would be low, but global energetic efficiency (at the level of the whole organism) could remain high if lactate is reconverted and metabolized elsewhere by oxphos (see Figure 1a). Throughout this paper, if the term energetic efficiency is used, it should be taken to refer to the energetic efficiency of glucose metabolism, unless otherwise specified. |
| Transmission speed | meters/sec | Action potentials transmit signals across a physical distance more quickly than chemical diffusion. Thick axons also transmit signals across a physical distance more quickly than thin axons. For example, estimates using a large sample of mammalian brains returned a transmission speed of 5.7 meters/sec and 17.1 meters/sec for 1 and 3 μm myelinated axons, respectively (S. S.-H. Wang et al., 2008). |
| Energy consumption | ATP/sec | Action potentials consume about an order of magnitude more energy per unit time than chemical diffusion (Sengupta et al., 2014). For example, C. elegans, which are ~1 mm long, do not even possess the genes needed to express voltage-gated Na+ channels for action potentials, and were thought to signal by chemical diffusion alone (Goodman et al., 1998; Hobert, 2013; Sterling & Laughlin, 2015; but see Jiang et al., 2022, as recent evidence suggests calcium-mediated action potentials do occur in C. elegans). |
| Information rate | bits/sec | Thick axons transmit more information per unit time compared to thin axons. For example, holding spike rate and Na+/K+ channel density constant, a 5.64 μm diameter axon transmits ~181 bits/sec, while a 0.56 μm diameter axon transmits ~19 bits/sec (Sengupta, Faisal, et al., 2013). |
| Information efficiency | bits/ATP | Thin axons transmit more information per ATP compared to thick axons. For example, holding spike rate and Na+/K+ channel density constant, a 0.56 μm diameter axon transmits ~1.4 × 10−5 bits/ATP, while a 5.64 μm diameter axon transmits ~1.4 × 10−6 bits/ATP, making the thin axon about an order of magnitude more informationally efficient (Sengupta, Faisal, et al., 2013). |
Note that myelination increases transmission speed (meters/sec) and reduces the energy cost per spike (ATP/spike), at the cost of increasing the use of extracellular physical space (see Sterling & Laughlin, 2015; Ch. 7) and the initial energy costs of myelination. The time to recover this investment can be calculated from the average firing rate of an axon, and thin axons pay back the initial investment more slowly (see Fig. 2 in J. J. Harris & Attwell, 2012).
Given the importance of energetic efficiency, it should come as a surprise to learn that task-based stimulation (e.g., sensory simulation, performing cognitive tasks) elicits an energetically inefficient form of brain metabolism (e.g., Dalsgaard, 2006; Díaz-García et al., 2017; Fox et al., 1988; Madsen et al., 1995, 1998, 1999). Under most circumstances, the brain produces energy efficiently through cellular respiration, a metabolic pathway that begins with glycolysis in cellular cytosol (where glucose is metabolized into pyruvate, providing a net yield of 2 ATP; Figure 1a) and ends with oxidative phosphorylation (i.e., oxphos) in mitochondria (where pyruvate and oxygen are metabolized to yield ~30 more ATP; Figure 1a). Evidence from human and rodent brains, however, shows that glycolysis and oxphos decouple during task-based stimulation, such that rates of glycolysis substantially outpaces rates of oxphos. In this case, products of glycolysis (i.e., pyruvate) that would otherwise be used in oxphos are exported (as lactate; Figure 1a) from the brain region, or from the entire brain—in other words, potential energy is exported from stimulated populations of brain cells (neurons and/or glia) when they are most active, and presumably, most in need of that energy. Under other circumstances (e.g., in the body), glycolysis and oxphos decouple when oxygen supply cannot keep pace with oxygen demand, in which case glycolysis acts as a fuel of final resort (e.g. in muscles during a sprint; Webster, 2003). In the brain, however, glycolysis and oxphos decouple even though oxygen is supplied in abundance. This relative increase in the rate of glycolysis over the rate of oxphos, despite the presence of abundant oxygen, is called aerobic glycolysis (for review, see Dienel, 2019). The present work focuses on brain-based aerobic glycolysis that occurs during task-based stimulation, which we term stimulation-based aerobic glycolysis. On the surface, stimulation-based aerobic glycolysis is puzzling because it appears to violate Darwin’s dictum that evolution disfavors wasteful metabolic spending, meaning either that the dictum is wrong, or that aerobic glycolysis offers some overlooked adaptive advantage to offset its energetically inefficient use of glucose.
Figure 1.

A) Cellular respiration refers to the full sequence of metabolic processes, which convert 1 glucose and 6 oxygen (O2) molecules into ATP, H2O and CO2. For present purposes, the relevant stages are: (red) glycolysis and oxidative phosphorylation (oxphos; blue). In glycolysis, glucose is metabolized by glycolytic enzymes in the cytosol, producing a net yield of 2 ATP and 2 pyruvate, and converting 2 NAD+ into 2 NADH. In oxphos, pyruvate and NADH are metabolized in mitochondria (along with 6 O2) to produce ~30 ATP (Hertz et al., 2007). As displayed in panel A, glycolysis requires NAD+ as a precursor, and oxphos provides it, reconverting NADH to NAD+ through the action of the malate-aspartate shuttle (MAS), a necessary step in oxphos. If oxphos cannot occur (e.g., due to lack of O2, as in anaerobic glycolysis), then NAD+ must be restored by other means: in this case, lactate dehydrogenase reconverts NADH into NAD+, but, in the process, ferments pyruvate into lactate, which is expelled from the cell. Lactate is a form or stored energy, and can be reconverted into pyruvate in peripheral organs for use in oxphos (making aerobic/anaerobic glycolysis only locally energetically inefficient). Figure 1a is adapted from Chih & Roberts (2003). B) Inputs, outputs, and relative oxygen:glucose consumption (oxygen:glucose index; OGI) for relevant metabolic processes. Anaerobic and aerobic glycolysis share inputs/outputs, but in aerobic glycolysis oxphos is not prevented by a lack of O2. Total reactions and reactions rates per ATP are adapted from Table 2 in (Dienel, 2019). Note that glycolysis involves fewer total reactions, but produces ATP per reaction at approximately half the rate of cellular respiration.
This paper introduces an account of why task-based stimulation would cause brain cells (e.g., neurons and/or glia) to engage in aerobic glycolysis (as opposed to oxphos), despite its energetically inefficient use of glucose. (From here on in this paper, we will use the term energetic efficiency to refer to the energetic efficiency of glucose metabolism, unless otherwise specified.) We will suggest that Darwin’s dictum to avoid wasteful metabolic spending requires that individuals do more than just produce ATP efficiently; it also requires that they spend ATP efficiently. We therefore consider an additional form of efficiency: informational efficiency, i.e., the ATP costs of transmitting information from one neuron to another. We will show that brain design may sometimes necessitate a tradeoff between energetic efficiency and informational efficiency—that is, aerobic glycolysis may produce fewer ATP per glucose, but it may help produce ATP when and where it is needed to maximize information sent per ATP spent. Energetic efficiency is traded for informational efficiency. We call this the efficiency tradeoff hypothesis. The puzzle of stimulation-based aerobic glycolysis may be resolved by understanding that brain design may favor informational efficiency even at the cost of a localized and temporary decrease in the energetic efficiency of glucose metabolism. This is important, because understanding the function of stimulation-based aerobic glycolysis has implications for interpreting other stimulation-based changes in brain metabolism, such as those indexed by positive changes in blood-oxygen level-dependent (BOLD) signal intensity (i.e., BOLD signal intensity increases). These implications have the potential to reframe the traditional interpretation of BOLD fMRI-based neuroimaging research as a measure of local “activation”, while also drawing a tighter connection between the BOLD fMRI signal and the metabolic processes that underlie it (for related criticism of the concept of brain “activation”, see Logothetis, 2008; Singh, 2012). Thus, the focus of the present work begins on a metabolic puzzle, but ends on a scientific paradigm.
The puzzle of stimulation-based aerobic glycolysis involves a small detail of brain metabolism, but its solution has major implications for theoretical integration in neuroscience. As such, this paper aims to remain accessible to a broad audience. Section 1 introduces core concepts related to brain metabolism, and reviews several nuances of stimulation-based aerobic glycolysis (including the misconception by some that this puzzle was already solved). Section 2 reviews evidence for the efficiency tradeoff hypothesis and establishes how stimulation-based aerobic glycolysis may provide ATP when and where it is needed to promote informational efficiency (at the cost of energetic inefficiency). Section 3 first situates the efficiency tradeoff hypothesis in the context of related neuroscientific research—including its potential relationship to the energy requirements of subpopulations of fast-spiking interneurons (building on prior hypotheses developed by Kann, 2016; Niessing et al., 2005)—then addresses its implications for interpreting brain “activation”, as indexed by BOLD signal intensity increases. Specifically, Section 3 proposes that localized BOLD signal intensity increases may index stimulation-based aerobic glycolysis, which may, in turn, metabolically support “bottom-up” sensory encoding (for review, see Rauss & Pourtois, 2013), or prediction error encoding (in the context of predictive processing models; e.g., Barrett & Simmons, 2015; Clark, 2013; Friston, 2010). We call this the BIAPEM hypothesis (BOLD increases approximate prediction error metabolism). Finally, Section 4 considers how the efficiency tradeoff hypothesis affords opportunities for theoretical synthesis and scientific discovery in (a) human-specific evolutionary changes in cytoarchitecture, (b) the role of brain metabolism in human social cognition, and (c) the interaction between metabolic dysfunction and mental disorders, such as depression and autism. In sum, this paper first addresses a particular puzzle in brain metabolism (i.e., what function does stimulation-based aerobic glycolysis serve?), and then uses the proposed solution—the efficiency tradeoff hypothesis—to unify several empirical observations in neuroscience, and to clarify how BOLD “activity” could be interpreted.
1. Core concepts in brain metabolism and neural communication.
Section 1 provides a general review of neural communication and its metabolic costs, as well as the neurochemical details relevant to stimulation-based aerobic glycolysis. This section reviews: how neuronal communication imposes significant metabolic costs (Section 1.1), how cellular metabolism pays those costs using the two major stages of cellular respiration, glycolysis and oxphos, to convert glucose to ATP (Section 1.2), how stimulation-based aerobic glycolysis is measured (Section 1.3) as well as how subtle differences between stimulation-based aerobic glycolysis and other metabolic pathways affect those measurements (Section 1.3.1), and finally, why the functional puzzle of stimulation-based aerobic glycolysis has not been solved by other accounts (Section 1.4). Overall, Section 1 aims to provide the core concepts and context necessary to understand precisely what the puzzle of stimulation-based aerobic glycolysis involves.
1.1. Communicating information within the brain carries major metabolic costs.
Neurons continually receive, integrate, and send signals to other brain cells, and these physical signals can be conceptually described as supporting “information transmission”, or “communication.” Information can be defined as the reduction of uncertainty from among a set of possible outcomes (Shannon & Weaver, 1949/1964), and is measured in bits. A signal that resolves uncertainty between two equally likely outcomes (e.g., the outcome of a coin toss) provides one bit of information. Critically, neuronal communication is a physical process: flows of sodium and potassium ions allow a neuron to propagate an action potential along its axon, which, upon reaching a synapse, triggers the release of chemicals to be taken up by a recipient neuron. Neuronal biophysics impose some inherent constraints on the speed and cost of neuronal communication. For example, compared to chemical diffusion (see Table 1), action potentials send information quickly (i.e. at a higher transmission speed, in meters/sec; Table 1), but necessarily increase the metabolic cost of communication (i.e. increasing energy consumption, in ATP/sec; Table 1; Sengupta et al., 2014). This means that communication by action potential has pros and cons, in that it involves a tradeoff between transmission speed and energy consumption. If information must be quickly transmitted across a distance, then it might be adaptive to increase transmission speed at the cost of also increasing energy consumption. Such tradeoffs are a fundamental factor of neural design, and the use of metabolic energy is a key variable to be considered in those tradeoffs (Sterling & Laughlin, 2015).
Neuronal signaling is metabolically costly, and keeping these costs under control at the neuronal level is important because they can create a large cumulative expense when the entire brain is considered. In an awake resting state, the human brain consumes ~20% of the whole-body ATP budget (Clarke & Sokoloff, 1999)1, and this cost does not change substantially between the awake resting state and during sensory stimulation (i.e., from a metabolic perspective, the brain is always “on”; for review, see Mangia et al., 2009). Further, across mammals and across levels of cortical activity (i.e., from anesthesia to an awake and stimulated state; Y. Yu et al., 2018), the brain’s largest metabolic expense is the cost of signaling (e.g., fueling action potentials, synaptic transmission). Signaling costs comprise ~70–75% of the brain’s ATP budget and massively outweigh the metabolic costs of non-signaling processes (e.g. biosynthesis of protein, lipids, or myelin; Attwell & Laughlin, 2001; Hyder, Rothman, et al., 2013; Sengupta et al., 2010; Y. Yu et al., 2018). These signaling costs largely stem from the cost of powering Na+/K+ pumps, which restore resting axonal ion gradients after each action potential in preparation for the next (Attwell & Laughlin, 2001; J. J. Harris & Attwell, 2012). Given the metabolic expense of the brain, a well-adapted brain should keep its costs under control, meaning that an increase in energetic costs should only be tolerated when it gains something essential in return (e.g., axons trade an increase in energy consumption for an increase in transmission speed, relative to chemical diffusion; Sterling & Laughlin, 2015). Stimulation-based aerobic glycolysis is puzzling because the functional benefits gained in exchange for its energetic inefficiency have yet to be clearly articulated.
1.2. The two stages of cellular respiration.
To understand aerobic glycolysis, it is important to understand cellular respiration, the metabolic pathway that helps meet most ATP demands in the body and brain. Cellular respiration (sometimes called aerobic metabolism) is the full sequence of metabolic processes that convert glucose and oxygen into water, carbon dioxide, and ATP (Figure 1a). For our purposes, cellular respiration can be grouped into two stages: glycolysis and oxidative phosphorylation (oxphos). Glycolysis, the first stage, uses enzymes in intracellular fluid (i.e., cytosol) for a net yield of 2 ATP per glucose molecule. Oxphos, the second stage, occurs within cellular mitochondria and is more energy-efficient than glycolysis, yielding ~30 ATP per glucose molecule. As input, oxphos uses the non-ATP products of glycolysis (2 pyruvate and 2 NADH) and 6 oxygen molecules. Critically, glycolysis and oxphos complement each other: the products of glycolysis are precursors for oxphos, and oxphos replenishes the precursors for glycolysis (converting NADH into NAD+, via the malate-aspartate shuttle; MAS in Figure 1a). Thus, when glycolysis and oxphos work in synchrony, ~32 ATP can be attained from each glucose molecule, compared to the 2 ATP that can be attained from glycolysis alone.
As reviewed in the introduction, aerobic glycolysis (also called nonoxidative glycolysis; DiNuzzo et al., 2023) refers to the general phenomenon where glycolysis outpaces oxphos (leading to lactate production) when oxygen is abundant (e.g., during local brain “activation”; for review, see Dienel, 2019; Dienel & Cruz, 2016; DiNuzzo et al., 2023)2. However, glycolysis also outpaces oxphos under anaerobic conditions, where oxygen is unavailable3. Unlike aerobic glycolysis, the function of anaerobic glycolysis (i.e., glycolysis in the absence of oxygen) presents no puzzle, because the benefit received in exchange for its energetic inefficiency is well understood. Under anaerobic conditions, oxphos is prevented and ATP supply can fall short of demand. ATP from anaerobic glycolysis can make up for this shortfall, but at the cost of consuming 15-fold more glucose than cellular respiration (i.e., glycolysis, then oxphos) for the same net-ATP yield. Anaerobic glycolysis, despite its energetic inefficiency, can act as a fuel of final resort in circumstances where oxygen is absent, or when oxygen delivery cannot keep pace with demand (e.g., in muscles in a sprint). Aerobic glycolysis, by contrast, occurs when oxygen is readily available, and its function has remained poorly understood.
Both aerobic and anaerobic glycolysis can optimize energetic efficiency at the level of the entire organism by recirculating lactate (a byproduct of glycolysis) for use in oxphos elsewhere. In this way, aerobic and anaerobic glycolysis are most accurately described as locally energetically inefficient, as, from the perspective of the entire animal, the full ATP yield of each glucose molecule can still be attained. Lactate is a converted form of pyruvate (which is used as input for oxphos). Because oxphos restores NAD+ (a precursor for glycolysis), if oxphos does not occur (or cannot occur, e.g., if oxygen is absent) then glycolysis must restore NAD+ by some other means. Converting pyruvate to lactate solves this problem, and restores NAD+ by a different route. Lactate is released into circulation from the cell (i.e., lactate efflux), and can be reconverted into pyruvate after being taken up by cells downstream (or it can be used for gluconeogenesis, where a new glucose molecule is created). In the absence of oxygen, lactate efflux serves a clear purpose: it restores local NAD+ when oxphos cannot. However, lactate efflux in aerobic glycolysis is unintuitive: why expel lactate—which contains carbon from glucose and is a source of potential energy—when oxygen is abundant and oxphos is unhindered? What benefit does aerobic glycolysis gain in exchange for this local energetic inefficiency?
1.3. Stimulation-based aerobic glycolysis and its measurement.
In aerobic glycolysis, energy inefficient metabolism appears to be favored, rather than a method of last resort. Specifically, task-based stimulation elicits aerobic glycolysis in the brain, where the cerebral metabolic rate of glucose consumption (CMRglc) increases disproportionally compared to the cerebral metabolic rate of oxygen consumption (CMRO2)—and, as a consequence, lactate is released into circulation from “activated” brain regions. In the brains of humans and rodents, this stimulation-based aerobic glycolysis occurs after task-based visual stimulation (Bednařík et al., 2015; Fox et al., 1988; Fox & Raichle, 1986), tactile stimulation (Díaz-García et al., 2017; Madsen et al., 1998, 1999), physical exercise4 (Dalsgaard, 2006), and cognition (Madsen et al., 1995; for review, see Dienel, 2019). A large increase in CMRglc out of proportion to the smaller increase in CMRO2 can be described as a “decoupling” between glucose and oxygen metabolism. This glucose–oxygen decoupling is noteworthy, as the BOLD signal used in fMRI is produced by a similar decoupling between local measures of CMRO2 and cerebral blood flow (CBF). Seminal studies of BOLD imaging shed some light on the close relationship between CMRglc, CMRO2, and CBF (Fox et al., 1988; Fox & Raichle, 1986), and we will return to these relationships in Section 3.1 when we discuss the relationship between stimulation-based aerobic glycolysis and BOLD fMRI. Here, we review some nuances of how stimulation-based aerobic glycolysis is measured, then, in Section 1.3.1, we discuss how it can be distinguished from related metabolic phenomenon.
Because stimulation-based aerobic glycolysis involves a decoupling between CMRO2 and CMRglc, it can be measured most directly by comparing the two metabolic rates using the oxygen:glucose index (OGI). The theoretical maximum for OGI is 6 (Figure 1b), where CMRO2 is 6-fold greater than CMRglc, and six oxygen molecules are metabolized for every one glucose molecule. When OGI is ~6, the ATP yield from each glucose is maximized. If OGI decreases below 6, as it does after task-based stimulation (Figure 2), then stimulation-based aerobic glycolysis has most likely occurred (for exceptions, see Section 1.3.1). An early method for estimating OGI was to sample arterial and venous blood, then compare glucose and oxygen concentrations entering and exiting the entire brain (Dalsgaard, 2006; Madsen et al., 1995, 1998, 1999; Quistorff et al., 2008; Schmalbruch et al., 2002). For example, in humans, arterial–venous measurements suggest that performing a card-sorting task decreases whole-brain OGI to ~5.4 (Madsen et al., 1995); likewise, in rats, abrupt removal from a shelter box designed to minimize external stimulation decreases whole-brain OGI to ~4.0–5.2 (Madsen et al., 1998; Schmalbruch et al., 2002), and whisker stimulation decreases whole-brain OGI to ~5.0 (Madsen et al., 1999). However, whole-brain methods cannot identify regional changes in OGI. Newer metabolism-based neuroimaging methods have used multiple positron emission tomography (PET) scans to track the regional fate of glucose and oxygen using [18F]FDG and 15O2 tracers, respectively (Fox et al., 1988; Hyder et al., 2016; Vaishnavi et al., 2010). For example, when participants observed a simple visual checkerboard, OGI in primary visual cortex dropped to ~2.8 (Fox et al., 1988)—although this OGI of 2.8 is exceptionally low and likely overestimates aerobic glycolysis in this particular case, as the same study reported an exceptionally low whole-brain OGI of 4.1 at rest (i.e., well below resting OGIs recorded near 6.0 in later work; see Fig. 5B in Dienel, 2019; and Table 1 in Dienel & Cruz, 2016). However, these PET-based methods have not been widely adopted, likely because of their cost and slow temporal resolution5.
Figure 2.
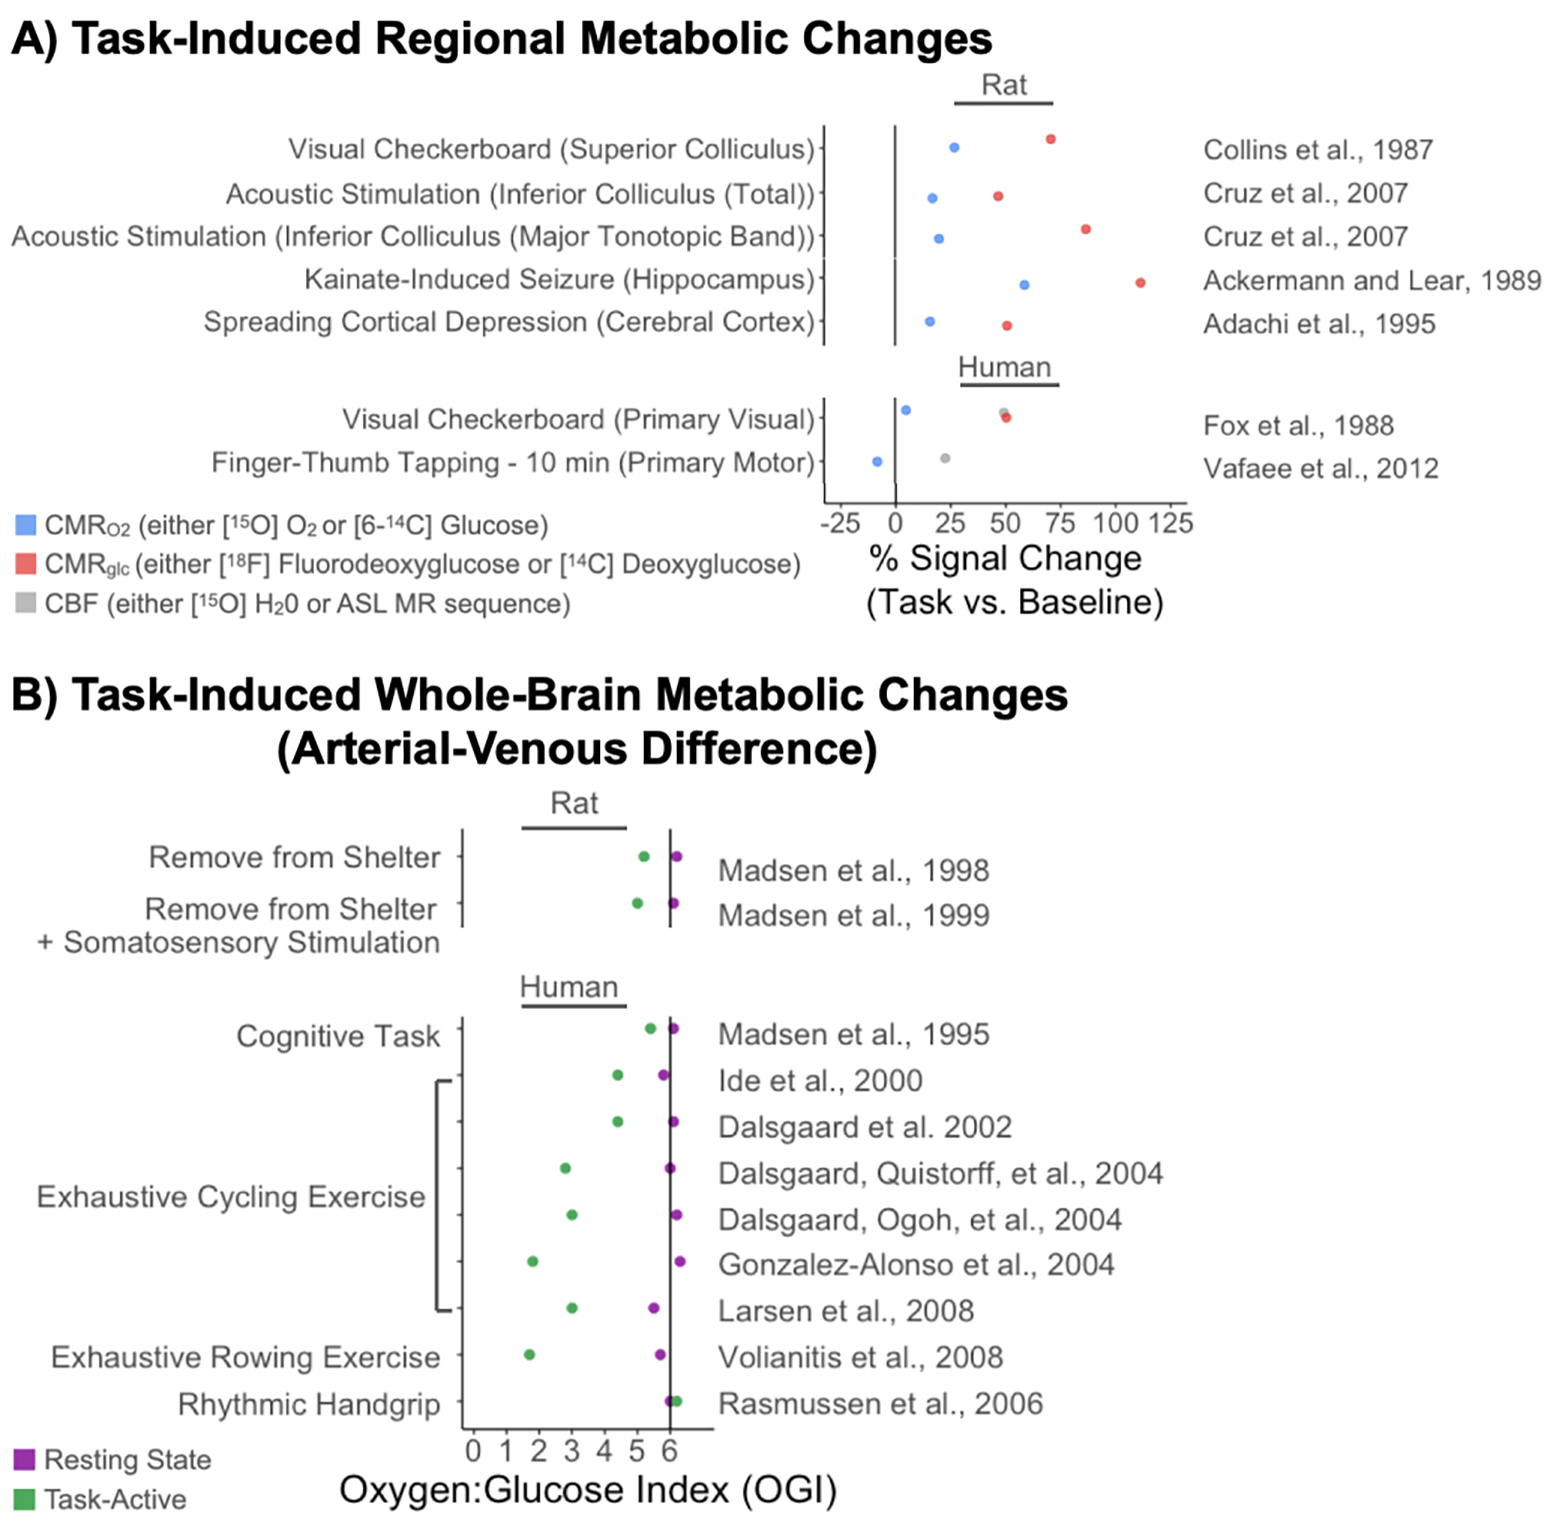
Metabolic changes at resting baseline and in response to stimulation. A) Task-induced regional metabolic changes, measured by PET tracers or arterial spin labeling (ASL) MR sequences. Compared to rest, sensory stimulation or induced activation (e.g. seizure) elicits a great increase in glucose metabolism (CMRglc) compared to an increase in oxygen metabolism (CMRO2). Fox et al. (1988) observed that both CMRglc and cerebral blood flow (CBF) increased in proportion to each other, and Vafaee et al. (2012) used this observation to justify using CBF as a proxy for CMRglc when imaging CMRO2 and CBF simultaneously. B) Whole-brain metabolic changes in response to task-based stimulation. The arterial-venous difference method most directly measures changes in the oxygen:glucose index (OGI) by measuring oxygen and glucose concentration in arterial and venous blood. Sensory stimulation, exercise, and cognitive tasks (the Wisconsin card sorting task; Madsen et al., 1995) elicits an increase in CMRglc relative to CMRO2, decreasing OGI. Original data from (Ackermann & Lear, 1989; Adachi et al., 1995; Collins et al., 1987; Cruz et al., 2007; Dalsgaard et al., 2002; Dalsgaard, Ogoh, et al., 2004; Dalsgaard, Quistorff, et al., 2004; Fox et al., 1988; González-Alonso et al., 2004; Ide et al., 2000; Larsen et al., 2008; Madsen et al., 1995, 1998, 1999; Rasmussen et al., 2006; Vafaee et al., 2012; Volianitis et al., 2008). Figure adapted from Tables 1& 2 in Dienel and Cruz (2016); Table 1 in Quistorff et al., 2008; and Fig. 5 in Dienel (2019).
Although OGI is the most direct measure of stimulation-based aerobic glycolysis, other measures can help contextualize aerobic glycolysis—e.g., addressing critical questions about which cells aerobic glycolysis occurs within, and the relation of aerobic glycolysis to BOLD signal intensity increases. These measures track specific byproducts of glycolysis (e.g., NADH/NAD+ ratios, or lactate efflux; Figure 1a), rather than overall CMRglc or CMRO2. For example, glycolysis increases the ratio of NADH to NAD+ and oxphos decreases it (Figure 1a). Recent work in rodents measured changes in the NADH/NAD+ ratio after whisker stimulation and demonstrated that stimulation-based aerobic glycolysis occurs inside neurons rather than occurring exclusively in astrocytes, as some prior work assumed (Díaz-García et al., 2017; Díaz-García & Yellen, 2019)6. Likewise, another indirect measure of stimulation-based aerobic glycolysis is local blood lactate concentration (i.e., when excess pyruvate is converted to lactate and exported from cells to the bloodstream; Figure 1a), which increases during aerobic glycolysis and can be measured by functional magnetic resonance spectroscopy (MRS). Measures of lactate concentration have been used to validate the regional task-based changes in CMRglc, originally identified by Fox and colleagues (Fox et al., 1988), by observing (in humans and rodents) a relative sensory-specific regional increase in local lactate concentrations after sensory stimulation (for review, see Mangia et al., 2009; Rothman et al., 2022). Visual stimulation is the dominant method in MRS studies (Bednařík et al., 2015; Frahm et al., 1996; Y. Lin et al., 2012; Mangia, Tkác, et al., 2007; Mangia, Tkáč, et al., 2007; Prichard et al., 1991; Sappey-Marinier et al., 1992; Schaller et al., 2013), but other studies have used motor stimulation (tapping index finger to thumb; Schaller et al., 2014) and stimulation of the trigeminal nerve in rats (connecting whiskers to barrel cortex; Sonnay et al., 2017). Measures of lactate concentration have also identified, in humans, as a positive cross-subject correlation between stimulation-based increases in lactate concentration and BOLD signal intensity, (Bednařík et al., 2015), which suggests that stimulation-based aerobic glycolysis and BOLD signal intensity increases constitute a coupled response to task-based stimulation (a topic we return to in Section 3.1). Critically, measures of lactate efflux can help distinguish stimulation-based aerobic glycolysis from other stimulation-based metabolic processes that would decrease OGI. We review the distinctions between stimulation-based aerobic glycolysis and these related metabolic pathways next.
1.3.1. Other metabolic pathways can cause stimulation-based decreases in OGI, but are not related to the puzzle of stimulation-based aerobic glycolysis.
A stimulation-elicited decrease in OGI can be caused by at least three metabolic pathways, but, among these, only aerobic glycolysis allows potential energy to escape local use via lactate efflux. As outlined in the introduction, this efflux of potential metabolic fuel from relatively more “active” brain regions makes the function of stimulation-based aerobic glycolysis puzzling. Two other brain-based metabolic pathways contribute to stimulation-based decreases in OGI but do not affect lactate efflux. These are glycogen storage and the pentose phosphate shunt pathway (PPP; for review of both pathways, see Section V.B in Dienel, 2019; for a detailed review of experimental evidence in both pathways, see Dienel & Cruz, 2016). For glycogen storage, glucose is converted to glycogen and stored in astrocytes as a local form of potential energy. In the PPP, carbon from glucose is used for both biosynthesis and reducing cellular oxidative stress. Although the function of stimulation-based aerobic glycolysis remains unclear, some authors have attributed functions from these related pathways to it—e.g., suggesting that stimulation-based aerobic glycolysis may be, “in part, a signal of experience-dependent biosynthetic processes in the brain [i.e., the PPP]” (Raichle, 2010, p. 187). This cannot be the case, however, as neither glycogen storage nor the PPP produce lactate efflux (i.e., exported potential energy). That is, in both glycogen storage and in the PPP, glucose does not escape local use: glucose (or glucose carbon molecules) are either used or stored locally, and are not exported as lactate. We briefly review these related pathways to disambiguate their functions from stimulation-based aerobic glycolysis, and to clarify that, although these pathways do involve a drop in OGI, they are tangential to the real puzzle of stimulation-based aerobic glycolysis.
Storing glycogen can cause the decrease in OGI observed during stimulation-based aerobic glycolysis; however, on closer examination stimulation-based aerobic glycolysis and glycogen storage are clearly distinct. Glycogen storage decreases the brain’s OGI by converting circulating glucose into glycogen and storing it in astrocytes. This causes an increase in CMRglc without any accompanying increase in CMRO2, because glycogen storage removes glucose from circulation without increasing the rate of oxphos. Glycogen storage, however, does not produce the lactate efflux characteristic of stimulation-based aerobic glycolysis: the glucose is stored (as glycogen) and, as a consequence, its potential energy remains in the local region for future use. Likewise, although metabolizing stored glycogen during task-based stimulation would increase local CMRglc (because previously stored glucose is being metabolized), this glycogen-use driven increase in local CMRglc cannot be detected by [18F]FDG-based PET tracers, which only track the fate of circulating glucose, not glucose held in storage (Dienel & Cruz, 2016). The metabolic use of stored glycogen, then, cannot account for increases in CMRglc observed using PET tracers (Fox et al., 1988), nor can it account for other indirect measures of stimulation-based aerobic glycolysis, such as the increased NADH/NAD+ ratio observed in somatosensory neurons after whisker stimulation (Díaz-García et al., 2017; Díaz-García & Yellen, 2019). And even if a portion of the stimulation-based lactate efflux were produced from the metabolic use of stored glycogen, the puzzle would remain: why export potential energy as lactate, rather than use it locally in oxphos?7
Like glycogen storage, the pentose phosphate shunt pathway (PPP) contributes to stimulation-based decreases in OGI but also cannot explain the observed lactate efflux. The PPP supports biosynthesis and the management of oxidative stress, and occurs alongside early steps in cellular respiration, when glucose is phosphorylated into glucose-6-phosphate (Glc-6-P). The PPP removes one carbon from Glc-6-P, which leaves one fewer carbon for oxphos metabolism. This loss of carbon for oxphos lowers CMRO2 while leaving CMRglc unchanged, which has the effect of decreasing OGI. Sensory stimulation (auditory, in conscious rats) has been shown to increase metabolism through the PPP (from ~4–7% of CMRglc to ~25% of CMRglc; Cruz et al. 2007), but because the PPP uses one carbon from Glc-6-P locally and leaves the remaining five carbons for subsequent use, nothing in the PPP itself requires that its products be exported as lactate. Therefore, the PPP could contribute to the stimulation-based decrease in OGI (Dienel & Cruz, 2016), but it cannot account for the puzzle of the lactate efflux observed during stimulation-based aerobic glycolysis8.
1.4. Other attempts to explain the function of stimulation-based aerobic glycolysis.
In neurochemistry, the function of stimulation-based aerobic glycolysis is generally acknowledged to remain an open question (e.g., Dienel, 2019; Yellen, 2018). In the neuroimaging literature, however, several hypotheses that have been dismissed or strongly disputed by neurochemists have remained popular (e.g., Raichle, 2010; Raichle & Mintun, 2006). These include hypotheses that: (a) stimulation-based aerobic glycolysis “produces ATP much faster… [meaning that] when speed is important, … one might posit that aerobic glycolysis is the way to go” (Raichle, 2010, p. 186); or that (b) stimulation-based aerobic glycolysis is largely driven by astrocyte metabolism, in which “the synthesis of new ATP appears to be done by glycolysis alone” (Raichle & Mintun, 2006, p. 457). In the latter account, glycolysis-based astrocyte metabolism is thought to support glutamate recycling after synaptic transmission, meaning that stimulation-based aerobic glycolysis is thought to be caused by metabolism in astrocytes after neuronal signaling (Pellerin & Magistretti, 1994; but, see Dienel, 2019). Below, we briefly review why neurochemists have disputed and dismissed both (a) the fast-ATP and (b) the astrocyte support for glutamate cycling hypotheses that have been proposed to explain the function of stimulation-based aerobic glycolysis.
The fast-ATP hypothesis has been dismissed because, per unit time, glycolysis does not actually yield more ATP, in total, than oxphos (Figure 1b). Because oxphos produces ~30 ATP/glucose, and glycolysis produces 2 ATP/glucose, a small percent increase in oxphos generates as much ATP as a larger rise in glycolysis (DiNuzzo et al., 2012; Hall et al., 2012; Mangia et al., 2009). For example, even in one of the largest observed increases in aerobic glycolysis—where visual stimulation increased CMRglc by ~50% and CMRO2 by ~5% (Fox et al., 1988)—the 5% increase in CMRO2 accounted for ~64% of the total increase in ATP production.9. The relative increase in CMRglc over CMRO2 observed by Fox and colleagues was also exceptional relative to rates observed in other studies (see Fig. 5B in Dienel, 2019), and subsequent analyses suggest that CMRO2 more typically accounts for ~97% of the increased ATP produced during “activation” (A.-L. Lin et al., 2010). Thus, the advantage of stimulation-based aerobic glycolysis cannot be that it produces net-ATP faster.
The astrocyte support for glutamate cycling hypothesis has a long history of controversy in neurochemistry. The role of astrocytes in glutamate–glutamine cycling is not itself controversial: astrocytes take up glutamate released into neuronal synapses, and expend ATP to recycle it into glutamine for reuptake into the presynaptic terminal. However, the hypothesis that stimulation-based aerobic glycolysis is driven by glycolysis in astrocytes stems from the astrocyte–neuron lactate shuttling (ANLS) hypothesis (Magistretti & Pellerin, 1999; Magistretti & Allaman, 2018, 2015; Pellerin & Magistretti, 1994), which originally stipulated that astrocytes only use glycolysis, and that neurons cannot increase their rate of glycolytic metabolism. Given these assumptions, neurons were thought to increase ATP production by converting lactate, shuttled to them from astrocytes, into pyruvate, which could be used in oxphos. However, there are at least three major problems with the ANLS hypothesis. First, if neurons prefer to metabolize lactate shuttled to them from astrocytes, then lactate is metabolized locally and should not be released into circulation, as is observed during stimulation-based aerobic glycolysis. Second, the ANLS hypothesis assumed that astrocytes are exclusively fueled by glycolysis, but more recent evidence suggests this is incorrect. The original assumption stemmed, in part, from a failure to identify mitochondria in astrocytes, but recent studies (and reexaminations of older studies) have identified astrocytic mitochondria in their small appendages (Derouiche et al., 2015; Jackson & Robinson, 2018). In fact, contrary to the initial ANLS hypothesis: (a) astrocytes have a high rate of oxidative metabolism (Dienel & Rothman, 2020; Hertz et al., 2007), (b) neurons can increase their rate of glycolytic metabolism (Ivanov et al., 2014; Patel et al., 2014) and (c) stimulation-based aerobic glycolysis occurs in neurons (Díaz-García et al., 2017; Díaz-García & Yellen, 2019). Finally, the ANLS hypothesis assumed that glutamate cycling elicits glycolysis in astrocytes, but this has also been criticized on the basis of inconsistent in vitro evidence and the lack of any in vivo demonstration (Dienel, 2017, 2019). Indeed, when all oxidative metabolism in neurons and astrocytes is accounted for, there is a 1:1 relationship between rates of oxphos and glutamate cycling, suggesting that oxphos supplies ATP for glutamate cycling in astrocytes (Rothman et al., 2022; Rothman & Dienel, 2019). The ANLS has been a popular account in the neuroimaging literature (e.g., Figley & Stroman, 2011); however, the ANLS is more controversial, and less well-supported than many neuroscientists have assumed. If astrocytes are not exclusively glycolytic, as the evidence above suggests, then the puzzle remains: why would local brain-based activity increase glycolysis out of proportion to oxphos, and release potential energy into circulation as lactate? The extra ATP produced by stimulation-based aerobic glycolysis is “a small fraction of the total ATP needs, suggesting that it is fueling specific processes …. [yet these processes] remain unidentified” (Rothman & Dienel, 2019, p. 390).
1.5. Summary.
Localized brain “activation” elicits aerobic glycolysis, where glucose is consumed out of proportion to oxygen. This stimulation-based aerobic glycolysis is locally energetically inefficient—i.e., it reduces the net yield of ATP per glucose and exports potential energy as lactate, rather than using it locally. The open question is: what advantage is this local energetic inefficiency traded for? Other hypotheses have been advanced to explain the function of stimulation-based aerobic glycolysis, but, on closer inspection, none of them can fully explain it. The next section develops our own proposed answer to the puzzle. The answer builds on the observation that brain design is optimized to promote informational efficiency, and may do so even at the expense of the energetic efficiency of glucose metabolism.
2. Addressing the puzzle of stimulation-based aerobic glycolysis: The efficiency tradeoff hypothesis.
The puzzle of stimulation-based aerobic glycolysis is that, following task-based stimulation, brain regions use an energetically inefficient form of glucose metabolism (and export potential energy from “active” regions in the form of lactate), despite the presence of an energetically efficient alternative in oxphos. To address this puzzle, we show that a tradeoff between informational efficiency (bits/ATP) and energetic efficiency (ATP/glucose; Table 1) emerges from the biophysics of thin axons, which support local communication in neuropil (i.e., space that is ubiquitous in grey matter and appears “empty” to light microscopes, but is full of small structures like dendrites, axons, synapses, glial cell structural appendages, and microvasculature; Spocter et al., 2012) but are also present (to a lesser extent) in longer-range axon tracts (Perge et al., 2012). We hypothesize that, when informational efficiency and energetic efficiency conflict, the brain favors informational efficiency. We call this the efficiency tradeoff hypothesis. To develop this hypothesis, this section describes: (a) how thin axons are informationally efficient, (b) how thin axons limit the physical space available for mitochondria, putting informational efficiency into conflict with the physical capacity to house mitochondria, (c) how aerobic glycolysis provides ATP in the absence of mitochondria, allowing thin axons to both meet their energetic demands and be constructed with thin diameters that maximize their informational efficiency, and (d) how the temporal responsivity of glycolysis (despite its low net yield of ATP) may help fuel unpredictable rapid-on/rapid-off signaling that thin axons must use to communicate. Thus, during neuronal signaling, stimulation-based aerobic glycolysis may predominate in thin axons (i.e., < 0.5 μm) that lack mitochondria to ensure that ATP is produced when and where it is needed to maximize informational efficiency10.
2.1. Thin axons maximize informational efficiency.
Brain evolution has to navigate tradeoffs between competing demands, as biophysical properties cause some advantages to come at the expense of others. In axons, informational efficiency—i.e., the amount of information sent per ATP spent (bits/ATP; Table 1)—is traded against the speed of communication, both in terms of the information rate (bits/sec) and the transmission speed of an action potential (meters/sec). Evidence suggests that, when faced with this tradeoff, brain structure has been optimized for informational efficiency (J. J. Harris et al., 2015; Hasenstaub et al., 2010; Sterling & Laughlin, 2015; Stone, 2018), and adheres to several principles of neural design, including: “send [information] at the lowest acceptable rate”, and “minimize … [the] length and diameter of all neural processes [i.e., structural appendages]” (Sterling & Laughlin, 2015, pp. 54–55). In other words, a well-designed brain sends information no faster than it has to, and minimizes the use of physical space. In this section, we show how these two principles are fundamentally related: informational efficiency in axons is maximized by minimizing their diameter. This process of axon-minimization introduces a secondary problem, which we address in Section 2.2: the problem of fueling axons that are too thin to physically fit sufficient mitochondria (e.g., Sengupta, Faisal, et al., 2013; Sengupta & Stemmler, 2014). We hypothesize that aerobic glycolysis, which supplies ATP without requiring mitochondria, can solve this secondary problem.
Axon diameters—which range from ~0.1 μm thin to ~10 μm thick—have major implications for their ability to transmit information (Koch et al., 2006; Perge et al., 2009, 2012; Sengupta, Faisal, et al., 2013; Sterling & Laughlin, 2015). Thin axons are relatively more informationally efficient in bits/ATP—getting more informational “bang” per ATP “buck”—whereas thick axons send information relatively faster, both in terms of information rates (bits/sec) and transmission speeds (meters/sec; Table 1; e.g., Caminiti et al., 2013; Innocenti et al., 2014; S. S.-H. Wang et al., 2008). To our knowledge, there is no complete accounting of human or non-human brains in terms of axon diameter (e.g., overall fraction of physical space used by axons of different diameters); however, some studies have provided detailed descriptive statistics for axon diameter distributions within interregional axon tracts (e.g., the optic nerve), and found that the diameter distributions within these tracts skew thin (Figure 4a), especially among unmyelinated fibers (Perge et al., 2009, 2012; S. S.-H. Wang et al., 2008). This means that, even when signals are sent between distant brain regions, the bulk of signaling occurs in relatively thinner, slower, but informationally efficient channels (Perge et al., 2012). Indeed, even in larger-brained animals, where the larger distances to be traversed (e.g., from retina to lateral geniculate nucleus) create a need for thick fast-transmitting axons (S. S.-H. Wang et al., 2008), thin axons still appear to be favored. For example, in a cross-species comparison of the optic nerve (between mice, monkeys, guinea pigs, and humans; Perge et al., 2009) the optic nerve was longest in humans, but contained proportionally more thin, slow, but informationally efficient axons (see Fig. 9a in Perge et al., 2009). However, although thin axons are present in interregional axon tracts, the overall fraction of thin axons throughout the brain is almost certainly dominated by local connections. Thin axon compartments are located throughout the brain in neuropil, and across brain regions neuropil accounts for ~80% of cortical space (e.g., Fig. 3 in Spocter et al., 2012). Throughout the brain, synaptic density in the neuropil contributes far more to glucose metabolism than neuronal density (Y. Yu et al., 2023), meaning that signaling activity within neuropil (e.g., action potentials, synaptic transmission) accounts for a substantial portion of the brain’s already substantial metabolic cost. Within neuropil, neuronal subpopulations may have different metabolic requirements, and we will return to discuss the noteworthy case of thin, highly branched, and most importantly sustained fast-spiking, parvalbumin positive interneurons (Bartos et al., 2007; Stedehouder et al., 2019) in Section 3.1.3. For now, however, it is enough to say that thin axons are an essential component of both local and distal neuronal communication, most likely due to their ability to communicate information efficiently.
Figure 4.

Axon diameters and mitochondrial density. A) Distributions of unmyelinated axon diameters in olfactory receptor fibers, unmyelinated segments of retinal ganglion axons, fornix axons, and parallel fibers in the cerebellum. Mean diameter is at or below 0.3 μm in all tracts, except for the optic nerve, where mean diameter was 0.64 μm (adapted from Fig. 2 in Perge et al., 2012). B) Axon diameter distributions in parvalbumin positive (mean = 0.34 μm, range = 0.16–0.98 μm) and somatostatin positive (mean = 0.30 μm, range = 0.22–0.56 μm) interneuron segments sampled from CA1 in mice (adapted from Figs. 1 & 6 in Stedehouder et al., 2019). C) Slices display the density of mitochondria in cerebellum parallel fibers, olfactory receptor fibers, and unmyelinated segments of retinal ganglion axons (adapted from Fig. 2 in Perge et al., 2012). D) As axon diameters in guinea pig retinal ganglion axons (both myelinated and unmyelinated segments) decrease below 0.7 μm, mitochondrial concentrations decrease also, approaching 0% as axons near the 0.1 μm lower-bound to diameter imposed by channel noise (Figure 3b; Faisal et al., 2005; adapted from Fig. 4 in Perge et al., 2009). Similar drops in mitochondrial concentrations were observed in guinea pigs (Fig. 8 in Perge et al., 2012) in the optic nerve (from retina to lateral geniculate nucleus), the fornix (from hippocampus to mammillary body), and pyramidal tracts (from anterior cerebral cortex to lower medulla and spinal cord).
Thin axons are informationally efficient because at least three things happen within them (for review, see Niven, 2016): (1) repolarization after an action potential costs fewer ATP (Figure 3a), (2) channel noise is greater (e.g., spontaneous firing, Figure 3b; or unreliable spike timing; Faisal & Laughlin, 2007), and (3) their average firing rate is lower (Figure 3c), which decreases the information rate (bits/sec), but increases information transmitted by each spike (bits/spike; Figure 3d). Considered together, these points demonstrate that thin axons send more information per ATP (bits/ATP; Figure 3e). Point (1), that repolarizing thin axons is ATP-cheap, is intuitive: as axon diameter decreases, axon volume decreases as well, meaning small influxes of Na+ more easily influence the membrane voltage and trigger action potentials (Faisal et al., 2005; Sengupta, Faisal, et al., 2013). Consequently, after an action potential, resting membrane potential is more easily restored, as fewer Na+ must be expelled from the cell by Na+/K+ pumps. Thus, in thin axons, triggering action potentials and restoring the resting membrane potential costs fewer ATP per spike (Figure 3a). Point (2), that thin axons increase their rate of noise, follows from the logic above: thin axons are noisy because their small volume makes small random leakages of Na+ into the axon more likely to spontaneously trigger an action potential or disrupt the precision of spike timing (Faisal et al., 2005, 2008; Faisal & Laughlin, 2007)11. Because of this, axons can reach a minimum diameter of ~0.1 μm before noise from spontaneous firing overwhelms their ability to encode a signal (Figure 3b), although the reliability of spike timing begins to deteriorate at diameters < 0.5 μm12. Finally, point (3), that thinner axons have a lower mean firing rate, but transmit more information per spike, follows from the laws of information theory (Shannon & Weaver, 1949/1964; for an accessible summary aimed at neuroscientists, see Stone, 2018, Ch. 2; for a thorough review, see Cover & Thomas, 1991). Information theory describes how a sender transmits a message (which carries information) through a channel to a receiver—e.g., a sender neuron transmits a message through its axon to a receiver neuron. A channel has an upper limit to how much information messages sent through it can carry, a limit called the channel capacity (Cover & Thomas, 1991, Ch. 8; Stone, 2018, Ch. 2). Noise (e.g., non-reproducible patterns of spiking in response to a repeated stimuli) decreases channel capacity, meaning that less information can be sent per unit time (bits/sec; de Ruyter van Steveninck et al., 1997; Strong et al., 1997), and noise increases in axon diameters below 0.5 μm (Faisal et al., 2005, 2008; Faisal & Laughlin, 2007). Because noise imposes an upper limit to how many bits/sec a thin axon can send, principles of information theory would predict that thinner axons decrease their information rate (bits/sec), and that their average13 firing rate would decrease as a consequence (spikes/sec; for an accessible summary of these principles of information theory, see Stone, 2018, Ch. 4). This prediction is confirmed by empirical evidence in retinal ganglion cells, collected under naturalistic conditions (Figure 3c; Perge et al., 2009). Somewhat counterintuitively, however, the laws of information theory also stipulate that rare/surprising messages carry more information (or more specifically, Shannon Information, or surprisal) than common/predictable messages (Cover & Thomas, 1991; Shannon & Weaver, 1949/1964; Stone, 2018)14, meaning that as the average firing rate decreases, information transmitted per spike (bits/spike) increases (Figure 3d; Koch et al., 2006)15. Thus, from (3) we know that thin axons send more information per spike (bits/spike), and from (1) we know that thin axons are cheap to repolarize (in ATP/spike). Combining these observations, we can conclude that thin axons increase informational efficiency (bits/ATP; Figure 3e; Sengupta, Faisal, et al., 2013), as long as spontaneous firing does not overwhelm their ability to transmit a signal—as occurs when they get thinner than ~0.1 μm in diameter (Figure 3b; Faisal et al., 2005). Thin axons, then, are ideally suited to transmit information infrequently, while using ATP efficiently. Next, we turn to how aerobic glycolysis may help fuel axons that are as thin as biophysics allows (i.e., just above the 0.1 μm noise limit).
Figure 3.

Information properties and spiking rates according to axon diameter. A) As axon diameters decrease, the cost per spike (ATP/spike) decreases also. Estimates are the product of simulations across a range of cell-compartment diameters (0.56 μm - 9.77 μm) in simulated axons (adapted from Fig. 3 in Sengupta, Faisal, et al., 2013). Shapes and colors represent the density of voltage-gated ion channels, relative to the Hodgkin-Huxley model of a giant squid axon (Hodgkin & Huxley, 1952). B) As axon diameters decrease to an extreme minimum (< .1 μm), spontaneous action potentials increase exponentially, placing a lower limit on axon diameter (adapted from Faisal et al., 2005). Estimates are the product of simulations using a models of rat pyramidal collaterals and a modified version of the Hodgkin-Huxley model of a giant squid axon (Hodgkin & Huxley, 1952). Increasing temperature suppresses spontaneous action potentials above the lower axon diameter limit (see Faisal et al., 2005). C) As axon diameters decrease, the average firing rate appears to decrease as well, as evidenced by the close overlap in empirical distributions of axon diameters and average firing rates among myelinated ganglion cells recorded in vitro when presented with naturalistic movies (adapted from Fig. 6 in Perge et al., 2009; data collection described in Koch et al., 2006, ganglion preparation described in 2004). This may stem from channel noise increasing in thin axons, placing an upper limit on how much information can be sent (bits/sec; Perge et al., 2012). D) As a consequence of the laws of Information Theory, rare events transmit more Shannon Information (i.e., surprisal; Cover & Thomas, 1991; Shannon & Weaver, 1949/1964; Stone, 2018), meaning that as the average firing rate decreases, bits/spike increases. This is confirmed empirically by comparing the averaging firing rate to spike efficiency (bits/spike—i.e., information rate (bits/sec) divided by average spiking rate (spikes/sec); adapted from Fig. 3 in Koch et al., 2006). E) Combining the observations that thin axons transmit more ATP/spike, and that thin axons also transmit more bits/spike, it follows that thin axons transmit more bits/ATP—i.e., they are informationally efficient. This has been confirmed in simulated axons (adapted from Fig. 3 in Sengupta, Faisal, et al., 2013). Shape/color legend is the same as in panel A.
2.2. Mitochondria for oxphos may set a lower bound on axon diameter and prevent axons from maximizing informational efficiency; aerobic glycolysis may help overcome this problem.
As discussed above, the biophysical properties of channel noise in axons set a lower bound on axon diameter at ~0.1 μm, where informational efficiency is maximized (Section 2.1; see also, Faisal et al., 2008). In this section, we propose that physically fitting the mitochondria needed for oxphos (and the energetic efficiency it provides) into such thin axons might impose yet another limit on axon diameter, which, unless circumvented, would preventing axons from being constructed to approach the lower noise-imposed bound. For example, in the guinea pig optic nerve, axonal mitochondria average ~2.9 μm long and ~0.22 μm wide (Perge et al., 2009, p. 7919), nearly twice as wide as the 0.1 μm lower-bound on axon diameter imposed by channel noise. Thus, fitting the mitochondria necessary for oxphos into thin axons could be like fitting “a pig in a boa constrictor” (Perge et al., 2012, p. 630). There is a potential conflict, then, between maximizing informational efficiency by making axons thin, and making axons large enough to fit the mitochondria needed for energetically efficient oxphos.
Aerobic glycolysis may solve this conflict in thin axons (and other small cellular compartments; see footnote 10) by avoiding the use of mitochondria altogether, instead producing ATP using enzymes in the cellular and axonal cytosol. That is, aerobic glycolysis may allow axons to be made nearly as thin as the constraints of channel noise allow (Figure 4a), while circumventing the secondary constraint on axon diameter posed by fitting mitochondria into them. Other potential solutions might permit oxphos to occur in thin axons, but these solutions are unsatisfactory on closer examination. For example, one might hypothesize that thin axons still fuel themselves by oxphos, but just use fewer mitochondria to do it—that is, distributing a few bulky mitochondria throughout the axon might allow ATP to be distributed by diffusion (as occurs in synaptic boutons that lack mitochondria; Kuznetsov & Kuznetsov, 2023; Pathak et al., 2015) while allowing axon diameter to approach the 0.1 μm lower-bound along most of its length. Alternatively, one might hypothesize that mitochondria migrate to where they are needed (e.g. by microtubule tracts; J. J. Harris et al., 2012; MacAskill et al., 2010; Sheng & Cai, 2012; for review, see Sheng, 2017), or congregate in synapses, since synaptic transmission is one of the largest costs of signaling (Y. Yu et al., 2018). These solutions may work when energy costs are localized (e.g., at synapses, or nodes of Ranvier), but if energy costs are diffused across the entire cellular membrane—as they are for Na+/K+ repolarization in unmyelinated, thin, highly-branched axons (e.g., fast-spiking parvalbumin positive interneurons; which we address in Section 3.1.3)—then ATP-diffusion or mitochondrial migration are unlikely to suffice. Indeed, simulations across a range of axon diameters suggest that “even after assuming that the entire cell is packed with mitochondria” (Sengupta & Stemmler, 2014, p. 741) the energy requirements of Na+/K+ pumps at peak firing would be under-fueled by “approximately an order of magnitude” (Sengupta, Faisal, et al., 2013, p. 1472). If oxphos alone fueled neuronal firing, then the peak firing rate could not be fueled—in thick axons or in thin ones16.
2.2.1. Aerobic glycolysis fuels informationally efficient thin axons at the cost of energetic efficiency: The efficiency tradeoff hypothesis.
The efficiency tradeoff hypothesis proposes that informational efficiency is more important to brain design than the local ATP yield per glucose. Consistent with this, aerobic glycolysis may support informational efficiency at the expense of energetic inefficiency. Thus, we hypothesize that aerobic glycolysis allows axons to fuel peak firing while still being constructed to be as thin and informationally efficient as possible. On this hypothesis, oxphos remains the primary source of ATP in the brain, but aerobic glycolysis may provide supplemental ATP in small cellular compartments (with thin axons being a prominent example; but see footnote 10). Consistent with this hypothesis, thin axons show lower concentrations of mitochondria, as evidenced by electron microscopic observations from multiple tracts, showing that mitochondrial concentration decreases in thin axons and approaches 0% in axons near the lower limit imposed by noise (Figure 4d; adapted from Perge et al. 2009; see also Fig. 8b in Perge et al., 2012). Further, in vivo evidence demonstrates that stimulation-based aerobic glycolysis even occurs in the presence of mitochondria in neuron cell bodies, (Díaz-García et al., 2017; Díaz-García & Yellen, 2019) and in presynaptic terminals (Ashrafi & Ryan, 2017)—and it follows that if aerobic glycolysis occurs in neuronal regions where mitochondria are concentrated (i.e., where glycolysis is not the primary source of ATP), then it likely also occurs in ultra-thin axons where mitochondria are nearly absent (e.g., in neuropil, which takes up the majority of physical space in gray matter; Spocter et al., 2012; and which accounts for the majority of regional glucose metabolism at “rest”; Y. Yu et al., 2023). Thin axons, then, may use a combination of oxphos and aerobic glycolysis to meet the ATP costs of signaling, and, as axons become increasingly thin, the physical constraints likely force aerobic glycolysis to be increasingly favored. In these conditions, the energetic efficiency of glucose metabolism will decrease locally (but not globally, as lactate exported into the bloodstream can be used for oxphos or gluconeogenesis downstream; Figure 1), but, as a consequence, informational efficiency will be maximized17.
The efficiency tradeoff hypothesis provides a functional account of aerobic glycolysis, but does not yet explain stimulation-based aerobic glycolysis—i.e., why aerobic glycolysis in thin axons would increase during task-based stimulation. The next section begins to address this, by discussing how the temporal properties of aerobic glycolysis may also complement oxphos—providing ATP not just where it is needed, but when it is needed too.
2.3. Quickly fueling rapid-on/rapid-off “peaking” energy demands: An advantage of stimulation-based aerobic glycolysis.
If aerobic glycolysis helps supply energy to informationally efficient axons that are too thin to physically fit mitochondria (or in other brain structures that do not have access to mitochondrially-derived ATP), then the remaining question is: why does aerobic glycolysis increase during task-based stimulation? A more complete answer to this question will be developed in Section 3, where we discuss the empirical evidence for changes in blood flow in the brain (i.e., BOLD fMRI) during task-based stimulation (sometimes called brain “activity”). However, first it is worth describing the temporal properties of aerobic glycolysis and its potential advantage for responding to the rapid fluctuations in energetic demand that could coincide with task-based stimulation. Yellen, for example, hypothesized that stimulation-based aerobic glycolysis may be used by the brain “as a low-capacity but [temporally responsive] mechanism for ATP production … as argued for fast-twitch skeletal muscle” (emphasis added; Yellen, 2018, p. 2238)18. The “low-capacity” qualification is important: net-ATP production from glycolysis will be outpaced by even a small increase in oxphos (Section 1.4); but, because glycolysis occurs in cytosol “an advantage of glycolysis is [temporally responsive] production of ATP at subcellular sties with high ATP turnover (e.g., plasma membrane ion pumps)” (Dienel, 2019, p. 958). For example, when decapitation in rats deprives the brain of oxygen, the rate of glycolysis increases over seven-fold after 4 seconds, demonstrating that glycolysis has a high capacity for upregulation (Lowry et al., 1964). By contrast, the dynamic range of brain oxygen metabolism is several times smaller than other energetically expensive organs (e.g., the heart) and as brain oxygen metabolism increases, its rate of extraction from the blood decreases (for discussion, see Buxton, 2021, p. 10). Thus, the temporal responsivity and capacity for upregulation in glycolysis could clarify why it is upregulated under aerobic conditions relative to oxphos during stimulation—i.e., in addition to the spatial advantage of glycolysis discussed above, glycolysis may also be spatiotemporally positioned to respond to rapidly changing energetic needs, despite oxphos producing more energy per unit time.
We hypothesize that brain design makes use of the distinct advantages and disadvantages of glycolysis and oxphos. This use would be consistent with principles of civil engineering, which address a similar problem of fueling city electrical grids in the face of energy demands that fluctuate over time. In city electrical grids, energy demands fluctuate in predictable and unpredictable ways, and energy sources with different temporal properties are used in combination to ensure that fluctuating energy demands are quickly met (Epstein et al., 2017; Kaplan, 2008). In brain cells, energy demands from incoming signals also fluctuate unpredictably (from the perspective of a local population of neurons and glia). If energy demands on local populations of neurons and glia can rapidly change, then a temporally-responsive source of ATP, like glycolysis, can help to: (a) ensure that energy is not undersupplied during sudden, unpredictable increases in demand, (e.g., where oxphos may respond too slowly to sudden increases in signaling costs; Bangsbo et al., 2000; Grassi et al., 1996), and (b) ensure that energy is not oversupplied when energy demands suddenly end (i.e., where excess ATP must be stored or wasted)19. In engineering and in neural design, the goal is not to favor energetic efficiency at all costs, but rather, to ensure that energy production does not lag or outpace energy demand, even if the face of predictable and unpredictable variation in those demands.
One solution to this problem, used by civil engineers, is to use a combination of peaking generators (more temporally-responsive, but less fuel-efficient) and baseload generators (less temporally responsive, but more fuel-efficient; Kaplan, 2008; Figure 5). For example, in a city, average energy demands change predictably throughout the day, and baseload energy production can be prepared to meet these slow demand changes within a typical range (e.g., using a coal/nuclear power plant). But, because demand cannot be perfectly predicted, the grid must be robust to occasional unpredictable rapid-on/rapid-off spikes (e.g., during a heat wave many people may suddenly draw on the power grid at once), and peaking generators (e.g., gas-powered turbines) help supply match demand during these spikes. Others, in the context of cancer cells, have applied these principles of mixing peaking and baseload generators to aerobic glycolysis and oxphos (Epstein et al., 2017), and here we simply point out that the hypothesis can be plausibly extended to brain metabolism: just as every neighborhood in a city does not need its own nuclear power plant, every axon segment (or other small compartment; e.g., in glial cells) may not require or even benefit from its own mitochondrion. Oxphos almost certainly satisfies baseload metabolic demands, but glycolysis, by rapidly scaling ATP production, is well-suited to act as a peaking generator20—and when local energy demands suddenly spike, one would expect to observe stimulation-based aerobic glycolysis (i.e., a stimulation-elicited relative increase in glycolysis, the peaking generator, over oxphos, the baseload generator). Further, in the brain this strategy is even more fuel-efficient then in city infrastructure: as previously discussed, waste from glycolysis (i.e., lactate) can be recycled and reused in peripheral organs (unlike waste from gas-powered turbines), meaning that metabolism can be kept fuel-efficient at the level of the whole organism.
Figure 5.

Energy supply and demand in electrical grids and their neural analogues. Baseload demands are constant (i.e., an energetic floor), and are met by fuel-efficient but relatively slow-responding generators. Peaking demands (not drawn to scale) are brief, localized, unpredictable spikes in demand, and are met by fuel-inefficient but temporally-responsive generators. This division of energy production helps satisfy rapidly fluctuating and unpredictable energy demands, while avoiding problems of under/oversupply that would result from using baseload generators alone (as excess energy would need to be wasted or stored). Although unpredictable fluctuations in energy demands are met by peaking generators, predictable fluctuations can potentially be satisfied by intermediate energy sources, which scale energy production more slowly, but remain fuel-efficient. A discussion of intermediate energy sources in neurons goes beyond our scope, but would likely incorporate mitochondrial movement within cells (J. J. Harris et al., 2012; MacAskill et al., 2010; Sheng & Cai, 2012) and, at a larger scale, energetic tradeoffs between organs and systems within an organism (e.g. as regulated by circadian rhythm; Sterling & Laughlin, 2015; Weibel, 2000). Figure adapted from Epstein et al. (2017).
This hypothesis—that a combination of oxphos and glycolysis meet unpredictable and rapidly fluctuating brain-based metabolic demands—aligns nicely with the efficiency tradeoff hypothesis, where aerobic glycolysis is thought to facilitate the minimization of axon diameter in pursuit of informational efficiency. These hypotheses are also linked by the observation that thin axons engage in high-frequency burst-firing, which produces the unpredictable, rapid-on/rapid-off energetic demands that we hypothesize glycolysis is well-suited to handle. Burst-firing neurons alternate between periods of inactivity and high-intensity firing, meaning that such neurons must quickly transition energy production from conditions of rest to conditions of intense activity. For example, granule cells in the cerebellum (which have parallel fibers, some of the thinnest axons in the brain; Perge et al., 2012) are generally inactive (with average firing rates of less than 0.5 Hz), but occasionally transmit information in high-frequency bursts, with instantaneous firing frequencies estimated at 300–400 Hz (Ruigrok et al., 2011). Likewise, fast-spiking parvalbumin positive (FSP+) interneurons, located throughout the cortex (Bartos et al., 2007; although regional differences in their concentration have been reported, e.g., Dombrowski et al., 2001) and fire at rates >100 Hz when stimulated (Hollnagel et al., 2020; Hu et al., 2018). The axons of FSP+ interneurons are thin (in mouse medial prefrontal cortex: mean diameter = 0.34 μm, range = 0.16–0.98 μm; Stedehouder et al., 2019), although not thinner than axons in other interneurons (e.g., somatostatin expressing interneuron in mouse medial prefrontal cortex: mean diameter = 0.30 μm, range = 0.22–0.56 μm; Stedehouder et al., 2019; Figure 4c). More importantly, however, FSP+ axons fire at high rates without habituation (B. W. Connors & Gutnick, 1990; Markram et al., 2004), meaning that their thin diameter facilitates information efficient signaling, but their sustained high rate of fire introduces a considerable ATP cost (Kann, 2016), which we hypothesize is best conceptualized as a peaking cost to be fueled by a peaking generator (i.e., glycolysis; Figure 5). The hypothesis that stimulation-based aerobic glycolysis supports the peaking demands of high-frequency signaling is consistent with two recent pieces of evidence: (1) that FSP+ interneurons are incapable of maintaining high-frequency signaling in a lactate-only environment (i.e. when glycolysis is blocked, and oxphos is the sole source of ATP; Hollnagel et al., 2020), and (2) that optogenetic stimulation of FSP+ interneurons does not increase the local rate of oxygen metabolism (Vo et al., 2023), despite sustained high-frequency firing constituting a significant energetic demand (Kann, 2016). Critically then, high-frequency firing in FSP+ interneurons appears to require glucose for normal functioning (a topic we return to in Section 3.1.3). Thus, glycolytic peaking generators may be a critical component of the energetic infrastructure that supports neuronal signaling. The use of glycolysis for fueling the peaking demands of high-frequency signaling is consistent with the efficiency tradeoff hypothesis, and may help clarify why aerobic glycolysis occurs after task-based stimulation.
2.4. Summary.
The efficiency tradeoff hypothesis suggests that informationally efficient neuronal signaling necessarily comes at a cost to the energetic efficiency of glucose metabolism. It can be summarized as follows:
The brain evolved to be information-efficient (in bits/ATP), but a tradeoff occurs in very thin axons (and possibly other small cellular compartments). Thin axons are information-efficient, but their small diameter prevents them from physically fitting the mitochondria necessary to fuel themselves by energy-efficient oxphos alone. Aerobic glycolysis, which occurs in the cytosol and has a small physical footprint, resolves this dilemma, and may also act as a peaking generator to supplement ATP (in excess of baseload oxphos) during infrequent spikes in neuronal energetic demand.
The efficiency tradeoff hypothesis draws a link between aerobic glycolysis and axon biophysics, which is important given that the vast majority of the brain’s energy budget is devoted to fueling neuronal signaling (Y. Yu et al., 2018). Even more importantly, the efficiency tradeoff hypothesis offers a potential solution to the functional puzzle of stimulation-based aerobic glycolysis21.
With the solution to the metabolic puzzle in place, we now shift focus to the paradigm of interpreting BOLD functional neuroimaging. Specifically, we will use the efficiency tradeoff hypothesis to clarify the interpretation of increases in BOLD signal intensity as brain “activity”. In opposition to the traditional view, where “functional MRI signals are presumed to result from changes in the activity of the neuronal populations responsible for the functions in question (for example, stimulus- or task-selective neurons)” (Logothetis, 2008, p. 875), we instead hypothesize that BOLD signal intensity increases index stimulation-based aerobic glycolysis, and that stimulation-based aerobic glycolysis supports a specific component of information processing, namely what has been variously called bottom-up, feedforward, or prediction-error signaling.
3. Extending the efficiency tradeoff hypothesis to reinterpret BOLD “activity”.
The BOLD signal is one of the most widely used measures in functional neuroimaging. Task-based stimulation elicits localized increases in BOLD signal intensity (relative to a “resting state” baseline). Such BOLD responses are produced by an oversupply of oxygen to “activated” brain regions, called the hemodynamic response (Kwong et al., 1992; Ogawa et al., 1990, 1992). Generally, BOLD signal intensity increases are interpreted as a measure of local “activation”. The metaphor of “activation” implies that an “active” brain region implements its function (i.e., that a region is “turned on”) and this metaphor has colored the interpretation of BOLD functional MRI data, even as many have cautioned against it (e.g., Goyal & Snyder, 2021; Logothetis, 2008; Singh, 2012). We propose that this “activation”-based interpretation of the BOLD response obscures the more fundamental question of why task-based stimulation produces the hemodynamic, electrophysiological, and metabolic changes that correlate with and comprise the BOLD response in the first place.
Increases in BOLD signal intensity (as opposed to decreases in BOLD signal intensity; see footnote 22) are closely related to stimulation-based aerobic glycolysis (Buxton, 2021; Logothetis & Wandell, 2004; B. L. Tang, 2018); but, because there was no prior consensus about the function of stimulation-based aerobic glycolysis, the functional significance of this relationship has generally remained underexplored. The efficiency tradeoff hypothesis, introduced above, proposes that stimulation-based aerobic glycolysis provides ATP when and where it is needed (i.e., in small cellular compartments, such as thin axons lacking mitochondria; Figure 4d). The efficiency tradeoff hypothesis can help to clarify why this relationship—between BOLD signal intensity increases and stimulation-based aerobic glycolysis—exists, and why it matters. In this section we will review several interlinking lines of evidence (see Figure 6), which suggest that (a) BOLD signal intensity increases are an approximate index of stimulation-based aerobic glycolysis (Section 3.1), and (b) that stimulation-based aerobic glycolysis likely supports one particular component of signal processing, which has been called bottom-up encoding, or more recently, prediction error encoding in increasingly influential predictive processing models of the brain (Section 3.2; e.g., Barrett & Simmons, 2015; Clark, 2013; Friston, 2010). Taken together, these two threads of evidence lead to one conclusion: that the “activation”-based interpretation of BOLD fMRI obscures important and computationally-relevant details, and that an alternative could replace it. This section aims to develop that alternative, and develops the hypothesis that BOLD signal intensity increases are an approximate index of prediction-error encoding—i.e. the BIAPEM (BOLD increases approximate prediction error metabolism) hypothesis.
Figure 6.

Multiple lines of evidence relating the efficiency tradeoff hypothesis and BOLD signal intensity increases to prediction error encoding. Each line represents the presence of empirical evidence, to be discussed in Sections 3.1–3.2. Topics are organized (from left to right) as properties of biological implementation, as measurements across biological phenomena, and as accounts of neural computation. Missing links implicitly suggest the possibility of novel, unobserved empirical relationships, e.g., linking increases in BOLD signal intensity to firing in small diameter axons or to prediction error.
3.1. Task-based stimulation elicits an interconnected set of localized hemodynamic, metabolic, and neuroelectrical responses in the brain.
Following task-based stimulation, hemodynamic, metabolic, and neuroelectric changes occur throughout the brain. These changes are correlated, and are all affected in common by neuromodulatory (e.g., norepinephrine) action. In addition, stimulation-based changes in local neuroelectric activity depend on populations of small-diameter axons that would be well-positioned to benefit from stimulation-based aerobic glycolysis and the efficiency tradeoff hypothesis, as described in Section 2. This section systematically reviews these interconnecting lines of evidence. It first addresses the strong correlation between the BOLD signal intensity increases and stimulation-based aerobic glycolysis (Section 3.1.1), and then addresses the modulation of both these measures by norepinephrine (Section 3.1.2). Next, it reviews the relationship between these topics and well-known task-elicited increases in high-frequency localized neuroelectric activity (i.e., gamma oscillations; Section 3.1.3). Because the neuronal mechanisms for gamma oscillations are better understood (Buzsáki & Wang, 2012), links through gamma oscillations allow us to propose that stimulation-based aerobic glycolysis likely fuels firing in particular populations of interneurons—connecting a prior hypothesis on the origins of the BOLD response in interneuron signaling (Niessing et al., 2005, p. 951) to the evidence for stimulation-based aerobic glycolysis and the efficiency tradeoff hypothesis. In sum, this section sets the stage for a reinterpretation of the meaning of the BOLD response by showing the interconnected nature of stimulation-elicited changes in hemodynamics, metabolism, and neuroelectrical activity.
3.1.1. Stimulation-based aerobic glycolysis cooccurs with BOLD signal intensity increases.
After sensory stimulation (or performance in a cognitive task), both stimulation-based aerobic glycolysis and an increase in BOLD signal intensity occur. Both involve a measured variable decoupling from local cerebral oxygen consumption (CMRO2). BOLD signal intensity increases involve hemodynamic decoupling, during which CBF increases relative to CMRO2 (i.e., the hemodynamic response). This hemodynamic decoupling produces a relative increase in local oxygenated blood that can be detected by MRI (Davis et al., 1998; Fox et al., 1988; Fox & Raichle, 1986; Herculano-Houzel & Rothman, 2022; S. G. Kim et al., 1999; for review, see Paulson et al., 2010)22. Stimulation-based aerobic glycolysis involves metabolic decoupling, during which CMRglc increases relative to CMRO2. Metabolic decoupling can be detected using the methods reviewed in Section 1.3. Critically, CBF and CMRglc generally remain coupled during task-based stimulation despite both measures decoupling from CMRO2 (Gur et al., 2009; Nakao et al., 2001; Sakurada et al., 1978; Sokoloff et al., 1977; see Fig. 3.15 in Dienel, 2014), meaning that local glucose consumption generally keeps pace with the increase in local cerebral blood flow. For example, as discussed in Section 1.4, in a seminal functional neuroimaging study Fox and colleagues used PET imaging to show that a simple visual task (i.e., a checkerboard flickering at 10 Hz) increased both CMRglc and CBF in primary visual cortex by ~50%, and that the same stimulation increased CMRO2 by only ~5% (Figure 7; Fox et al., 1988). The coupling between CBF and CMRglc means that, when sensory stimulation increases local cerebral blood flow, glucose delivered by that increase in blood flow is consumed at the same proportional rate as before the stimulation occurred (for review, see Herculano-Houzel & Rothman, 2022)23—whereas oxygen is delivered in excess of what is locally consumed (producing the BOLD signal intensity increase). Thus, the hemodynamic response is correlated with a local increase in stimulation-based aerobic glycolysis. Additional evidence that BOLD signal intensity increases index stimulation-based aerobic glycolysis comes from the observation that BOLD signal intensity and local lactate (a measure of stimulation-based aerobic glycolysis) are strongly correlated across subjects (Bednařík et al., 2015). Thus, even though BOLD-based methods of fMRI cannot directly observe metabolic decoupling, a considerable body of evidence suggests that hemodynamic and metabolic decoupling are closely linked (for notable exceptions to this, which we address in footnote 39, see DiNuzzo et al., 2022; Koush et al., 2021; Stiernman et al., 2021).
Figure 7.

Fox and colleagues (1988) (a) presented participants with a flickering checkerboard pattern and (b) measured cerebral blood flow (CBF), glucose use (CMRglc), oxygen use (CMRO2), and oxygen availability (which produces the positive BOLD signal) using PET imaging. CMRglc and CMRO2 were collected in separate samples. In visual cortex, CMRglc and CBF both increased by ~50%, whereas CMRO2 only increased by ~5%. The data indicates the mutual presence of two forms of decoupling: hemodynamic and metabolic decoupling. Hemodynamic decoupling, between CBF and CMRO2, causes local oxygenated hemoglobin to increase during “activation” and makes BOLD neuroimaging possible (Ogawa et al., 1990, 1992). Metabolic decoupling, between CMRglc and CMRO2 is the primary measure of aerobic glycolysis, and indicates the presence of stimulation-based aerobic glycolysis as participants observed the checkerboard. Figure reprinted from Raichle and Mintun (2006).
Prior work has aimed to address the function of hemodynamic decoupling, but has generally paid less attention to the function of metabolic decoupling (which we addressed in Section 2). On its face, hemodynamic decoupling might seem metabolically inefficient: it appears to supply “activated” brain regions with more oxygen than they need. However, this overdelivery of oxygen has a function: due to physical limits on the perfusion of oxygen through capillary beds, overdelivering oxygen helps diffuse it efficiently through the tissue surrounding capillaries (Buxton et al., 1998; Buxton & Frank, 1997; Herculano-Houzel & Rothman, 2022; Hyder et al., 1998). This suggests that—even though “active” brain region consume a smaller proportion of the oxygen delivered to them—at the cellular level oxygen is still consumed as fast as it is delivered (Herculano-Houzel & Rothman, 2022), and experimental evidence manipulating pO2 in ex vivo slice preparations supports this conclusion (e.g., Ivanov et al., 2014; Schneider et al., 2019). At the same time, the fact remains that CMRglc does outpace CMRO2 during local “activation”, and the need for a functional understanding of stimulation-based aerobic glycolysis has sometimes been downplayed, given that even large increases in aerobic glycolysis produce a relatively small increase in net-ATP (compared to the ATP produced by even a small stimulation-based increase in CMRO2; Buxton, 2021). But the fact that “active” brain regions consume glucose excessively for a such a small yield of ATP makes the function of stimulation-based aerobic glycolysis even more puzzling, not less24. We proposed a function for metabolic decoupling in Section 2: the efficiency tradeoff hypothesis proposed that stimulation-based aerobic glycolysis supplies ATP when and where it is needed, in small cellular compartments that cannot physically fit enough mitochondria to fuel rapid-on/rapid-off signaling by oxphos alone. Thus, the function of both task-based metabolic and task-based hemodynamic decoupling can be understood at the cellular level; but the question remains: why does task-based stimulation elicit this decoupling in the first place? Should metabolic and hemodynamic decoupling be interpreted as a measure of local “activation”, or is there an alternative? We return to this question of interpretation in Section 3.2, after first providing additional evidence for the close relationship between hemodynamic and metabolic decoupling. The next section reviews evidence that the neuromodulatory action of norepinephrine amplifies both decoupling events.
3.1.2. Norepinephrine influences both BOLD signal intensity increases (i.e., hemodynamic decoupling) and stimulation-based aerobic glycolysis (i.e., metabolic decoupling).
When an organism is surprised (e.g., by sharp pain, by a disturbing image), norepinephrine is released by the locus coeruleus, a brainstem nucleus. Projections from the locus coeruleus deliver norepinephrine to most of the brain (L. W. Swanson & Hartman, 1975), and it has been proposed that norepinephrine modifies the gain on neural “activity”, enhancing neuronal signaling in highly “active” brain regions, and suppressing neuronal signaling in less “active” regions (Mather et al., 2016).
As discussed in Section 3.1.1, “activity” in functional neuroimaging typically refers to the correlated events of hemodynamic and metabolic decoupling. Both hemodynamic decoupling and metabolic decoupling are modulated by the action of norepinephrine. Norepinephrine affects hemodynamic decoupling by creating BOLD “hot spots”, where positive feedback amplifies hemodynamic decoupling in highly “active” regions, and negative feedback suppresses hemodynamic decoupling in less “active” regions (Hermans et al., 2011; Mather et al., 2016; Strange & Dolan, 2007). The molecular mechanism responsible for such BOLD “hot spots” involves feedback effects of norepinephrine on β-adrenoreceptors. In the positive feedback loop, “active” regions are made more “active” though a cascade of neurochemical effects: (a) neuronal firing increases local concentrations of glutamate; (b) high concentrations of glutamate trigger additional the release of norepinephrine; (c) high concentrations of norepinephrine active β-adrenoreceptors (Ramos & Arnsten, 2007); and (d) active β-adrenoreceptors further amplify glutamate release, which continues the cycle of positive feedback. In the negative feedback loop, weakly “activated” regions become less “active” through low concentrations of norepinephrine activating α2-adrenoceptors that inhibit glutamate release (Bickler & Hansen, 1996; Egli et al., 2005), which, in turn, helps prevent local norepinephrine concentrations from passing the threshold necessary activate β-adrenoreceptors and engage the positive feedback loop. Critically, norepinephrine also affects metabolic decoupling (i.e., stimulation-based aerobic glycolysis), and appears to do so through the same molecular mechanism that affects hemodynamic decoupling (i.e., β-adrenoreceptors). When a drug blocking norepinephrine from binding to β-adrenoreceptors is administered (propranolol), stimulation-based aerobic glycolysis is blocked (for review, see Dienel & Cruz, 2016)—both in rats being abruptly removed from shelter (Schmalbruch et al., 2002) and in humans performing exhaustive exercise (Dalsgaard, Ogoh, et al., 2004)25. Taken together, this evidence suggest that norepinephrine has similar effects on hemodynamic and metabolic decoupling, providing additional evidence for the proposal that they reflect closely related processes. Additional evidence for the close relationship between hemodynamic decoupling and metabolic decoupling, as well as the neuromodulatory effects of norepinephrine, comes from the relation of all three phenomena to gamma oscillations, which we review next.
3.1.3. The relation of gamma oscillations to BOLD signal intensity increases (i.e., hemodynamic decoupling) and stimulation-based aerobic glycolysis (i.e., metabolic decoupling).
Electroencephalography (EEG) activity, measured from the scalp or from implanted electrodes (e.g., during pre-surgical preparation in humans), can be grouped into frequency bands that have specific properties of interest (for review, see Buzsaki, 2004). Gamma-band oscillations are high-frequency oscillations (30–100 Hz; Jensen et al., 2019; Tallon-Baudry & Bertrand, 1999) and arise in patches of cortex from mutual inhibition among interneurons and from their interactions with excitatory pyramidal neurons (for review, see Buzsáki & Wang, 2012; Cardin et al., 2009; Sohal et al., 2009). Critically, gamma oscillations are related to both hemodynamic and metabolic decoupling. In brief, gamma oscillations (a) are positively correlated with BOLD signal intensity increases (i.e., hemodynamic decoupling); (b) are specifically dependent on glucose for fuel, which suggests that they are functionally related to metabolic decoupling; (c) are modulated by the action of norepinephrine, consistent with norepinephrine’s modulatory effects on both hemodynamic and metabolic decoupling (as reviewed in Section 3.1.2); and (d) are produced by identifiable populations of neurons—fast-spiking parvalbumin positive (FSP+) interneurons—that have many thin highly-branched axons, consistent with our efficiency tradeoff hypothesis (Section 2). With this evidence in hand, we can extend the general principles introduced in the efficiency tradeoff hypothesis, to hypothesize that stimulation-based aerobic glycolysis fuels signaling in particular subpopulations of interneurons.
The relationship between hemodynamic decoupling and gamma oscillation intensity (i.e., gamma power) has been well-established, using both intracortical and extracortical EEG (Conner et al., 2011; Lachaux et al., 2007; Logothetis et al., 2001; Mukamel et al., 2005; Niessing et al., 2005; Nir et al., 2007; Scheeringa et al., 2011; Zaehle et al., 2009)26. For example, in a classic study, Logothetis and colleagues combined intracortical microelectrode recordings (which are more spatially precise than EEG) with BOLD imaging to measure the effect of simple visual stimuli (rotating checkerboards) in the primary visual cortex of monkeys (Logothetis et al., 2001). Their major finding was that hemodynamic decoupling was associated with neuroelectrical signals that reflect input and local processing (i.e., local field potentials; as opposed to output, which is indicated by multi-unit activity); however, they also observed that stimulus-elicited local field potentials were strongest in the gamma-band, and that this increase in gamma power was sustained for the duration of stimulus presentation. Later work, in the visual cortex of anesthetized cats, demonstrated that, when stimuli intensity was varied across trials, the magnitude of stimuli-elicited BOLD signal intensity increases were correlated with stimuli-elicited gamma power (Niessing et al., 2005), and this result has since been replicated in humans using simultaneous BOLD and extracortical EEG (Scheeringa et al., 2011). By contrast, other frequency bands of neuroelectrical activity, such as alpha (8–12 Hz) and beta (14–30 Hz) oscillations, show a negative relationship with BOLD signal intensity (e.g. Conner et al., 2011; Scheeringa et al., 2011). Thus, evidence strongly suggests that hemodynamic decoupling is particularly associated with gamma oscillations.
To our knowledge, no work has directly tested the relationship between metabolic decoupling (i.e., stimulation-based aerobic glycolysis) and gamma power. However, recent evidence that gamma oscillations require glucose is strongly suggestive that such a relationship exists. For example, immersing hippocampal slices in environments that replace glucose with pyruvate or lactate (i.e., environments where glycolysis cannot occur) attenuates population spiking (Bachelard et al., 1984; D. W. G. Cox & Bachelard, 1982, 1988a, 1988b; Ivanov et al., 2014; Kanatani et al., 1995), with gamma-band activity being particularly affected by the absence of glucose (Galow et al., 2014; Hollnagel et al., 2020)27. This evidence suggests that high-frequency, gamma-band oscillatory activity requires that some of its ATP be supplied by glycolysis (which uses glucose), and that ATP supplied by oxphos (which uses pyruvate/lactate) cannot act as a complete substitute. Given this, it is reasonable to hypothesize that increases in local gamma power should correlate with increases in local glucose consumption28—i.e., that gamma power increases should correlate with metabolic decoupling.
Just as norepinephrine modulates hemodynamic and metabolic decoupling (Section 3.1.2), norepinephrine also modulates gamma oscillations (through β-adrenoreceptors, as in hemodynamic/metabolic decoupling; Gire & Schoppa, 2008; Haggerty et al., 2013; Marzo et al., 2014). Norepinephrine, at high concentrations (where there will be specific binding to β-adrenoreceptors), produces BOLD “hot spots” in the cortex (Section 3.1.2); but high concentrations of norepinephrine also produce localized increases in gamma power that correspond with those “hot spots” (see Section 7.1 in Mather et al., 2016). Likewise, low concentrations of norepinephrine (where it primarily binds to α1-adrenoreceptors), decrease gamma power (Haggerty et al., 2013; Mather et al., 2016)—analogous to the effects of norepinephrine on hemodynamic decoupling. Thus, in addition to affecting hemodynamic and metabolic decoupling, norepinephrine affects gamma oscillations through concentration-dependent effects on specific adrenoreceptor populations.
Finally, the efficiency tradeoff hypothesis (Section 2) proposed that stimulation-based aerobic glycolysis (i.e., metabolic decoupling) provides ATP in thin, rapidly-firing axons that cannot physically fit enough mitochondria to fuel neuronal signaling by oxphos alone. Here, we propose an additional hypothesis: that stimulation-based aerobic glycolysis fuels the neuronal signaling responsible for producing gamma oscillations. Consistent with this hypothesis, gamma oscillations depend on specific subpopulations of thin, rapidly-firing inhibitory interneurons, called fast-spiking parvalbumin positive (FSP+) basket cells (Bartos et al., 2007). These FSP+ interneurons generate gamma-band EEG activity through their own firing, and through their interactions with pyramidal cells (Buzsáki & Wang, 2012). FSP+ interneurons are highly branched, have thin axons (averaged at 0.34 μm, and decreasing with branch order; Stedehouder et al., 2019), typically target >1000 pyramidal cells each (Cobb et al., 1995; Sik et al., 1995), and fire at rates >100 Hz in response to stimulation (Hollnagel et al., 2020; Hu et al., 2018)29. Most importantly for our hypothesis, FSP+ interneurons maintain this high rate of firing without habituation (B. W. Connors & Gutnick, 1990; Markram et al., 2004)—a property that both carries considerable ATP costs (Kann, 2016), and that would require a sustained and sizable rate of glucose consumption if aerobic glycolysis were to supply a significant fraction of that ATP (consistent with prior work showing that gamma oscillations specifically depend on glucose; Galow et al., 2014; Hollnagel et al., 2020). This hypothesis is not intended to suggest that FSP+ interneurons do not use oxphos—indeed, FSP+ axons contain relatively larger and more numerous mitochondria (compared to pyramidal cells and other interneurons), which are enriched with proteins that increase the capacity for oxphos (e.g. cytochrome c; Gulyás et al., 2006; Takács et al., 2015; for review, see Kann, 2016). However, these mitochondria may help oxphos in FSP+ interneurons meet an elevated baseload demand (Figure 5), with glycolysis remaining necessary to fuel the intense peaking demands of high frequency gamma-band signaling (Kann, 2016). The efficiency tradeoff hypothesis proposed that stimulation-based aerobic glycolysis fuels signaling in thin, rapidly-firing axons, and FSP+ interneurons have properties that make them particularly likely to benefit from the functional advantages of stimulation-based aerobic glycolysis we have reviewed.
This hypothesis—that metabolic decoupling (and the hemodynamic decoupling that correlates with it) is related to a rapid and sustained increase in FSP+ interneuron firing—is not entirely new. Prior work concluded that hemodynamic decoupling stems from local perisynaptic activity (Logothetis et al., 2001; for review, see Logothetis, 2008)—i.e., synapses, small glial compartments, and thin local axonal connections that comprise the neuropil30. Likewise, Niessing and colleagues (Niessing et al., 2005), upon observing the close relationship between hemodynamic decoupling and gamma-band power, proposed “that the hemodynamic responses associated with gamma oscillations are mainly initiated by the firing of inhibitory interneurons”, adding that “although inhibitory interneurons constitute only about 20% of the cortical neurons, it is likely that they substantially contribute to local energy consumption.” (Niessing et al., 2005, p. 951)31. What is novel about our hypothesis is that we propose that this increase in local energy consumption is met, in part, by stimulation-based aerobic glycolysis in FSP+ interneurons. An observed increase in CMRglc and lactate concentration after optogenetic stimulation of FSP+ interneurons would be positive evidence for this hypothesis, but to our knowledge this has not yet been tested. However, recent work has shown that FSP+ optogenetic stimulation elicited a decrease in CMRO2 (Vo et al., 2023), which is consistent with our hypothesis, and also surprising given the well-known high energy demands of active FSP+ interneurons (Kann, 2016). Although FSP+ interneurons do not directly release vasoactive messengers responsible for inducing the hemodynamic response, they interact with other interneurons that do (Vo et al., 2023). Importantly, it has recently been proposed that stimulation-based aerobic glycolysis may perturb the local pH homeostasis (which would have consequences for neuronal functioning if left uncorrected) and that the hemodynamic response may act, in part, to clear the acidic products of local aerobic glycolysis (DiNuzzo et al., 2023). If this is the case, then glycolytic metabolism in FSP+ interneurons may threaten pH homeostasis, and other interneurons may react (or prospectively/allostatically act; Sterling, 2012) by manipulating local hemodynamics to buffer against this disturbance.
In Section 2, we addressed why stimulation-based aerobic glycolysis occurs, and the hypothesis developed here addresses where exactly stimulation-based aerobic glycolysis might occur. However, there remains a final question to ask: what function is supported by this interconnected set of hemodynamic, metabolic, and neuroelectrical changes (Figure 6), all of which occur in response to sensory/cognitive stimulation? The next section develops an answer, which involves reframing the traditional “activation”-based interpretation, which traces its origins to the stimulus–response framework used in psychology and neuroscience.
3.2. Prediction error encoding, as opposed to “activation”, may describe the function of interconnected metabolic, hemodynamic, and neuroelectrical responses to task-based stimulation.
Section 3.1 outlined the empirical evidence linking stimulation-based aerobic glycolysis (i.e., metabolic decoupling), BOLD signal intensity increases (i.e., hemodynamic decoupling), and gamma oscillations, including the neuromodulation of all three by norepinephrine, and the relevance of the efficiency tradeoff hypothesis for fueling the many small diameter axons in the FSP+ interneurons that produce gamma oscillations. This section describes the links from this evidence to predictive processing, a computational account of brain organization (Figure 6). The goal of this section is to provide a new functional interpretation of metabolic and hemodynamic decoupling—i.e., to address the function, in terms of information-processing, that metabolic decoupling supports. We will propose that hemodynamic decoupling is an approximate index of metabolic decoupling, and that metabolic decoupling supports the encoding of what have been variously called bottom-up, feedforward, or prediction-error signals. This new interpretation differs from traditional “activation”-based, or “feature-detection” (Keller & Mrsic-Flogel, 2018) interpretations of BOLD signal intensity increases, which consider hemodynamic decoupling as evidence for a region being “active” and performing a particular computational process on features of its inputs within a localized brain region (or in a distributed network of brain regions; Westlin et al., 2023). Below, we review what predictive processing is (Section 3.2.1), how it relates to the evidence reviewed above (Section 3.2.2), how it presents an important alternative to “activation”-based models (Section 3.2.3), and how it recasts interpretations of existing BOLD fMRI analyses (Section 3.2.4).
3.2.1. “Feature detection” and “predictive processing” interpretations of brain-based information processing.
The traditional interpretive framework for brain-based information processing, and sensory processing in particular, draws on the concept of “feature detection” (for review, see Keller & Mrsic-Flogel, 2018). In this framework, sensory processing (e.g., vision; Marr, 1982/2010) is conceptualized as a progression of stages, where raw sensory signals are encoded at the periphery (e.g., at the retina) and proceed up through the cortical hierarchy (or more accurately, heterarchy; Barbas, 2015; Felleman & Van Essen, 1991; Mesulam, 1998). In these traditional “feature-detection” theories, “the activity of neurons in sensory pathways [e.g. edge cells (Hubel & Wiesel, 1959), or grid cells (Hafting et al., 2005)] … represents the presence of a feature or an object in the environment” (Keller & Mrsic-Flogel, 2018, p. 424). Levels of the processing hierarchy are thought to deal with increasingly feature-rich representations of the original sensory input—meaning that, as sensory input ascends through stages of processing, feature detection increasingly involves representations that are combinations of, or abstractions from, the original sensory input (e.g., edges, shapes, 3D objects). This successive process of re-representation is thought to culminate with the extraction of invariant representations of the external environment, which can be used in decision-making by non-perceptual brain processes (Marr, 1982/2010). From this perspective, when hemodynamic decoupling is described as an index of local “activation”, “activation” in sensory cortex is generally taken to refer to local processing involved in feature detection.
Predictive processing is a different framework. This framework proposes that sensory processing does not involve detecting and adding features to a representation, but rather, that sensory processing involves filtering signals to encode only those signals which were not be predicted by the brain’s internal model (for review, see Hutchinson & Barrett, 2019; Keller & Mrsic-Flogel, 2018). This internal model consists of prior knowledge (i.e., predictions)32 which are applied to bottom-up sensory signals, filtering them so that only unpredicted sensory signals (i.e., prediction error) proceed up the cortical heterarchy, and arrive as bottom-up signals to be filtered by predictions at the next level of the heterarchy. Thus, this internal model filters redundant (i.e., predictable) signals. This process of filtering through prediction is called predictive coding, and can be expressed explicitly as the principle that: if a signal (e.g., a sensory signal) only confirms what an internal model predicted, then the signal is redundant, or alternatively, that a signal is only informative if it is unpredicted. This principle is foundational to information theory (Shannon & Weaver, 1949/1964), central to motor learning (Shadmehr et al., 2010; Shadmehr & Krakauer, 2008; Sheahan et al., 2016; Sperry, 1950; von Holst, 1954; Wolpert et al., 1998; Wolpert & Flanagan, 2016), and has more recently been incorporated into a family of general theories of neural computation, which we refer to with the umbrella term of predictive processing models (e.g. Barrett, 2017b, 2017a; Barrett & Simmons, 2015; Chanes & Barrett, 2016; Clark, 2013, 2015; Denève & Jardri, 2016; Friston, 2010; Friston et al., 2017; Hohwy, 2013; Hutchinson & Barrett, 2019; Kleckner et al., 2017; Rao & Ballard, 1999; Sengupta, Stemmler, et al., 2013; Seth, 2015).
For predictive processing models, sensory processing involves compressing sensory signals into increasingly abstract multimodal summaries as they ascend the cortical heterarchy (i.e., combining sensory information across domains; Figure 8). Like traditional “feature detection” accounts, predictive processing models transform the raw sensory input through stages of processing, but they are distinct in that they make at least one additional claim: that the compressed multimodal summaries, in turn, are used to predict and filter lower-level sensory signals that the brain will receive in the next instant. Predictive processing frameworks have been used to provide a plausible framework for how domain-general mechanisms might generate complex cognitive processes, such as learning (Friston et al., 2016; Pezzulo et al., 2015), cognitive control (Pezzulo et al., 2018), attention (Feldman & Friston, 2010), emotion (Barrett, 2017b, 2017a; Seth, 2013), social coordination (Theriault et al., 2020; Veissière et al., 2019), and mental disorders (for review, see Friston, 2017). Further, although metabolism is not generally the focus of predictive processing models (but see Sengupta, Stemmler, et al., 2013), given the high costs of neuronal signaling (Attwell & Laughlin, 2001; Y. Yu et al., 2018), it is reasonable to hypothesize that a coding system that filters bottom-up signals to pass upward only prediction error would conserve ATP expenses33. Indeed, mathematical derivations from minimal assumptions have demonstrated that “any system constructed to keep memory about its environment and to operate with maximal energetic efficiency has to be predictive” (Still et al., 2012, p. 120604; emphasis added).
Figure 8.

Simplified illustration of predictive coding in the brain. Exteroceptive signals (from outside the body) and interoceptive signals (from inside the body) enter the brain via sensory transduction. Within the brain, information processing is organized heterarchically—i.e., as an approximate hierarchy, but with additional connections between non-adjacent levels (indicated by dotted lines). Top-down predictions (blue) meet with bottom-up compressed summaries of raw sensory signals (red). Unpredicted components of the bottom-up signal are passed to the next hierarchical level as prediction error (information compression). As sensory signals ascend the cortical heterarchy, multiple sensory channels are combined (multimodal integration). This figure is a simplification, as not all sensory domains are equally compressed, not all heterarchical connections are shown, and projections (bottom-up/top-down) are constrained by cortical architecture, including the granularity of cortical columns (Barbas, 2015; Barrett & Simmons, 2015; Chanes & Barrett, 2016; Kleckner et al., 2017).
3.2.2. Evidence linking bottom-up and prediction error encoding to gamma oscillations, norepinephrine, and small diameter axons.
Several lines of evidence suggest that prediction error encoding can be integrated with the topics reviewed in Section 3.1. First, evidence from intracortical EEG and magnetoencephalography has identified a relationship between gamma oscillations and bottom-up signaling, as well as a relationship between alpha/beta oscillations and top-down signaling (Bastos et al., 2015; Bauer et al., 2006; Buschman & Miller, 2007; Fujioka et al., 2009; Iversen et al., 2009; Michalareas et al., 2016; Todorovic et al., 2011; van Kerkoerle et al., 2014). For example, in monkeys, a simple visual task elicited gamma oscillations in lower-order visual cortex (V1) that preceded gamma oscillations in higher-order visual cortex (V4), while alpha oscillations showed the opposite pattern, emerging first in V4 and subsequently in V1 (van Kerkoerle et al., 2014). Further, electrical stimulation of V1 increased gamma power in V4, whereas stimulating V4 increased the alpha power in V1 (van Kerkoerle et al., 2014). Together, this evidence suggests that gamma oscillations propagate from low to high levels of the cortical heterarchy, whereas alpha oscillations propagate from high to low.
Recent work has gone even further, hypothesizing that gamma oscillations correspond to local processing related to prediction error signaling (and alpha/beta with prediction signals), rather than only bottom-up (and top-down) signaling more generally (Arnal & Giraud, 2012; Bastos et al., 2012, 2020; Bressler & Richter, 2015; Engel & Fries, 2010; Friston et al., 2015). These hypotheses have been supported by a large body of empirical evidence (Bastos et al., 2020; Brodski et al., 2015; Chao et al., 2018; Dürschmid et al., 2016; Fontolan et al., 2014; Mayer et al., 2016; Sedley et al., 2016; van Pelt et al., 2016). For example, in monkeys, musical tones were used to induce low-level or high-level auditory prediction errors (i.e., a change in one musical tone vs. a change in a pattern of tones) as whole-hemisphere subdural electrode arrays recorded cortical activity (Chao et al., 2018). In two independent subjects, principal components captured (a) low-level prediction error (associated with a change in tone), (b) high-level prediction error (associated with a change in tone-pattern), and (c) prediction. Low-level prediction errors were associated with early-onset gamma power increases in early auditory cortex and high-level prediction errors were associated with late-onset gamma power increases in anterior temporal cortex. By contrast, prediction was associated with a late-onset alpha/beta power decrease in frontal cortex. In other work, gamma oscillations in auditory cortex (measured by intracranial EEG) were suppressed when humans heard their own speech as they spoke, but were not suppressed when they heard speech from others (Flinker et al., 2010), suggesting that predictions about self-generated auditory input help people suppress encoding their own speech. Given this evidence, and given that high-frequency gamma oscillations can be produced by stochastic, unpredictable input (see Fig. 2 in Buzsáki & Wang, 2012) there is strong reason to believe that gamma oscillations reflect prediction error encoding (Figure 6).
Prediction error encoding is also related to norepinephrine’s well-understood neuromodulatory role in attention and vigilance (e.g. Alnæs et al., 2014; Corbetta et al., 2008; Dayan & Yu, 2006; Ramos & Arnsten, 2007; A. J. Yu & Dayan, 2005). Indeed, findings that norepinephrine enhances gamma-power in “active” regions (Aston-Jones & Cohen, 2005; Mather et al., 2016), are consistent with the proposed role for attention in predictive processing (Ferreira-Santos, 2016). In predictive processing models, attention is implemented by “tuning” predictions. For example, given a constant sensory signal, increasing the precision of sensory predictions would magnify even small discrepancies between the prediction and sensory signal, allowing more prediction error to be forwarded up the cortical heterarchy. On the other hand, if sensory predictions are less precise, then small discrepancies would be more likely to be classified as uninformative noise, and prediction error would be less likely to be passed upward (Feldman & Friston, 2010). This role for norepinephrine in attentional tuning provides a functional explanation for its observed role in upregulating gamma oscillations and hemodynamic decoupling in “hot spots” (Mather et al., 2016), and suggests that it is an important player in predictive processing (Ferreira-Santos, 2016)34.
Finally, because prediction error encoding is unpredictable by definition (from the perspective of local populations of brain cells), prediction error encoding necessarily imposes rapid-on/rapid-off energy demands on the axons signaling within those local brain cell populations. Recall from Section 2.3 that rapid-on/rapid-off energy demands are exactly what peaking generators (such as aerobic glycolysis, we hypothesized) are well-designed to satisfy (Figure 5). Peaking generators allow ATP production to be temporally responsive to sites of high-ATP turnover—scaling ATP production when prediction error occurs, and scaling ATP production down again when prediction error ends (i.e., when the bottom-up signal has become predictable at a given level of the cortical heterarchy). Ideally, prediction error should be transmitted infrequently, since a brain in a familiar environment (i.e., well-learned and predictable) should have developed an internal model that can often predict the signals it receives. In Section 2.1, we suggested that thin axons “are ideally suited to transmit information infrequently, while using ATP efficiently”, which makes the properties of small diameter axons particularly well-suited to the functional demands of prediction error encoding. In Section 3.1.3 we reviewed how FSP+ interneurons, which help produce gamma oscillations, are highly branched, possess many thin axons, and sustain a unhabituated high rate of firing during stimulation, meaning that signaling in FSP+ interneurons introduces a rapid-on increase in metabolic demand, which is maintained until their firing ceases (Kann, 2016). Thus, the properties of small diameter axons, such as those in FSP+ interneurons, are well aligned with other properties of prediction error encoding (Figure 6).
3.2.3. BOLD increases approximate prediction error metabolism (BIAPEM) hypothesis: An alternative to the “activation”-based interpretation of the BOLD response.
From this empirical foundation, we can now advance an alternative to the traditional “activation”-based/“feature detection” interpretation of BOLD signal intensity increases (i.e., hemodynamic decoupling). This alternative is that hemodynamic decoupling is an approximate index of stimulation-based aerobic glycolysis (i.e., metabolic decoupling), which supports the energetic demands of prediction error encoding—i.e., the BIAPEM (BOLD increases approximate prediction error metabolism) hypothesis (Figure 9). More specifically, we hypothesize that the energetic demands of prediction error encoding involve fueling signaling by FSP+ interneurons, which, in aggregate, produce gamma oscillations (Buzsáki & Wang, 2012). We make this hypothesis with the caveat that many mediating relationships between hemodynamic decoupling and prediction error encoding are correlational, and that future work is necessary to add specificity35; however, the evidence we have reviewed suggests that interpreting hemodynamic decoupling in terms of its relationship to prediction error encoding is almost certainly an improvement over the traditional “activation”-based alternative. Below, we outline why this alternative BIAPEM hypothesis is needed, how it makes sense of the high “resting” energetic cost of the brain (20% of whole-body ATP; Clarke & Sokoloff, 1999), and what this hypothesis means for the interpretation of prior BOLD-fMRI results.
Figure 9.
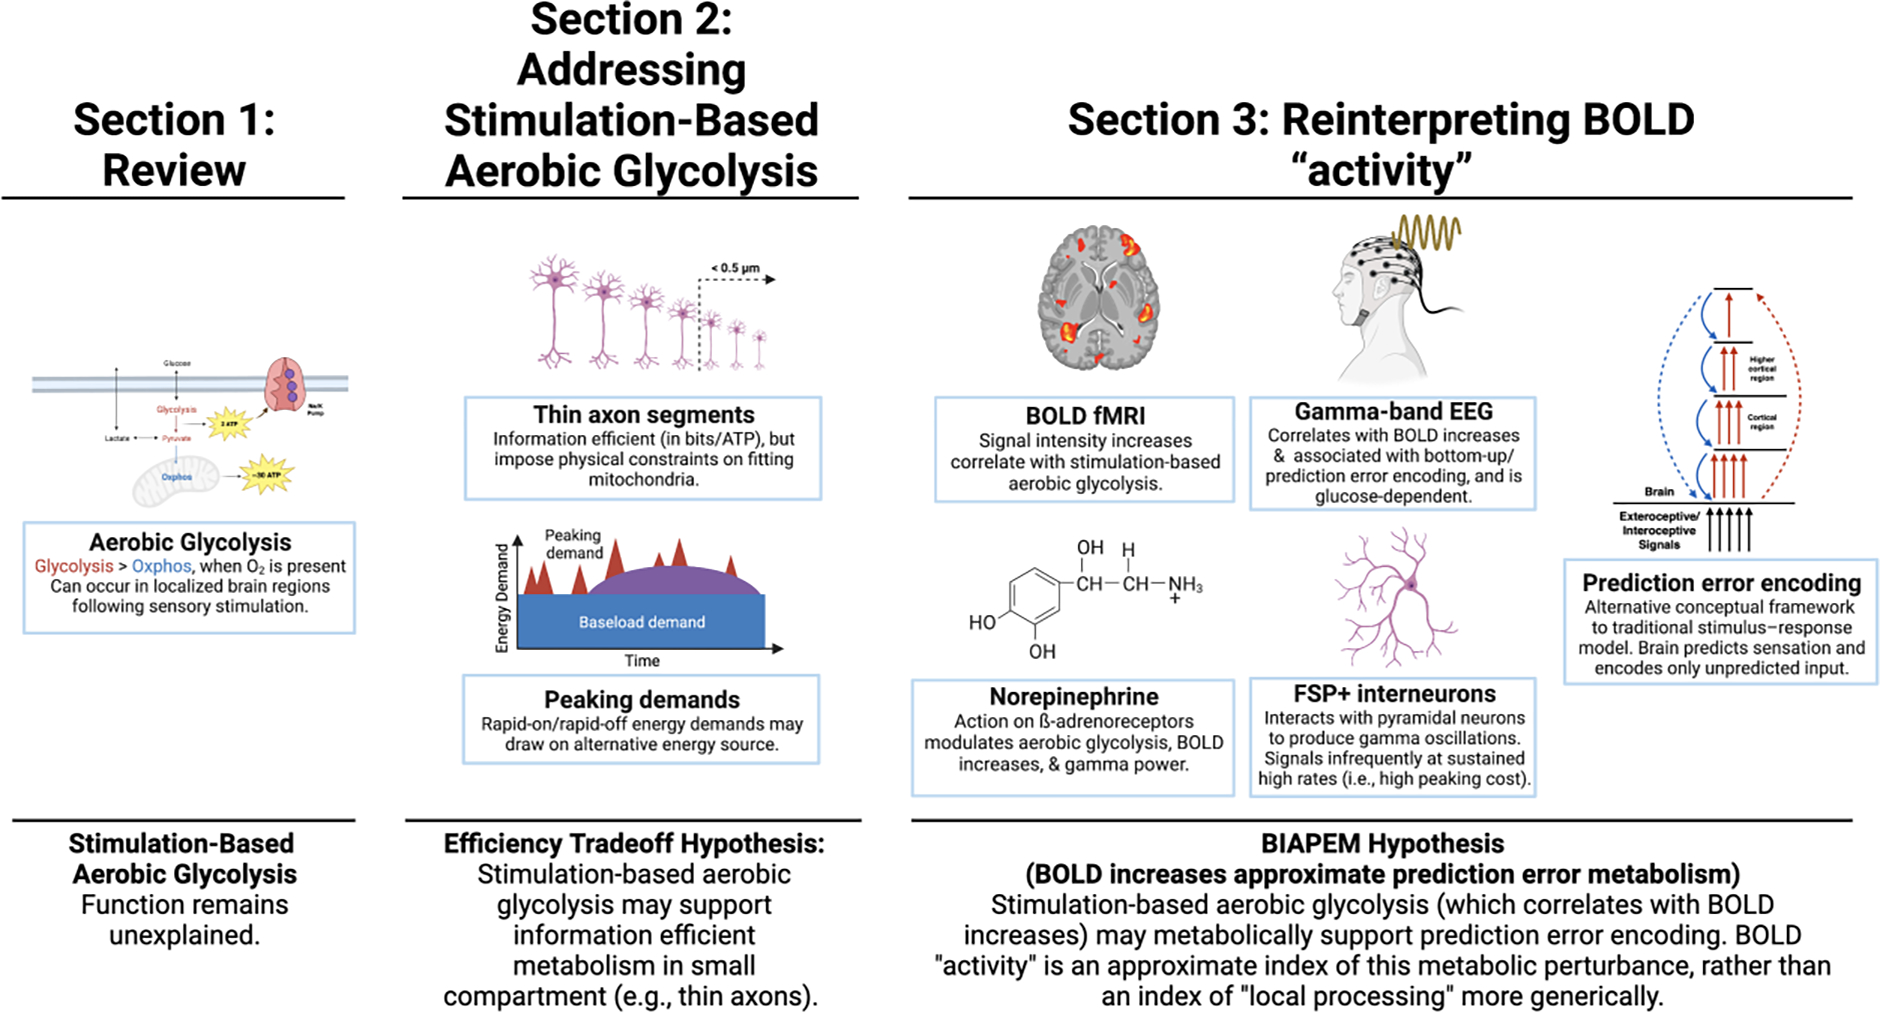
Summary of material reviewed and core hypotheses developed. Section 1 reviewed core concepts and established that the function of stimulation-based aerobic glycolysis has remained unexplained. Section 2 developed the efficiency tradeoff hypothesis from the spatial and spatiotemporal advantages of stimulation-based aerobic glycolysis, focusing on how stimulation-based aerobic glycolysis can provide energy in thin and information efficient axons (and in other small cellular compartments) where sufficient mitochondria cannot be physically housed, and how stimulation-based aerobic glycolysis can provide energy at points of high ATP-turnover (e.g., Na+/K+ pumps) during rapid-on/rapid-off period of peaking demand. Section 3 developed the BIAPEM hypothesis from the joint properties of stimulation-based aerobic glycolysis, BOLD fMRI, gamma-band EEG, and their modulation by norepinephrine. In addition, Section 3 singled out FSP+ (fast spiking parvalbumin positive) interneurons as a particular likely candidate to be fueled by stimulation-based aerobic glycolysis, and presented evidence to support the hypothesis. Existing research related these topics to bottom-up processing, or prediction-error encoding, and leading us to propose that prediction error encoding may be supported by stimulation-based aerobic glycolysis, and, by extension, BOLD increases may approximate prediction error metabolism (i.e., BIAPEM). Created with BioRender.com.
The popularity of the traditional “activation”-based interpretation of hemodynamic decoupling stems, in part, from the historical dominance of the stimulus-response framework in psychology and neuroscience (for early critiques, see Dewey, 1896; Lashley, 1951). The stimulus–response framework is premised on the assumption that particular inputs should reliably produce particular outputs (for a critical review, see Danziger, 1997). It has been criticized elsewhere (e.g., Cisek, 1999; Powers, 1973; Yin, 2020), but in neuroimaging it bolsters the intuitive assumption that regions are “turned on” in response to stimulus features, and that the BOLD signal indexes this “activation” (Hutchinson & Barrett, 2019; Keller & Mrsic-Flogel, 2018). Logothetis articulated the problematic assumptions underlying this approach clearly, writing that “[fMRI] signals are presumed to result from changes in the activity of the neuronal populations responsible for the functions in question (e.g., stimulus- or task-selective neurons)”, and he concludes that “a direct analogy between neuronal spiking as measured in animal experiments and the fMRI signal … is simply unrealistic and might often lead to incorrect conclusions” (Logothetis, 2008, p. 875)36. Stimulus–response assumptions also shape experimental design. For example, by using randomized and independently presented stimuli to probe perception, researchers measure the brain’s response to perceptual events that would be rare in the ecological environment that shaped brain development. In other words, uncontextualized and randomly presented stimuli ignore that the brain evolved to help organisms navigate a persistent and continuous environment (Anderson, 2014; Spivey, 2008), and real world stimuli do not “pop into existence” on a screen, as they do in many lab-based experiments. Indeed, it has been suggested that “standard randomized designs [where stimuli appear in a random, unpredictable order] encourage oversampling of what might be an unnatural state of error processing” (Hutchinson & Barrett, 2019, p. 287), as they act to break up predictable transitions that exist in naturalistic environments. Researchers might agree that the stimulus–response framework is a simplification, and they might object that no one truly believes that brain regions are “turned on” or “activated” by stimuli—but the assumptions of the traditional paradigm, and the intuitions that they license, will generally shape the interpretation of results in the absence of an explicitly articulated alternative (Kuhn, 1962/2012)37.
Predictive processing frameworks provide such an alternative paradigm, and we propose that they can also help interpret the function of both the brain’s high baseload demand, and the smaller peaking demands in response to task-based stimulation (Section 2.3; Figure 5). As discussed in Section 1.1, the “resting state” metabolic cost of the brain constitutes ~20% of the whole-body ATP budget (Clarke & Sokoloff, 1999). This is the brain’s baseload demand, and 70–75% of that baseload demand goes toward signaling costs (Y. Yu et al., 2018). By contrast, the stimulation-elicited metabolic changes associated with metabolic and hemodynamic decoupling only increase whole-brain ATP consumption slightly above the “resting” rate (for review, see Raichle, 2010). These constitute peaking demands for the brain. The BIAPEM hypothesis proposes that metabolic decoupling fuels prediction error signaling, and, consistent with this, prediction error signaling shares several properties with peaking demands—i.e., both involve energetic costs that are unpredictable, rapid-on/rapid-off, and small (relative to the energy consumed by the brain “at rest”). It follows from the BIAPEM hypothesis that the brain’s baseload metabolism likely fuels prediction-based signaling—i.e., the other major class of signaling in predictive processing frameworks. The proposal that the majority of energy used by the brain fuels prediction-based signaling makes sense theoretically, as, in the predictive processing model, the core purpose of the brain is to construct a predictive internal model of the world (insofar as the world is relevant to the continued survival of its body). That is, to regulate the body, the brain must model (i.e., predict) its environment, just as any good regulator must model its environment (Conant & Ross Ashby, 1970; for a complementary perspective, see Cisek, 2019). This model should always be operating—i.e., even when subjects are “at rest”. This proposal would benefit from targeted empirical investigation, and although conclusively proving it will likely require considerable work, some promising tools to test it do already exist—for example, directed connectivity analyses have combined PET and BOLD fMRI to test whether “resting” functional connectivity between regions represents top-down or bottom-up signaling, finding that top-down salience-to-visual communication emerges only when participants’ eyes are open (under the assumption that synaptic activity increases glucose consumption in the targeted region; Riedl et al., 2016). More importantly, however, to counter this theoretical explanation the stimulus–response framework, taken at face value, would need to explain what function baseload brain metabolism supports and how it relates to signaling (and the function must involve signaling, as biosynthesis and other non-signaling costs are not major contributors to baseload brain metabolism; Y. Yu et al., 2018). That is, a stimulus–response framework must answer why baseload brain metabolism is so high, what function that metabolism serves, and why those metabolic costs so greatly outweigh the costs of sensory processing. If the BIAPEM hypothesis is correct, then it has several implications for how BOLD contrasts, BOLD resting state analysis, and machine learning approaches to BOLD data should be interpreted.
3.2.4. Implications for BOLD fMRI analyses and interpretation.
An analogy can help clarify the implications of the BIAPEM (BOLD increases approximate prediction error metabolism) hypothesis for BOLD interpretation. If the brain’s baseload ATP consumption is visualized as the volume of a lake (Figure 10), then the depth of the lake—i.e., the oxygen and glucose consumed by baseload oxidative metabolism—is invisible to BOLD fMRI. Ripples on the surface of the lake represent small and temporary peaking costs in ATP consumption (Raichle, 2010)38. Ripples caused by task-based stimulation include the metabolic costs of both large stimulation-based increases in aerobic glycolysis and smaller stimulation-based increases in oxidative metabolism (Section 1.3), where the small increase in oxidative metabolism accounts for most of the increase in ATP produced (~97%; A.-L. Lin et al., 2010), and the large increase in aerobic glycolysis disproportionately consumes glucose (Section 1.4). BOLD signal intensity increases are an approximate index of these metabolic ripples, as BOLD signal intensity increases are correlated with increases in stimulation-based aerobic glycolysis (Section 3.1), and oxidative metabolism (Herculano-Houzel & Rothman, 2022). It follows that BOLD fMRI analyses do not provide insight into the baseload metabolic activity occurring under the surface of the lake, or the function that this baseload metabolism supports. What the metaphor makes clear is that the BOLD signal cannot not be treated as a generic signal of “activity”, as it represents only a fraction of the metabolic cost (and by extension, signaling) that occurs in the brain—a point that echoes warnings others have made before us (e.g., Goyal & Snyder, 2021; Logothetis, 2008; Singh, 2012). In other words, conceiving of BOLD fMRI in terms of “activation” blurs together the lake’s depth and its surface ripples, or the brain’s baseload and peaking activity. Baseload and peaking generators generally support distinct functions (Epstein et al., 2017; Kaplan, 2008), and the evidence reviewed suggests that BOLD signal intensity is only an approximate index of the later.
Figure 10.

Peaking cost metabolic “ripples” on the baseload “lake” of brain-based energy demand. At rest, the human brain consumes ~20% of the whole-body oxygen budget to generate ATP (Clarke & Sokoloff, 1999), while stimulation-based increases in ATP production (i.e., increases in oxphos and aerobic glycolysis) represent fluctuations of ~5% from this baseline (for review, see Raichle, 2010), and correlate with the hemodynamic response (Section 3.1.1). The brain’s primary function is to regulate a body in an environment (Sterling & Laughlin, 2015) through the use of an internal model of the world, insofar as the world is relevant to the continued survival of its body (Barrett, 2017b, 2017a; Conant & Ross Ashby, 1970). The BIAPEM (BOLD increases approximate prediction error metabolism) hypothesis proposes that stimulation-based aerobic glycolysis (indexed by BOLD signal intensity increases; Figure 7) supplies energy for prediction error encoding (Figure 8), which modifies that internal model. Stimulation-based aerobic glycolysis represents a component of the peaking costs represented above. In contrast, the brain’s baseload ATP demands are largely met by oxphos, and we hypothesize that these costs go toward supporting the top-down prediction signaling that constitutes the internal model itself. This implies that BOLD fMRI largely measures how the brain is perturbed by sensory stimulation (with top-down predictions modulating those perturbations). If this is true, then it follows that BOLD analyses can probe how ascending prediction error is organized across the brain, but BOLD analyses may not measure the more fundamental functions that baseload brain metabolism supports. We propose that equating BOLD signal intensity increases with brain “activation” is a misleading metaphor and should be abandoned for an alternative. Images from (Pattern classification; Krishnan et al., 2016; BOLD contrast; Mende-Siedlecki et al., 2013; Resting state connectivity; Poldrack et al., 2015).
If the BIAPEM hypothesis is correct, then there are clear limits to what BOLD fMRI can tell us about brain function. On our account, traditional BOLD contrast analyses, which compare “ripples” across experimental conditions, do not necessarily indicate the function of a region (i.e., the stimuli features that it processes)—but rather, contrast analyses may indicate relative differences between experimental conditions in the prediction error that a region encodes. This is a subtle but important difference. On a stimulus–response account, stimuli are assumed to have features that are detected and processed (Keller & Mrsic-Flogel, 2018), with the “ripple” reflecting the act of processing. By contrast, on the BIAPEM hypothesis, the “ripples” are an index of prediction error encoding, meaning that the “ripples” give some clues about how prediction error propagates through the cortical predictive hierarchy (i.e., where and when it is processed), but the “ripples” are also highly dependent on context (i.e., prior predictions). In other words, because prediction error encoding depends on both top-down predictions and bottom-up sensory signals, the BOLD fMRI response will be largely influenced by incoming sensory signals (e.g., stimuli), but these stimuli-driven effects are not entirely determined by stimulus features, and also depend in large part on what the brain predicts. For example, a stimulus may elicit a BOLD increase when presented, but if the stimulus is presented continuously without change, then the BOLD response should decrease (i.e., habituate) as stimulus becomes predictable. The argument being made—i.e., that BOLD contrast analyses provide an incomplete picture of brain function—is not new, and fMRI analyses have increasingly focused on analyzing resting state dynamics (Raichle, 2010)—but, it must be recognized that even resting state dynamics measure the “ripples”, as opposed to the metabolic activity below the surface of the “lake”. Thus, on our interpretation, both contrast and “resting state” (see footnote 37) analyses likely measure hemodynamic indices of the metabolism that supports prediction error encoding.
The BIAPEM hypothesis also has implications for the use of the voxel-wise BOLD response in machine learning classifier and encoders. These approaches are agnostic about how the BOLD signal should be interpreted, but they use patterns of BOLD signal intensity increases (and decreases) to improve the power of contrast analyses (Haxby et al., 2001; Kriegeskorte et al., 2006), predict behavior and reports of subjective experience (Ashar et al., 2017; Chang et al., 2015; Eisenbarth et al., 2016; Krishnan et al., 2016; Wager et al., 2013; Woo et al., 2014; H. Yu et al., 2020), reconstruct observed images and movies (Chen et al., 2023; Scotti et al., 2023), and even create models that, after being trained on BOLD responses to audio, can reconstruct the content of an independent set of movies from BOLD signals recorded during watching (and vice versa; J. Tang, Du, et al., 2023). But to what do these approaches owe their success? The BIAPEM hypothesis suggests that such models may be successful because they leverage a noisy and contextually dependent approximation of the sensory signals (interoceptive and exteroceptive) that impinge on the brain—i.e., a noisy and contextually dependent copy of the external/internal environment. This implies that the BOLD response relates to the compression of sensory signals (even in what is typically considered “non-sensory” cortex), consistent with the finding that even simple tasks elicit reliable, but non-canonical, patterns of BOLD response throughout the entire brain (Gonzalez-Castillo et al., 2012). In metaphorical terms, machine learning classifiers detect patterns in the “ripples”, and make predictions based on them; but these predictions owe their accuracy to the fact that they implicitly encode the direction of the wind that blows across the surface of the “lake”. That is, using BOLD fMRI data to reconstruct a stimuli (e.g., a movie; Chen et al., 2023) is akin to reconstructing a stimuli from a highly degraded and context-dependent copy of the original stimuli39. It is an impressive technical feat to accomplish this, but it may tell us little about underlying brain function beyond how sensory compression is organized across the cortical hierarchy. One implication of this is that machine learning classifiers trained on BOLD fMRI may overemphasize similarities between conditions on the basis of sensory features, while remaining less sensitive to predictive neuronal communication that lies “under the surface”, and which constitutes the majority of brain “activity”40.
Most importantly, however, if aerobic glycolysis fuels prediction error encoding, then it follows that neuronal signaling for prediction and prediction error are more clearly distinguished by their use of specific metabolites (i.e., oxygen and glucose), than by their net-ATP costs. That is, according to the BIAPEM hypothesis, prediction signaling should consume more ATP in total and be supported by oxphos, whereas prediction error signaling should consume relatively less ATP in total, but could strain supplies of circulating glucose when prediction error signaling is excessive (by extension, this would strain regulatory mechanisms that keep blood glucose levels stable; for allostatic implications, see Sennesh et al., 2022). In sum, this means that BOLD fMRI data, and the cognitive processes it is used to examine (e.g., memory, perception, decision making), should be interpreted with an understanding that hemodynamic/metabolic decoupling is only one part of a larger puzzle. That is, BOLD fMRI measures the hemodynamic correlates of a particular kind of brain-based information encoding, and does not stand in for generic brain “activity”. This refined interpretation might help scientists use BOLD fMRI in a more precise way, and could help clarify the relationships between brain biology, neural computation, and psychological processes in awake humans.
3.3. Summary.
Our goal in this section was to present an alternative to the traditional “activation”-based, or “feature-detection” interpretations of BOLD signal intensity increases. The BIAPEM (BOLD increases approximate prediction error metabolism) hypothesis proposes an alternative, and the evidence supporting it can be summarized as follows:
Aerobic glycolysis supports neural signaling at gamma-band frequencies. Under many circumstances, both aerobic glycolysis and gamma oscillations correlate with BOLD signal intensity increases. All three measures are similarly modulated by norepinephrine. Gamma oscillations are produced by spiking in populations of fast spiking, parvalbumin positive inhibitory interneurons, which possess many thin axons that could be fueled by aerobic glycolysis. Gamma oscillations have been functionally associated with bottom-up encoding, and more specifically, with prediction error encoding. “Activation”-based, or “feature detection” interpretations of BOLD signal intensity increases do not explicitly account for widespread evidence of top-down signaling in cortical organization; nor do they account for the possibility of different functional roles for baseload brain metabolism (fulfilled by oxphos) and short-lived peaking costs (fulfilled by large increases in aerobic glycolysis and small increases in oxphos). Predictive processing accounts, such as the account we developed here, are more consistent with this evidence. Thus, we hypothesize that, under some circumstances, increases in BOLD signal intensity may index of localized metabolic changes that support prediction error encoding.
The empirical links across implementation, measurement, and computation (Figure 6) lay a foundation for future work, and point to how neuroimaging and cognitive science could incorporate observations in biology, genetics, neuropharmacology, and metabolism. The final section briefly elaborates on some of these extensions.
4. Extensions and Implications.
In this paper, we developed a functional account of stimulation-based aerobic glycolysis (i.e., metabolic decoupling), and proposed an alternative to “activation”-based interpretations of BOLD signal intensity increases (i.e., hemodynamic decoupling) by reviewing and contextualizing several interrelated lines of evidence spanning levels of analysis (Marr, 1982/2010). These evidentiary links could lay the groundwork for a generative research program, with brain metabolism at its core. This section aims to demonstrate how this generative program could be built. First, we discuss how such a research program could put uniquely human changes in brain anatomy into a functional context (Section 4.1). Next, we address how the metabolic costs of prediction error encoding apply to social cognition, and how social environments can be conceived of in terms of their metabolic consequences (Section 4.2). Finally, we discuss psychopathology from a metabolic perspective, suggesting concrete avenues through which biological and cognitive approaches can be synthesized in the study of mental disorders (Section 4.3).
4.1. The metabolic implications of interspecies differences in laminar organization and cytoarchitecture.
The efficiency tradeoff hypothesis is not human-specific; rather, it identifies general principles of how ATP production and the biophysics of small diameter axons complement each other. This does imply, however, that cytoarchitectural differences (e.g., across species) may have implications for aerobic glycolysis (and, by extension, prediction error encoding). Besides differences in absolute size, relatively few macro-scale morphological differences separate the brains of humans and apes; for example, human frontal cortex is not larger than would be expected for an upscaled ape brain (Barton & Venditti, 2013; Finlay, 2009; Semendeferi & Damasio, 2000; but see, Donahue et al., 2018; Sherwood & Smaers, 2013). But microstructural features, such as laminar structure and cortical organization, do differ between humans, non-human primates, and rodents (Preuss et al., 2004; Sherwood et al., 2017; Somel et al., 2013). These microstructural features may be relevant to the action of aerobic glycolysis in small diameter axons. For example, compared to non-human primates, human prefrontal and temporal association cortex shows an expansion of neuropil (Spocter et al., 2012) and greater spacing between cortical columns (Semendeferi et al., 2011). Recall that neuropil includes dendrites, synapses, glial filaments, small blood vessels, and critically, small-diameter axons (Braitenberg & Schüz, 1991; Sherwood et al., 2017). These slight changes in humans to cortical column spacing may change local population distributions of thin and thick axons (compared to non-humans), which, in turn, could affect the metabolic costs of fueling local neuronal/glial populations by stimulation-based aerobic glycolysis. Recall also that in Section 2.1 we reviewed an interspecies comparison of axon populations in the optic nerve, where among humans, monkeys, mice, and guinea pigs, the human optic nerve contained proportionally more thin axons than the other species (see Fig. 9a in Perge et al., 2009)—in spite of the fact that, in the human brain, thick axons are needed to help neural signals traverse the larger physical distance from the retina to the lateral geniculate nucleus. Such microstructural differences and subtle changes in axon diameter distributions may be relevant to brain-based demands for glucose and oxygen to fuel signaling among particular neuronal populations.
Interspecies differences in local laminar structure also may be relevant to prediction error encoding and the use of metabolic resources. Laminar structure refers to the organization of neurons within cortical columns (for review, see Barbas, 2015; Felleman & Van Essen, 1991; Fuster, 2003; Mesulam, 1998; Mountcastle, 1997), where the most granular cortical columns contain a distinct granular layer (layer IV), and distinct supragranular/upper layers (layers II/III) as well as infragranular/deep layers (layers V/VI). The cortical sheet ranges from regions that have six distinct layers (called granular regions) through regions that have only a rudimentary layer IV (called dysgranular cortex) to areas that also lack distinctive layers II and III (called agranular). Signal flow between neurons in the cortex is organized such that in aggregate, signals flow from deeper layers (further from the skull) of less granular cortex to upper layers (closer to the skull) of more granular cortex (and vice versa; Barbas, 2015)41. This laminar-organized flow of information has also been hypothesized to organize predictive coding across the cortex, where predictions flow from deeper layers of less granular cortex to upper layers of more granular cortex (and prediction error flows in reverse, from upper layers of more granular cortex to deeper layers of less granular cortex; Barrett, 2017b; Barrett & Simmons, 2015; Hutchinson & Barrett, 2019). Interspecies differences can be interpreted in light of these hypotheses. For example, primate supragranular (i.e., upper) layers (II/III) are thicker than in rodents (in multiple regions varying in granularity; Hutsler et al., 2005), and human prefrontal cortex has more densely packed and more complex pyramidal dendrites in layer III compared to non-human primates (Bianchi et al., 2013; Elston et al., 2001, 2006; Jacobs, 2001; Petanjek et al., 2011), which could suggest species differences in the resources dedicated to encoding prediction and prediction error to/from these brain regions. Further, gamma oscillations—which we proposed are fueled by stimulation-based aerobic glycolysis—are greater in upper layers (and alpha/beta oscillations are greater in deeper layers; Bastos et al., 2018, 2020; Maier et al., 2010; Smith et al., 2013; X.-J. Wang, 2010)42. If gamma oscillations support prediction error encoding (and alpha/beta support prediction signaling; see Section 3.2.2), then the expansion of upper layers in both human and non-human primates, relative to rodents, may reflect an evolutionary change to enhance prediction error encoding in affected regions. This hypotheses is speculative, but carries the testable implication that layer-specific cortical expansion will increase the brain’s demand for glucose, since stimulation-based aerobic glycolysis will likely scale to fuel an increase in gamma oscillations within these expanded upper cortical layers.
4.2. Metabolic implications for human social behavior.
In prior work we proposed that some forms of social motivation, such as a motivation to conform to social norms, may stem from individuals anticipating how non-normative behavior could increase the prediction error they receive from social agents in their immediate environment, as well as the metabolic costs of encoding it (Theriault, 2023; Theriault et al., 2021b, 2021a). Specifically, we proposed that humans feel a “sense of should”—i.e., a social pressure to conform to others’ expectations, felt as phenomenologically distinct from an aversion to explicit punishment or a desire for reward. Starting from the premise that encoding prediction error carries a metabolic cost, we hypothesized that a subset of these costs—i.e., costs of encoding information about the behavior of social agents—can be regulated by conforming to others’ predictions. When you conform, you are predictable to others, limiting the information (i.e., prediction error; Shannon & Weaver, 1949/1964) they receive, and by extension, limiting the likelihood that their behavior will change substantially on account of you. If others’ behavior remains the same (or remains on a stable trajectory) then others’ behaviors are predictable for you, and prediction error encoding, for you, is minimized. Because prediction error is thought to correspond to an affective experience of arousal (i.e., alertness and bodily activation; Braem et al., 2015; Critchley et al., 2005; Crone et al., 2004; Dayan & Yu, 2006; Hajcak et al., 2003; Mather et al., 2016; Preuschoff et al., 2011; Spruit et al., 2018; A. J. Yu & Dayan, 2005), we proposed that a “sense of should” comes to be categorized by the brain as an distinct experience from the orthogonal valenced experience (i.e., pleasant/unpleasant; Barrett, 2017b; Damasio, 1999; James, 1890/1931; Wundt, 1896) of anticipating reward/punishment. In other words, the metabolic costs of nonconformity might help condition a particular kind of affective experience that relates to social norm compliance. Of note, central nervous system arousal correlates with norepinephrine release (Dayan & Yu, 2006; Mather et al., 2016; Preuschoff et al., 2011; Van de Cruys et al., 2014), meaning that lines of evidence depicted in Figure 6 could potentially be extended to begin incorporating aspects of affective psychological experience.
The hypotheses developed in this paper also make clear how our prior account of a “sense of should” can be made more precise. Previously, we hypothesized that encoding prediction error carries a metabolic cost (Theriault et al., 2021b), but, we specified this cost in generic energetic terms (i.e., ATP costs), rather than in terms of the underlying metabolic resources. As noted in Section 3.2.4, an implication of the present work is that it may be more useful to distinguish prediction signaling and prediction error signaling by their use of metabolites (i.e., oxygen and glucose) rather than by their net-ATP consumption alone. A more comprehensive account of social (and non-social) motivation, then, may model how organisms select behaviors that regulate their use of circulating and stored metabolites (S. J. Simpson & Raubenheimer, 2012), as opposed to modeling the regulation of net-ATP expenditures at the level of the whole organism. In the context of social norms, conforming to social expectations in order to keep others’ behavior predictable may have a small effect on overall ATP costs, but, through aerobic glycolysis, it may have a larger impact on the demand for circulating/stored glucose. By extension, because circulating glucose is closely regulated, an increase in aerobic glycolysis may present a regulatory challenge for the organism—not by lowering blood glucose (which is a defended parameter), but by forcing the organism to engage compensatory mechanisms to regulate blood glucose concentration, which have their own downstream costs and consequences (Sennesh et al., 2022; Sterling, 2012). In sum, the present work implies that metabolite usage could be asymmetrically affected by top-down predictions and bottom-up prediction error, and one consequence of this asymmetry (among many others) is that it may provide a metabolic foundation for motivating emergent forms of individual and collective social behavior (Theriault et al., 2021b).
4.3. Metabolic implications for mental disorders.
Bridging biology and subjective experience in mental health is difficult (Harrington, 2019), but evidence suggests that metabolic dysfunction is a critical explanatory component in a variety of mental disorders (Morava & Kozicz, 2013; Morris & Berk, 2015; Picard et al., 2018; Picard & McEwen, 2018; Wallace, 2017), including autism (Chauhan & Chauhan, 2006; Gevezova et al., 2020; Maes et al., 2020; Vallée & Vallée, 2018; van Elst et al., 2014), schizophrenia (Martins-de-Souza et al., 2010; Prabakaran et al., 2004; D. Wang et al., 2019), and depression (Martins-de-Souza et al., 2010; Prabakaran et al., 2004; D. Wang et al., 2019). Contextualizing the relationship between aerobic glycolysis, prediction error encoding, and BOLD signal intensity increases, as we have done here, offers the potential to identify additional pathways linking dysfunction at psychological and biological levels of analysis. This section illustrates how these pathways might be identified in two examples: (a) motivational symptoms in depression, and (b) abnormal patterns of attention observed in autism.
4.3.1. Major depressive disorder, motivation, and the glycolytic demands of the inflammatory immune response.
In major depressive disorder (MDD), some of the most characteristic symptoms are negative affect, reward insensitivity, fatigue, and anhedonia; yet, metabolic dysfunction is also known to play a critical role in MDD (Dantzer et al., 2008; Gardner & Boles, 2011; Klinedinst & Regenold, 2015; Maes, 1995; Maes et al., 2011, 2012; Weger & Sandi, 2018). Recently, accounts of MDD have emphasized the combined action of metabolism, prediction, and the immune system, and recast MDD symptoms as an insensitivity to contextual changes in sensory (and particularly interoceptive) prediction errors (Barrett et al., 2016; Barrett & Simmons, 2015; Shaffer et al., 2022; Stephan et al., 2016), suggesting, for example, that the brain may predict that a healthy body is sick, creating a self-reinforcing cycle that leaves the brain “locked in” to its interoceptive predictions (Barrett et al., 2016). In more concrete terms, the brain might incorrectly predict high metabolic costs in the periphery while remaining insensitive to corrective interoceptive feedback. This might lead the organism to preserve metabolic resources by reducing effortful exploration, which, as a consequence, allows the condition of their body to worsen (Barrett et al., 2016). Complementary accounts have proposed a link between the peripheral immune response, where reduced motivation for effortful behavior in MDD follows from the action of inflammatory cytokines (signaling molecules released by immune cells; Treadway et al., 2019). Circulating inflammatory cytokines are increased in both depressed adolescents and adults relative to healthy controls (Howren et al., 2009; Köhler et al., 2017; Pérez-Sánchez et al., 2018; Schmidt et al., 2014; for review, see Dantzer et al., 2021), and these inflammatory cytokines affect mesolimbic dopamine through the vagus nerve, inhibiting dopamine neurotransmission, synthesis, release, and reuptake (Felger et al., 2007, 2013; Miller et al., 2009). Dopamine inhibition, in turn, reduces effortful exploration—i.e., foraging (Floresco et al., 1996; Rutledge et al., 2009; Salamone et al., 1991), reward-seeking (Cousins et al., 1996; Salamone & Correa, 2012), and willingness to expend energy (Floresco et al., 2008; Salamone et al., 2007, 2016; Wardle et al., 2011). In other words, one mechanism underlying “sickness behavior” in MDD may relate to the immune response and its effects on the mesolimbic dopamine system through cytokine signaling (Dantzer et al., 2008, 2021; Treadway et al., 2019). The role of aerobic glycolysis in prediction error encoding, which we have proposed in this paper, can draw an additional link from the immune response to glucose consumption in aerobic glycolysis, which we turn to next.
The immune system is metabolically expensive in terms of net-ATP consumption, and critically, it uses aerobic glycolysis during an inflammatory response. Like the brain, the immune system is always active, and when the immune system is minimally active, it accounts for ~16% of daily human energy expenditures. A mild immune response raises this cost to ~20% of daily energy (Straub, 2017), equivalent to the energetic demands of the human brain. Aerobic glycolysis occurs in rapidly proliferating immune cells during inflammation (e.g. macrophages and T cells; O’Neill et al., 2016) and is “one of the metabolic hallmarks of the inflammatory phenotype” (Treadway et al., 2019, p. 440). This means that chronic inflammation may place large demands on glucose supplies (Lacourt et al., 2018), and may cause the immune system to compete with brain-based aerobic glycolysis for circulating glucose. As noted in Section 4.2, this does not mean that circulating glucose will be measurably decreased, or that hypoglycemia will be induced—circulating glucose is a well defended parameter—but it does mean that compensatory strategies must be employed, such as breaking down muscle or even changing behavior to manage the competition. Consider how the behavioral management of glucose demands could provide a new perspective on depression symptomology: if aerobic glycolysis supports prediction error encoding, then the lack of motivation to explore in “sickness behavior” could be understood as (locally) adaptive, and aimed at preserving glucose for the ongoing inflammatory immune response. That is, a sick organism limits itself to behaviors that minimize glucose consumption, unless that behavior carries a high likelihood of a metabolic payoff (Treadway et al., 2019). If persistent stress produces chronic inflammation (Miller & Raison, 2016), then depressive symptoms, in part, may stem from the brain adapting behavior and mood to regulate a perceived competition over limited glucose supplies—i.e., the brain reduces exploratory behavior (and, by extension, prediction error encoding) in an effort to preserve glucose for immune functions. Thus, the metabolic framework outlined here constitutes one additional way in which depressive behavior could be contextualized by interactions between the brain and body (for related views, see Kinney & Tanaka, 2009; Raison & Miller, 2013).
4.3.2. Aerobic glycolysis, attention, and hyper-precise predictions in autism.
Accounts of autism have traditionally emphasized its social deficits (Baron-Cohen, 1995, 2000; Baron-Cohen et al., 1985), but dysfunction in autism is now recognized to extend well beyond the social domain (Baron-Cohen, 2009). Individuals on the autistic spectrum show abnormalities in perception and cognition, focusing on details at the expense of generalization (Frith & Happé, 1994; Happé & Booth, 2008; Happé & Frith, 2006), engaging in repetitive behaviors, and showing deficits in planning, flexibility, and inhibition (Hill, 2004). Predictive processing accounts of autism have suggested that social, perceptual, and cognitive dysfunction may be best understood as emergent consequences of deficits in attention and bottom-up encoding (e.g. Van de Cruys et al., 2014; Lawson et al., 2014, 2015; for review, see Palmer et al., 2017; for a related view, see Sinha et al., 2014). That is, autistic individuals may overfit sensory predictions to noise (Van de Cruys et al., 2014), making overly precise low-level sensory predictions (or high-level predictions that are not precise enough; Lawson et al., 2014, 2015; Palmer et al., 2017). This improper adjustment of prediction in the presence of noise is thought to lead autistic individuals to create inflexible predictions that are easily violated. This interferes with the construction of a well-adapted predictive model of the environment, as attention to low-level violations distracts autistic individuals from attending to and learning higher-level regularities. Predictions about the social environment suffer especially, as information in social contexts is generally nosier, and requires predictions to be made at a higher level of abstraction. This account of over-precise prediction in autism is consistent with the observations of Leo Kanner, who noted that “a situation, a performance, a sentence is not regarded as complete [by autistic children] if it is not made up of exactly the same elements that were present at the time the child was first confronted with it.” (Kanner, 1943, p. 256). Such accounts of autism, then, draw clear links between prediction, attention, and autistic dysfunction. The hypotheses developed in the present work may allow this account of autism to be extended to include metabolic consequences, addressing the metabolic constraints imposed by the use of aerobic glycolysis in prediction error encoding and their modulation by norepinephrine.
Norepinephrine plays a role in both prediction error encoding and stimulation-based aerobic glycolysis (see Section 3), and shows reliable differences between autistic and neurotypical populations. Autistic individuals have increased levels of circulating norepinephrine (Lam et al., 2006) and increased phasic central norepinephrine activity in response to prediction errors (Palmer et al., 2017), as indexed by pupillometry (Laeng et al., 2012; for review, see Lawson et al., 2014; Van de Cruys et al., 2014). When encoding prediction error, norepinephrine is specifically released during unexpected uncertainty (i.e., unexpected prediction errors), as opposed to expected uncertainty (i.e., expected prediction errors) (Dayan & Yu, 2006; A. J. Yu & Dayan, 2005), where “expected uncertainty arises from known unreliability of predictive relationships within a familiar environment, and unexpected uncertainty [arises from] gross changes in the environment that … strongly [violate] top-down [sensory] expectations” (A. J. Yu & Dayan, 2005, p. 681). In other words, if noisy sources can be identified as noisy, then prediction error from the source can become expected and norepinephrine release minimized; but, if noisy sources cannot be identified as noisy (as is proposed to occur in autism; e.g., Van de Cruys et al., 2014), then prediction error remains unexpected, and norepinephrine is released. Recall that norepinephrine release also has metabolic consequences, as it enhances stimulation-based aerobic glycolysis via β-adrenoreceptor activation (Section 3.1.2; Dienel & Cruz, 2016). This suggests both that attentional dysfunction in autism may have metabolic consequences for glucose usage (consistent with observed increases in blood lactate levels in autistic individuals; Al-Mosalem et al., 2009; Correia et al., 2006; László et al., 1994; Oliveira et al., 2005; Weissman et al., 2008), and it points to a potential causal role for β-adrenoreceptors in the development of autistic dysfunction and its treatment. Consistent with this possibility, the risk of autism is increased by prenatal overstimulation of β2-adrenoreceptors (S. L. Connors et al., 2005). Even more intriguing, is a recent systemic review suggesting that propranolol (which suppresses stimulation-based aerobic glycolysis by blocking β-adrenoreceptors; Dienel & Cruz, 2016) improved cognitive performance and reduced aggressive behavior in autism (Sagar-Ouriaghli et al., 2018). It is possible that the behavioral effects of propranolol stem from its effects on suppressing stimulation-based aerobic glycolysis, and by extension, excessive prediction error encoding. Thus, multiple lines of evidence suggest that the metabolism-based framework we have developed in the present work can help provide insight into autistic dysfunction43.
5. Conclusion.
Despite the evolutionary need to avoid wasteful energetic spending, the brain “activity” measured by BOLD fMRI is closely related to stimulation-based aerobic glycolysis: an energetically inefficient metabolic pathway, which consumes more glucose for less ATP, compared to the alternative of full cellular respiration involving oxphos. We hypothesized that the function of stimulation-based aerobic glycolysis is clear when it is viewed as the solution to an efficiency tradeoff: by sacrificing energetic efficiency, thin axons (and potentially other small neural and glial structures) can maximize informational efficiency instead. With the efficiency tradeoff hypothesis established, we expanded on it to address the more general problem of how regional BOLD “activation” should be interpreted. We developed an alternative to the traditional “activation”-based, or “feature-detection” view (Keller & Mrsic-Flogel, 2018), called the BIAPEM (BOLD increases approximate prediction error metabolism) hypothesis, which proposed that BOLD signal intensity increases may index localized metabolic changes that support prediction error encoding. The BIAPEM hypothesis, if correct, would prompt a major reconsideration of prior neuroimaging research. At the same time, it would also offer an opportunity to more concretely link BOLD neuroimaging to the metabolism that underlies it, and to build on the extended set of evidentiary relationships that link metabolism to brain-based information processing.
The hypotheses outlined in this paper could benefit from additional evidence and investigation in several key areas. First, we refined the efficiency tradeoff hypothesis to specifically suggest that FSP+ interneurons may be fueled by stimulation-based aerobic glycolysis. This can be tested by measuring local CMRglc and lactate concentration (e.g., using MRS) during optogenetic stimulation. Recent work observed a local decrease in CMRO2 during FSP+ stimulation (Vo et al., 2023), but to our knowledge CMRglc has not yet been explicitly measured.
Second, our focus in this paper was on the function of stimulation-based aerobic glycolysis, but recent work has detailed how the hemodynamic response may protect neuronal populations from acidification by its products (i.e., lactate; DiNuzzo et al., 2023). Age-based changes in cerebral hemodynamics may affect this neuroprotective property of the hemodynamic response, and the link we have proposed between stimulation-based aerobic glycolysis and prediction error encoding may help to clarify the cognitive and behavioral implications of these hemodynamic changes.
Third, although the effect of stimulation-based aerobic glycolysis is robust (Section 1; Figure 2), studies measuring CMRglc and CMRO2 during tasks remain rare, and to our knowledge studies simultaneously imaging both measures are entirely absent. In principle, functional imaging in PET (Villien et al., 2014) can be combined with quantitative fMRI (Germuska & Wise, 2018), which could allow for more precise estimates of stimulation-based aerobic glycolysis under a more meaningful set of task designs. In addition, stimulation-based aerobic glycolysis and stimulation-based increases in cerebral blood flow are highly correlated, but are separable under some circumstances (e.g., DiNuzzo et al., 2022; Stiernman et al., 2021), and careful task-based evidence could help to clarify these dynamics.
Finally, it is worth carefully considering whether the standard stimulus–response design is an appropriate test of brain function in fMRI, and whether alternatives might be more informative. Given that presenting visual/auditory stimuli against a static/silent baseline may “encourage oversampling of what might be an unnatural state of error processing” (Hutchinson & Barrett, 2019, p. 287), testing the brain under more naturalistic settings (e.g., continuous, first-person real-world scenes) might generate useful descriptives about brain metabolism and hemodynamics. Further, rather than focusing on the categorical content of stimuli (e.g., social/non-social content), methods might vary formal informational properties of the experimental setting (e.g., informational entropy over time in auditory or visual scenes; Shannon & Weaver, 1949/1964; for review, see Stone, 2018) and track how brain metabolism and hemodynamics react to different degrees of predictive perturbance. A natural implication of these methods is to transition fMRI methods away from trial-based designs, and toward settings that incorporate temporal dynamics. The use of stimulus–response designs is deeply embedded in psychological and neuroscientific paradigms (Dewey, 1896), and will likely not be easy to abandon; yet, the theoretical perspective that regions “activate” in response to “stimulation” may have helped make the phenomenon of stimulation-based aerobic glycolysis appear mysterious in the first place. The alternative is that “stimulation” causes a temporary perturbance (e.g., a prediction error) which is quickly corrected by homeostatic mechanisms (e.g., updating predictions). We hope that this change in perspective may help to solve theoretical problems in other areas of neuroscience as well.
Highlights.
An energy-inefficient form of brain metabolism occurs after task-based stimulation.
The function of this metabolic event has remained an open neurochemical puzzle.
We hypothesize that it fuels signaling in thin, informationally-efficient axons.
BOLD increases approximate these task-elicited changes in brain metabolism.
A metabolic framework can provide a novel functional interpretation of BOLD.
Acknowledgements
We would like to thank the reviewers for their comments, which considerably improved the quality of this manuscript. We also want to thank Amelia Theriault-Brown, Bruce Rosen, Dana Brooks, Dana Small, David Melnikoff, Douglas Rothman, Eli Sennesh, Katie Hoemann, Susan Whitfield-Gabrieli, and all members of the Interdisciplinary Affective Sciences Laboratory, and the PEN (Psychology, Engineering, Neuroscience) and Energetics working groups at Northeastern University for helpful conversation and feedback. This article was supported by grants from the National Cancer Institute (U01 CA193632; R01 CA258269), the National Institute of Mental Health (R01 MH113234; R01 MH109464; R21 MH129902), the National Institute on Aging (R01 AG071173), the National Institute of on Drug Abuse (R00 DA043629), the U.S. Army Research Institute for the Behavioral and Social Sciences (W911NF-16-1-019), the Roux Institute and Harold Alfond Foundation, and the Unlikely Collaborators Foundation. The views, opinions, and/or findings contained in this review are those of the author and shall not be construed as an official Department of the Army position, policy, or decision, unless so designated by other documents, nor do they necessarily reflect the views of the Unlikely Collaborator Foundation.
Footnotes
Compared to ~9% in chimpanzees, and ~5% in rats (Hofman, 1983), with the cross-species differences stemming from cross-species differences in encephalization quotient (brain-to-body size ratio; Gibbons, 1998).
Aerobic glycolysis also occurs outside the brain, although these cases are not the focus of this paper. Aerobic glycolysis occurs in cancer cells (where it is called the Warburg effect; Warburg et al., 1927), in red blood cells (which lack mitochondria; van Wijk & van Solinge, 2005), and in rapidly proliferating immune cells during inflammation (e.g. macrophages and T cells; O’Neill et al., 2016). In all these cases, the precise function of aerobic glycolysis remains an open question; and critically, its function in one case does not necessarily relate to its function in others. For example, in cancer cells aerobic glycolysis may help invasive growth by acidifying the microenvironment (Estrella et al., 2013), but in immune cells aerobic glycolysis is thought to support biosynthesis (O’Neill et al., 2016).
Here, aerobic glycolysis and anaerobic glycolysis refer to the presence/absence of oxygen, rather than the use of oxygen, as in aerobic metabolism.
Although exhaustive exercise can disrupt oxygen supplies in muscles, it generally does not disrupt oxygen delivery to the brain. The brain’s oxygen supply is a well-defended parameter, and the percentage of blood flow dedicated to the brain changes little between peak exercise and rest (Sterling, 2012; Weibel, 2000).
This slow temporal resolution has led most PET-based studies of aerobic glycolysis to focus on the “resting state”, where participants do not receive any task-based sensory stimulation or cognitive task. For adult human brains in the “resting state”, it has been suggested that aerobic glycolysis differs between brain regions and networks (Vaishnavi et al., 2010; Blazey et al., 2018; but see Hyder et al., 2016; Hyder, Fulbright, et al., 2013), and that aerobic glycolysis may increase early in human and primate development (Bauernfeind et al., 2014; Bauernfeind & Babbitt, 2014; Goyal et al., 2014; but see Benveniste et al., 2018). Although comprehensively addressing “resting state” aerobic glycolysis goes beyond our present scope, we return to address interpretations of “resting state” activity in Section 3.2.4, suggesting that even “at rest” the brain continues to receive sensory stimulation from the body and internal environment (i.e. interoception; Barrett, 2017b, 2017a; Kleckner et al., 2017). In other words, aerobic glycolysis observed in the “resting state” may also be stimulation-based, but may be triggered by interoceptive sensory signaling that is not explicitly manipulated in the experimental design (for a similar critique of the concept of “resting state”, see Herculano-Houzel & Rothman, 2022).
Although other studies have reported that aerobic glycolysis primarily occurs in astrocytes (e.g., Magistretti & Allaman, 2018; Pellerin & Magistretti, 1994), these observations are compromised by issues with the use of cultured cells (for review, see Dienel & Hertz, 2001; Hertz & Dienel, 2005). Nonetheless, evidence suggests that, in vivo, both neurons and astrocytes engage in aerobic glycolysis (Dienel, 2019; Rothman et al., 2022; Rothman & Dienel, 2019).
It has been proposed that metabolizing stored glycogen helps to supplement astrocytic energy requirements during local neural activity. This would allow astrocytes to relax their demands for circulating glucose, which, in turn, would allow circulating glucose to fuel neuronal energy requirements instead (DiNuzzo et al., 2010a, 2010b, 2012; Rothman et al., 2022; Rothman & Dienel, 2019; R. A. Swanson, 1992). Consistent with this, glycogen concentrations decrease during and after task-based stimulation (see Table 4, in Dienel & Rothman, 2019). However, such accounts explicitly acknowledge that neurons require glucose (to fuel glycolysis), and that neurons cannot fulfill this glucose-dependent function via lactate alone (i.e., to fuel oxphos, after conversion to pyruvate, as has been suggested by lactate shuttling accounts; Magistretti & Pellerin, 1999; Magistretti & Allaman, 2018, 2015; Pellerin & Magistretti, 1994). In these accounts, it has remained an open question why neurons have a specific metabolic need for glucose, which is the question the present work aims to address.
Extensive lipid synthesis through the PPP may affect OGI in circumstances outside of sensory stimulation and cognitive activity (Dienel & Cruz, 2016), meaning that non-energetic biosynthetic reactions may contribute to the “resting state” developmental differences in OGI referenced in footnote 5 (Bauernfeind et al., 2014; Bauernfeind & Babbitt, 2014).
If CMRglc increased 50%, and CMRO2 increased 5%, then the stimulation-based increase in oxphos contributes ATP at 5% of the baseline rate (and glycolysis contributes the other 45%). If the baseline rate were 1 unit, then stimulation-based oxphos contributes 32 × 0.05, or 1.6 units. Stimulation-based glycolysis contributes 2 × 0.45, or 0.9 units. 1.6 / (1.6 + 0.9) = 0.64.
We do not exclude the possibility that aerobic glycolysis might also support informational efficiency in other small cellular compartments (e.g., glial cell structural appendages; Rothman et al., 2022; Rothman & Dienel, 2019), but this section focuses on thin axons as the most prominent case because the empirical evidence is strong, and because neuronal signaling is a large source of brain energetic costs (as a percentage of the brain budget; Y. Yu et al., 2018). The proportional contributions from different small cellular compartments to stimulation-based aerobic glycolysis within a brain region is beyond our present scope and is a topic for future work. Here, we simply establish the principle that aerobic glycolysis is uniquely well-suited to provide ATP when and where it is needed to optimize informational efficiency.
Evolutionary changes can mitigate this noise. For example, temperature affects Na+/K+ fluctuations, and by holding body temperature constant, endotherms can optimize the physical properties of axons to maximize informational efficiency at a reliable level of noise (Faisal et al., 2005)—although this comes at a cost of increasing metabolic consumption to heat the body.
The lower limit on axon diameter of ~0.1 μm was demonstrated by simulation (Faisal et al., 2005), but fits well with empirical observations (Perge et al., 2012). In axons < 0.5 μm diameter, noise from Na+ leakage primarily interferes with signaling by decreasing the reliability of spike timing, the problem of which compounds when signals are transmitted across longer distances in unmyelinated axons (Faisal & Laughlin, 2007). In simulations of rat pyramidal cells (at 37°C), the rate of spontaneous firing only begin to climb exponentially in diameters < 0.1 μm (Faisal et al., 2005).
The qualification that average firing rates decrease with axon diameter is important. In thin axons spontaneous firing (i.e., noise) can increase (Faisal et al., 2005, 2008; Faisal & Laughlin, 2007), meaning that, when stimulated, firing rates in axons nearly 0.1 μm thin may need to exceed the rate of spontaneous firing for the transmitted signal to be distinguished from noise. For example, at the hypothetical extreme, a thin axon may be so noisy that the only signal that could be distinguished from noise would be a high-frequency burst. However, even with such burst-firing, the average firing rate of the axon would be low if it is generally silent and only occasionally sends a bursting signal. The close alignment between empirical measure of axon diameter and average firing rates in retinal ganglion cells (during naturalistic viewing) suggest that this is the case, and that the average firing rate decreases with axon diameter (Figure 3c; Koch et al., 2006).
Rare/surprising messages carry more Shannon Information because information, under this specific definition, is defined as the reduction of uncertainty (Cover & Thomas, 1991; Shannon & Weaver, 1949/1964; Stone, 2018). An example helps make it intuitive that rare events are informative. If you rarely speak to your grandmother, then if your phone rang at 5am and displayed her caller ID, then you would probably assume that the call is important. She may have called accidentally, but you can estimate the rate of accidental calls (i.e., the noise rate) and if she calls more often (e.g., twice in a row), then you know to pick up.
Information per spike (bits/spike) is calculated by dividing the information rate by the average spiking rate (Koch et al., 2006), both of which are estimated from empirical data (de Ruyter van Steveninck et al., 1997; Strong et al., 1997). A large increase in spontaneous firing (i.e., noise) would decrease bits/spike by increasing the average spiking rate (the denominator), but as discussed in footnote 13, noise in thin axons (< 0.5 μm) generally manifests as a decrease in spike train reliability (Faisal & Laughlin, 2007), and spontaneous action potentials only begin to increase exponentially at diameters < 0.1 μm (Figure, 2b; Faisal et al., 2005).
We hypothesize that glycolysis provides supplemental ATP in small cellular compartments with low concentrations of mitochondria. A subtle criticism of this hypothesis (for which we owe thanks an anonymous reviewer) raised the issue that an early step of glycolysis may not be able to proceed without enzymes that are predominantly bound to mitochondria. Specifically, in the first step of glycolysis, glucose is converted (by phosphorylation) to Glc-6-P (glucose-6-phosphate) using hexokinase (HK). HK-I is the dominant HK enzyme in the brain (Garner et al., 1996; Hinckelmann et al., 2016; Kao-Jen & Wilson, 1980; Snyder & Wilson, 1983; Wilkin & Wilson, 1977), and is predominantly bound to mitochondria (e.g., Crane & Sols, 1953). HK requires 1 ATP to phosphorylate glucose to Glc-6-P, and the plentiful ATP produced by mitochondrial oxphos gives mitochondria-bound HK-1 an ample ATP supply (reviewed by Wilson, 1995, 2003). Given this, the criticism is: if mitochondria are sparsely populated in thin axons, and if mitochondria-bound HK-I phosphorylate glucose to Glc-6-P, then how could glycolysis occur in the absence of mitochondria? A response to this criticism is that evidence suggests soluble and mitochondrially-unbound hexokinase are catalytically active and can carry out such phosphorylation (Newsholme et al., 1968; Wilson, 1995, 2003). Further, unbound hexokinase can travel through the axon at rates 10-fold slower than mitochondria, suggesting that, “in the axon, the enzyme exhibits transient or dynamic interactions with [rapidly moving] mitochondria” (Garner et al., 1996, p. 845). Notably, HK-I (and other glycolytic enzymes) are present in self-propelling vesicles involved in fast axonal transport, and glycolysis is sufficient to provide the ATP for this process (Hinckelmann et al., 2016). Axons also express the neuronal glucose transporter GLUT3 (I. A. Simpson et al., 2008), making glucose available to intra-axonal glycolysis.
Also note that, in normoglycemic subjects, glucose availability is not rate limiting, meaning that glucose is delivered to brain regions in excess of what is used, even during sensory stimulation and stimulation-based aerobic glycolysis. In other words, brain metabolism may already have a built-in buffer to tolerate energetically inefficient glucose metabolism (Dienel, 2019; but see discussion of glucose transport limitations in Rothman et al., 2022).
The original quote described aerobic glycolysis as a “low-capacity but fast mechanism for ATP production” (emphasis added; Yellen, 2018), but we edited it to avoid a common point of confusion about whether glycolysis is “fast” in the sense that it might produce more ATP per unit time. It is not, and oxphos produces more ATP per unit time (for review, see DiNuzzo et al., 2012 and papers cited within).
Some solutions to fluctuations in energy demands can address local fluctuations, but not sustained and globally distributed increases in energy demand. For example, as discussed in Section 2.2, ATP-diffusion (e.g., Kuznetsov & Kuznetsov, 2023; Pathak et al., 2015) or mitochondrial migration (e.g., Sheng, 2017) can redistribute energy to stabilize local increases (e.g., at synapses or nodes of Ranvier); but these solutions may be less applicable to cases where an entire neuron switches between a low-energy and high-energy state (e.g., fast-spiking inhibitory interneurons; Kann, 2016; see Section 3.1.3).
This idea is subtly different from another common mistaken assumption about stimulation-based aerobic glycolysis, which is that—by producing ATP quickly—it acts as a metabolic “first responder” (e.g. R. A. Harris et al., 2019). A “first responder” account suggests that aerobic glycolysis fulfills sudden increases in metabolic demand, but that these demands can later be met by oxphos after it scales up ATP production (i.e., meeting intermediate demand in Figure 5). The “first responder” account is inconsistent with evidence that aerobic glycolysis persists throughout activation (Madsen et al., 1995, 1998), during which time oxphos could presumably “catch up” (Dienel & Cruz, 2016). Analogously, peaking generators do not just supply energy until baseload plants “catch up” to the new level of demand—because a spike in demand could just as quickly cease, in which case the baseload plant would overproduce energy while it scales production back down again. Peaking generators are not just necessary to meet sudden increases in demand; they are necessary to match production to fluctuating demands as closely as possible.
Further evidence in favor of the efficiency tradeoff hypothesis could be gained by directly measuring stimulation-based aerobic glycolysis in small diameter axons with low mitochondrial densities (Figure 4d); however, collecting in vivo functional data in such small structures is difficult in practice (for discussion, see Faisal & Laughlin, 2007).
The hemodynamic response is a complex biophysical and physiological process, and subcomponents of the response have been the subject of intensive research (for review, see S.-G. Kim & Ogawa, 2012). In this paper we focus on BOLD signal intensity increases; however, the metabolic and physiological processes responsible for BOLD signal intensity decreases below a “resting” baseline—i.e., negative BOLD “activity”—are an area of activity study (e.g., Stiernman et al., 2021; for review, see Moraschi et al., 2012). It is important to emphasize, however, that BOLD signal intensity decreases cannot simply be considered the “opposite” of BOLD signal intensity increases, and may depend on several processes, such as increases in neural inhibition, decreases in CBF, or increases in CMRO2 (for review, see S.-G. Kim & Ogawa, 2012). In other words, the negative BOLD response is multiply determined, and explanations for it may not generalize across the entire brain (e.g., Ekstrom, 2010).
This should not be taken to imply that brain regions consume all glucose or oxygen delivered to them. Under resting conditions, oxygen and glucose are delivered to the brain well in excess of use (Dienel, 2019).
Indeed, that local “activation” involves both a small increase in CMRO2 and a larger increase in CMRglc means that the hemodynamic response might serve multiple functions at once—e.g., it may increase pO2 so that oxygen can be metabolized further from the capillary bed, but, at the same time, it may regulate consequences that follow from the relative increase in glycolysis. Indeed, recently developed models suggest exactly this: that the hemodynamic response simultaneously maintains homeostasis of pO2, pCO2, and pH, where, in the absence of the hemodynamic response, stimulation-based aerobic glycolysis would increase the local concentrations of lactate and protons and impair brain function (DiNuzzo et al., 2023).
Although beyond our present scope, there is great promise in linking the cognitive–neural mechanisms described by Mather and colleagues (see Fig. 6 & Fig. 8 in Mather et al., 2016) with the cellular–metabolic mechanisms (and their connections to vagal signaling and the peripheral action of norepinephrine/epinephrine) described by Dienel and Cruz (see Fig 4. in Dienel & Cruz, 2016). We see the diagram of relationships in Figure 6 as a useful staging ground for integrating these connections between levels of analysis identified in this other work. For example, norepinephrine release is also stimulated by the lactate exported by aerobic glycolysis (F. Tang et al., 2014), suggesting that further investigation of this link could be a rich area for future work.
Although some differences in the relationship between hemodynamic decoupling and gamma oscillations have been observed in subcortical structures, e.g. in the hippocampus and parahippocampal gyrus BOLD signal intensity increases correlate with theta power (4–8 Hz), but not gamma power (e.g., Ekstrom et al., 2009; for review, see Ekstrom, 2010).
A important limitation is that all studies showing glucose-dependent population spiking and gamma oscillations were conducted in hippocampal tissue—either dentate gyrus (Bachelard et al., 1984; D. W. G. Cox & Bachelard, 1982, 1988a, 1988b; Kanatani et al., 1995), or CA1 and CA3 subfields (Galow et al., 2014; Hollnagel et al., 2020). The relationship between BOLD signal intensity increases and LFPs (including gamma oscillations) may differ in the hippocampus (Ekstrom, 2010), making is important that future work replicate these results in cortical tissue.
Another relevant piece of evidence was brought to our attention by an anonymous reviewer. Following cardiac arrest, a surge in gamma power has been observed in both rats (Borjigin et al., 2013) and humans (Xu et al., 2023) after the loss of oxygenated blood pulse, but before brain death. Notably, in rats, following the sudden onset of ischemia by decapitation, the rate of glycolysis increased by over 7-fold after 4 seconds (Lowry et al., 1964). It is possible that the surge in gamma power and glycolytic metabolism are related, with glucose fueling the post-cardiac arrest surge in gamma power.
It is also worth noting that properties of FSP+ interneurons make them a likely candidate through which norepinephrine may modulate metabolic and hemodynamic decoupling (Section 3.1.2; see also, Section 7.1 in Mather et al., 2016). FSP+ interneurons in hippocampal slices strongly express β1-adrenoreceptors (D. J. Cox et al., 2008), and are particularly affected by norepinephrine (Huang et al., 2013; Toussay et al., 2013). There is also a potential contradiction here, as Dienel and Cruz (2016) hypothesized that β2 receptors (as opposed to β1 receptors) were responsible for stimulation-based aerobic glycolysis, because propranolol, a non-selective β-blocker, prevented metabolic decoupling, but metoprolol, a β1 selective blocker, did not (Dalsgaard, Ogoh, et al., 2004; Schmalbruch et al., 2002). Solving this contradiction is beyond our scope, but the connections reviewed in Section 3 may help form a roadmap for its resolution.
It should also be noted, however, that in most circumstances the local field potentials (LFPs) that reflect local perisynaptic activity are highly correlated with multi-unit activity (MUA)—which reflects neuronal spiking of local populations—and that careful experimental work was necessary to dissociate the two (Logothetis et al., 2001). That is, LFP and MUA are often correlated, but when pulled apart LFP is generally the component associated with BOLD (but see Ekstrom, 2010). Likewise, BOLD and stimulation-based aerobic glycolysis are correlated, but we are not aware of any work identifying whether aerobic glycolysis has a dissociable relationship with LFPs or MUA. We note this to say that the relationships between MUA, LFP, aerobic glycolysis, and the BOLD signal are not settled, and that the distinct contributions of aerobic glycolysis and oxphos to MUA and LFPs have generally been downplayed in this area of research (Ekstrom, 2010; Logothetis, 2008). Again, this deemphasis of metabolism likely stems from the lack of clarity around the function of stimulation-based aerobic glycolysis, and attending to the role of stimulation-based aerobic glycolysis in future work could fill a critical gap in this area.
Neither Niessing nor Logothetis measured activity in interneurons, and neither proposed hypotheses about the contribution of particular subpopulations of interneurons (e.g., FSP+ interneurons); but, their ideas do find support in a developing line of optogenetic research that is investigating the precise mechanisms relating vasodilation/vasoconstriction and activity in subpopulations of inhibitory interneurons (Anenberg et al., 2015; Echagarruga et al., 2020; Krawchuk et al., 2020; Uhlirova et al., 2016; Vazquez et al., 2018). Of particular importance, the hemodynamic response appears to be minimally influenced by excitatory neural activity, and instead is regulated by vasoactive messengers released by inhibitory interneurons (Uhlirova et al., 2016).
This internal model of the world does not model all aspects of the world, rather, it models aspects of the world that are relevant to maintaining and operating the body that houses the brain (Conant & Ross Ashby, 1970; Ross Ashby, 1960; Sterling, 2012; Sterling & Laughlin, 2015).
Keller and Mrsic-Flogel (2018, p. 426) suggest that predictive processing does not affect the metabolic costs of signaling, as each prediction-error spike must be approximately cancelled by a prediction spike. But this assumes that spikes cancel 1:1, and that the brain is strictly hierarchical, as opposed to a heterarchy where predictions can take shortcuts across hierarchical levels (e.g. through the thalamus).
The relationship between attention and neuromodulation is complex and beyond the scope of what can be reviewed in the present work (but see K. D. Harris & Thiele, 2011; McCormick et al., 2020). We highlight the role of norepinephrine only to suggest one inroad through which brain metabolism might be related to this broader field.
For example, metabolic decoupling correlates with hemodynamic decoupling, but the two can separated under some circumstances. Recent work observed that tasked-elicited BOLD decreases in the default-mode network (relative to a “resting” baseline) occur without any corresponding decrease in glucose metabolism (e.g., Koush et al., 2021; Stiernman et al., 2021), consistent with the view the BOLD increases and decreases cannot simply be considered “opposites” (S.-G. Kim & Ogawa, 2012). Critically, under some circumstances, BOLD signal intensity increases and aerobic glycolysis are separable—e.g., in primary visual cortex while a stimulus flickered imperceptibly (DiNuzzo et al., 2022), and while participants performed a working memory task (Stiernman et al., 2021, also see, 2023). The detailed circumstances of this decoupling are an important topic for future work, but one reason for it could stem from differences in the temporal profiles of habituation between BOLD, CBF, CMRO2, and CMRglc (see discussion in Sonnay et al., 2017). Habituation describes a decrease in a measure (e.g., firing in single cells, BOLD signal intensity in fMRI) after sustained or repetitive stimulation (in a stimulus–response interpretive framework; Barron et al., 2016), or equivalently, the presence of sensory signals that possess temporally predictable components (in a predictive processing framework; Auksztulewicz & Friston, 2016). Metabolic habituation has been observed without equivalent habituation in BOLD (e.g., Moradi & Buxton, 2013), meaning that hemodynamic decoupling in the absence of metabolic decoupling may indicate that CMRglc habituated while the increase in CBF producing the BOLD signal did not. It is also important to note that classic paradigms that elicit sustained increases in V1 metabolic decoupling used stimuli in which sensory signals change over time—e.g., moving or flickering visual checkerboards (e.g., Fox et al., 1988; Li & Freeman, 2015; Mangia, Tkác, et al., 2007)—and these stimuli would induce prediction error at low levels of the cortical processing heterarchy, which V1 occupies (Rao & Ballard, 1999). By contrast, stimuli that are perceived as stationary elicit a BOLD signal intensity increase, but no sustained increase in CMRglc (DiNuzzo et al., 2022), and likewise, a working memory task elicits both metabolic and hemodynamic decoupling in brain regions high in the predictive heterarchy (e.g., DLPFC), but only hemodynamic decoupling in primary visual cortex (Stiernman et al., 2021). A predictive processing account would interpret both of these results as a result of habituation to predictable, low-level visual features of the task. Also see footnote 31 for a brief discussion of emerging evidence on the control of the hemodynamic response by vasoactive messengers released by interneurons. Notably, FSP+ interneurons do not appear to directly control the hemodynamic response, but interact with other interneurons that do (Vo et al., 2023).
In fact, Logothetis criticizes the traditional stimulus–response model from a perspective very similar to other critics (e.g., Cisek, 1999; Powers, 1973; Yin, 2020), noting that “we now know that the traditional cortical input–elaboration–output scheme, commonly presented as an instantiation of the tripartite perception–cognition–action model, is probably a misleading oversimplification.” (Logothetis, 2008, p. 872). Although Logothetis’ review predates the popularization of predictive processing approaches, he goes on to review evidence that is consistent with its fundamental claims: “Research shows that the subcortical input to cortex is weak; the feedback is massive, the local connectivity reveals strong excitatory and inhibitory recurrence, and the output reflects changes in the balance between excitation and inhibition, rather than simple feedforward integration of subcortical inputs.” (Logothetis, 2008, p. 872).
Stimulus–response assumptions may even influence interpretations of BOLD fMRI signals “at rest”. For example, resting state BOLD networks (the default-mode network in particular) were initially interpreted as important for spontaneous self-referential thought (Buckner, 2012; Gusnard & Raichle, 2001). But self-referential thought is analogous to self-caused “stimulation” in the absence of an external stimulus. Since then, it has been proposed that the default-mode network contributes to other functions, such as social cognition, autobiographical memory, and mental simulation (Buckner et al., 2008; Buckner & DiNicola, 2019)—all of which still assume the presence of some internal event in lieu of external stimulation. An alternative interpretation is that BOLD signal intensity increases in the default-mode network while subjects are “at rest” may relate to processing prediction error from high-level multimodal compressed sensory data; or, potentially, from prediction error related to bodily signals (i.e. interoceptive sensory data; Barrett & Simmons, 2015; Craig, 2015; Seth, 2013). This later hypothesis is supported by the overlap between the default-mode network and interoceptive cortex, by theoretical perspectives emphasizing that the brain evolved to regulate the body (e.g., Cisek, 2019; Sterling, 2012; Sterling & Laughlin, 2015), and by the sheer variety of tasks that elicit default-mode network activity (Kleckner et al., 2017). The idea that default mode network signals do not stem from self-initiated events is also supported by the observation that even when BOLD signal intensity decreases within the default-mode network (during a working memory task), glucose consumption in the network remains unchanged—a result that is “difficult to reconcile with a notion that … rest is just another task state” (Stiernman et al., 2021, p. 5). In other words, from a predictive interpretation, increases in BOLD signal intensity in the default-mode network may relate, in part, to interoceptive sensory signals, which are continuously monitored and critical to survival (even while lying still in the scanner). The brain, and its attached body, while alive, are never truly “at rest”.
The baseload metabolic cost of the brain “at rest” is ~20% of whole-body ATP, and Raichle reports that stimulation-based increases in brain energy consumption often represent less than a 5% increase above that baseload (Raichle, 2010). An important issue for future work has to do with the ratio between the depth of the “lake”—i.e. the proportion of energy devoted to baseload brain activity (Shulman et al., 2007, 2009)—and the “ripples” of stimulation-based increases in aerobic glycolysis and (to a lesser extent) oxidative metabolism. This issue is of particular importance in animal research using anesthesia, where anesthesia alters brain metabolism in complex ways, dependent on the drug, dose, and duration (Austin et al., 2005; Boretius et al., 2013; Brunner et al., 1971; Lindauer et al., 1993; Masamoto & Kanno, 2012; Müller et al., 2011; Stullken et al., 1977), but generally tends to depress baseload brain metabolism. This depressed baseline affects the stimulus-evoked BOLD increase, meaning that, at a depressed baseline, larger incremental changes are required reach the same absolute level of metabolic activity (Shulman et al., 2007, 2009)—i.e., to reach the same absolute height, “waves” must be larger in a shallow “lake”.
There is some evidence that imagined speech can be decoded from BOLD fMRI at accuracies above chance (J. Tang, LeBel, et al., 2023), and if performance of these models were to improve considerably outside of the controlled circumstances that are currently tested within (e.g., imagining a previously memorized story) then this could be evidence against our hypothesis that the BOLD response indexes sensory prediction error. However, it is also possible that internal speech is encoded similarly to other forms of sensation in cortical regions at hierarchical levels above primary sensory regions. If this is the case, then generating speech covertly and hearing speech from an external source would generate similar high-level prediction errors, and encoding models trained on external speech could generalize to internal speech. Clarifying this conceptual point is beyond our present scope, but the observation that auditory hallucinations are internally generated but experienced as coming from an external source suggests that covert speech and auditory processing may be closely related (Corlett et al., 2019).
For example, consider an experiment with three stimulus conditions—i.e., three directions of “wind” blowing over the “lake”—where participants are stimulated by (a) heat, (b) pressure on the thumbnail, and (c) pictures of an ex-romantic partner (Krishnan et al., 2016). Participants report their subjective experience of pain in all cases, and a classifier, trained on the BOLD “ripples” from (a), predicts subjective reports of pain in (b) but not (c). One might conclude that subjective experiences of pain in (a)/(b) involve a similar underlying mechanism, and that subjective pain in (c) involves a different one. But the success of the classifier depends on similarities between patterns of “ripples”, which stem from “wind” blowing in overlapping directions. In actuality, the subjective sensation of “feeling pain” may depend, in part, on underlying processes “below the surface” (e.g., predictions), which may not elicit aerobic glycolysis or a measurable BOLD response. The subjective sense of “pain” may or may not be similar across the three conditions, but analyzing the “ripples” (i.e., patterns in the BOLD signal) will almost certainly give an incomplete answer. (For a different, but complementary use of the lake and ripple metaphor of brain response, see Lashley, 1951; and additional discussion in Anderson, 2014, p. 60).
Note that Barbas’ approach to modeling cortical connections emphasizes the importance of cortical structure and is distinct from approaches taken in other well-known models (e.g., distance models; Markov et al., 2013). A detailed discussion of these differences is beyond our present scope (but for review, see Chanes & Barrett, 2016).
Combined laminar fMRI and extracranial EEG recordings of human visual cortex also demonstrate that positive BOLD-gamma correlations are localized to upper layers, and negative BOLD-alpha correlations are localized to deep layers (Scheeringa et al., 2016).
Autism is also strongly influenced by genetics (Geschwind, 2011; Krumm et al., 2014; Yoo, 2015), and a major class of genes implicated in autism relate to aerobic glycolysis (Vallée & Vallée, 2018), These genes affect metabolic signaling in the WNT/β-catenin pathway (Krumm et al., 2014) and act to downregulate the conversion of pyruvate into inputs for oxphos (Figure 1a), meaning that less ATP than usual can be generated from oxphos, i.e., the most energetically efficient metabolic pathway. In other words, disrupting the WNT/β-catenin pathway may alter the balance between oxidative (baseload) and glycolytic (peaking) energy production, making less energy available for prediction, and more available for prediction error. While speculative, this line of reasoning could provide a novel metabolic perspective of accounts of autism examining the balance of excitation and inhibition (Nelson & Valakh, 2015; Pizzarelli & Cherubini, 2011; Rubenstein & Merzenich, 2003).
Publisher's Disclaimer: This is a PDF file of an unedited manuscript that has been accepted for publication. As a service to our customers we are providing this early version of the manuscript. The manuscript will undergo copyediting, typesetting, and review of the resulting proof before it is published in its final form. Please note that during the production process errors may be discovered which could affect the content, and all legal disclaimers that apply to the journal pertain.
References
- Ackermann RF, & Lear JL (1989). Glycolysis-induced discordance between glucose metabolic rates measured with radiolabeled fluorodeoxyglucose and glucose. Journal of Cerebral Blood Flow and Metabolism: Official Journal of the International Society of Cerebral Blood Flow and Metabolism, 9(6), 774–785. 10.1038/jcbfm.1989.111 [DOI] [PubMed] [Google Scholar]
- Adachi K, Cruz NF, Sokoloff L, & Dienel GA (1995). Labeling of metabolic pools by [6–14C]glucose during K(+)-induced stimulation of glucose utilization in rat brain. Journal of Cerebral Blood Flow and Metabolism: Official Journal of the International Society of Cerebral Blood Flow and Metabolism, 15(1), 97–110. 10.1038/jcbfm.1995.11 [DOI] [PubMed] [Google Scholar]
- Al-Mosalem OA, El-Ansary A, Attas O, & Al-Ayadhi L (2009). Metabolic biomarkers related to energy metabolism in Saudi autistic children. Clinical Biochemistry, 42(10–11), 949–957. 10.1016/j.clinbiochem.2009.04.006 [DOI] [PubMed] [Google Scholar]
- Alnæs D, Sneve MH, Espeseth T, Endestad T, van de Pavert SHP, & Laeng B (2014). Pupil size signals mental effort deployed during multiple object tracking and predicts brain activity in the dorsal attention network and the locus coeruleus. Journal of Vision, 14(4). 10.1167/14.4.1 [DOI] [PubMed] [Google Scholar]
- Anderson ML (2014). After Phrenology: Neural Reuse and the Interactive Brain. MIT Press. [Google Scholar]
- Anenberg E, Chan AW, Xie Y, LeDue JM, & Murphy TH (2015). Optogenetic stimulation of GABA neurons can decrease local neuronal activity while increasing cortical blood flow. Journal of Cerebral Blood Flow & Metabolism, 35(10), 1579–1586. 10.1038/jcbfm.2015.140 [DOI] [PMC free article] [PubMed] [Google Scholar]
- Arnal LH, & Giraud A-L (2012). Cortical oscillations and sensory predictions. Trends in Cognitive Sciences, 16(7), 390–398. 10.1016/j.tics.2012.05.003 [DOI] [PubMed] [Google Scholar]
- Ashar YK, Andrews-Hanna JR, Dimidjian S, & Wager TD (2017). Empathic care and distress: Predictive brain markers and dissociable brain systems. Neuron, 94(6), 1263–1273.e4. 10.1016/j.neuron.2017.05.014 [DOI] [PMC free article] [PubMed] [Google Scholar]
- Ashrafi G, & Ryan TA (2017). Glucose metabolism in nerve terminals. Current Opinion in Neurobiology, 45, 156–161. 10.1016/j.conb.2017.03.007 [DOI] [PMC free article] [PubMed] [Google Scholar]
- Aston-Jones G, & Cohen JD (2005). An integrative theory of locus coeruleus-norepinephrine function: Adaptive gain and optimal performance. Annual Review of Neuroscience, 28, 403–450. 10.1146/annurev.neuro.28.061604.135709 [DOI] [PubMed] [Google Scholar]
- Attwell D, & Laughlin SB (2001). An energy budget for signaling in the grey matter of the brain. Journal of Cerebral Blood Flow & Metabolism, 21(10), 1133–1145. 10.1097/00004647-200110000-00001 [DOI] [PubMed] [Google Scholar]
- Auksztulewicz R, & Friston K (2016). Repetition suppression and its contextual determinants in predictive coding. Cortex, 80, 125–140. 10.1016/j.cortex.2015.11.024 [DOI] [PMC free article] [PubMed] [Google Scholar]
- Austin VC, Blamire AM, Allers KA, Sharp T, Styles P, Matthews PM, & Sibson NR (2005). Confounding effects of anesthesia on functional activation in rodent brain: A study of halothane and α-chloralose anesthesia. NeuroImage, 24(1), 92–100. 10.1016/j.neuroimage.2004.08.011 [DOI] [PubMed] [Google Scholar]
- Bachelard HS, Cox DW, & Drower J (1984). Sensitivity of guinea-pig hippocampal granule cell field potentials to hexoses in vitro: An effect on cell excitability? The Journal of Physiology, 352(1), 91–102. 10.1113/jphysiol.1984.sp015279 [DOI] [PMC free article] [PubMed] [Google Scholar]
- Bangsbo J, Krustrup P, González-Alonso J, Boushel R, & Saltin B (2000). Muscle oxygen kinetics at onset of intense dynamic exercise in humans. American Journal of Physiology. Regulatory, Integrative and Comparative Physiology, 279(3), R899–906. 10.1152/ajpregu.2000.279.3.R899 [DOI] [PubMed] [Google Scholar]
- Barbas H (2015). General cortical and special prefrontal connections: Principles from structure to function. Annual Review of Neuroscience, 38(1), 269–289. 10.1146/annurev-neuro-071714-033936 [DOI] [PubMed] [Google Scholar]
- Baron-Cohen S (1995). Mindblindness: An Essay on Autism and Theory of Mind. MIT Press. [Google Scholar]
- Baron-Cohen S (2000). Theory of mind and autism: A review. In Glidden LM (Ed.), International Review of Research in Mental Retardation (Vol. 23, pp. 169–184). Academic Press. 10.1016/S0074-7750(00)80010-5 [DOI] [Google Scholar]
- Baron-Cohen S (2009). Autism: The Empathizing-Systemizing (E-S) Theory. Annals of the New York Academy of Sciences, 1156(1), 68–80. 10.1111/j.1749-6632.2009.04467.x [DOI] [PubMed] [Google Scholar]
- Baron-Cohen S, Leslie AM, & Frith U (1985). Does the autistic child have a “theory of mind”? Cognition, 21(1), 37–46. 10.1016/0010-0277(85)90022-8 [DOI] [PubMed] [Google Scholar]
- Barrett LF (2017a). How Emotions Are Made: The Secret Life of the Brain. Pan Macmillan. [Google Scholar]
- Barrett LF (2017b). The theory of constructed emotion: An active inference account of interoception and categorization. Social Cognitive and Affective Neuroscience, 12(1), 1–23. 10.1093/scan/nsw154 [DOI] [PMC free article] [PubMed] [Google Scholar]
- Barrett LF, Quigley KS, & Hamilton P (2016). An active inference theory of allostasis and interoception in depression. Philosophical Transactions of the Royal Society B: Biological Sciences, 371(1708), 20160011. 10.1098/rstb.2016.0011 [DOI] [PMC free article] [PubMed] [Google Scholar]
- Barrett LF, & Simmons WK (2015). Interoceptive predictions in the brain. Nature Reviews Neuroscience, 16(7), 419–429. 10.1038/nrn3950 [DOI] [PMC free article] [PubMed] [Google Scholar]
- Barron HC, Garvert MM, & Behrens TEJ (2016). Repetition suppression: A means to index neural representations using BOLD? Philosophical Transactions of the Royal Society B: Biological Sciences, 371(1705), 20150355. 10.1098/rstb.2015.0355 [DOI] [PMC free article] [PubMed] [Google Scholar]
- Barton RA, & Venditti C (2013). Human frontal lobes are not relatively large. Proceedings of the National Academy of Sciences, 110(22), 9001–9006. 10.1073/pnas.1215723110 [DOI] [PMC free article] [PubMed] [Google Scholar]
- Bartos M, Vida I, & Jonas P (2007). Synaptic mechanisms of synchronized gamma oscillations in inhibitory interneuron networks. Nature Reviews Neuroscience, 8(1), Article 1. 10.1038/nrn2044 [DOI] [PubMed] [Google Scholar]
- Bastos AM, Loonis R, Kornblith S, Lundqvist M, & Miller EK (2018). Laminar recordings in frontal cortex suggest distinct layers for maintenance and control of working memory. Proceedings of the National Academy of Sciences, 115(5), 1117–1122. 10.1073/pnas.1710323115 [DOI] [PMC free article] [PubMed] [Google Scholar]
- Bastos AM, Lundqvist M, Waite AS, Kopell N, & Miller EK (2020). Layer and rhythm specificity for predictive routing [Preprint]. Neuroscience. 10.1101/2020.01.27.921783 [DOI] [PMC free article] [PubMed] [Google Scholar]
- Bastos AM, Usrey WM, Adams RA, Mangun GR, Fries P, & Friston KJ (2012). Canonical Microcircuits for Predictive Coding. Neuron, 76(4), 695–711. 10.1016/j.neuron.2012.10.038 [DOI] [PMC free article] [PubMed] [Google Scholar]
- Bastos AM, Vezoli J, Bosman CA, Schoffelen J-M, Oostenveld R, Dowdall JR, De Weerd P, Kennedy H, & Fries P (2015). Visual Areas Exert Feedforward and Feedback Influences through Distinct Frequency Channels. Neuron, 85(2), 390–401. 10.1016/j.neuron.2014.12.018 [DOI] [PubMed] [Google Scholar]
- Bauer M, Oostenveld R, Peeters M, & Fries P (2006). Tactile spatial attention enhances gamma-band activity in somatosensory cortex and reduces low-frequency activity in parieto-occipital areas. The Journal of Neuroscience: The Official Journal of the Society for Neuroscience, 26(2), 490–501. 10.1523/JNEUROSCI.5228-04.2006 [DOI] [PMC free article] [PubMed] [Google Scholar]
- Bauernfeind AL, & Babbitt CC (2014). The appropriation of glucose through primate neurodevelopment. Journal of Human Evolution, 77, 132–140. 10.1016/j.jhevol.2014.05.016 [DOI] [PubMed] [Google Scholar]
- Bauernfeind AL, Barks SK, Duka T, Grossman LI, Hof PR, & Sherwood CC (2014). Aerobic glycolysis in the primate brain: Reconsidering the implications for growth and maintenance. Brain Structure and Function, 219(4), 1149–1167. 10.1007/s00429-013-0662-z [DOI] [PubMed] [Google Scholar]
- Bednařík P, Tkáč I, Giove F, DiNuzzo M, Deelchand DK, Emir UE, Eberly LE, & Mangia S (2015). Neurochemical and BOLD Responses during Neuronal Activation Measured in the Human Visual Cortex at 7 Tesla. Journal of Cerebral Blood Flow & Metabolism, 35(4), 601–610. 10.1038/jcbfm.2014.233 [DOI] [PMC free article] [PubMed] [Google Scholar]
- Benveniste H, Dienel G, Jacob Z, Lee H, Makaryus R, Gjedde A, Hyder F, & Rothman DL (2018). Trajectories of Brain Lactate and Re-visited Oxygen-Glucose Index Calculations Do Not Support Elevated Non-oxidative Metabolism of Glucose Across Childhood. Frontiers in Neuroscience, 12. 10.3389/fnins.2018.00631 [DOI] [PMC free article] [PubMed] [Google Scholar]
- Bianchi S, Stimpson CD, Bauernfeind AL, Schapiro SJ, Baze WB, McArthur MJ, Bronson E, Hopkins WD, Semendeferi K, Jacobs B, Hof PR, & Sherwood CC (2013). Dendritic Morphology of Pyramidal Neurons in the Chimpanzee Neocortex: Regional Specializations and Comparison to Humans. Cerebral Cortex (New York, NY), 23(10), 2429–2436. 10.1093/cercor/bhs239 [DOI] [PMC free article] [PubMed] [Google Scholar]
- Bickler PE, & Hansen BM (1996). Alpha 2-adrenergic agonists reduce glutamate release and glutamate receptor-mediated calcium changes in hippocampal slices during hypoxia. Neuropharmacology, 35(6), 679–687. 10.1016/0028-3908(96)84639-9 [DOI] [PubMed] [Google Scholar]
- Blazey T, Snyder AZ, Su Y, Goyal MS, Lee JJ, Vlassenko AG, Arbeláez AM, & Raichle ME (2018). Quantitative positron emission tomography reveals regional differences in aerobic glycolysis within the human brain. Journal of Cerebral Blood Flow & Metabolism, 0271678X1876700. 10.1177/0271678X18767005 [DOI] [PMC free article] [PubMed] [Google Scholar]
- Boretius S, Tammer R, Michaelis T, Brockmöller J, & Frahm J (2013). Halogenated volatile anesthetics alter brain metabolism as revealed by proton magnetic resonance spectroscopy of mice in vivo. NeuroImage, 69, 244–255. 10.1016/j.neuroimage.2012.12.020 [DOI] [PubMed] [Google Scholar]
- Borjigin J, Lee U, Liu T, Pal D, Huff S, Klarr D, Sloboda J, Hernandez J, Wang MM, & Mashour GA (2013). Surge of neurophysiological coherence and connectivity in the dying brain. Proceedings of the National Academy of Sciences, 110(35), 14432–14437. 10.1073/pnas.1308285110 [DOI] [PMC free article] [PubMed] [Google Scholar]
- Braem S, Coenen E, Bombeke K, van Bochove ME, & Notebaert W (2015). Open your eyes for prediction errors. Cognitive, Affective, & Behavioral Neuroscience, 15(2), 374–380. 10.3758/s13415-014-0333-4 [DOI] [PubMed] [Google Scholar]
- Braitenberg V, & Schüz A (1991). Anatomy of the Cortex: Statistics and Geometry. Springer-Verlag. 10.1007/978-3-662-02728-8 [DOI] [Google Scholar]
- Bressler SL, & Richter CG (2015). Interareal oscillatory synchronization in top-down neocortical processing. Current Opinion in Neurobiology, 31, 62–66. 10.1016/j.conb.2014.08.010 [DOI] [PubMed] [Google Scholar]
- Brodski A, Paasch G-F, Helbling S, & Wibral M (2015). The Faces of Predictive Coding. The Journal of Neuroscience: The Official Journal of the Society for Neuroscience, 35(24), 8997–9006. 10.1523/JNEUROSCI.1529-14.2015 [DOI] [PMC free article] [PubMed] [Google Scholar]
- Brunner EA, Passonneau JV, & Molstad C (1971). The effect of volatile anaesthetics on levels of metabolites and on metabolic rate in brain. Journal of Neurochemistry, 18(12), 2301–2316. 10.1111/j.1471-4159.1971.tb00186.x [DOI] [PubMed] [Google Scholar]
- Buckner RL (2012). The serendipitous discovery of the brain’s default network. NeuroImage, 62(2), 1137–1145. 10.1016/j.neuroimage.2011.10.035 [DOI] [PubMed] [Google Scholar]
- Buckner RL, Andrews-Hanna JR, & Schacter DL (2008). The Brain’s Default Network: Anatomy, Function, and Relevance to Disease. Annals of the New York Academy of Sciences, 1124(1), 1–38. 10.1196/annals.1440.011 [DOI] [PubMed] [Google Scholar]
- Buckner RL, & DiNicola LM (2019). The brain’s default network: Updated anatomy, physiology and evolving insights. Nature Reviews Neuroscience, 20(10), Article 10. 10.1038/s41583-019-0212-7 [DOI] [PubMed] [Google Scholar]
- Buschman TJ, & Miller EK (2007). Top-Down Versus Bottom-Up Control of Attention in the Prefrontal and Posterior Parietal Cortices. Science, 315(5820), 1860–1862. 10.1126/science.1138071 [DOI] [PubMed] [Google Scholar]
- Buxton RB (2021). The thermodynamics of thinking: Connections between neural activity, energy metabolism and blood flow. Philosophical Transactions of the Royal Society B: Biological Sciences, 376(1815), 20190624. 10.1098/rstb.2019.0624 [DOI] [PMC free article] [PubMed] [Google Scholar]
- Buxton RB, & Frank LR (1997). A model for the coupling between cerebral blood flow and oxygen metabolism during neural stimulation. Journal of Cerebral Blood Flow and Metabolism: Official Journal of the International Society of Cerebral Blood Flow and Metabolism, 17(1), 64–72. 10.1097/00004647-199701000-00009 [DOI] [PubMed] [Google Scholar]
- Buxton RB, Wong EC, & Frank LR (1998). Dynamics of blood flow and oxygenation changes during brain activation: The balloon model. Magnetic Resonance in Medicine, 39(6), 855–864. 10.1002/mrm.1910390602 [DOI] [PubMed] [Google Scholar]
- Buzsaki G (2004). Neuronal Oscillations in Cortical Networks. Science, 304(5679), 1926–1929. 10.1126/science.1099745 [DOI] [PubMed] [Google Scholar]
- Buzsáki G, & Wang X-J (2012). Mechanisms of Gamma Oscillations. Annual Review of Neuroscience, 35(1), 203–225. 10.1146/annurev-neuro-062111-150444 [DOI] [PMC free article] [PubMed] [Google Scholar]
- Caminiti R, Carducci F, Piervincenzi C, Battaglia-Mayer A, Confalone G, Visco-Comandini F, Pantano P, & Innocenti GM (2013). Diameter, Length, Speed, and Conduction Delay of Callosal Axons in Macaque Monkeys and Humans: Comparing Data from Histology and Magnetic Resonance Imaging Diffusion Tractography. Journal of Neuroscience, 33(36), 14501–14511. 10.1523/JNEUROSCI.0761-13.2013 [DOI] [PMC free article] [PubMed] [Google Scholar]
- Cardin JA, Carlén M, Meletis K, Knoblich U, Zhang F, Deisseroth K, Tsai L-H, & Moore CI (2009). Driving fast-spiking cells induces gamma rhythm and controls sensory responses. Nature, 459(7247), 663–667. 10.1038/nature08002 [DOI] [PMC free article] [PubMed] [Google Scholar]
- Chanes L, & Barrett LF (2016). Redefining the role of limbic areas in cortical processing. Trends in Cognitive Sciences, 20(2), 96–106. 10.1016/j.tics.2015.11.005 [DOI] [PMC free article] [PubMed] [Google Scholar]
- Chang LJ, Gianaros PJ, Manuck SB, Krishnan A, & Wager TD (2015). A Sensitive and Specific Neural Signature for Picture-Induced Negative Affect. PLOS Biology, 13(6), e1002180. 10.1371/journal.pbio.1002180 [DOI] [PMC free article] [PubMed] [Google Scholar]
- Chao ZC, Takaura K, Wang L, Fujii N, & Dehaene S (2018). Large-Scale Cortical Networks for Hierarchical Prediction and Prediction Error in the Primate Brain. Neuron, 100(5), 1252–1266.e3. 10.1016/j.neuron.2018.10.004 [DOI] [PubMed] [Google Scholar]
- Chauhan A, & Chauhan V (2006). Oxidative stress in autism. Pathophysiology, 13(3), 171–181. 10.1016/j.pathophys.2006.05.007 [DOI] [PubMed] [Google Scholar]
- Chen Z, Qing J, & Zhou JH (2023). Cinematic Mindscapes: High-quality Video Reconstruction from Brain Activity (arXiv:2305.11675). arXiv. http://arxiv.org/abs/2305.11675 [Google Scholar]
- Chih C-P, & Roberts EL (2003). Energy Substrates for Neurons during Neural Activity: A Critical Review of the Astrocyte-Neuron Lactate Shuttle Hypothesis. Journal of Cerebral Blood Flow & Metabolism, 23(11), 1263–1281. 10.1097/01.WCB.0000081369.51727.6F [DOI] [PubMed] [Google Scholar]
- Cisek P (1999). Beyond the computer metaphor: Behavior as interaction. Journal of Consciousness Studies, 6, 125–142. [Google Scholar]
- Cisek P (2019). Resynthesizing behavior through phylogenetic refinement. Attention, Perception, & Psychophysics, 81, 2265–2287. 10.3758/s13414-019-01760-1 [DOI] [PMC free article] [PubMed] [Google Scholar]
- Clark A (2013). Whatever next? Predictive brains, situated agents, and the future of cognitive science. Behavioral and Brain Sciences, 36(3), 1–24. 10.1017/S0140525X12000477 [DOI] [PubMed] [Google Scholar]
- Clark A (2015). Surfing Uncertainty: Prediction, Action, and the Embodied Mind. Oxford University Press. [Google Scholar]
- Clarke DD, & Sokoloff L (1999). Circulation and energy metabolism in the brain. In Basic Neuro-Chemistry: Molecular, Cellular and Medical Aspects (pp. 637–670). Lippincott-Raven. [Google Scholar]
- Cobb SR, Buhl EH, Halasy K, Paulsen O, & Somogyi P (1995). Synchronization of neuronal activity in hippocampus by individual GABAergic interneurons. Nature, 378(6552), Article 6552. 10.1038/378075a0 [DOI] [PubMed] [Google Scholar]
- Collins RC, McCandless DW, & Wagman IL (1987). Cerebral glucose utilization: Comparison of [14C]deoxyglucose and [6–14C]glucose quantitative autoradiography. Journal of Neurochemistry, 49(5), 1564–1570. 10.1111/j.1471-4159.1987.tb01028.x [DOI] [PubMed] [Google Scholar]
- Conant RC, & Ross Ashby W (1970). Every good regulator of a system must be a model of that system. International Journal of Systems Science, 1(2), 89–97. 10.1080/00207727008920220 [DOI] [Google Scholar]
- Conner CR, Ellmore TM, Pieters TA, DiSano MA, & Tandon N (2011). Variability of the Relationship between Electrophysiology and BOLD-fMRI across Cortical Regions in Humans. The Journal of Neuroscience, 31(36), 12855–12865. 10.1523/JNEUROSCI.1457-11.2011 [DOI] [PMC free article] [PubMed] [Google Scholar]
- Connors BW, & Gutnick MJ (1990). Intrinsic firing patterns of diverse neocortical neurons. Trends in Neurosciences, 13(3), 99–104. 10.1016/0166-2236(90)90185-d [DOI] [PubMed] [Google Scholar]
- Connors SL, Crowell DE, Eberhart CG, Copeland J, Newschaffer CJ, Spence SJ, & Zimmerman AW (2005). β 2-Adrenergic Receptor Activation and Genetic Polymorphisms in Autism: Data from Dizygotic Twins. Journal of Child Neurology, 20(11), 876–884. 10.1177/08830738050200110401 [DOI] [PubMed] [Google Scholar]
- Corbetta M, Patel G, & Shulman GL (2008). The Reorienting System of the Human Brain: From Environment to Theory of Mind. Neuron, 58(3), 306–324. 10.1016/j.neuron.2008.04.017 [DOI] [PMC free article] [PubMed] [Google Scholar]
- Corlett PR, Horga G, Fletcher PC, Alderson-Day B, Schmack K, & Powers AR (2019). Hallucinations and Strong Priors. Trends in Cognitive Sciences, 23(2), 114–127. 10.1016/j.tics.2018.12.001 [DOI] [PMC free article] [PubMed] [Google Scholar]
- Correia C, Coutinho AM, Diogo L, Grazina M, Marques C, Miguel T, Ataíde A, Almeida J, Borges L, Oliveira C, Oliveira G, & Vicente AM (2006). Brief report: High frequency of biochemical markers for mitochondrial dysfunction in autism: no association with the mitochondrial aspartate/glutamate carrier SLC25A12 gene. Journal of Autism and Developmental Disorders, 36(8), 1137–1140. 10.1007/s10803-006-0138-6 [DOI] [PubMed] [Google Scholar]
- Cousins MS, Atherton A, Turner L, & Salamone JD (1996). Nucleus accumbens dopamine depletions alter relative response allocation in a T-maze cost/benefit task. Behavioural Brain Research, 74(1–2), 189–197. 10.1016/0166-4328(95)00151-4 [DOI] [PubMed] [Google Scholar]
- Cover TM, & Thomas JA (1991). Elements of Information Theory. Wiley. [Google Scholar]
- Cox DJ, Racca C, & LeBeau FEN (2008). Beta-adrenergic receptors are differentially expressed in distinct interneuron subtypes in the rat hippocampus. The Journal of Comparative Neurology, 509(6), 551–565. 10.1002/cne.21758 [DOI] [PubMed] [Google Scholar]
- Cox DWG, & Bachelard HS (1982). Attenuation of evoked field potentials from dentate granule cells by low glucose, pyruvate -? Malate, and sodium fluoride. Brain Research, 8. [DOI] [PubMed] [Google Scholar]
- Cox DWG, & Bachelard HS (1988a). On the relationship between the excitability of dentate granule cell field potentials and their sensitivity to low glucose. Brain Research, 4. [DOI] [PubMed] [Google Scholar]
- Cox DWG, & Bachelard HS (1988b). Partial attenuation of dentate granule cell evoked activity by the alternative substrates, lactate and pyruvate: Evidence for a postsynaptic action. Experimental Brain Research, 5. [DOI] [PubMed] [Google Scholar]
- Craig AD (2015). How Do You Feel? An Interoceptive Moment with Your Neurobiological Self. Princeton University Press. [Google Scholar]
- Crane RK, & Sols A (1953). The association of hexokinase with particulate fractions of brain and other tissue homogenates. The Journal of Biological Chemistry, 203(1), 273–292. [PubMed] [Google Scholar]
- Critchley HD, Tang J, Glaser D, Butterworth B, & Dolan RJ (2005). Anterior cingulate activity during error and autonomic response. NeuroImage, 27(4), 885–895. 10.1016/j.neuroimage.2005.05.047 [DOI] [PubMed] [Google Scholar]
- Crone EA, Somsen RJM, Beek BV, & Molen MWVD (2004). Heart rate and skin conductance analysis of antecendents and consequences of decision making. Psychophysiology, 41(4), 531–540. 10.1111/j.1469-8986.2004.00197.x [DOI] [PubMed] [Google Scholar]
- Cruz NF, Ball KK, & Dienel GA (2007). Functional imaging of focal brain activation in conscious rats: Impact of [(14)C]glucose metabolite spreading and release. Journal of Neuroscience Research, 85(15), 3254–3266. 10.1002/jnr.21193 [DOI] [PubMed] [Google Scholar]
- Dalsgaard MK (2006). Fuelling Cerebral Activity in Exercising Man. Journal of Cerebral Blood Flow & Metabolism, 26(6), 731–750. 10.1038/sj.jcbfm.9600256 [DOI] [PubMed] [Google Scholar]
- Dalsgaard MK, Ide K, Cai Y, Quistorff B, & Secher NH (2002). The intent to exercise influences the cerebral O2/carbohydrate uptake ratio in humans. The Journal of Physiology, 540(Pt 2), 681–689. 10.1113/jphysiol.2001.013062 [DOI] [PMC free article] [PubMed] [Google Scholar]
- Dalsgaard MK, Ogoh S, Dawson EA, Yoshiga CC, Quistorff B, & Secher NH (2004). Cerebral carbohydrate cost of physical exertion in humans. American Journal of Physiology-Regulatory, Integrative and Comparative Physiology, 287(3), R534–R540. 10.1152/ajpregu.00256.2004 [DOI] [PubMed] [Google Scholar]
- Dalsgaard MK, Quistorff B, Danielsen ER, Selmer C, Vogelsang T, & Secher NH (2004). A reduced cerebral metabolic ratio in exercise reflects metabolism and not accumulation of lactate within the human brain. The Journal of Physiology, 554(Pt 2), 571–578. 10.1113/jphysiol.2003.055053 [DOI] [PMC free article] [PubMed] [Google Scholar]
- Damasio AR (1999). The Feeling of what Happens: Body and Emotion in the Making of Consciousness. Houghton Mifflin Harcourt. [Google Scholar]
- Dantzer R, Casaril A, & Vichaya E (2021). Inflammation and Depression: Is Immunometabolism the Missing Link? In Berk M, Leboyer M, & Sommer IE (Eds.), Immuno-Psychiatry: Facts and Prospects (pp. 259–287). Springer International Publishing. 10.1007/978-3-030-71229-7_16 [DOI] [Google Scholar]
- Dantzer R, O’Connor JC, Freund GG, Johnson RW, & Kelley KW (2008). From inflammation to sickness and depression: When the immune system subjugates the brain. Nature Reviews Neuroscience, 9(1), 46–56. 10.1038/nrn2297 [DOI] [PMC free article] [PubMed] [Google Scholar]
- Danziger K (1997). Naming the Mind: How Psychology Found Its Language. SAGE. [Google Scholar]
- Darwin C (2001). On the Origin of Species by Means of Natural Selection, or the Preservation of Favoured Races in the Struggle for Life. (Manis J, Ed.). Penn State University’s Electronic Classics. (Original work published 1859) [Google Scholar]
- Davis TL, Kwong KK, Weisskoff RM, & Rosen BR (1998). Calibrated functional MRI: Mapping the dynamics of oxidative metabolism. Proceedings of the National Academy of Sciences of the United States of America, 95(4), 1834–1839. [DOI] [PMC free article] [PubMed] [Google Scholar]
- Dayan P, & Yu AJ (2006). Phasic norepinephrine: A neural interrupt signal for unexpected events. Network: Computation in Neural Systems, 17(4), 335–350. 10.1080/09548980601004024 [DOI] [PubMed] [Google Scholar]
- de Ruyter van Steveninck RR, Lewen GD, Strong SP, Koberle R, & Bialek W (1997). Reproducibility and Variability in Neural Spike Trains. Science, 275(5307), 1805–1808. 10.1126/science.275.5307.1805 [DOI] [PubMed] [Google Scholar]
- Denève S, & Jardri R (2016). Circular inference: Mistaken belief, misplaced trust. Current Opinion in Behavioral Sciences, 11, 40–48. 10.1016/j.cobeha.2016.04.001 [DOI] [Google Scholar]
- Derouiche A, Haseleu J, & Korf H-W (2015). Fine Astrocyte Processes Contain Very Small Mitochondria: Glial Oxidative Capability May Fuel Transmitter Metabolism. Neurochemical Research, 40(12), 2402–2413. 10.1007/s11064-015-1563-8 [DOI] [PubMed] [Google Scholar]
- Dewey J (1896). The reflex arc concept in psychology. Psychological Review, 3(4), 357–370. 10.1037/h0070405 [DOI] [Google Scholar]
- Díaz-García CM, Mongeon R, Lahmann C, Koveal D, Zucker H, & Yellen G (2017). Neuronal Stimulation Triggers Neuronal Glycolysis and Not Lactate Uptake. Cell Metabolism, 26(2), 361–374.e4. 10.1016/j.cmet.2017.06.021 [DOI] [PMC free article] [PubMed] [Google Scholar]
- Díaz-García CM, & Yellen G (2019). Neurons rely on glucose rather than astrocytic lactate during stimulation. Journal of Neuroscience Research, 97(8), 883–889. 10.1002/jnr.24374 [DOI] [PMC free article] [PubMed] [Google Scholar]
- Dienel GA (2014). Energy Metabolism in the Brain. In From Molecules to Networks (pp. 53–117). Elsevier. 10.1016/B978-0-12-397179-1.00003-8 [DOI] [Google Scholar]
- Dienel GA (2017). Lack of appropriate stoichiometry: Strong evidence against an energetically important astrocyte–neuron lactate shuttle in brain. Journal of Neuroscience Research, 95(11), 2103–2125. 10.1002/jnr.24015 [DOI] [PubMed] [Google Scholar]
- Dienel GA (2019). Brain Glucose Metabolism: Integration of Energetics with Function. Physiological Reviews, 99(1), 949–1045. 10.1152/physrev.00062.2017 [DOI] [PubMed] [Google Scholar]
- Dienel GA, & Cruz NF (2016). Aerobic glycolysis during brain activation: Adrenergic regulation and influence of norepinephrine on astrocytic metabolism. Journal of Neurochemistry, 138(1), 14–52. 10.1111/jnc.13630 [DOI] [PubMed] [Google Scholar]
- Dienel GA, & Hertz L (2001). Glucose and lactate metabolism during brain activation. Journal of Neuroscience Research, 66(5), 824–838. 10.1002/jnr.10079 [DOI] [PubMed] [Google Scholar]
- Dienel GA, & Rothman DL (2019). Glycogenolysis in Cerebral Cortex During Sensory Stimulation, Acute Hypoglycemia, and Exercise: Impact on Astrocytic Energetics, Aerobic Glycolysis, and Astrocyte-Neuron Interactions. Advances in Neurobiology, 23, 209–267. 10.1007/978-3-030-27480-1_8 [DOI] [PubMed] [Google Scholar]
- Dienel GA, & Rothman DL (2020). Reevaluation of Astrocyte-Neuron Energy Metabolism with Astrocyte Volume Fraction Correction: Impact on Cellular Glucose Oxidation Rates, Glutamate-Glutamine Cycle Energetics, Glycogen Levels and Utilization Rates vs. Exercising Muscle, and Na+/K+ Pumping Rates. Neurochemical Research, 45(11), 2607–2630. 10.1007/s11064-020-03125-9 [DOI] [PubMed] [Google Scholar]
- DiNuzzo M, Dienel GA, Behar KL, Petroff OA, Benveniste H, Hyder F, Giove F, Michaeli S, Mangia S, Herculano-Houzel S, & Rothman DL (2023). Neurovascular coupling is optimized to compensate for the increase in proton production from nonoxidative glycolysis and glycogenolysis during brain activation and maintain homeostasis of pH, pCO2, and pO2. Journal of Neurochemistry, n/a(n/a). 10.1111/jnc.15839 [DOI] [PMC free article] [PubMed] [Google Scholar]
- DiNuzzo M, Mangia S, Maraviglia B, & Giove F (2010a). Changes in glucose uptake rather than lactate shuttle take center stage in subserving neuroenergetics: Evidence from mathematical modeling. Journal of Cerebral Blood Flow and Metabolism: Official Journal of the International Society of Cerebral Blood Flow and Metabolism, 30(3), 586–602. 10.1038/jcbfm.2009.232 [DOI] [PMC free article] [PubMed] [Google Scholar]
- DiNuzzo M, Mangia S, Maraviglia B, & Giove F (2010b). Glycogenolysis in astrocytes supports blood-borne glucose channeling not glycogen-derived lactate shuttling to neurons: Evidence from mathematical modeling. Journal of Cerebral Blood Flow & Metabolism, 30(12), 1895–1904. 10.1038/jcbfm.2010.151 [DOI] [PMC free article] [PubMed] [Google Scholar]
- DiNuzzo M, Mangia S, Maraviglia B, & Giove F (2012). The Role of Astrocytic Glycogen in Supporting the Energetics of Neuronal Activity. Neurochemical Research, 37(11), 2432–2438. 10.1007/s11064-012-0802-5 [DOI] [PMC free article] [PubMed] [Google Scholar]
- DiNuzzo M, Mangia S, Moraschi M, Mascali D, Hagberg GE, & Giove F (2022). Perception is associated with the brain’s metabolic response to sensory stimulation. ELife, 11, e71016. 10.7554/eLife.71016 [DOI] [PMC free article] [PubMed] [Google Scholar]
- Dombrowski SM, Hilgetag CC, & Barbas H (2001). Quantitative Architecture Distinguishes Prefrontal Cortical Systems in the Rhesus Monkey. Cerebral Cortex, 11(10), 975–988. 10.1093/cercor/11.10.975 [DOI] [PubMed] [Google Scholar]
- Donahue CJ, Glasser MF, Preuss TM, Rilling JK, & Essen DCV (2018). Quantitative assessment of prefrontal cortex in humans relative to nonhuman primates. Proceedings of the National Academy of Sciences, 115(22), E5183–E5192. 10.1073/pnas.1721653115 [DOI] [PMC free article] [PubMed] [Google Scholar]
- Dürschmid S, Edwards E, Reichert C, Dewar C, Hinrichs H, Heinze H-J, Kirsch HE, Dalal SS, Deouell LY, & Knight RT (2016). Hierarchy of prediction errors for auditory events in human temporal and frontal cortex. Proceedings of the National Academy of Sciences, 113(24), 6755–6760. 10.1073/pnas.1525030113 [DOI] [PMC free article] [PubMed] [Google Scholar]
- Echagarruga CT, Gheres KW, Norwood JN, & Drew PJ (2020). NNOS-expressing interneurons control basal and behaviorally evoked arterial dilation in somatosensory cortex of mice. ELife, 9, e60533. 10.7554/eLife.60533 [DOI] [PMC free article] [PubMed] [Google Scholar]
- Egli RE, Kash TL, Choo K, Savchenko V, Matthews RT, Blakely RD, & Winder DG (2005). Norepinephrine Modulates Glutamatergic Transmission in the Bed Nucleus of the Stria Terminalis. Neuropsychopharmacology, 30(4), 657–668. 10.1038/sj.npp.1300639 [DOI] [PubMed] [Google Scholar]
- Eisenbarth H, Chang LJ, & Wager TD (2016). Multivariate Brain Prediction of Heart Rate and Skin Conductance Responses to Social Threat. The Journal of Neuroscience, 36(47), 11987–11998. 10.1523/JNEUROSCI.3672-15.2016 [DOI] [PMC free article] [PubMed] [Google Scholar]
- Ekstrom A (2010). How and when the fMRI BOLD signal relates to underlying neural activity: The danger in dissociation. Brain Research Reviews, 62(2), 233–244. 10.1016/j.brainresrev.2009.12.004 [DOI] [PMC free article] [PubMed] [Google Scholar]
- Ekstrom A, Suthana N, Millett D, Fried I, & Bookheimer S (2009). Correlation Between BOLD fMRI and Theta-Band Local Field Potentials in the Human Hippocampal Area. Journal of Neurophysiology, 101(5), 2668–2678. 10.1152/jn.91252.2008 [DOI] [PMC free article] [PubMed] [Google Scholar]
- Elston GN, Benavides-Piccione R, & DeFelipe J (2001). The Pyramidal Cell in Cognition: A Comparative Study in Human and Monkey. The Journal of Neuroscience, 21(17), RC163–RC163. 10.1523/JNEUROSCI.21-17-j0002.2001 [DOI] [PMC free article] [PubMed] [Google Scholar]
- Elston GN, Benavides-Piccione R, Elston A, Zietsch B, Defelipe J, Manger P, Casagrande V, & Kaas JH (2006). Specializations of the granular prefrontal cortex of primates: Implications for cognitive processing. The Anatomical Record. Part A, Discoveries in Molecular, Cellular, and Evolutionary Biology, 288(1), 26–35. 10.1002/ar.a.20278 [DOI] [PubMed] [Google Scholar]
- Engel AK, & Fries P (2010). Beta-band oscillations—Signalling the status quo? Current Opinion in Neurobiology, 20(2), 156–165. 10.1016/j.conb.2010.02.015 [DOI] [PubMed] [Google Scholar]
- Epstein T, Gatenby RA, & Brown JS (2017). The Warburg effect as an adaptation of cancer cells to rapid fluctuations in energy demand. PLOS ONE, 12(9), e0185085. 10.1371/journal.pone.0185085 [DOI] [PMC free article] [PubMed] [Google Scholar]
- Estrella V, Chen T, Lloyd M, Wojtkowiak J, Cornnell HH, Ibrahim-Hashim A, Bailey K, Balagurunathan Y, Rothberg JM, Sloane BF, Johnson J, Gatenby RA, & Gillies RJ (2013). Acidity generated by the tumor microenvironment drives local invasion. Cancer Research, 73(5), 1524–1535. 10.1158/0008-5472.CAN-12-2796 [DOI] [PMC free article] [PubMed] [Google Scholar]
- Faisal AA, & Laughlin SB (2007). Stochastic Simulations on the Reliability of Action Potential Propagation in Thin Axons. PLOS Computational Biology, 3(5), e79. 10.1371/journal.pcbi.0030079 [DOI] [PMC free article] [PubMed] [Google Scholar]
- Faisal AA, Selen LPJ, & Wolpert DM (2008). Noise in the nervous system. Nature Reviews Neuroscience, 9(4), 292–303. 10.1038/nrn2258 [DOI] [PMC free article] [PubMed] [Google Scholar]
- Faisal AA, White JA, & Laughlin SB (2005). Ion-channel noise places limits on the miniaturization of the brain’s wiring. Current Biology: CB, 15(12), 1143–1149. 10.1016/j.cub.2005.05.056 [DOI] [PubMed] [Google Scholar]
- Feldman H, & Friston KJ (2010). Attention, uncertainty, and free-energy. Frontiers in Human Neuroscience, 4. 10.3389/fnhum.2010.00215 [DOI] [PMC free article] [PubMed] [Google Scholar]
- Felger JC, Alagbe O, Hu F, Mook D, Freeman AA, Sanchez MM, Kalin NH, Ratti E, Nemeroff CB, & Miller AH (2007). Effects of interferon-alpha on rhesus monkeys: A nonhuman primate model of cytokine-induced depression. Biological Psychiatry, 62(11), 1324–1333. 10.1016/j.biopsych.2007.05.026 [DOI] [PMC free article] [PubMed] [Google Scholar]
- Felger JC, Mun J, Kimmel HL, Nye JA, Drake DF, Hernandez CR, Freeman AA, Rye DB, Goodman MM, Howell LL, & Miller AH (2013). Chronic Interferon-α Decreases Dopamine 2 Receptor Binding and Striatal Dopamine Release in Association with Anhedonia-Like Behavior in Nonhuman Primates. Neuropsychopharmacology, 38(11), 2179–2187. 10.1038/npp.2013.115 [DOI] [PMC free article] [PubMed] [Google Scholar]
- Felleman DJ, & Van Essen DC (1991). Distributed hierarchical processing in the primate cerebral cortex. Cerebral Cortex, 1(1), 1–47. 10.1093/cercor/1.1.1 [DOI] [PubMed] [Google Scholar]
- Ferreira-Santos F (2016). The role of arousal in predictive coding. Behavioral and Brain Sciences, 39, e207. 10.1017/S0140525X15001788 [DOI] [PubMed] [Google Scholar]
- Figley CR, & Stroman PW (2011). The role(s) of astrocytes and astrocyte activity in neurometabolism, neurovascular coupling, and the production of functional neuroimaging signals: Astrocyte control of fMRI and PET signals. European Journal of Neuroscience, 33(4), 577–588. 10.1111/j.1460-9568.2010.07584.x [DOI] [PubMed] [Google Scholar]
- Finlay BL (2009). Brain Evolution: Developmental Constraints and Relative Developmental Growth. In Encyclopedia of Neuroscience (pp. 337–345). Elsevier. 10.1016/B978-008045046-9.00939-6 [DOI] [Google Scholar]
- Flinker A, Chang EF, Kirsch HE, Barbaro NM, Crone NE, & Knight RT (2010). Single-Trial Speech Suppression of Auditory Cortex Activity in Humans. Journal of Neuroscience, 30(49), 16643–16650. 10.1523/JNEUROSCI.1809-10.2010 [DOI] [PMC free article] [PubMed] [Google Scholar]
- Floresco SB, Seamans JK, & Phillips AG (1996). A selective role for dopamine in the nucleus accumbens of the rat in random foraging but not delayed spatial win-shift-based foraging. Behavioural Brain Research, 80(1–2), 161–168. 10.1016/0166-4328(96)00031-9 [DOI] [PubMed] [Google Scholar]
- Floresco SB, Tse MTL, & Ghods-Sharifi S (2008). Dopaminergic and glutamatergic regulation of effort- and delay-based decision making. Neuropsychopharmacology: Official Publication of the American College of Neuropsychopharmacology, 33(8), 1966–1979. 10.1038/sj.npp.1301565 [DOI] [PubMed] [Google Scholar]
- Fontolan L, Morillon B, Liegeois-Chauvel C, & Giraud A-L (2014). The contribution of frequency-specific activity to hierarchical information processing in the human auditory cortex. Nature Communications, 5(1), Article 1. 10.1038/ncomms5694 [DOI] [PMC free article] [PubMed] [Google Scholar]
- Fox PT, & Raichle ME (1986). Focal physiological uncoupling of cerebral blood flow and oxidative metabolism during somatosensory stimulation in human subjects. Proceedings of the National Academy of Sciences of the United States of America, 83(4), 1140–1144. [DOI] [PMC free article] [PubMed] [Google Scholar]
- Fox PT, Raichle ME, Mintun M, & Dence C (1988). Nonoxidative glucose consumption during focal physiologic neural activity. Science, 241(4864), 462–464. 10.1126/science.3260686 [DOI] [PubMed] [Google Scholar]
- Frahm J, Krüger G, Merboldt KD, & Kleinschmidt A (1996). Dynamic uncoupling and recoupling of perfusion and oxidative metabolism during focal brain activation in man. Magnetic Resonance in Medicine, 35(2), 143–148. 10.1002/mrm.1910350202 [DOI] [PubMed] [Google Scholar]
- Friston KJ (2010). The free-energy principle: A unified brain theory? Nature Reviews Neuroscience, 11(2), 127–138. 10.1038/nrn2787 [DOI] [PubMed] [Google Scholar]
- Friston KJ (2017). Precision Psychiatry. Biological Psychiatry: Cognitive Neuroscience and Neuroimaging, 2(8), 640–643. 10.1016/j.bpsc.2017.08.007 [DOI] [PubMed] [Google Scholar]
- Friston KJ, Bastos AM, Pinotsis D, & Litvak V (2015). LFP and oscillations-what do they tell us? Current Opinion in Neurobiology, 31, 1–6. 10.1016/j.conb.2014.05.004 [DOI] [PMC free article] [PubMed] [Google Scholar]
- Friston KJ, FitzGerald T, Rigoli F, Schwartenbeck P, O’Doherty J, & Pezzulo G (2016). Active inference and learning. Neuroscience & Biobehavioral Reviews, 68, 862–879. 10.1016/j.neubiorev.2016.06.022 [DOI] [PMC free article] [PubMed] [Google Scholar]
- Friston KJ, FitzGerald T, Rigoli F, Schwartenbeck P, & Pezzulo G (2017). Active inference: A process theory. Neural Computation, 29(1), 1–49. 10.1162/NECO_a_00912 [DOI] [PubMed] [Google Scholar]
- Frith U, & Happé FGE (1994). Autism: Beyond “theory of mind.” Cognition, 50(1–3), 115–132. 10.1016/0010-0277(94)90024-8 [DOI] [PubMed] [Google Scholar]
- Fujioka T, Trainor LJ, Large EW, & Ross B (2009). Beta and Gamma Rhythms in Human Auditory Cortex during Musical Beat Processing. Annals of the New York Academy of Sciences, 1169(1), 89–92. 10.1111/j.1749-6632.2009.04779.x [DOI] [PubMed] [Google Scholar]
- Fuster JM (2003). Cortex and mind: Unifying cognition. Oxford University Press. [Google Scholar]
- Galow LV, Schneider J, Lewen A, Ta T-T, Papageorgiou IE, & Kann O (2014). Energy substrates that fuel fast neuronal network oscillations. Frontiers in Neuroscience, 8. 10.3389/fnins.2014.00398 [DOI] [PMC free article] [PubMed] [Google Scholar]
- Gardner A, & Boles RG (2011). Beyond the serotonin hypothesis: Mitochondria, inflammation and neurodegeneration in major depression and affective spectrum disorders. Progress in Neuro-Psychopharmacology and Biological Psychiatry, 35(3), 730–743. 10.1016/j.pnpbp.2010.07.030 [DOI] [PubMed] [Google Scholar]
- Garner JA, Linse KD, & Polk RK (1996). Type I brain hexokinase: Axonal transport and membrane associations within central nervous system presynaptic terminals. Journal of Neurochemistry, 67(2), 845–856. 10.1046/j.1471-4159.1996.67020845.x [DOI] [PubMed] [Google Scholar]
- Germuska M, & Wise RG (2018). Calibrated fMRI for mapping absolute CMRO 2: Practicalities and prospects. NeuroImage. 10.1016/j.neuroimage.2018.03.068 [DOI] [PubMed] [Google Scholar]
- Geschwind DH (2011). Genetics of autism spectrum disorders. Trends in Cognitive Sciences, 15(9), 409–416. 10.1016/j.tics.2011.07.003 [DOI] [PMC free article] [PubMed] [Google Scholar]
- Gevezova M, Sarafian V, Anderson G, & Maes M (2020). Inflammation and Mitochondrial Dysfunction in Autism Spectrum Disorder. CNS & Neurological Disorders - Drug Targets, 19(5), 320–333. 10.2174/1871527319666200628015039 [DOI] [PubMed] [Google Scholar]
- Gibbons A (1998). Solving the brain’s energy crisis. Science (New York, N.Y.), 280(5368), 1345–1347. 10.1126/science.280.5368.1345 [DOI] [PubMed] [Google Scholar]
- Gire DH, & Schoppa NE (2008). Long-term enhancement of synchronized oscillations by adrenergic receptor activation in the olfactory bulb. Journal of Neurophysiology, 99(4), 2021–2025. 10.1152/jn.01324.2007 [DOI] [PubMed] [Google Scholar]
- González-Alonso J, Dalsgaard MK, Osada T, Volianitis S, Dawson EA, Yoshiga CC, & Secher NH (2004). Brain and central haemodynamics and oxygenation during maximal exercise in humans. The Journal of Physiology, 557(Pt 1), 331–342. 10.1113/jphysiol.2004.060574 [DOI] [PMC free article] [PubMed] [Google Scholar]
- Gonzalez-Castillo J, Saad ZS, Handwerker DA, Inati SJ, Brenowitz N, & Bandettini PA (2012). Whole-brain, time-locked activation with simple tasks revealed using massive averaging and model-free analysis. Proceedings of the National Academy of Sciences of the United States of America, 109(14), 5487–5492. 10.1073/pnas.1121049109 [DOI] [PMC free article] [PubMed] [Google Scholar]
- Goodman MB, Hall DH, Avery L, & Lockery SR (1998). Active currents regulate sensitivity and dynamic range in C. elegans neurons. Neuron, 20(4), 763–772. 10.1016/s0896-6273(00)81014-4 [DOI] [PMC free article] [PubMed] [Google Scholar]
- Goyal MS, Hawrylycz M, Miller JA, Snyder AZ, & Raichle ME (2014). Aerobic glycolysis in the human brain is associated with development and neotenous gene expression. Cell Metabolism, 19(1), 49–57. 10.1016/j.cmet.2013.11.020 [DOI] [PMC free article] [PubMed] [Google Scholar]
- Goyal MS, & Snyder AZ (2021). Uncoupling in intrinsic brain activity. Proceedings of the National Academy of Sciences, 118(34), e2110556118. 10.1073/pnas.2110556118 [DOI] [PMC free article] [PubMed] [Google Scholar]
- Grassi B, Poole DC, Richardson RS, Knight DR, Erickson BK, & Wagner PD (1996). Muscle O2 uptake kinetics in humans: Implications for metabolic control. Journal of Applied Physiology (Bethesda, Md.: 1985), 80(3), 988–998. 10.1152/jappl.1996.80.3.988 [DOI] [PubMed] [Google Scholar]
- Gulyás AI, Buzsáki G, Freund TF, & Hirase H (2006). Populations of hippocampal inhibitory neurons express different levels of cytochrome c. European Journal of Neuroscience, 23(10), 2581–2594. 10.1111/j.1460-9568.2006.04814.x [DOI] [PubMed] [Google Scholar]
- Gur RC, Ragland JD, Reivich M, Greenberg JH, Alavi A, & Gur RE (2009). Regional differences in the coupling between resting cerebral blood flow and metabolism may indicate action preparedness as a default state. Cerebral Cortex (New York, N.Y.: 1991), 19(2), 375–382. 10.1093/cercor/bhn087 [DOI] [PMC free article] [PubMed] [Google Scholar]
- Gusnard DA, & Raichle ME (2001). Searching for a baseline: Functional imaging and the resting human brain. Nature Reviews Neuroscience, 2(10), Article 10. 10.1038/35094500 [DOI] [PubMed] [Google Scholar]
- Hafting T, Fyhn M, Molden S, Moser M-B, & Moser EI (2005). Microstructure of a spatial map in the entorhinal cortex. Nature, 436(7052), Article 7052. 10.1038/nature03721 [DOI] [PubMed] [Google Scholar]
- Haggerty DC, Glykos V, Adams NE, & LeBeau FEN (2013). Bidirectional modulation of hippocampal gamma (20–80Hz) frequency activity in vitro via alpha(α)- and beta(β)-adrenergic receptors (AR). Neuroscience, 253, 142–154. 10.1016/j.neuroscience.2013.08.028 [DOI] [PubMed] [Google Scholar]
- Hajcak G, McDonald N, & Simons RF (2003). To err is autonomic: Error-related brain potentials, ANS activity, and post-error compensatory behavior. Psychophysiology, 40(6), 895–903. 10.1111/1469-8986.00107 [DOI] [PubMed] [Google Scholar]
- Hall CN, Klein-Flügge MC, Howarth C, & Attwell D (2012). Oxidative phosphorylation, not glycolysis, powers presynaptic and postsynaptic mechanisms underlying brain information processing. The Journal of Neuroscience: The Official Journal of the Society for Neuroscience, 32(26), 8940–8951. 10.1523/JNEUROSCI.0026-12.2012 [DOI] [PMC free article] [PubMed] [Google Scholar]
- Happé FGE, & Booth RDL (2008). The Power of the Positive: Revisiting Weak Coherence in Autism Spectrum Disorders. Quarterly Journal of Experimental Psychology, 61(1), 50–63. 10.1080/17470210701508731 [DOI] [PubMed] [Google Scholar]
- Happé FGE, & Frith U (2006). The Weak Coherence Account: Detail-focused Cognitive Style in Autism Spectrum Disorders. Journal of Autism and Developmental Disorders, 36(1), 5–25. 10.1007/s10803-005-0039-0 [DOI] [PubMed] [Google Scholar]
- Harrington A (2019). Mind Fixers: Psychiatry’s Troubled Search for the Biology of Mental Illness. W. W. Norton & Company. [Google Scholar]
- Harris JJ, & Attwell D (2012). The energetics of CNS white matter. Journal of Neuroscience, 32(1), 356–371. 10.1523/JNEUROSCI.3430-11.2012 [DOI] [PMC free article] [PubMed] [Google Scholar]
- Harris JJ, Jolivet R, & Attwell D (2012). Synaptic Energy Use and Supply. Neuron, 75(5), 762–777. 10.1016/j.neuron.2012.08.019 [DOI] [PubMed] [Google Scholar]
- Harris JJ, Jolivet R, Engl E, & Attwell D (2015). Energy-Efficient Information Transfer by Visual Pathway Synapses. Current Biology, 25(24), 3151–3160. 10.1016/j.cub.2015.10.063 [DOI] [PMC free article] [PubMed] [Google Scholar]
- Harris KD, & Thiele A (2011). Cortical state and attention. Nature Reviews Neuroscience, 12(9), Article 9. 10.1038/nrn3084 [DOI] [PMC free article] [PubMed] [Google Scholar]
- Harris RA, Lone A, Lim H, Martinez F, Frame AK, Scholl TJ, & Cumming RC (2019). Aerobic Glycolysis Is Required for Spatial Memory Acquisition But Not Memory Retrieval in Mice. Eneuro, 6(1), ENEURO.0389–18.2019. 10.1523/ENEURO.0389-18.2019 [DOI] [PMC free article] [PubMed] [Google Scholar]
- Hasenstaub A, Otte S, Callaway E, & Sejnowski TJ (2010). Metabolic cost as a unifying principle governing neuronal biophysics. Proceedings of the National Academy of Sciences, 107(27), 12329–12334. 10.1073/pnas.0914886107 [DOI] [PMC free article] [PubMed] [Google Scholar]
- Haxby JV, Gobbini MI, Furey ML, Ishai A, Schouten JL, & Pietrini P (2001). Distributed and overlapping representations of faces and objects in ventral temporal cortex. Science (New York, N.Y.), 293(5539), 2425–2430. 10.1126/science.1063736 [DOI] [PubMed] [Google Scholar]
- Herculano-Houzel S, & Rothman DL (2022). From a Demand-Based to a Supply-Limited Framework of Brain Metabolism. Frontiers in Integrative Neuroscience, 16, 818685. 10.3389/fnint.2022.818685 [DOI] [PMC free article] [PubMed] [Google Scholar]
- Hermans EJ, van Marle HJF, Ossewaarde L, Henckens MJAG, Qin S, van Kesteren MTR, Schoots VC, Cousijn H, Rijpkema M, Oostenveld R, & Fernandez G (2011). Stress-Related Noradrenergic Activity Prompts Large-Scale Neural Network Reconfiguration. Science, 334(6059), 1151–1153. 10.1126/science.1209603 [DOI] [PubMed] [Google Scholar]
- Hertz L, & Dienel GA (2005). Lactate transport and transporters: General principles and functional roles in brain cells. Journal of Neuroscience Research, 79(1–2), 11–18. 10.1002/jnr.20294 [DOI] [PubMed] [Google Scholar]
- Hertz L, Peng L, & Dienel GA (2007). Energy metabolism in astrocytes: High rate of oxidative metabolism and spatiotemporal dependence on glycolysis/glycogenolysis. Journal of Cerebral Blood Flow and Metabolism: Official Journal of the International Society of Cerebral Blood Flow and Metabolism, 27(2), 219–249. 10.1038/sj.jcbfm.9600343 [DOI] [PubMed] [Google Scholar]
- Hill EL (2004). Executive dysfunction in autism. Trends in Cognitive Sciences, 8(1), 26–32. 10.1016/j.tics.2003.11.003 [DOI] [PubMed] [Google Scholar]
- Hinckelmann M-V, Virlogeux A, Niehage C, Poujol C, Choquet D, Hoflack B, Zala D, & Saudou F (2016). Self-propelling vesicles define glycolysis as the minimal energy machinery for neuronal transport. Nature Communications, 7, 13233. 10.1038/ncomms13233 [DOI] [PMC free article] [PubMed] [Google Scholar]
- Hobert O (2013). The neuronal genome of Caenorhabditis elegans. In The C. elegans Research Community (Ed.), WormBook; (pp. 1–106). http://www.wormbook.org [DOI] [PMC free article] [PubMed] [Google Scholar]
- Hodgkin AL, & Huxley AF (1952). A quantitative description of membrane current and its application to conduction and excitation in nerve. The Journal of Physiology, 117(4), 500–544. [DOI] [PMC free article] [PubMed] [Google Scholar]
- Hofman MA (1983). Energy metabolism, brain size and longevity in mammals. The Quarterly Review of Biology, 58(4), 495–512. 10.1086/413544 [DOI] [PubMed] [Google Scholar]
- Hohwy J (2013). The Predictive Mind. Oxford University Press. 10.1093/acprof:oso/9780199682737.001.0001 [DOI] [Google Scholar]
- Hollnagel J-O, Cesetti T, Schneider J, Vazetdinova A, Valiullina-Rakhmatullina F, Lewen A, Rozov A, & Kann O (2020). Lactate Attenuates Synaptic Transmission and Affects Brain Rhythms Featuring High Energy Expenditure. IScience, 23(7), 101316. 10.1016/j.isci.2020.101316 [DOI] [PMC free article] [PubMed] [Google Scholar]
- Howren MB, Lamkin DM, & Suls J (2009). Associations of depression with C-reactive protein, IL-1, and IL-6: A meta-analysis. Psychosomatic Medicine, 71(2), 171–186. 10.1097/PSY.0b013e3181907c1b [DOI] [PubMed] [Google Scholar]
- Hu H, Roth FC, Vandael D, & Jonas P (2018). Complementary Tuning of Na+ and K+ Channel Gating Underlies Fast and Energy-Efficient Action Potentials in GABAergic Interneuron Axons. Neuron, 98(1), 156–165.e6. 10.1016/j.neuron.2018.02.024 [DOI] [PMC free article] [PubMed] [Google Scholar]
- Huang S, Huganir RL, & Kirkwood A (2013). Adrenergic gating of Hebbian spike-timing-dependent plasticity in cortical interneurons. The Journal of Neuroscience: The Official Journal of the Society for Neuroscience, 33(32), 13171–13178. 10.1523/JNEUROSCI.5741-12.2013 [DOI] [PMC free article] [PubMed] [Google Scholar]
- Hubel DH, & Wiesel TN (1959). Receptive fields of single neurones in the cat’s striate cortex. The Journal of Physiology, 148(3), 574–591. [DOI] [PMC free article] [PubMed] [Google Scholar]
- Hutchinson B, & Barrett LF (2019). The power of predictions: An emerging paradigm for psychological research. Current Directions in Psychological Science, 28(3), 280–291. 10.1177/0963721419831992 [DOI] [PMC free article] [PubMed] [Google Scholar]
- Hutsler JJ, Lee D-G, & Porter KK (2005). Comparative analysis of cortical layering and supragranular layer enlargement in rodent carnivore and primate species. Brain Research, 1052, 71–81. 10.1016/j.brainres.2005.06.015 [DOI] [PubMed] [Google Scholar]
- Hyder F, Fulbright RK, Shulman RG, & Rothman DL (2013). Glutamatergic Function in the Resting Awake Human Brain is Supported by Uniformly High Oxidative Energy. Journal of Cerebral Blood Flow & Metabolism, 33(3), 339–347. 10.1038/jcbfm.2012.207 [DOI] [PMC free article] [PubMed] [Google Scholar]
- Hyder F, Herman P, Bailey CJ, Møller A, Globinsky R, Fulbright RK, Rothman DL, & Gjedde A (2016). Uniform distributions of glucose oxidation and oxygen extraction in gray matter of normal human brain: No evidence of regional differences of aerobic glycolysis. Journal of Cerebral Blood Flow & Metabolism, 36(5), 903–916. 10.1177/0271678X15625349 [DOI] [PMC free article] [PubMed] [Google Scholar]
- Hyder F, Rothman DL, & Bennett MR (2013). Cortical energy demands of signaling and nonsignaling components in brain are conserved across mammalian species and activity levels. Proceedings of the National Academy of Sciences of the United States of America, 110(9), 3549–3554. 10.1073/pnas.1214912110 [DOI] [PMC free article] [PubMed] [Google Scholar]
- Hyder F, Shulman RG, & Rothman DL (1998). A model for the regulation of cerebral oxygen delivery. Journal of Applied Physiology (Bethesda, Md.: 1985), 85(2), 554–564. 10.1152/jappl.1998.85.2.554 [DOI] [PubMed] [Google Scholar]
- Ide K, Schmalbruch IK, Quistorff B, Horn A, & Secher NH (2000). Lactate, glucose and O2 uptake in human brain during recovery from maximal exercise. The Journal of Physiology, 522(Pt 1), 159–164. 10.1111/j.1469-7793.2000.t01-2-00159.xm [DOI] [PMC free article] [PubMed] [Google Scholar]
- Innocenti GM, Vercelli A, & Caminiti R (2014). The Diameter of Cortical Axons Depends Both on the Area of Origin and Target. Cerebral Cortex, 24(8), 2178–2188. 10.1093/cercor/bht070 [DOI] [PubMed] [Google Scholar]
- Ivanov AI, Malkov AE, Waseem T, Mukhtarov M, Buldakova S, Gubkina O, Zilberter M, & Zilberter Y (2014). Glycolysis and Oxidative Phosphorylation in Neurons and Astrocytes during Network Activity in Hippocampal Slices. Journal of Cerebral Blood Flow & Metabolism, 34(3), 397–407. 10.1038/jcbfm.2013.222 [DOI] [PMC free article] [PubMed] [Google Scholar]
- Iversen JR, Repp BH, & Patel AD (2009). Top-Down Control of Rhythm Perception Modulates Early Auditory Responses. Annals of the New York Academy of Sciences, 1169(1), 58–73. 10.1111/j.1749-6632.2009.04579.x [DOI] [PubMed] [Google Scholar]
- Jackson JG, & Robinson MB (2018). Regulation of mitochondrial dynamics in astrocytes: Mechanisms, consequences, and unknowns. Glia, 66(6), 1213–1234. 10.1002/glia.23252 [DOI] [PMC free article] [PubMed] [Google Scholar]
- Jacobs B (2001). Regional Dendritic and Spine Variation in Human Cerebral Cortex: A Quantitative Golgi Study. Cerebral Cortex, 11(6), 558–571. 10.1093/cercor/11.6.558 [DOI] [PubMed] [Google Scholar]
- James W (1931). The Principles of Psychology (Vol. 1). Holt. http://archive.org/details/theprinciplesofp01jameuoft (Original work published 1890) [Google Scholar]
- Jensen O, Spaak E, & Zumer JM (2019). Human Brain Oscillations: From Physiological Mechanisms to Analysis and Cognition. Magnetoencephalography, 1–46. 10.1007/978-3-319-62657-4_17-1 [DOI] [Google Scholar]
- Jiang J, Su Y, Zhang R, Li H, Tao L, & Liu Q (2022). C. elegans enteric motor neurons fire synchronized action potentials underlying the defecation motor program. Nature Communications, 13(1), Article 1. 10.1038/s41467-022-30452-y [DOI] [PMC free article] [PubMed] [Google Scholar]
- Kanatani T, Mizuno K, & Okada Y (1995). Effects of glycolytic metabolites on preservation of high energy phosphate level and synaptic transmission in the granule cells of guinea pig hippocampal slices. Experientia, 51(3), 213–216. 10.1007/BF01931098 [DOI] [PubMed] [Google Scholar]
- Kann O (2016). The interneuron energy hypothesis: Implications for brain disease. Neurobiology of Disease, 90, 75–85. 10.1016/j.nbd.2015.08.005 [DOI] [PubMed] [Google Scholar]
- Kanner L (1943). Autistic disturbances of affective contact. Nervous Child, 2, 217–250. [PubMed] [Google Scholar]
- Kao-Jen J, & Wilson JE (1980). Localization of hexokinase in neural tissue: Electron microscopic studies of rat cerebellar cortex. Journal of Neurochemistry, 35(3), 667–678. 10.1111/j.1471-4159.1980.tb03706.x [DOI] [PubMed] [Google Scholar]
- Kaplan S (2008). Power Plants: Characteristics and Costs. Federation of American Scientists: Congressional Research Service. [Google Scholar]
- Keller GB, & Mrsic-Flogel TD (2018). Predictive Processing: A Canonical Cortical Computation. Neuron, 100(2), 424–435. 10.1016/j.neuron.2018.10.003 [DOI] [PMC free article] [PubMed] [Google Scholar]
- Kim SG, Rostrup E, Larsson HB, Ogawa S, & Paulson OB (1999). Determination of relative CMRO2 from CBF and BOLD changes: Significant increase of oxygen consumption rate during visual stimulation. Magnetic Resonance in Medicine, 41(6), 1152–1161. [DOI] [PubMed] [Google Scholar]
- Kim S-G, & Ogawa S (2012). Biophysical and physiological origins of blood oxygenation level-dependent fMRI signals. Journal of Cerebral Blood Flow and Metabolism: Official Journal of the International Society of Cerebral Blood Flow and Metabolism, 32(7), 1188–1206. 10.1038/jcbfm.2012.23 [DOI] [PMC free article] [PubMed] [Google Scholar]
- Kinney DK, & Tanaka M (2009). An Evolutionary Hypothesis of Depression and Its Symptoms, Adaptive Value, and Risk Factors. Journal of Nervous & Mental Disease, 197(8), 561–567. 10.1097/NMD.0b013e3181b05fa8 [DOI] [PubMed] [Google Scholar]
- Kleckner IR, Zhang J, Touroutoglou A, Chanes L, Xia C, Simmons WK, Quigley KS, Dickerson BC, & Feldman Barrett L (2017). Evidence for a large-scale brain system supporting allostasis and interoception in humans. Nature Human Behaviour, 1(5), 0069. 10.1038/s41562-017-0069 [DOI] [PMC free article] [PubMed] [Google Scholar]
- Klinedinst NJ, & Regenold WT (2015). A mitochondrial bioenergetic basis of depression. Journal of Bioenergetics and Biomembranes, 47(1–2), 155–171. 10.1007/s10863-014-9584-6 [DOI] [PubMed] [Google Scholar]
- Koch K, McLean J, Berry M, Sterling P, Balasubramanian V, & Freed MA (2004). Efficiency of Information Transmission by Retinal Ganglion Cells. Current Biology, 14(17), 1523–1530. 10.1016/j.cub.2004.08.060 [DOI] [PubMed] [Google Scholar]
- Koch K, McLean J, Segev R, Freed MA, Berry MJ, Balasubramanian V, & Sterling P (2006). How Much the Eye Tells the Brain. Current Biology : CB, 16(14), 1428–1434. 10.1016/j.cub.2006.05.056 [DOI] [PMC free article] [PubMed] [Google Scholar]
- Köhler CA, Freitas TH, Maes M, de Andrade NQ, Liu CS, Fernandes BS, Stubbs B, Solmi M, Veronese N, Herrmann N, Raison CL, Miller BJ, Lanctôt KL, & Carvalho AF (2017). Peripheral cytokine and chemokine alterations in depression: A meta-analysis of 82 studies. Acta Psychiatrica Scandinavica, 135(5), 373–387. 10.1111/acps.12698 [DOI] [PubMed] [Google Scholar]
- Koush Y, de Graaf RA, Kupers R, Dricot L, Ptito M, Behar KL, Rothman DL, & Hyder F (2021). Metabolic underpinnings of activated and deactivated cortical areas in human brain. Journal of Cerebral Blood Flow & Metabolism, 41(5), 986–1000. 10.1177/0271678X21989186 [DOI] [PMC free article] [PubMed] [Google Scholar]
- Krawchuk MB, Ruff CF, Yang X, Ross SE, & Vazquez AL (2020). Optogenetic assessment of VIP, PV, SOM and NOS inhibitory neuron activity and cerebral blood flow regulation in mouse somato-sensory cortex. Journal of Cerebral Blood Flow & Metabolism, 40(7), 1427–1440. 10.1177/0271678X19870105 [DOI] [PMC free article] [PubMed] [Google Scholar]
- Kriegeskorte N, Goebel R, & Bandettini P (2006). Information-based functional brain mapping. Proceedings of the National Academy of Sciences, 103(10), 3863–3868. 10.1073/pnas.0600244103 [DOI] [PMC free article] [PubMed] [Google Scholar]
- Krishnan A, Woo C-W, Chang LJ, Ruzic L, Gu X, López-Solà M, Jackson PL, Pujol J, Fan J, & Wager TD (2016). Somatic and vicarious pain are represented by dissociable multivariate brain patterns. ELife, 5, e15166. 10.7554/eLife.15166 [DOI] [PMC free article] [PubMed] [Google Scholar]
- Krumm N, O’Roak BJ, Shendure J, & Eichler EE (2014). A de novo convergence of autism genetics and molecular neuroscience. Trends in Neurosciences, 37(2), 95–105. 10.1016/j.tins.2013.11.005 [DOI] [PMC free article] [PubMed] [Google Scholar]
- Kuhn TS (2012). The Structure of Scientific Revolutions. University of Chicago Press. (Original work published 1962) [Google Scholar]
- Kuznetsov IA, & Kuznetsov AV (2023). ATP diffusional gradients are sufficient to maintain bioenergetic homeostasis in synaptic boutons lacking mitochondria. International Journal for Numerical Methods in Biomedical Engineering, 39(5), e3696. 10.1002/cnm.3696 [DOI] [PubMed] [Google Scholar]
- Kwong KK, Belliveau JW, Chesler DA, Goldberg IE, Weisskoff RM, Poncelet BP, Kennedy DN, Hoppel BE, Cohen MS, & Turner R (1992). Dynamic magnetic resonance imaging of human brain activity during primary sensory stimulation. Proceedings of the National Academy of Sciences, 89(12), 5675–5679. 10.1073/pnas.89.12.5675 [DOI] [PMC free article] [PubMed] [Google Scholar]
- Lachaux J-P, Fonlupt P, Kahane P, Minotti L, Hoffmann D, Bertrand O, & Baciu M (2007). Relationship between task-related gamma oscillations and BOLD signal: New insights from combined fMRI and intracranial EEG. Human Brain Mapping, 28(12), 1368–1375. 10.1002/hbm.20352 [DOI] [PMC free article] [PubMed] [Google Scholar]
- Lacourt TE, Vichaya EG, Chiu GS, Dantzer R, & Heijnen CJ (2018). The High Costs of Low-Grade Inflammation: Persistent Fatigue as a Consequence of Reduced Cellular-Energy Availability and Non-adaptive Energy Expenditure. Frontiers in Behavioral Neuroscience, 12, 78. 10.3389/fnbeh.2018.00078 [DOI] [PMC free article] [PubMed] [Google Scholar]
- Laeng B, Sirois S, & Gredebäck G (2012). Pupillometry: A Window to the Preconscious? Perspectives on Psychological Science, 7(1), 18–27. 10.1177/1745691611427305 [DOI] [PubMed] [Google Scholar]
- Lam KSL, Aman MG, & Arnold LE (2006). Neurochemical correlates of autistic disorder: A review of the literature. Research in Developmental Disabilities, 27(3), 254–289. 10.1016/j.ridd.2005.03.003 [DOI] [PubMed] [Google Scholar]
- Larsen TS, Rasmussen P, Overgaard M, Secher NH, & Nielsen HB (2008). Non-selective β-adrenergic blockade prevents reduction of the cerebral metabolic ratio during exhaustive exercise in humans. The Journal of Physiology, 586(Pt 11), 2807–2815. 10.1113/jphysiol.2008.151449 [DOI] [PMC free article] [PubMed] [Google Scholar]
- Lashley KS (1951). The problem of serial order in behavior. In Cerebral mechanisms in behavior; the Hixon Symposium (pp. 112–146). Wiley. [Google Scholar]
- László A, Horváth E, Eck E, & Fekete M (1994). Serum serotonin, lactate and pyruvate levels in infantile autistic children. Clinica Chimica Acta, 229(1–2), 205–207. 10.1016/0009-8981(94)90243-7 [DOI] [PubMed] [Google Scholar]
- Lawson RP, Friston KJ, & Rees G (2015). A more precise look at context in autism. Proceedings of the National Academy of Sciences, 112(38), E5226–E5226. 10.1073/pnas.1514212112 [DOI] [PMC free article] [PubMed] [Google Scholar]
- Lawson RP, Rees G, & Friston KJ (2014). An aberrant precision account of autism. Frontiers in Human Neuroscience, 8. 10.3389/fnhum.2014.00302 [DOI] [PMC free article] [PubMed] [Google Scholar]
- Levy WB, & Baxter RA (2002). Energy-Efficient Neuronal Computation via Quantal Synaptic Failures. Journal of Neuroscience, 22(11), 4746–4755. 10.1523/JNEUROSCI.22-11-04746.2002 [DOI] [PMC free article] [PubMed] [Google Scholar]
- Li B, & Freeman RD (2015). Neurometabolic coupling between neural activity, glucose, and lactate in activated visual cortex. Journal of Neurochemistry, 135(4), 742–754. 10.1111/jnc.13143 [DOI] [PMC free article] [PubMed] [Google Scholar]
- Lin A-L, Fox PT, Hardies J, Duong TQ, & Gao J-H (2010). Nonlinear coupling between cerebral blood flow, oxygen consumption, and ATP production in human visual cortex. Proceedings of the National Academy of Sciences of the United States of America, 107(18), 8446–8451. 10.1073/pnas.0909711107 [DOI] [PMC free article] [PubMed] [Google Scholar]
- Lin Y, Stephenson MC, Xin L, Napolitano A, & Morris PG (2012). Investigating the Metabolic Changes due to Visual Stimulation using Functional Proton Magnetic Resonance Spectroscopy at 7 T. Journal of Cerebral Blood Flow & Metabolism, 32(8), 1484–1495. 10.1038/jcbfm.2012.33 [DOI] [PMC free article] [PubMed] [Google Scholar]
- Lindauer U, Villringer A, & Dirnagl U (1993). Characterization of CBF response to somatosensory stimulation: Model and influence of anesthetics. American Journal of Physiology-Heart and Circulatory Physiology, 264(4), H1223–H1228. 10.1152/ajpheart.1993.264.4.H1223 [DOI] [PubMed] [Google Scholar]
- Logothetis NK (2008). What we can do and what we cannot do with fMRI. Nature, 453(7197), 869–878. 10.1038/nature06976 [DOI] [PubMed] [Google Scholar]
- Logothetis NK, Pauls J, Augath M, Trinath T, & Oeltermann A (2001). Neurophysiological investigation of the basis of the fMRI signal. Nature, 412(6843), Article 6843. 10.1038/35084005 [DOI] [PubMed] [Google Scholar]
- Logothetis NK, & Wandell BA (2004). Interpreting the BOLD Signal. Annual Review of Physiology, 66(1), 735–769. 10.1146/annurev.physiol.66.082602.092845 [DOI] [PubMed] [Google Scholar]
- Lowry OH, Passonneau JV, Hasselberger FX, & Schulz DW (1964). Effect of Ischemia on Known Substrates and Cofactors of the Glycolytic Pathway in Brain. Journal of Biological Chemistry, 239(1), 18–30. 10.1016/S0021-9258(18)51740-3 [DOI] [PubMed] [Google Scholar]
- MacAskill AF, Atkin TA, & Kittler JT (2010). Mitochondrial trafficking and the provision of energy and calcium buffering at excitatory synapses. The European Journal of Neuroscience, 32(2), 231–240. 10.1111/j.1460-9568.2010.07345.x [DOI] [PubMed] [Google Scholar]
- Madsen PL, Cruz NF, Sokoloff L, & Dienel GA (1999). Cerebral oxygen/glucose ratio is low during sensory stimulation and rises above normal during recovery: Excess glucose consumption during stimulation is not accounted for by lactate efflux from or accumulation in brain tissue. Journal of Cerebral Blood Flow and Metabolism: Official Journal of the International Society of Cerebral Blood Flow and Metabolism, 19(4), 393–400. 10.1097/00004647-199904000-00005 [DOI] [PubMed] [Google Scholar]
- Madsen PL, Hasselbalch SG, Hagemann LP, Olsen KS, Bülow J, Holm S, Wildschiødtz G, Paulson OB, & Lassen NA (1995). Persistent resetting of the cerebral oxygen/glucose uptake ratio by brain activation: Evidence obtained with the Kety-Schmidt technique. Journal of Cerebral Blood Flow and Metabolism, 15, 485–491. 10.1038/jcbfm.1995.60 [DOI] [PubMed] [Google Scholar]
- Madsen PL, Linde R, Hasselbalch SG, Paulson OB, & Lassen NA (1998). Activation-Induced Resetting of Cerebral Oxygen and Glucose Uptake in the Rat. Journal of Cerebral Blood Flow & Metabolism, 18(7), 742–748. 10.1097/00004647-199807000-00005 [DOI] [PubMed] [Google Scholar]
- Maes M (1995). Evidence for an immune response in major depression: A review and hypothesis. Progress in Neuro-Psychopharmacology and Biological Psychiatry, 19(1), 11–38. 10.1016/0278-5846(94)00101-M [DOI] [PubMed] [Google Scholar]
- Maes M, Anderson G, Betancort Medina SR, Seo M, & Ojala JO (2020). Integrating Autism Spectrum Disorder Pathophysiology: Mitochondria, Vitamin A, CD38, Oxytocin, Serotonin and Melatonergic Alterations in the Placenta and Gut. Current Pharmaceutical Design, 25(41), 4405–4420. 10.2174/1381612825666191102165459 [DOI] [PubMed] [Google Scholar]
- Maes M, Berk M, Goehler L, Song C, Anderson G, Gałecki P, & Leonard B (2012). Depression and sickness behavior are Janus-faced responses to shared inflammatory pathways. BMC Medicine, 10, 66. 10.1186/1741-7015-10-66 [DOI] [PMC free article] [PubMed] [Google Scholar]
- Maes M, Galecki P, Chang YS, & Berk M (2011). A review on the oxidative and nitrosative stress (O&NS) pathways in major depression and their possible contribution to the (neuro)degenerative processes in that illness. Progress in Neuro-Psychopharmacology and Biological Psychiatry, 35(3), 676–692. 10.1016/j.pnpbp.2010.05.004 [DOI] [PubMed] [Google Scholar]
- Magistretti PJ, & Allaman I (2015). A Cellular Perspective on Brain Energy Metabolism and Functional Imaging. Neuron, 86(4), 883–901. 10.1016/j.neuron.2015.03.035 [DOI] [PubMed] [Google Scholar]
- Magistretti PJ, & Allaman I (2018). Lactate in the brain: From metabolic end-product to signalling molecule. Nature Reviews Neuroscience, 19(4), 235–249. 10.1038/nrn.2018.19 [DOI] [PubMed] [Google Scholar]
- Magistretti PJ, & Pellerin L (1999). Cellular mechanisms of brain energy metabolism and their relevance to functional brain imaging. Philosophical Transactions of the Royal Society B: Biological Sciences, 354(1387), 1155–1163. [DOI] [PMC free article] [PubMed] [Google Scholar]
- Maier A, Adams GK, Aura C, & Leopold DA (2010). Distinct superficial and deep laminar domains of activity in the visual cortex during rest and stimulation. Frontiers in Systems Neuroscience, 4, 31. 10.3389/fnsys.2010.00031 [DOI] [PMC free article] [PubMed] [Google Scholar]
- Mangia S, Giove F, Tkác I, Logothetis NK, Henry P-G, Olman CA, Maraviglia B, Di Salle F, & Uğurbil K (2009). Metabolic and hemodynamic events after changes in neuronal activity: Current hypotheses, theoretical predictions and in vivo NMR experimental findings. Journal of Cerebral Blood Flow and Metabolism: Official Journal of the International Society of Cerebral Blood Flow and Metabolism, 29(3), 441–463. 10.1038/jcbfm.2008.134 [DOI] [PMC free article] [PubMed] [Google Scholar]
- Mangia S, Tkác I, Gruetter R, Van de Moortele P-F, Maraviglia B, & Uğurbil K (2007). Sustained neuronal activation raises oxidative metabolism to a new steady-state level: Evidence from 1H NMR spectroscopy in the human visual cortex. Journal of Cerebral Blood Flow and Metabolism: Official Journal of the International Society of Cerebral Blood Flow and Metabolism, 27(5), 1055–1063. 10.1038/sj.jcbfm.9600401 [DOI] [PubMed] [Google Scholar]
- Mangia S, Tkáč I, Logothetis NK, Gruetter R, Van de Moortele P-F, & Uğurbil K (2007). Dynamics of lactate concentration and blood oxygen level-dependent effect in the human visual cortex during repeated identical stimuli. Journal of Neuroscience Research. 10.1002/jnr.21371 [DOI] [PubMed] [Google Scholar]
- Markov NT, Ercsey-Ravasz M, Van Essen DC, Knoblauch K, Toroczkai Z, & Kennedy H (2013). Cortical High-Density Counterstream Architectures. Science, 342(6158), 1238406. 10.1126/science.1238406 [DOI] [PMC free article] [PubMed] [Google Scholar]
- Markram H, Toledo-Rodriguez M, Wang Y, Gupta A, Silberberg G, & Wu C (2004). Interneurons of the neocortical inhibitory system. Nature Reviews Neuroscience, 5(10), Article 10. 10.1038/nrn1519 [DOI] [PubMed] [Google Scholar]
- Marr D (2010). Vision: A Computational Investigation Into the Human Representation and Processing of Visual Information. MIT Press. (Original work published 1982) [Google Scholar]
- Martins-de-Souza D, Maccarrone G, Wobrock T, Zerr I, Gormanns P, Reckow S, Falkai P, Schmitt A, & Turck CW (2010). Proteome analysis of the thalamus and cerebrospinal fluid reveals glycolysis dysfunction and potential biomarkers candidates for schizophrenia. Journal of Psychiatric Research, 44(16), 1176–1189. 10.1016/j.jpsychires.2010.04.014 [DOI] [PubMed] [Google Scholar]
- Marzo A, Totah NK, Neves RM, Logothetis NK, & Eschenko O (2014). Unilateral electrical stimulation of rat locus coeruleus elicits bilateral response of norepinephrine neurons and sustained activation of medial prefrontal cortex. Journal of Neurophysiology, 111(12), 2570–2588. 10.1152/jn.00920.2013 [DOI] [PubMed] [Google Scholar]
- Masamoto K, & Kanno I (2012). Anesthesia and the Quantitative Evaluation of Neurovascular Coupling. Journal of Cerebral Blood Flow & Metabolism, 32(7), 1233–1247. 10.1038/jcbfm.2012.50 [DOI] [PMC free article] [PubMed] [Google Scholar]
- Mather M, Clewett D, Sakaki M, & Harley CW (2016). Norepinephrine ignites local hotspots of neuronal excitation: How arousal amplifies selectivity in perception and memory. Behavioral and Brain Sciences, 39, e200. 10.1017/S0140525X15000667 [DOI] [PMC free article] [PubMed] [Google Scholar]
- Mayer A, Schwiedrzik CM, Wibral M, Singer W, & Melloni L (2016). Expecting to See a Letter: Alpha Oscillations as Carriers of Top-Down Sensory Predictions. Cerebral Cortex (New York, N.Y.: 1991), 26(7), 3146–3160. 10.1093/cercor/bhv146 [DOI] [PubMed] [Google Scholar]
- McCormick DA, Nestvogel DB, & He BJ (2020). Neuromodulation of Brain State and Behavior. Annual Review of Neuroscience, 43(1), 391–415. 10.1146/annurev-neuro-100219-105424 [DOI] [PMC free article] [PubMed] [Google Scholar]
- Mende-Siedlecki P, Cai Y, & Todorov A (2013). The neural dynamics of updating person impressions. Social Cognitive and Affective Neuroscience, 8(6), 623–631. 10.1093/scan/nss040 [DOI] [PMC free article] [PubMed] [Google Scholar]
- Mesulam M (1998). From sensation to cognition. Brain, 121(6), 1013–1052. 10.1093/brain/121.6.1013 [DOI] [PubMed] [Google Scholar]
- Michalareas G, Vezoli J, van Pelt S, Schoffelen J-M, Kennedy H, & Fries P (2016). Alpha-beta and gamma rhythms subserve feedback and feedforward influences among human visual cortical areas. Neuron, 89(2), 384–397. 10.1016/j.neuron.2015.12.018 [DOI] [PMC free article] [PubMed] [Google Scholar]
- Miller AH, Maletic V, & Raison CL (2009). Inflammation and its discontents: The role of cytokines in the pathophysiology of major depression. Biological Psychiatry, 65(9), 732–741. 10.1016/j.biopsych.2008.11.029 [DOI] [PMC free article] [PubMed] [Google Scholar]
- Miller AH, & Raison CL (2016). The role of inflammation in depression: From evolutionary imperative to modern treatment target. Nature Reviews. Immunology, 16(1), 22–34. 10.1038/nri.2015.5 [DOI] [PMC free article] [PubMed] [Google Scholar]
- Moradi F, & Buxton RB (2013). Adaptation of cerebral oxygen metabolism and blood flow and modulation of neurovascular coupling with prolonged stimulation in human visual cortex. NeuroImage, 82, 182. 10.1016/j.neuroimage.2013.05.110 [DOI] [PMC free article] [PubMed] [Google Scholar]
- Moraschi M, DiNuzzo M, & Giove F (2012). On the origin of sustained negative BOLD response. Journal of Neurophysiology, 108(9), 2339–2342. 10.1152/jn.01199.2011 [DOI] [PubMed] [Google Scholar]
- Morava É, & Kozicz T (2013). Mitochondria and the economy of stress (mal)adaptation. Neuroscience & Biobehavioral Reviews, 37(4), 668–680. 10.1016/j.neubiorev.2013.02.005 [DOI] [PubMed] [Google Scholar]
- Morris G, & Berk M (2015). The many roads to mitochondrial dysfunction in neuroimmune and neuropsychiatric disorders. BMC Medicine, 13(1), 68. 10.1186/s12916-015-0310-y [DOI] [PMC free article] [PubMed] [Google Scholar]
- Mountcastle V (1997). The columnar organization of the neocortex. Brain, 120(4), 701–722. 10.1093/brain/120.4.701 [DOI] [PubMed] [Google Scholar]
- Mukamel R, Gelbard H, Arieli A, Hasson U, Fried I, & Malach R (2005). Coupling Between Neuronal Firing, Field Potentials, and fMRI in Human Auditory Cortex. Science, 309(5736), 951–954. 10.1126/science.1110913 [DOI] [PubMed] [Google Scholar]
- Müller CP, Pum ME, Amato D, Schüttler J, Huston JP, & De Souza Silva MA (2011). The in vivo neurochemistry of the brain during general anesthesia: Neurochemistry of anesthesia. Journal of Neurochemistry, 119(3), 419–446. 10.1111/j.1471-4159.2011.07445.x [DOI] [PubMed] [Google Scholar]
- Nakao Y, Itoh Y, Kuang TY, Cook M, Jehle J, & Sokoloff L (2001). Effects of anesthesia on functional activation of cerebral blood flow and metabolism. Proceedings of the National Academy of Sciences of the United States of America, 98(13), 7593–7598. 10.1073/pnas.121179898 [DOI] [PMC free article] [PubMed] [Google Scholar]
- Nelson SB, & Valakh V (2015). Excitatory/Inhibitory balance and circuit homeostasis in Autism Spectrum Disorders. Neuron, 87(4), 684–698. 10.1016/j.neuron.2015.07.033 [DOI] [PMC free article] [PubMed] [Google Scholar]
- Newsholme EA, Rolleston FS, & Taylor K (1968). Factors affecting the glucose 6-phosphate inhibition of hexokinase from cerebral cortex tissue of the guinea pig. Biochemical Journal, 106(1), 193–201. 10.1042/bj1060193 [DOI] [PMC free article] [PubMed] [Google Scholar]
- Niessing J, Ebisch B, Schmiddt KE, Niessing M, Singer W, & Galuske RAW (2005). Hemodynamic Signals Correlate Tightly with Synchronized Gamma Oscillations. Science, 309(5736), 948–951. 10.1126/science.1110948 [DOI] [PubMed] [Google Scholar]
- Nir Y, Fisch L, Mukamel R, Gelbard-Sagiv H, Arieli A, Fried I, & Malach R (2007). Coupling between Neuronal Firing Rate, Gamma LFP, and BOLD fMRI Is Related to Interneuronal Correlations. Current Biology, 17(15), 1275–1285. 10.1016/j.cub.2007.06.066 [DOI] [PubMed] [Google Scholar]
- Niven JE (2016). Neuronal energy consumption: Biophysics, efficiency and evolution. Current Opinion in Neurobiology, 41, 129–135. 10.1016/j.conb.2016.09.004 [DOI] [PubMed] [Google Scholar]
- Niven JE, & Laughlin SB (2008). Energy limitation as a selective pressure on the evolution of sensory systems. Journal of Experimental Biology, 211(11), 1792–1804. 10.1242/jeb.017574 [DOI] [PubMed] [Google Scholar]
- Ogawa S, Lee TM, Kay AR, & Tank DW (1990). Brain magnetic resonance imaging with contrast dependent on blood oxygenation. Proceedings of the National Academy of Sciences, 87(24), 9868–9872. 10.1073/pnas.87.24.9868 [DOI] [PMC free article] [PubMed] [Google Scholar]
- Ogawa S, Tank DW, Menon R, Ellermann JM, Kim SG, Merkle H, & Ugurbil K (1992). Intrinsic signal changes accompanying sensory stimulation: Functional brain mapping with magnetic resonance imaging. Proceedings of the National Academy of Sciences, 89(13), 5951–5955. 10.1073/pnas.89.13.5951 [DOI] [PMC free article] [PubMed] [Google Scholar]
- Oliveira G, Diogo L, Grazina M, Garcia P, Ataíde A, Marques C, Miguel T, Borges L, Vicente AM, & Oliveira CR (2005). Mitochondrial dysfunction in autism spectrum disorders: A population-based study. Developmental Medicine and Child Neurology, 47(3), 185–189. 10.1017/s0012162205000332 [DOI] [PubMed] [Google Scholar]
- O’Neill LAJ, Kishton RJ, & Rathmell J (2016). A guide to immunometabolism for immunologists. Nature Reviews Immunology, 16(9), 553–565. 10.1038/nri.2016.70 [DOI] [PMC free article] [PubMed] [Google Scholar]
- Palmer CJ, Lawson RP, & Hohwy J (2017). Bayesian approaches to autism: Towards volatility, action, and behavior. Psychological Bulletin, 143(5), 521–542. 10.1037/bul0000097 [DOI] [PubMed] [Google Scholar]
- Patel AB, Lai JCK, Chowdhury GMI, Hyder F, Rothman DL, Shulman RG, & Behar KL (2014). Direct evidence for activity-dependent glucose phosphorylation in neurons with implications for the astrocyte-to-neuron lactate shuttle. Proceedings of the National Academy of Sciences, 111(14), 5385–5390. 10.1073/pnas.1403576111 [DOI] [PMC free article] [PubMed] [Google Scholar]
- Pathak D, Shields LY, Mendelsohn BA, Haddad D, Lin W, Gerencser AA, Kim H, Brand MD, Edwards RH, & Nakamura K (2015). The Role of Mitochondrially Derived ATP in Synaptic Vesicle Recycling *♦. Journal of Biological Chemistry, 290(37), 22325–22336. 10.1074/jbc.M115.656405 [DOI] [PMC free article] [PubMed] [Google Scholar]
- Paulson OB, Hasselbalch SG, Rostrup E, Knudsen GM, & Pelligrino D (2010). Cerebral blood flow response to functional activation. Journal of Cerebral Blood Flow and Metabolism: Official Journal of the International Society of Cerebral Blood Flow and Metabolism, 30(1), 2–14. 10.1038/jcbfm.2009.188 [DOI] [PMC free article] [PubMed] [Google Scholar]
- Pellerin L, & Magistretti PJ (1994). Glutamate uptake into astrocytes stimulates aerobic glycolysis: A mechanism coupling neuronal activity to glucose utilization. Proceedings of the National Academy of Sciences of the United States of America, 91(22), 10625–10629. [DOI] [PMC free article] [PubMed] [Google Scholar]
- Pérez-Sánchez G, Becerril-Villanueva E, Arreola R, Martínez-Levy G, Hernández-Gutiérrez ME, Velasco-Velásquez MA, Alvarez-Herrera S, Cruz-Fuentes C, Palacios L, de la Peña F, & Pavón L (2018). Inflammatory Profiles in Depressed Adolescents Treated with Fluoxetine: An 8-Week Follow-up Open Study. Mediators of Inflammation, 2018, 4074051. 10.1155/2018/4074051 [DOI] [PMC free article] [PubMed] [Google Scholar]
- Perge JA, Koch K, Miller R, Sterling P, & Balasubramanian V (2009). How the Optic Nerve Allocates Space, Energy Capacity, and Information. Journal of Neuroscience, 29(24), 7917–7928. 10.1523/JNEUROSCI.5200-08.2009 [DOI] [PMC free article] [PubMed] [Google Scholar]
- Perge JA, Niven JE, Mugnaini E, Balasubramanian V, & Sterling P (2012). Why Do Axons Differ in Caliber? Journal of Neuroscience, 32(2), 626–638. 10.1523/JNEUROSCI.4254-11.2012 [DOI] [PMC free article] [PubMed] [Google Scholar]
- Petanjek Z, Judaš M, Šimić G, Rašin MR, Uylings HBM, Rakic P, & Kostović I (2011). Extraordinary neoteny of synaptic spines in the human prefrontal cortex. Proceedings of the National Academy of Sciences, 108(32), 13281–13286. 10.1073/pnas.1105108108 [DOI] [PMC free article] [PubMed] [Google Scholar]
- Pezzulo G, Rigoli F, & Friston K (2015). Active Inference, homeostatic regulation and adaptive behavioural control. Progress in Neurobiology, 134, 17–35. 10.1016/j.pneurobio.2015.09.001 [DOI] [PMC free article] [PubMed] [Google Scholar]
- Pezzulo G, Rigoli F, & Friston KJ (2018). Hierarchical Active Inference: A Theory of Motivated Control. Trends in Cognitive Sciences, 22(4), 294–306. 10.1016/j.tics.2018.01.009 [DOI] [PMC free article] [PubMed] [Google Scholar]
- Picard M, & McEwen BS (2018). Psychological Stress and Mitochondria: A Systematic Review. Psychosomatic Medicine, 80(2), 141–153. 10.1097/PSY.0000000000000545 [DOI] [PMC free article] [PubMed] [Google Scholar]
- Picard M, McEwen BS, Epel ES, & Sandi C (2018). An energetic view of stress: Focus on mitochondria. Frontiers in Neuroendocrinology, 49, 72–85. 10.1016/j.yfrne.2018.01.001 [DOI] [PMC free article] [PubMed] [Google Scholar]
- Pizzarelli R, & Cherubini E (2011). Alterations of GABAergic Signaling in Autism Spectrum Disorders. Neural Plasticity, 2011, 1–12. 10.1155/2011/297153 [DOI] [PMC free article] [PubMed] [Google Scholar]
- Poldrack RA, Laumann TO, Koyejo O, Gregory B, Hover A, Chen M-Y, Gorgolewski KJ, Luci J, Joo SJ, Boyd RL, Hunicke-Smith S, Simpson ZB, Caven T, Sochat V, Shine JM, Gordon E, Snyder AZ, Adeyemo B, Petersen SE, … Mumford JA (2015). Long-term neural and physiological phenotyping of a single human. Nature Communications, 6(1), 8885. 10.1038/ncomms9885 [DOI] [PMC free article] [PubMed] [Google Scholar]
- Pontzer H (2015). Energy expenditure in humans and other primates: A new synthesis. Annual Review of Anthropology, 44(1), 169–187. 10.1146/annurev-anthro-102214-013925 [DOI] [Google Scholar]
- Powers WT (1973). Feedback: Beyond Behaviorism. Science, 179(4071), 351–356. 10.1126/science.179.4071.351 [DOI] [PubMed] [Google Scholar]
- Prabakaran S, Swatton JE, Ryan MM, Huffaker SJ, Huang J-J, Griffin JL, Wayland M, Freeman T, Dudbridge F, Lilley KS, Karp NA, Hester S, Tkachev D, Mimmack ML, Yolken RH, Webster MJ, Torrey EF, & Bahn S (2004). Mitochondrial dysfunction in schizophrenia: Evidence for compromised brain metabolism and oxidative stress. Molecular Psychiatry, 9(7), Article 7. 10.1038/sj.mp.4001511 [DOI] [PubMed] [Google Scholar]
- Preuschoff K, ‘t Hart BM, & Einhäuser W (2011). Pupil dilation signals surprise: Evidence for noradrenaline’s role in decision making. Frontiers in Neuroscience, 5, 115. 10.3389/fnins.2011.00115 [DOI] [PMC free article] [PubMed] [Google Scholar]
- Preuss TM, Cáceres M, Oldham MC, & Geschwind DH (2004). Human brain evolution: Insights from microarrays. Nature Reviews Genetics, 5(11), Article 11. 10.1038/nrg1469 [DOI] [PubMed] [Google Scholar]
- Prichard J, Rothman D, Novotny E, Petroff O, Kuwabara T, Avison M, Howseman A, Hanstock C, & Shulman R (1991). Lactate rise detected by 1H NMR in human visual cortex during physiologic stimulation. Proceedings of the National Academy of Sciences of the United States of America, 88(13), 5829–5831. 10.1073/pnas.88.13.5829 [DOI] [PMC free article] [PubMed] [Google Scholar]
- Quistorff B, Secher NH, & Van Lieshout JJ (2008). Lactate fuels the human brain during exercise. The FASEB Journal, 22(10), 3443–3449. 10.1096/fj.08-106104 [DOI] [PubMed] [Google Scholar]
- Raichle ME (2010). Two views of brain function. Trends in Cognitive Sciences, 14(4), 180–190. 10.1016/j.tics.2010.01.008 [DOI] [PubMed] [Google Scholar]
- Raichle ME, & Mintun MA (2006). Brain Work and Brain Imaging. Annual Review of Neuroscience, 29(1), 449–476. 10.1146/annurev.neuro.29.051605.112819 [DOI] [PubMed] [Google Scholar]
- Raison CL, & Miller AH (2013). The evolutionary significance of depression in Pathogen Host Defense (PATHOS-D). Molecular Psychiatry, 18(1), 15–37. 10.1038/mp.2012.2 [DOI] [PMC free article] [PubMed] [Google Scholar]
- Ramos BP, & Arnsten AFT (2007). Adrenergic pharmacology and cognition: Focus on the prefrontal cortex. Pharmacology & Therapeutics, 113(3), 523–536. 10.1016/j.pharmthera.2006.11.006 [DOI] [PMC free article] [PubMed] [Google Scholar]
- Rao RPN, & Ballard DH (1999). Predictive coding in the visual cortex: A functional interpretation of some extra-classical receptive-field effects. Nature Neuroscience, 2(1), 79–87. 10.1038/4580 [DOI] [PubMed] [Google Scholar]
- Rasmussen P, Plomgaard P, Krogh-Madsen R, Kim Y-S, van Lieshout JJ, Secher NH, & Quistorff B (2006). MCA Vmean and the arterial lactate-to-pyruvate ratio correlate during rhythmic handgrip. Journal of Applied Physiology (Bethesda, Md.: 1985), 101(5), 1406–1411. 10.1152/japplphysiol.00423.2006 [DOI] [PubMed] [Google Scholar]
- Rauss K, & Pourtois G (2013). What is Bottom-Up and What is Top-Down in Predictive Coding? Frontiers in Psychology, 4, 1–8. [DOI] [PMC free article] [PubMed] [Google Scholar]
- Riedl V, Utz L, Castrillón G, Grimmer T, Rauschecker JP, Ploner M, Friston KJ, Drzezga A, & Sorg C (2016). Metabolic connectivity mapping reveals effective connectivity in the resting human brain. Proceedings of the National Academy of Sciences, 113(2), 428–433. 10.1073/pnas.1513752113 [DOI] [PMC free article] [PubMed] [Google Scholar]
- Ross Ashby W (1960). The brain as regulator. Nature, 186, 413. 10.1038/186413a0 [DOI] [PubMed] [Google Scholar]
- Rothman DL, & Dienel GA (2019). Development of a Model to Test Whether Glycogenolysis Can Support Astrocytic Energy Demands of Na+, K+-ATPase and Glutamate-Glutamine Cycling, Sparing an Equivalent Amount of Glucose for Neurons. In DiNuzzo M & Schousboe A (Eds.), Brain Glycogen Metabolism (pp. 385–433). Springer International Publishing. 10.1007/978-3-030-27480-1_14 [DOI] [PubMed] [Google Scholar]
- Rothman DL, Dienel GA, Behar KL, Hyder F, DiNuzzo M, Giove F, & Mangia S (2022). Glucose sparing by glycogenolysis (GSG) determines the relationship between brain metabolism and neurotransmission. Journal of Cerebral Blood Flow & Metabolism, 0271678X2110643. 10.1177/0271678X211064399 [DOI] [PMC free article] [PubMed] [Google Scholar]
- Rubenstein JLR, & Merzenich MM (2003). Model of autism: Increased ratio of excitation/inhibition in key neural systems. Genes, Brain, and Behavior, 2(5), 255–267. [DOI] [PMC free article] [PubMed] [Google Scholar]
- Ruigrok TJH, Hensbroek RA, & Simpson JI (2011). Spontaneous Activity Signatures of Morphologically Identified Interneurons in the Vestibulocerebellum. Journal of Neuroscience, 31(2), 712–724. 10.1523/JNEUROSCI.1959-10.2011 [DOI] [PMC free article] [PubMed] [Google Scholar]
- Rutledge RB, Lazzaro SC, Lau B, Myers CE, Gluck MA, & Glimcher PW (2009). opaminergic drugs modulate learning rates and perseveration in Parkinson’s patients in a dynamic foraging task. The Journal of Neuroscience: The Official Journal of the Society for Neuroscience, 29(48), 15104–15114. 10.1523/JNEUROSCI.3524-09.2009 [DOI] [PMC free article] [PubMed] [Google Scholar]
- Sagar-Ouriaghli I, Lievesley K, & Santosh PJ (2018). Propranolol for treating emotional, behavioural, autonomic dysregulation in children and adolescents with autism spectrum disorders. Journal of Psychopharmacology, 32(6), 641–653. 10.1177/0269881118756245 [DOI] [PubMed] [Google Scholar]
- Sakurada O, Kennedy C, Jehle J, Brown JD, Carbin GL, & Sokoloff L (1978). Measurement of local cerebral blood flow with iodo [14C] antipyrine. The American Journal of Physiology, 234(1), H59–66. 10.1152/ajpheart.1978.234.1.H59 [DOI] [PubMed] [Google Scholar]
- Salamone JD, & Correa M (2012). The mysterious motivational functions of mesolimbic dopamine. Neuron, 76(3), 470–485. 10.1016/j.neuron.2012.10.021 [DOI] [PMC free article] [PubMed] [Google Scholar]
- Salamone JD, Correa M, Farrar A, & Mingote SM (2007). Effort-related functions of nucleus accumbens dopamine and associated forebrain circuits. Psychopharmacology, 191(3), 461–482. 10.1007/s00213-006-0668-9 [DOI] [PubMed] [Google Scholar]
- Salamone JD, Steinpreis RE, McCullough LD, Smith P, Grebel D, & Mahan K (1991). Haloperidol and nucleus accumbens dopamine depletion suppress lever pressing for food but increase free food consumption in a novel food choice procedure. Psychopharmacology, 104(4), 515–521. 10.1007/BF02245659 [DOI] [PubMed] [Google Scholar]
- Salamone JD, Yohn SE, López-Cruz L, San Miguel N, & Correa M (2016). Activational and effort-related aspects of motivation: Neural mechanisms and implications for psychopathology. Brain: A Journal of Neurology, 139(Pt 5), 1325–1347. 10.1093/brain/aww050 [DOI] [PMC free article] [PubMed] [Google Scholar]
- Sappey-Marinier D, Calabrese G, Fein G, Hugg JW, Biggins C, & Weiner MW (1992). Effect of photic stimulation on human visual cortex lactate and phosphates using 1H and 31P magnetic resonance spectroscopy. Journal of Cerebral Blood Flow and Metabolism: Official Journal of the International Society of Cerebral Blood Flow and Metabolism, 12(4), 584–592. 10.1038/jcbfm.1992.82 [DOI] [PubMed] [Google Scholar]
- Schaller B, Mekle R, Xin L, Kunz N, & Gruetter R (2013). Net increase of lactate and glutamate concentration in activated human visual cortex detected with magnetic resonance spectroscopy at 7 tesla. Journal of Neuroscience Research, 91(8), 1076–1083. 10.1002/jnr.23194 [DOI] [PubMed] [Google Scholar]
- Schaller B, Xin L, O’Brien K, Magill AW, & Gruetter R (2014). Are glutamate and lactate increases ubiquitous to physiological activation? A 1H functional MR spectroscopy study during motor activation in human brain at 7Tesla. NeuroImage, 93, 138–145. 10.1016/j.neuroimage.2014.02.016 [DOI] [PubMed] [Google Scholar]
- Scheeringa R, Fries P, Petersson K-M, Oostenveld R, Grothe I, Norris DG, Hagoort P, & Bastiaansen MCM (2011). Neuronal dynamics underlying high- and low-frequency EEG oscillations contribute independently to the human BOLD signal. Neuron, 69(3), 572–583. 10.1016/j.neuron.2010.11.044 [DOI] [PubMed] [Google Scholar]
- Scheeringa R, Koopmans PJ, van Mourik T, Jensen O, & Norris DG (2016). The relationship between oscillatory EEG activity and the laminar-specific BOLD signal. Proceedings of the National Academy of Sciences of the United States of America, 113(24), 6761–6766. 10.1073/pnas.1522577113 [DOI] [PMC free article] [PubMed] [Google Scholar]
- Schmalbruch IK, Linde R, Paulson OB, & Madsen PL (2002). Activation-induced resetting of cerebral metabolism and flow is abolished by beta-adrenergic blockade with propranolol. Stroke, 33(1), 251–255. 10.1161/hs0102.101233 [DOI] [PubMed] [Google Scholar]
- Schmidt FM, Lichtblau N, Minkwitz J, Chittka T, Thormann J, Kirkby KC, Sander C, Mergl R, Faßhauer M, Stumvoll M, Holdt LM, Teupser D, Hegerl U, & Himmerich H (2014). Cytokine levels in depressed and non-depressed subjects, and masking effects of obesity. Journal of Psychiatric Research, 55, 29–34. 10.1016/j.jpsychires.2014.04.021 [DOI] [PubMed] [Google Scholar]
- Schneider J, Berndt N, Papageorgiou IE, Maurer J, Bulik S, Both M, Draguhn A, Holzhütter H-G, & Kann O (2019). Local oxygen homeostasis during various neuronal network activity states in the mouse hippocampus. Journal of Cerebral Blood Flow & Metabolism, 39(5), 859–873. 10.1177/0271678X17740091 [DOI] [PMC free article] [PubMed] [Google Scholar]
- Scotti PS, Banerjee A, Goode J, Shabalin S, Nguyen A, Cohen E, Dempster AJ, Verlinde N, Yundler E, Weisberg D, Norman KA, & Abraham TM (2023). Reconstructing the Mind’s Eye: FMRI-to-Image with Contrastive Learning and Diffusion Priors (arXiv:2305.18274). arXiv. 10.48550/arXiv.2305.18274 [DOI] [Google Scholar]
- Sedley W, Gander PE, Kumar S, Kovach CK, Oya H, Kawasaki H, Howard MA III, & Griffiths TD (2016). Neural signatures of perceptual inference. ELife, 5, e11476. 10.7554/eLife.11476 [DOI] [PMC free article] [PubMed] [Google Scholar]
- Semendeferi K, & Damasio H (2000). The brain and its main anatomical subdivisions in living hominoids using magnetic resonance imaging. Journal of Human Evolution, 38(2), 317–332. 10.1006/jhev.1999.0381 [DOI] [PubMed] [Google Scholar]
- Semendeferi K, Teffer K, Buxhoeveden DP, Park MS, Bludau S, Amunts K, Travis K, & Buckwalter J (2011). Spatial organization of neurons in the frontal pole sets humans apart from great apes. Cerebral Cortex (New York, N.Y.: 1991), 21(7), 1485–1497. 10.1093/cercor/bhq191 [DOI] [PubMed] [Google Scholar]
- Sengupta B, Faisal AA, Laughlin SB, & Niven JE (2013). The Effect of Cell Size and Channel Density on Neuronal Information Encoding and Energy Efficiency. Journal of Cerebral Blood Flow & Metabolism, 33(9), 1465–1473. 10.1038/jcbfm.2013.103 [DOI] [PMC free article] [PubMed] [Google Scholar]
- Sengupta B, Laughlin SB, & Niven JE (2014). Consequences of Converting Graded to Action Potentials upon Neural Information Coding and Energy Efficiency. PLoS Computational Biology, 10(1), e1003439. 10.1371/journal.pcbi.1003439 [DOI] [PMC free article] [PubMed] [Google Scholar]
- Sengupta B, & Stemmler MB (2014). Power Consumption During Neuronal Computation. Proceedings of the IEEE, 102(5), 738–750. 10.1109/JPROC.2014.2307755 [DOI] [Google Scholar]
- Sengupta B, Stemmler MB, & Friston KJ (2013). Information and efficiency in the nervous system—A synthesis. PLoS Computational Biology, 9(7), e1003157. 10.1371/journal.pcbi.1003157 [DOI] [PMC free article] [PubMed] [Google Scholar]
- Sengupta B, Stemmler M, Laughlin SB, & Niven JE (2010). Action Potential Energy Efficiency Varies Among Neuron Types in Vertebrates and Invertebrates. PLoS Computational Biology, 6(7), e1000840. 10.1371/journal.pcbi.1000840 [DOI] [PMC free article] [PubMed] [Google Scholar]
- Sennesh E, Theriault J, Brooks D, van de Meent J-W, Barrett LF, & Quigley KS (2022). Interoception as modeling, allostasis as control. Biological Psychology, 167, 108242. 10.1016/j.biopsycho.2021.108242 [DOI] [PMC free article] [PubMed] [Google Scholar]
- Seth AK (2013). Interoceptive inference, emotion, and the embodied self. Trends in Cognitive Sciences, 17(11), 565–573. 10.1016/j.tics.2013.09.007 [DOI] [PubMed] [Google Scholar]
- Seth AK (2015). The cybernetic bayesian brain: From interoceptive inference to sensorimotor contingencies. In Metzinger T & Windt JM (Eds.), Open MIND (pp. 1–24). MIND Group. http://www.open-mind.net/DOI?isbn=9783958570108 [Google Scholar]
- Shadmehr R, & Krakauer JW (2008). A computational neuroanatomy for motor control. Experimental Brain Research, 185(3), 359–381. 10.1007/s00221-008-1280-5 [DOI] [PMC free article] [PubMed] [Google Scholar]
- Shadmehr R, Smith MA, & Krakauer JW (2010). Error correction, sensory prediction, and adaptation in motor control. Annual Review of Neuroscience, 33(1), 89–108. 10.1146/annurev-neuro-060909-153135 [DOI] [PubMed] [Google Scholar]
- Shaffer C, Westlin C, Quigley KS, Whitfield-Gabrieli S, & Barrett LF (2022). Allostasis, action and affect in depression: Insights from the theory of constructed emotion. Annual Review of Clinical Psychology, 18, 553–580. 10.1146/annurev-clinpsy-081219-115627 [DOI] [PMC free article] [PubMed] [Google Scholar]
- Shannon C, & Weaver W (1964). The Mathematical Theory of Communication (10th ed.). The University of Illinois Press. (Original work published 1949) [Google Scholar]
- Sheahan HR, Franklin DW, & Wolpert DM (2016). Motor planning, not execution, separates motor memories. Neuron, 92(4), 773–779. 10.1016/j.neuron.2016.10.017 [DOI] [PMC free article] [PubMed] [Google Scholar]
- Sheng Z-H (2017). The Interplay of Axonal Energy Homeostasis and Mitochondrial Trafficking and Anchoring. Trends in Cell Biology, 27(6), 403–416. 10.1016/j.tcb.2017.01.005 [DOI] [PMC free article] [PubMed] [Google Scholar]
- Sheng Z-H, & Cai Q (2012). Mitochondrial transport in neurons: Impact on synaptic homeostasis and neurodegeneration. Nature Reviews. Neuroscience, 13(2), 77–93. 10.1038/nrn3156 [DOI] [PMC free article] [PubMed] [Google Scholar]
- Sherwood CC, Bauernfeind AL, Verendeev A, Raghanti MA, & Hof PR (2017). Evolutionary Specializations of Human Brain Microstructure. In Evolution of Nervous Systems (pp. 121–139). Elsevier. 10.1016/B978-0-12-804042-3.00127-5 [DOI] [Google Scholar]
- Sherwood CC, & Smaers JB (2013). What’s the fuss over human frontal lobe evolution? Trends in Cognitive Sciences, 17(9), 432–433. 10.1016/j.tics.2013.06.008 [DOI] [PubMed] [Google Scholar]
- Shulman RG, Hyder F, & Rothman DL (2009). Baseline brain energy supports the state of consciousness. Proceedings of the National Academy of Sciences, 106(27), 11096–11101. 10.1073/pnas.0903941106 [DOI] [PMC free article] [PubMed] [Google Scholar]
- Shulman RG, Rothman DL, & Hyder F (2007). A BOLD search for baseline. NeuroImage, 36(2), 277–281. 10.1016/j.neuroimage.2006.11.035 [DOI] [PMC free article] [PubMed] [Google Scholar]
- Sik A, Penttonen M, Ylinen A, & Buzsáki G (1995). Hippocampal CA1 interneurons: An in vivo intracellular labeling study. The Journal of Neuroscience: The Official Journal of the Society for Neuroscience, 15(10), 6651–6665. [DOI] [PMC free article] [PubMed] [Google Scholar]
- Simpson IA, Dwyer D, Malide D, Moley KH, Travis A, & Vannucci SJ (2008). The facilitative glucose transporter GLUT3: 20 years of distinction. American Journal of Physiology - Endocrinology and Metabolism, 295(2), E242–E253. 10.1152/ajpendo.90388.2008 [DOI] [PMC free article] [PubMed] [Google Scholar]
- Simpson SJ, & Raubenheimer D (2012). The Nature of Nutrition: A Unifying Framework from Animal Adaptation to Human Obesity. Princeton University Press. [Google Scholar]
- Singh KD (2012). Which “neural activity” do you mean? FMRI, MEG, oscillations and neurotransmitters. NeuroImage, 62(2), 1121–1130. 10.1016/j.neuroimage.2012.01.028 [DOI] [PubMed] [Google Scholar]
- Sinha P, Kjelgaard MM, Gandhi TK, Tsourides K, Cardinaux AL, Pantazis D, Diamond SP, & Held RM (2014). Autism as a disorder of prediction. Proceedings of the National Academy of Sciences, 111(42), 15220–15225. 10.1073/pnas.1416797111 [DOI] [PMC free article] [PubMed] [Google Scholar]
- Smith MA, Jia X, Zandvakili A, & Kohn A (2013). Laminar dependence of neuronal correlations in visual cortex. Journal of Neurophysiology, 109(4), 940–947. 10.1152/jn.00846.2012 [DOI] [PMC free article] [PubMed] [Google Scholar]
- Snyder CD, & Wilson JE (1983). Relative levels of hexokinase in isolated neuronal, astrocytic, and oligodendroglial fractions from rat brain. Journal of Neurochemistry, 40(4), 1178–1181. 10.1111/j.1471-4159.1983.tb08111.x [DOI] [PubMed] [Google Scholar]
- Sohal VS, Zhang F, Yizhar O, & Deisseroth K (2009). Parvalbumin neurons and gamma rhythms enhance cortical circuit performance. Nature, 459(7247), 698–702. 10.1038/nature07991 [DOI] [PMC free article] [PubMed] [Google Scholar]
- Sokoloff L, Reivich M, Kennedy C, Rosiers MHD, Patlak CS, Pettigrew KD, Sakurada O, & Shinohara M (1977). The [14c] deoxyglucose method for the measurement of local cerebral glucose utilization: Theory, procedure, and normal values in the conscious and anesthetized albino rat. Journal of Neurochemistry, 28(5), 897–916. 10.1111/j.1471-4159.1977.tb10649.x [DOI] [PubMed] [Google Scholar]
- Somel M, Liu X, & Khaitovich P (2013). Human brain evolution: Transcripts, metabolites and their regulators. Nature Reviews Neuroscience, 14(2), 112–127. 10.1038/nrn3372 [DOI] [PubMed] [Google Scholar]
- Sonnay S, Duarte JMN, & Just N (2017). Lactate and glutamate dynamics during prolonged stimulation of the rat barrel cortex suggest adaptation of cerebral glucose and oxygen metabolism. Neuroscience, 346, 337–348. 10.1016/j.neuroscience.2017.01.034 [DOI] [PubMed] [Google Scholar]
- Sperry RW (1950). Neural basis of the spontaneous optokinetic response produced by visual inversion. Journal of Comparative and Physiological Psychology, 43(6), 482–489. [DOI] [PubMed] [Google Scholar]
- Spivey M (2008). The Continuity of Mind. Oxford University Press. [Google Scholar]
- Spocter MA, Hopkins WD, Barks SK, Bianchi S, Hehmeyer AE, Anderson SM, Stimpson CD, Fobbs AJ, Hof PR, & Sherwood CC (2012). Neuropil distribution in the cerebral cortex differs between humans and chimpanzees. The Journal of Comparative Neurology, 520(13), 2917–2929. 10.1002/cne.23074 [DOI] [PMC free article] [PubMed] [Google Scholar]
- Spruit IM, Wilderjans TF, & van Steenbergen H (2018). Heart work after errors: Behavioral adjustment following error commission involves cardiac effort. Cognitive, Affective, & Behavioral Neuroscience, 18(2), 375–388. 10.3758/s13415-018-0576-6 [DOI] [PMC free article] [PubMed] [Google Scholar]
- Stedehouder J, Brizee D, Slotman JA, Pascual-Garcia M, Leyrer ML, Bouwen BL, Dirven CM, Gao Z, Berson DM, Houtsmuller AB, & Kushner SA (2019). Local axonal morphology guides the topography of interneuron myelination in mouse and human neocortex. ELife, 8, e48615. 10.7554/eLife.48615 [DOI] [PMC free article] [PubMed] [Google Scholar]
- Stephan KE, Manjaly ZM, Mathys CD, Weber LAE, Paliwal S, Gard T, Tittgemeyer M, Fleming SM, Haker H, Seth AK, & Petzschner FH (2016). Allostatic Self-efficacy: A Metacognitive Theory of Dyshomeostasis-Induced Fatigue and Depression. Frontiers in Human Neuroscience, 10. 10.3389/fnhum.2016.00550 [DOI] [PMC free article] [PubMed] [Google Scholar]
- Sterling P (2012). Allostasis: A model of predictive regulation. Physiology & Behavior, 106(1), 5–15. 10.1016/j.physbeh.2011.06.004 [DOI] [PubMed] [Google Scholar]
- Sterling P, & Laughlin S (2015). Principles of Neural Design. MIT Press. [Google Scholar]
- Stiernman LJ, Grill F, Hahn A, Rischka L, Lanzenberger R, Panes Lundmark V, Riklund K, Axelsson J, & Rieckmann A (2021). Dissociations between glucose metabolism and blood oxygenation in the human default mode network revealed by simultaneous PET-fMRI. Proceedings of the National Academy of Sciences, 118(27), e2021913118. 10.1073/pnas.2021913118 [DOI] [PMC free article] [PubMed] [Google Scholar]
- Stiernman LJ, Grill F, McNulty C, Bahrd P, Lundmark VP, Axelsson J, Salami A, & Rieckmann A (2023). Widespread fMRI BOLD signal overactivations during cognitive control in older adults are not matched by corresponding increases in fPET glucose metabolism. Journal of Neuroscience. 10.1523/JNEUROSCI.1331-22.2023 [DOI] [PMC free article] [PubMed] [Google Scholar]
- Still S, Sivak DA, Bell AJ, & Crooks GE (2012). Thermodynamics of Prediction. Physical Review Letters, 109(12), 120604. 10.1103/PhysRevLett.109.120604 [DOI] [PubMed] [Google Scholar]
- Stone JV (2018). Principles of Neural Information Theory: Computational Neuroscience and Metabolic Efficiency. Sebtel Press. [Google Scholar]
- Strange BA, & Dolan RJ (2007). β-adrenergic modulation of oddball responses in humans. Behavioral and Brain Functions, 3, 29. 10.1186/1744-9081-3-29 [DOI] [PMC free article] [PubMed] [Google Scholar]
- Straub RH (2017). The brain and immune system prompt energy shortage in chronic inflammation and ageing. Nature Reviews Rheumatology, 13(12), 743–751. 10.1038/nrrheum.2017.172 [DOI] [PubMed] [Google Scholar]
- Strong SP, Koberle R, van Steveninck RR de R, & Bialek W (1997). Entropy and Information in Neural Spike Trains (arXiv:cond-mat/9603127). arXiv. 10.48550/arXiv.cond-mat/9603127 [DOI] [Google Scholar]
- Stullken EH, Milde JH, Michenfelder JD, & Tinker JH (1977). The nonlinear responses of cerebral metabolism to low concentrations of halothane, enflurane, isoflurane, and thiopental. Anesthesiology, 46(1), 28–34. 10.1097/00000542-197701000-00007 [DOI] [PubMed] [Google Scholar]
- Swanson LW, & Hartman BK (1975). The central adrenergic system. An immunofluorescence study of the location of cell bodies and their efferent connections in the rat utilizing dopamine-beta-hydroxylase as a marker. The Journal of Comparative Neurology, 163(4), 467–505. 10.1002/cne.901630406 [DOI] [PubMed] [Google Scholar]
- Swanson RA (1992). Physiologic coupling of glial glycogen metabolism to neuronal activity in brain. Canadian Journal of Physiology and Pharmacology, 70(S1), S138–S144. 10.1139/y92-255 [DOI] [PubMed] [Google Scholar]
- Takács VT, Szőnyi A, Freund TF, Nyiri G, & Gulyás AI (2015). Quantitative ultrastructural analysis of basket and axo-axonic cell terminals in the mouse hippocampus. Brain Structure & Function, 220(2), 919–940. 10.1007/s00429-013-0692-6 [DOI] [PubMed] [Google Scholar]
- Tallon-Baudry C, & Bertrand O (1999). Oscillatory gamma activity in humans and its role in object representation. Trends in Cognitive Sciences, 3(4), 12. [DOI] [PubMed] [Google Scholar]
- Tang BL (2018). Brain activity-induced neuronal glucose uptake/glycolysis: Is the lactate shuttle not required? Brain Research Bulletin, 137, 225–228. 10.1016/j.brainresbull.2017.12.010 [DOI] [PubMed] [Google Scholar]
- Tang F, Lane S, Korsak A, Paton JFR, Gourine AV, Kasparov S, & Teschemacher AG (2014). Lactate-mediated glia-neuronal signalling in the mammalian brain. Nature Communications, 5(1), Article 1. 10.1038/ncomms4284 [DOI] [PMC free article] [PubMed] [Google Scholar]
- Tang J, Du M, Vo VA, Lal V, & Huth AG (2023). Brain encoding models based on multimodal transformers can transfer across language and vision (arXiv:2305.12248). arXiv. http://arxiv.org/abs/2305.12248 [PMC free article] [PubMed] [Google Scholar]
- Tang J, LeBel A, Jain S, & Huth AG (2023). Semantic reconstruction of continuous language from non-invasive brain recordings. Nature Neuroscience, 26(5), Article 5. 10.1038/s41593-023-01304-9 [DOI] [PMC free article] [PubMed] [Google Scholar]
- Theriault JE (2023). A constructivist and biologically tractable account of moral motivation. In Berg M & Chang EC (Eds.), Motivation & Morality: A Biopsychosocial Approach. American Psychological Association. [Google Scholar]
- Theriault JE, Young L, & Barrett LF (2020). The sense of should: A biologically-based framework for modeling social pressure. Physics of Life Reviews. 10.1016/j.plrev.2020.01.004 [DOI] [PMC free article] [PubMed] [Google Scholar]
- Theriault JE, Young L, & Barrett LF (2021a). Situating and extending the sense of should: Reply to comments on “the sense of should: A biologically-based framework for modeling social pressure.” Physics of Life Reviews, 37, 10–16. 10.1016/j.plrev.2021.01.001 [DOI] [PMC free article] [PubMed] [Google Scholar]
- Theriault JE, Young L, & Barrett LF (2021b). The sense of should: A biologically-based framework for modeling social pressure. Physics of Life Reviews, 36, 100–136. 10.1016/j.plrev.2020.01.004 [DOI] [PMC free article] [PubMed] [Google Scholar]
- Todorovic A, Ede F van, Maris, E., & Lange, F. P. de. (2011). Prior Expectation Mediates Neural Adaptation to Repeated Sounds in the Auditory Cortex: An MEG Study. Journal of Neuroscience, 31(25), 9118–9123. 10.1523/JNEUROSCI.1425-11.2011 [DOI] [PMC free article] [PubMed] [Google Scholar]
- Toussay X, Basu K, Lacoste B, & Hamel E (2013). Locus Coeruleus Stimulation Recruits a Broad Cortical Neuronal Network and Increases Cortical Perfusion. Journal of Neuroscience, 33(8), 3390–3401. 10.1523/JNEUROSCI.3346-12.2013 [DOI] [PMC free article] [PubMed] [Google Scholar]
- Treadway MT, Cooper JA, & Miller AH (2019). Can’t or Won’t? Immunometabolic Constraints on Dopaminergic Drive. Trends in Cognitive Sciences, 23(5), 435–448. 10.1016/j.tics.2019.03.003 [DOI] [PMC free article] [PubMed] [Google Scholar]
- Uhlirova H, Kılıç K, Tian P, Thunemann M, Desjardins M, Saisan PA, Sakadžić S, Ness TV, Mateo C, Cheng Q, Weldy KL, Razoux F, Vandenberghe M, Cremonesi JA, Ferri CG, Nizar K, Sridhar VB, Steed TC, Abashin M, … Devor A (2016). Cell type specificity of neurovascular coupling in cerebral cortex. ELife, 5, e14315. 10.7554/eLife.14315 [DOI] [PMC free article] [PubMed] [Google Scholar]
- Vafaee MS, Vang K, Bergersen LH, & Gjedde A (2012). Oxygen consumption and blood flow coupling in human motor cortex during intense finger tapping: Implication for a role of lactate. Journal of Cerebral Blood Flow and Metabolism: Official Journal of the International Society of Cerebral Blood Flow and Metabolism, 32(10), 1859–1868. 10.1038/jcbfm.2012.89 [DOI] [PMC free article] [PubMed] [Google Scholar]
- Vaishnavi SN, Vlassenko AG, Rundle MM, Snyder AZ, Mintun MA, & Raichle ME (2010). Regional aerobic glycolysis in the human brain. Proceedings of the National Academy of Sciences, 107(41), 17757–17762. 10.1073/pnas.1010459107 [DOI] [PMC free article] [PubMed] [Google Scholar]
- Vallée A, & Vallée J-N (2018). Warburg effect hypothesis in autism Spectrum disorders. Molecular Brain, 11(1), 1. 10.1186/s13041-017-0343-6 [DOI] [PMC free article] [PubMed] [Google Scholar]
- Van de Cruys S, Evers K, Van der Hallen R, Van Eylen L, Boets B, de-Wit L, & Wagemans J (2014). Precise minds in uncertain worlds: Predictive coding in autism. Psychological Review, 121(4), 649–675. 10.1037/a0037665 [DOI] [PubMed] [Google Scholar]
- van Elst K, Bruining H, Birtoli B, Terreaux C, Buitelaar JK, & Kas MJ (2014). Food for thought: Dietary changes in essential fatty acid ratios and the increase in autism spectrum disorders. Neuroscience & Biobehavioral Reviews, 45, 369–378. 10.1016/j.neubiorev.2014.07.004 [DOI] [PubMed] [Google Scholar]
- van Kerkoerle T, Self MW, Dagnino B, Gariel-Mathis M-A, Poort J, van der Togt C, & Roelfsema PR (2014). Alpha and gamma oscillations characterize feedback and feedforward processing in monkey visual cortex. Proceedings of the National Academy of Sciences, 111(40), 14332–14341. 10.1073/pnas.1402773111 [DOI] [PMC free article] [PubMed] [Google Scholar]
- van Pelt S, Heil L, Kwisthout J, Ondobaka S, van Rooij I, & Bekkering H (2016). Beta- and gamma-band activity reflect predictive coding in the processing of causal events. Social Cognitive and Affective Neuroscience, 11(6), 973–980. 10.1093/scan/nsw017 [DOI] [PMC free article] [PubMed] [Google Scholar]
- van Wijk R, & van Solinge WW (2005). The energy-less red blood cell is lost: Erythrocyte enzyme abnormalities of glycolysis. Blood, 106(13), 4034–4042. 10.1182/blood-2005-04-1622 [DOI] [PubMed] [Google Scholar]
- Vazquez AL, Fukuda M, & Kim S-G (2018). Inhibitory Neuron Activity Contributions to Hemodynamic Responses and Metabolic Load Examined Using an Inhibitory Optogenetic Mouse Model. Cerebral Cortex (New York, NY), 28(11), 4105–4119. 10.1093/cercor/bhy225 [DOI] [PMC free article] [PubMed] [Google Scholar]
- Veissière SPL, Constant A, Ramstead MJD, Friston KJ, & Kirmayer LJ (2019). Thinking Through Other Minds: A Variational Approach to Cognition and Culture. Behavioral and Brain Sciences, 1–97. 10.1017/S0140525X19001213 [DOI] [PubMed] [Google Scholar]
- Villien M, Wey H-Y, Mandeville JB, Catana C, Polimeni JR, Sander CY, Zürcher NR, Chonde DB, Fowler JS, Rosen BR, & Hooker JM (2014). Dynamic functional imaging of brain glucose utilization using fPET-FDG. NeuroImage, 100, 192–199. 10.1016/j.neuroimage.2014.06.025 [DOI] [PMC free article] [PubMed] [Google Scholar]
- Vo TT, Im GH, Han K, Suh M, Drew PJ, & Kim S-G (2023). Parvalbumin interneuron activity drives fast inhibition-induced vasoconstriction followed by slow substance P-mediated vasodilation. Proceedings of the National Academy of Sciences, 120(18), e2220777120. 10.1073/pnas.2220777120 [DOI] [PMC free article] [PubMed] [Google Scholar]
- Volianitis S, Fabricius-Bjerre A, Overgaard A, Strømstad M, Bjarrum M, Carlson C, Petersen NT, Rasmussen P, Secher NH, & Nielsen HB (2008). The cerebral metabolic ratio is not affected by oxygen availability during maximal exercise in humans. The Journal of Physiology, 586(Pt 1), 107–112. 10.1113/jphysiol.2007.142273 [DOI] [PMC free article] [PubMed] [Google Scholar]
- von Holst E (1954). Relations between the central Nervous System and the peripheral organs. The British Journal of Animal Behaviour, 2(3), 89–94. 10.1016/S0950-5601(54)80044-X [DOI] [Google Scholar]
- Wager TD, Atlas LY, Lindquist MA, Roy M, Woo C-W, & Kross E (2013). An fMRI-Based Neurologic Signature of Physical Pain. The New England Journal of Medicine, 368(15), 1388–1397. 10.1056/NEJMoa1204471 [DOI] [PMC free article] [PubMed] [Google Scholar]
- Wallace DC (2017). A Mitochondrial Etiology of Neuropsychiatric Disorders. JAMA Psychiatry, 74(9), 863–864. 10.1001/jamapsychiatry.2017.0397 [DOI] [PubMed] [Google Scholar]
- Wang D, Cheng SL, Fei Q, Gu H, Raftery D, Cao B, Sun X, Yan J, Zhang C, & Wang J (2019). Metabolic profiling identifies phospholipids as potential serum biomarkers for schizophrenia. Psychiatry Research, 272, 18–29. 10.1016/j.psychres.2018.12.008 [DOI] [PubMed] [Google Scholar]
- Wang SS-H, Shultz JR, Burish MJ, Harrison KH, Hof PR, Towns LC, Wagers MW, & Wyatt KD (2008). Functional trade-offs in white matter axonal scaling. The Journal of Neuroscience: The Official Journal of the Society for Neuroscience, 28(15), 4047–4056. 10.1523/JNEUROSCI.5559-05.2008 [DOI] [PMC free article] [PubMed] [Google Scholar]
- Wang X-J (2010). Neurophysiological and Computational Principles of Cortical Rhythms in Cognition. Physiological Reviews, 90(3), 1195–1268. 10.1152/physrev.00035.2008 [DOI] [PMC free article] [PubMed] [Google Scholar]
- Warburg O, Wind F, & Negelein E (1927). The metabolism of tumors in the body. The Journal of General Physiology, 8(6), 519–530. [DOI] [PMC free article] [PubMed] [Google Scholar]
- Wardle MC, Treadway MT, Mayo LM, Zald DH, & de Wit H (2011). Amping up effort: Effects of d-amphetamine on human effort-based decision-making. The Journal of Neuroscience: The Official Journal of the Society for Neuroscience, 31(46), 16597–16602. 10.1523/JNEUROSCI.4387-11.2011 [DOI] [PMC free article] [PubMed] [Google Scholar]
- Webster KA (2003). Evolution of the coordinate regulation of glycolytic enzyme genes by hypoxia. The Journal of Experimental Biology, 206(Pt 17), 2911–2922. 10.1242/jeb.00516 [DOI] [PubMed] [Google Scholar]
- Weger M, & Sandi C (2018). High anxiety trait: A vulnerable phenotype for stress-induced depression. Neuroscience & Biobehavioral Reviews, 87, 27–37. 10.1016/j.neubiorev.2018.01.012 [DOI] [PubMed] [Google Scholar]
- Weibel ER (1998). Symmorphosis and optimization of biological design: Introduction and questions. In Principles of Animal Design: The Optimization and Symmorphosis Debate (pp. 1–10). Cambridge University Press. [Google Scholar]
- Weibel ER (2000). Symmorphosis: On Form and Function in Shaping Life. Harvard University Press. [Google Scholar]
- Weissman JR, Kelley RI, Bauman ML, Cohen BH, Murray KF, Mitchell RL, Kern RL, & Natowicz MR (2008). Mitochondrial Disease in Autism Spectrum Disorder Patients: A Cohort Analysis. PLoS ONE, 3(11), e3815. 10.1371/journal.pone.0003815 [DOI] [PMC free article] [PubMed] [Google Scholar]
- Westlin C, Theriault JE, Katsumi Y, Nieto-Castanon A, Kucyi A, Ruf SF, Brown SM, Pavel M, Erdogmus D, Brooks DH, Quigley KS, Whitfield-Gabrieli S, & Barrett LF (2023). Improving the study of brain-behavior relationships by revisiting basic assumptions. Trends in Cognitive Sciences, S1364661322003321. 10.1016/j.tics.2022.12.015 [DOI] [PMC free article] [PubMed] [Google Scholar]
- Wilkin GP, & Wilson JE (1977). Localization of hexokinase in neural tissue: Light microscopic studies with immunofluorescence and histochemical procedures. Journal of Neurochemistry, 29(6), 1039–1051. 10.1111/j.1471-4159.1977.tb06507.x [DOI] [PubMed] [Google Scholar]
- Wilson JE (1995). Hexokinases. Reviews of Physiology, Biochemistry and Pharmacology, 126, 65–198. 10.1007/BFb0049776 [DOI] [PubMed] [Google Scholar]
- Wilson JE (2003). Isozymes of mammalian hexokinase: Structure, subcellular localization and metabolic function. Journal of Experimental Biology, 206(12), 2049–2057. 10.1242/jeb.00241 [DOI] [PubMed] [Google Scholar]
- Wolpert DM, & Flanagan JR (2016). Computations underlying sensorimotor learning. Current Opinion in Neurobiology, 37, 7–11. 10.1016/j.conb.2015.12.003 [DOI] [PMC free article] [PubMed] [Google Scholar]
- Wolpert DM, Miall RC, & Kawato M (1998). Internal models in the cerebellum. Trends in Cognitive Sciences, 2(9), 338–347. 10.1016/S1364-6613(98)01221-2 [DOI] [PubMed] [Google Scholar]
- Woo C-W, Koban L, Kross E, Lindquist MA, Banich MT, Ruzic L, Andrews-Hanna JR, & Wager TD (2014). Separate neural representations for physical pain and social rejection. Nature Communications, 5, 5380. 10.1038/ncomms6380 [DOI] [PMC free article] [PubMed] [Google Scholar]
- Wundt W (1896). Outlines of Psychology (Judd CH, Trans.). Gustav E. Stechert. [Google Scholar]
- Xu G, Mihaylova T, Li D, Tian F, Farrehi PM, Parent JM, Mashour GA, Wang MM, & Borjigin J (2023). Surge of neurophysiological coupling and connectivity of gamma oscillations in the dying human brain. Proceedings of the National Academy of Sciences, 120(19), e2216268120. 10.1073/pnas.2216268120 [DOI] [PMC free article] [PubMed] [Google Scholar]
- Yellen G (2018). Fueling thought: Management of glycolysis and oxidative phosphorylation in neuronal metabolism. J Cell Biol, 217(7), 2235–2246. 10.1083/jcb.201803152 [DOI] [PMC free article] [PubMed] [Google Scholar]
- Yin H (2020). The crisis in neuroscience. In The Interdisciplinary Handbook of Perceptual Control Theory (pp. 23–48). 10.1016/b978-0-12-818948-1.00003-4 [DOI] [Google Scholar]
- Yoo H (2015). Genetics of Autism Spectrum Disorder: Current Status and Possible Clinical Applications. Experimental Neurobiology, 24(4), 257–272. 10.5607/en.2015.24.4.257 [DOI] [PMC free article] [PubMed] [Google Scholar]
- Yu AJ, & Dayan P (2005). Uncertainty, Neuromodulation, and Attention. Neuron, 46(4), 681–692. 10.1016/j.neuron.2005.04.026 [DOI] [PubMed] [Google Scholar]
- Yu H, Koban L, Chang LJ, Wagner U, Krishnan A, Vuilleumier P, Zhou X, & Wager TD (2020). A Generalizable Multivariate Brain Pattern for Interpersonal Guilt. Cereberal Cortex, 30(6), 3558–3572. [DOI] [PMC free article] [PubMed] [Google Scholar]
- Yu Y, Akif A, Herman P, Cao M, Rothman DL, Carson RE, Agarwal D, Evans AC, & Hyder F (2023). A 3D atlas of functional human brain energetic connectome based on neuropil distribution. Cerebral Cortex, 33(7), 3996–4012. 10.1093/cercor/bhac322 [DOI] [PMC free article] [PubMed] [Google Scholar]
- Yu Y, Herman P, Rothman DL, Agarwal D, & Hyder F (2018). Evaluating the gray and white matter energy budgets of human brain function. Journal of Cerebral Blood Flow and Metabolism, 38(8), 1339–1353. 10.1177/0271678X17708691 [DOI] [PMC free article] [PubMed] [Google Scholar]
- Zaehle T, Fründ I, Schadow J, Thärig S, Schoenfeld MA, & Herrmann CS (2009). Inter- and intra-individual covariations of hemodynamic and oscillatory gamma responses in the human cortex. Frontiers in Human Neuroscience, 3. 10.3389/neuro.09.008.2009 [DOI] [PMC free article] [PubMed] [Google Scholar]