

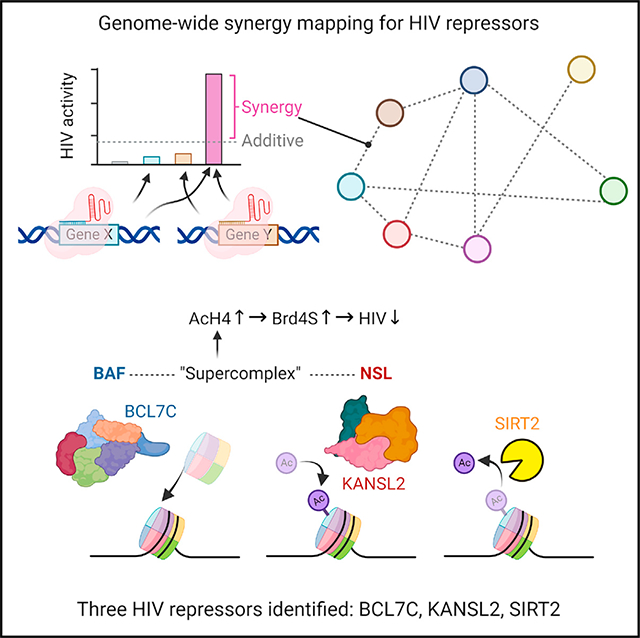
SUMMARY
Host repressors mediate HIV latency, but how they interactively silence the virus remains unclear. Here, we develop “reiterative enrichment and authentication of CRISPRi targets for synergies (REACTS)” to probe the genome for synergies between HIV transcription repressors. Using eight known host repressors as queries, we identify 32 synergies involving eleven repressors, including BCL7C, KANSL2, and SIRT2. Overexpression of these three proteins reduces HIV reactivation in Jurkat T cells and in CD4 T cells from people living with HIV on antiretroviral therapy (ART). We show that the BCL7C-containing BAF complex and the KANSL2-containing NSL complex form a “supercomplex” that increases inhibitory histone acetylation of the HIV long-terminal repeat (LTR) and its occupancy by the short variant of the acetyllysine reader Brd4. Collectively, we provide a validated platform for defining gene synergies genome wide, and the BAF-NSL “supercomplex” represents a potential target for overcoming HIV rebound after ART cessation.
In brief
Li et al. develop a genome-wide screen, REACTS, to identify genes synergistically repressing HIV. They find 32 synergies involving eleven repressors, including BCL7C, KANSL2, and SIRT2. Overexpressing these proteins reduces HIV reactivation in cells. BCL7C and KANSL2 are part of a BAF-NSL “supercomplex” inhibiting HIV via histone acetylation and Brd4S.
Graphical Abstract
INTRODUCTION
Combinations of latency-reversing agents can synergistically activate latent HIV,1–4 suggesting that mechanistically distinct pathways impair HIV transcription. Indeed, recent genome-wide genetic screens have identified specific host genes that regulate latent HIV reactivation.5–11 However, it is largely unclear whether these disparate factors are members of a larger network(s) and whether they regulate the latent HIV reservoir synergistically.
Most pairwise or three-way combinatorial genetic screens in human cells have focused on selected sets of genes rather than interrogating the entire genome12–17 due to the technical challenge of assessing phenotypic effects of thousands of perturbations in parallel, particularly in the setting of high background “noise” characteristic of the HIV long-terminal repeat (LTR).18 To address this challenge, we developed a tool, reiterative enrichment and authentication of CRISPRi targets for synergies (REACTS), that allows large-scale probing of synergistic effects of gene perturbations in human cells and applied it to investigate HIV latency. By identifying combinations of host factors that synergistically regulate the HIV LTR, we may be able to develop more robust approaches for permanent transcriptional silencing of the HIV LTR and a functional cure for HIV-AIDS.
RESULTS
Development of a platform for identification of pairwise genetic interactions
To identify genetic interactions, we developed a two-vector system (Figure 1A) that allows expression of pairwise combinations of single-guide RNAs (sgRNAs). One of the vectors, pQuery, contains a BFP fluorescence marker, while the other, pInput, contains a puromycin resistance marker in addition to BFP. After introducing pQuery, we selected the cells by fluorescence-activated cell sorting (FACS) for BFP expression and then introduced pInput into the sorted cells and selected for growth in the presence of puromycin, thus selecting a population of cells with both sgQuery and sgInput integrated in the genome. Functional testing of the vectors was performed in JiL-2 cells,10 a J-Lat19-like latently infected cell line containing an integrated single-round HIV-d2EGFP reporter virus (wild type tat, rev, env, vpu, and d2EGFP in place of nef20). JiL-2 cells express the dCas9-KRAB fusion protein in a doxycycline (Dox)-inducible manner.10 When pairs of sgRNAs targeting known repressors were inserted into the two vectors and introduced into JiL-2 cells, both targeted genes were downregulated in a Dox-dependent manner (Figure S1A). Importantly, the HIV latency-reversing effect of sgTMEM178A10 was intact when delivered into cells by either the pQuery or pInput vector (Figure S1B).
Figure 1. Development and usage of the REACTS platform for identification of genetic interaction network of host repressors mediating HIV latency.
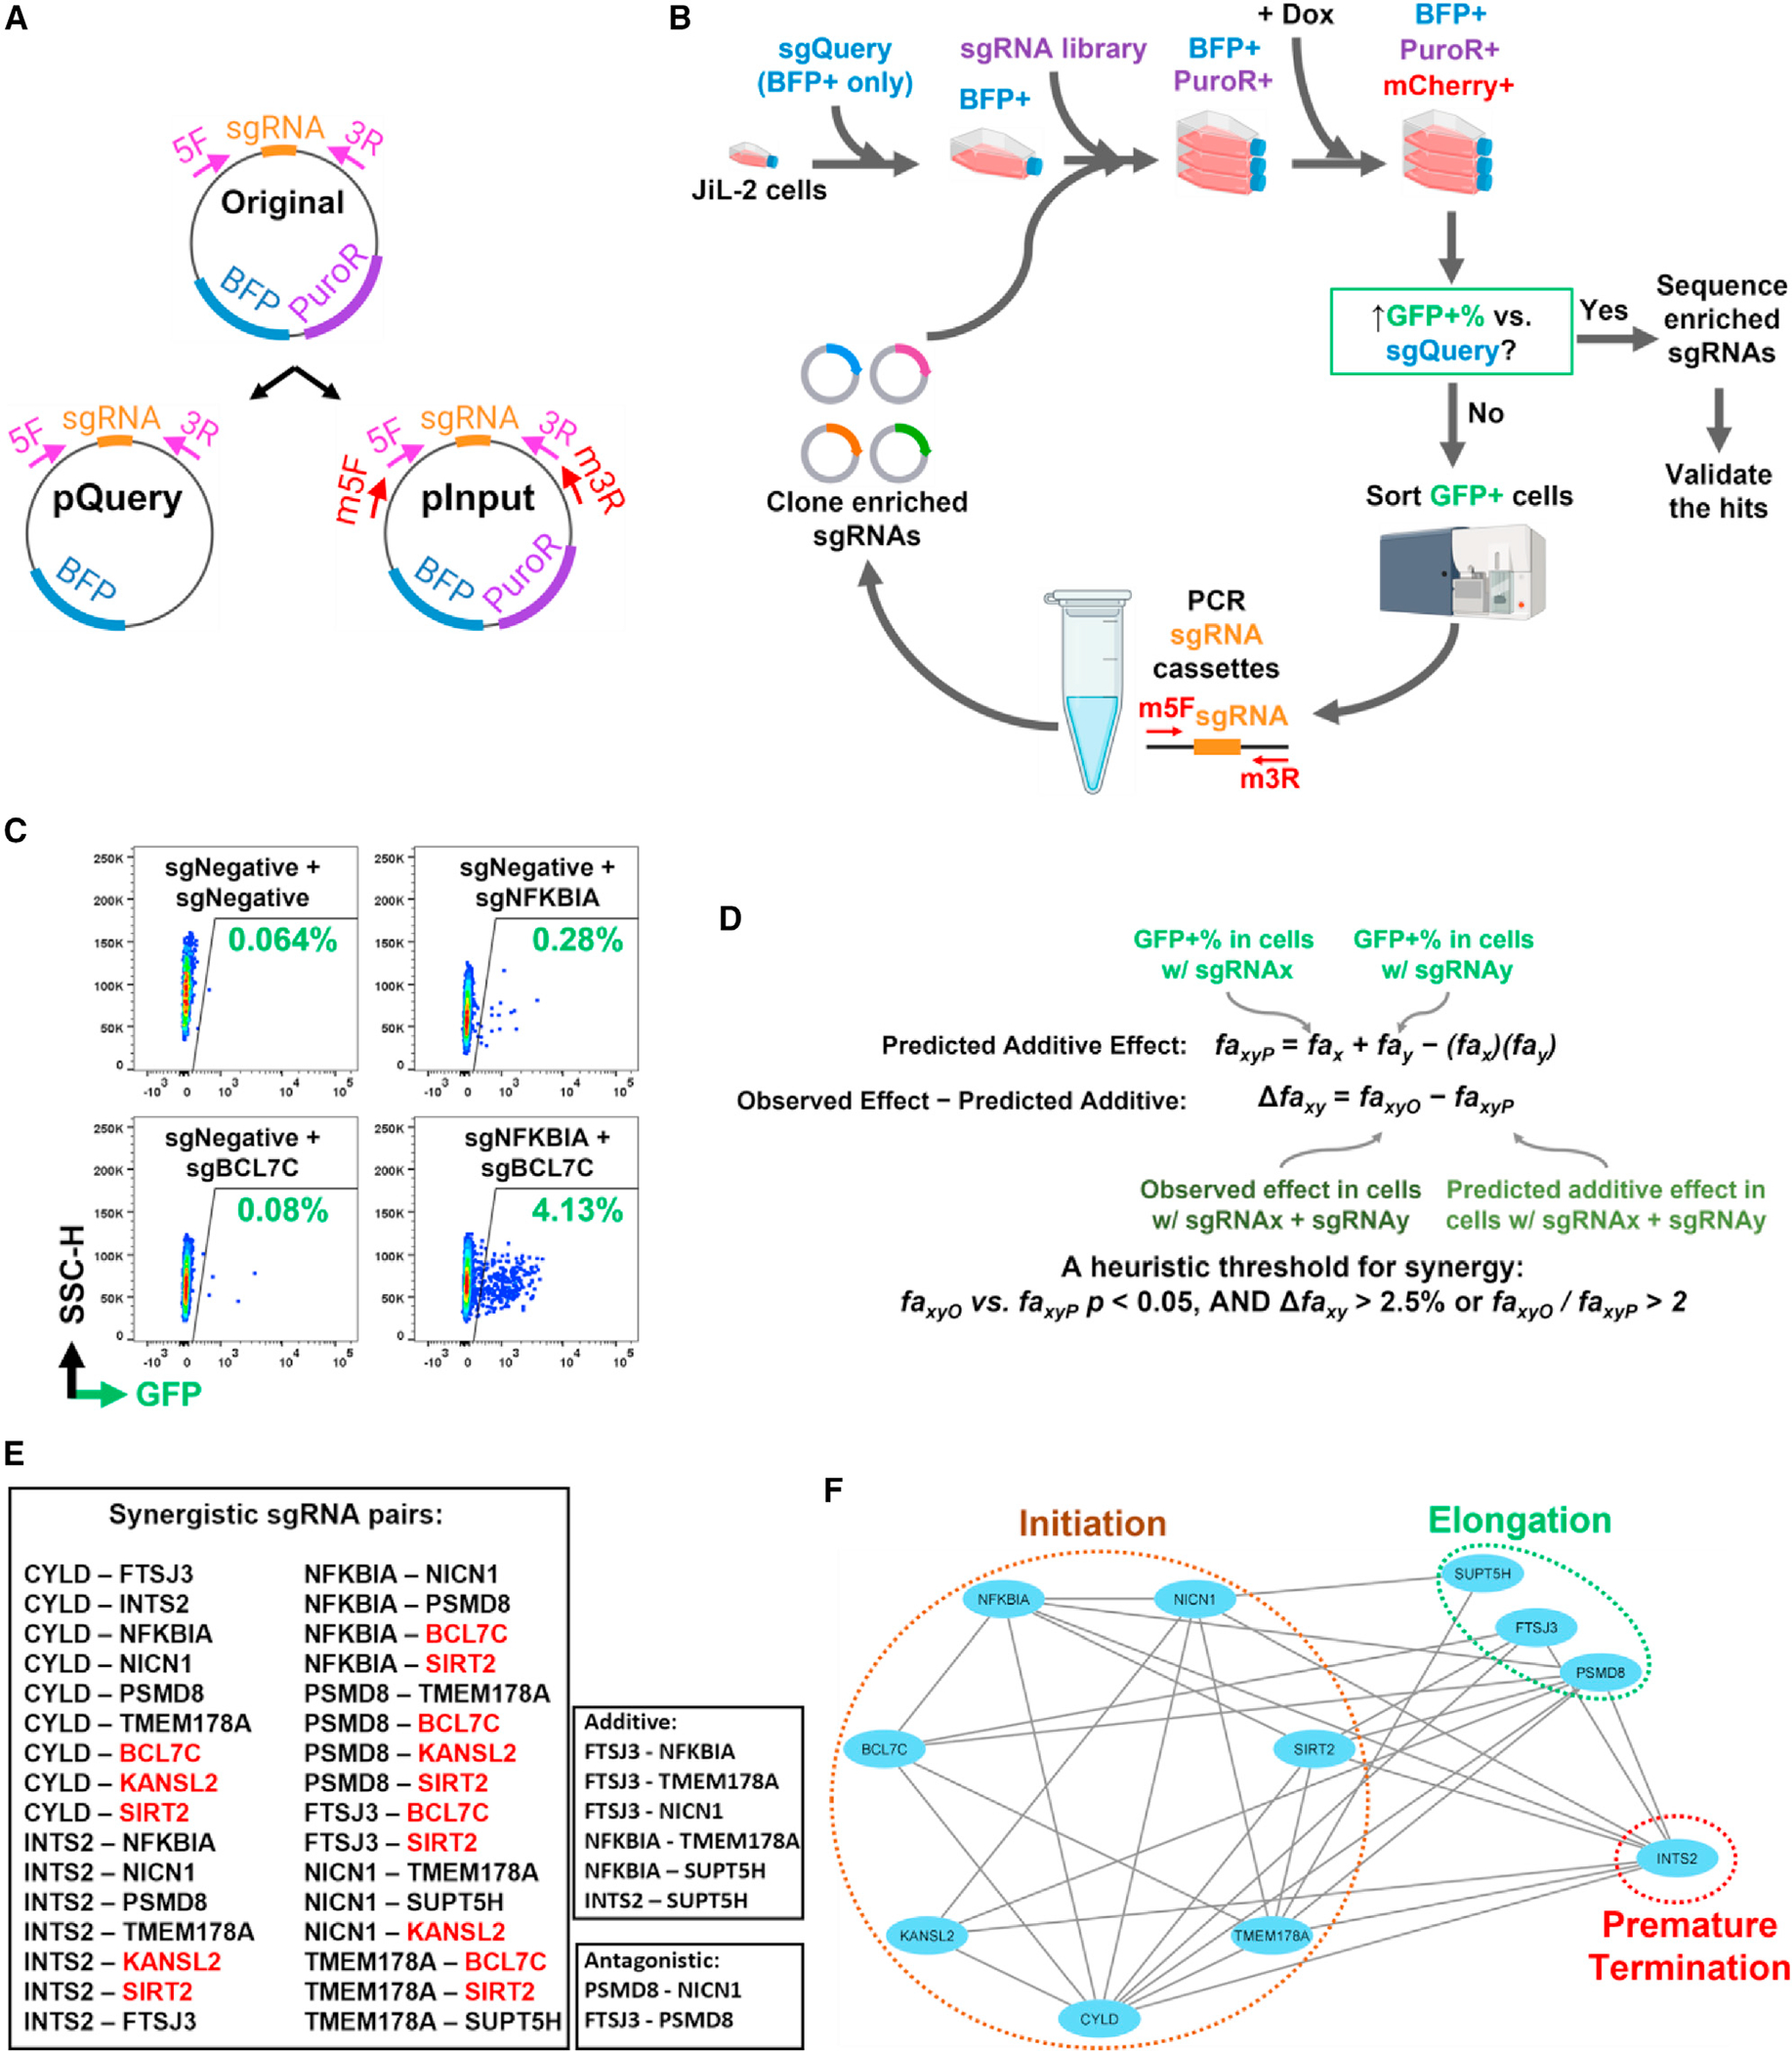
(A) Design of a two-vector system for introducing a pair of sgRNAs into each cell.
(B) A schematic of REACTS to screen the genome for sgRNAs synergizing with eight query sgRNAs targeting known host repressors of latent HIV.
(C) Example primary FACS data of synergy between sgNFKBIA and sgBCL7C.
(D) An overview of the Bliss independence test used to call synergy.
(E) REACTS identified 32 synergistic, 6 additive, and 2 antagonistic pairs of sgRNAs. Red, pairs involving BCL7C, KANSL2, and SIRT2.
(F) A network representing the individually validated synergies identified by REACTS.
Related to Figures S1 and S2 and Tables S1 and S2.
To test for synergies between host repressors of latent HIV reactivation, we introduced two pairs of sgRNAs targeting previously reported host repressors10 (sgTMEM178A + sgNICN1 and sgFTSJ3 + sgINTS2) into JiL-2 cells. Combined knockdown of these two sets of repressors achieved a much higher rate of latency reversal than targeting each host repressor individually (Figure S1D).
To identify more host factors that synergize with known host repressors to control HIV latency, we chose eight sgRNAs (Table S1) targeting top-ranked host repressors that repeatedly appeared in our previous screens5,10 and cloned each into pQuery (Figure 1B). NFKBIA (I0κBα) and CYLD are inhibitors of the nuclear factor κB (NF-κB) pathway that is critical to HIV reactivation.21,22 NICN1 and TMEM178A inhibit HIV reactivation by blocking its transcription initiation.10 PSMD8, FTSJ3, and SUPT5H block HIV transcription elongation.5,10,23 INTS2 blocks HIV reactivation by regulating RNA polymerase II (Pol II) pause/release and inducing premature termination.10,24–26 We reasoned that choosing these factors belonging to a variety of pathways would maximize our chance of obtaining synergies.
We then cloned the CRISPRi-v2 sgRNA library27 into pInput. The screens were performed in a reiterative manner5,10 to specifically amplify the sgRNA cassettes from only pInput but not pQuery and enrich for valid synergy partners for each sgQuery target. For this, we inserted a pair of specific primer binding sites (Table S1) into the pInput flanking its sgRNA cloning site (Figure 1A). Genomic PCR using the m5F and m3R primers (Table S1), which anneal with those primer binding sites, produced distinctive ~450 bp amplicons (Figure S1C), which we re-cloned into the pInput vector to form an enriched library of sgRNA pInput constructs for the next screen. We named this platform REACTS (Figure 1B).
Systematic mapping of genetic interaction networks promoting HIV latency
We conducted REACTS screens for each of the eight sgRNAs and reiterated each screen until the enriched sgRNA library significantly enhanced HIV reactivation compared with the original library (Figure 1B). An example of a synergistic pair, BCL7C and NFKBIA, is shown in Figure 1C. From the deep-sequencing results (Table S2) of each final sgRNA library, we picked the top 12 most enriched input sgRNAs targeting unexpected host repressor genes and checked their synergies with the eight Query sgRNAs by transducing them pairwise into JiL-2 cells. We also assessed synergies among the eight Query sgRNAs by cloning them into either pQuery or pInput. Using the Bliss independence model28 (Figure 1D), we discovered 32 synergistic pairs, 6 additive pairs, and 2 antagonistic pairs among 11 sgRNAs (Figures 1E and S2). A genetic interaction network (Figure 1F) was generated based on synergy data. Based on their annotated functions, the 11 host factors could be grouped into three clusters: NFKBIA, NICN1, SIRT2, TMEM178A, CYLD, KANSL2, and BCL7C are involved in transcription initiation22,29–31; SUPT5H, FTSJ3, and PSMD8 are involved in transcription elongation5,10,32; and INTS2 is involved in premature termination of transcription.26 We observed extensive synergies between sgRNAs targeting factors within different clusters and within the transcription initiation cluster. However, no synergy was observed among sgRNAs targeting factors in the transcription elongation cluster. Notably, three sgRNAs—targeting BCL7C, KANSL2, and SIRT2—exhibited synergistic activity with multiple members of the original eight queries (Figures 1E and 1F).
Overexpression of BCL7C, KANSL2, or SIRT2 reduces reactivation of latent HIV in Jurkat T cells and CD4 T cells from people living with HIV on ART
BCL7C was initially identified as part of the mammalian SWI/SNF (BAF) nucleosome remodeling complex29 and was subsequently found to also interact with PBRM133,34 and GLTSCR134 as components of PBAF35 and GBAF,36,37 respectively. KANSL2 is a key subunit in the chromatin-modifying NSL complex containing the histone acetyltransferase KAT8.30,38 SIRT2 is a protein deacetylase targeting both histones31,39 and non-histone proteins, including α-tubulin.40,41 Overexpression of BCL7C, KANSL2, or SIRT2 in J-Lat A2 cells19 decreased not only spontaneous HIV reactivation but also PMA-induced latency reversal (Figures 2A–2D). Overexpression of these three proteins also significantly reduced PMA and ionomycin-induced HIV reactivation in CD4 T cells isolated from ten individuals living with HIV on suppressive antiretroviral therapy (ART) (Figures 2E and S3). Thus, BCL7C, KANSL2, and SIRT2 are bona fide host repressors of latent HIV reactivation.
Figure 2. Overexpression of BCL7C, KANSL2, and SIRT2 reduces reactivation of latent HIV in Jurkat and primary cells.

(A–D) J-Lat A2 cells nucleofected with plasmids overexpressing indicated proteins were treated with either DMSO or 10 nM PMA and subjected to FACS for percentage of GFP+ cells (A–C) and western blot for indicated proteins (D). Representative FACS plots in the DMSO-treated group is shown in (A), and quantifications of the percentage of GFP+ cells are shown in (B) and (C).
(E) CD4 T cells from 10 individuals living with HIV on ART were nucleofected with plasmid vectors overexpressing indicated proteins and treated with either DMSO or 50 ng/mL (81 nM) PMA and 1 μM ionomycin. HIV-1 RNAs in the cells were quantified with qRT-PCR. The qPCR signal from each drug combination was normalized to the DMSO group for each individual to calculate the fold difference.
Error bars represent mean ± SD from three experimental replicates (B and C) or mean ± SEM from 10 donors’ results (E). *p < 0.05, **p < 0.01, and ***p < 0.001 by two-tailed Student’s t test.
BCL7C and KANSL2 increase histone acetylation and Brd4S occupancy on the HIV promoter
To investigate the mechanisms by which BCL7C, KANSL2, and SIRT2 contribute to silencing HIV, we asked if their knockdown or overexpression induced epigenetic changes on the HIV LTR. FACS after small interfering RNA (siRNA)-mediated knockdowns (Figure 3A) in J-Lat A2 cells demonstrated that, consistent with the sgRNA data (Figure S2), single knockdown of NFKBIA, BCL7C, KANSL2, and SIRT2 had a minimal effect on HIV latency (Figure 3B). In contrast, co-knockdown of NFKBIA with BCL7C or SIRT2, but not with KANSL2, strongly reactivated latent HIV (Figure 3B). Chromatin immunoprecipitation (ChIP) demonstrated that while knocking down NFKBIA increased Pol II loading on the HIV LTR (Figure 3C), it also increased histone H4 acetylation on lysines 5, 8, and 12 (H4K5,8,12Ac) (Figure 3E), with no significant effect on H3K27me3 (Figure 3G) or on H4K16Ac (Figure 3F). Interestingly, when BCL7C or SIRT2 were knocked down together with NFKBIA, H4K5,8,12Ac and H3K27me3 decreased, but H4K16Ac increased (Figures 3E–3G). In contrast, co-knockdown of KANSL2 with NFKBIA failed to induce these changes (Figures 3E–3G), although single knockdown of KANSL2 decreased H4K5,8,12Ac (Figure 3E). Further, knocking down SIRT2 increased lysine 40 acetylation of α-tubulin, consistent with previous reports,40,41 but the effect was less profound than knocking down HDAC6, a major tubulin deacetylase42 (Figures S4A–S4C).
Figure 3. BCL7C and KANSL2 increase histone acetylation and Brd4S on the HIV promoter.

(A–R) J-Lat A2 cells were nucleofected with siRNAs targeting the indicated genes or plasmid vectors expressing the indicated proteins and subjected to ChIP-qPCR using normal rabbit immunoglobulin G (IgG) (for control) or antibodies that specifically recognize the indicated proteins to quantify their occupancy of the Nuc-1 region of HIV LTR. The ChIP-qPCR signals were normalized to input DNA. Error bars represent mean ± SD from three experimental replicates. *p < 0.05, **p < 0.01, and ***p < 0.001 by two-tailed Student’s t test. For (B)–(P), significance tests were conducted between each test group versus the control groups (siNegative or empty vector). For experiments in (B)–(H) and (Q), aliquots of the nucleofected cells were subjected to western blot analyses (A and R, respectively) to determine levels of the indicated proteins.
(S) Models showing the different mechanisms by which BCL7C, KANSL2, and SIRT2 reduce HIV transcription.
Related to Figure S4.
Overexpression of BCL7C, KANSL2, or SIRT2 (Figures 3I–3P, S4D, and S4E) did not induce significant changes in H3K9me3 or H3K27me3 on the HIV LTR (Figures 3K and 3L). In contrast, overexpression of BCL7C and KANSL2 increased histone H4 acetylation (Figure 3N). KANSL2 expression increased H4 acetylation (Figure 3N) despite reducing total histone levels (Figures 3I and 3J). Interestingly, the levels of Brd4 (immunoprecipitated by an antibody targeting its N terminus) on HIV LTR increased when BCL7C and KANSL2 were overexpressed (Figure 3O). Consistent with SIRT2’s role as a histone H4 deacetylase,43 its overexpression decreased histone H4 acetylation (Figure 3N).
Brd4 is expressed in both long and short isoforms (Brd4L and Brd4S) that regulate HIV transcription through different mechanisms.44,45 ChIP assays targeting FLAG-tagged ectopically expressed Brd4L and Brd4S (Figure 3R) demonstrated that upon overexpression of hemagglutinin (HA)-tagged BCL7C and KANSL2, there was an increase in Brd4S occupancy of the HIV LTR (Figure 3Q). Brd4S was previously shown to repress HIV transcription during latency by binding to acetylated histones and recruiting the SWI/SNF complex to increase the loading of nucleosomes on the LTR.43 Thus, the increased levels of Brd4S on HIV LTR may contribute to the reduction of LTR activity induced by BCL7C and KANSL2.
Together, these data indicate that BCL7C, KANSL2, and SIRT2 reduce HIV transcription through distinct mechanisms (Figure 3S). BCL7C increases nucleosome occupancy on LTR, and the incoming nucleosomes, which are high in AcH4, attract Brd4S. KANSL2 hyper-acetylates nucleosomes and decreases their occupancy on LTR. However, the remaining nucleosomes have higher than normal levels of AcH4, which could compensate for the loss of nucleosomal occupancy and would still attract Brd4S. SIRT2-mediated decreases in histone acetylation could promote nucleosome formation on LTR.
A BAF-NSL supercomplex delivers KAT8 to nucleosomes on HIV LTR
Since components of a protein complex often share genetic interaction partners,46,47 and since the sgRNAs targeting BCL7C, KANSL2, and SIRT2 synergize with many of the initial eight queries (Figure 1F), we asked whether these three host repressors themselves form a complex. Using co-immunoprecipitation (coIP) in HEK293 cells, we found that overexpressed FLAG-tagged BCL7C could pull down not only its known interaction partner BRG1 but also KANSL2 and its known interaction partner KAT8. However, no interaction with SIRT2 was detected (Figure 4A). Reciprocally, pulling down FLAG-KANSL2 demonstrated an interaction with BCL7C and BRG1 (Figure 4B). These data suggest that BCL7C and KANSL2 reside in the same complex and raise the possibility that the complexes that BCL7C and KANSL2 are known to be present in may interact to form a supercomplex.
Figure 4. A BAF-NSL supercomplex delivers KAT8 to the nucleosome on HIV LTR.

(A–C) Nuclear extracts (NEs) prepared from HEK293T cells transfected with plasmid vectors expressing indicated proteins were subjected to immunoprecipitation (IP) with anti-FLAG beads (A and B) or sequential IP with anti-FLAG and anti-HA beads (C). The NE and IP eluates were examined by western blot for the indicated proteins.
(D) Jurkat cell nuclear extracts were obtained in 0.15 or 0.3 M KCl and then analyzed by glycerol gradient sedimentation at the corresponding salt concentrations. The indicated proteins in collected fractions were detected by western blot. The dashed box highlights fractions that contain the majority of the BAF-NSL supercomplex in 0.15 M KCl.
(E–L) J-Lat A2 cells were nucleofected with plasmids expressing indicated proteins in combination with siRNAs targeting indicated genes and subjected to ChIP-qPCR assays using control rabbit IgG or specific antibodies to quantify the proteins’ binding to the Nuc-1 region of HIV LTR. The ChIP-qPCR signals were normalized to input DNA. Error bars represent mean ± SD from three experimental replicates. *p < 0.05, **p < 0.01, and ***p < 0.001 by two-tailed Student’s t test. Aliquots of the nucleofected cells were subjected to western blot analysis.
(M) A model showing that by interacting with BAF, the NSL histone acetylation complex hyperacetylates Nuc-1 and increases the recruitment of Brd4S onto HIV LTR.
Related to Figure S4.
To test this hypothesis, we asked which of the three subspecies of SWI/SNF complex that BCL7C is known to participate in—BAF, PBAF, or GBAF29,33,34—interacts with KANSL2. Using coIP to sequentially pull-down FLAG-BCL7C and HA-KANSL2, we obtained a complex that contained ARID1A (a defining subunit of BAF48) and WDR5 (a subunit of NSL38) (Figure 4C). In contrast, PBRM1 (a defining subunit of PBAF35), GLTSCR1 (a defining subunit of GBAF37), and MSL1 (a subunit of MSL49) were not present in the precipitate. These data suggest that BCL7C and KANSL2 belong in a supercomplex that includes BAF and NSL.
Since overexpression of FLAG-/HA-tagged proteins may lead to spurious associations, we confirmed the presence of endogenous BAF-NSL complexes in Jurkat T cells by pulling down endogenous ARID1A and probing the precipitates with antibodies against KANSL2, KAT8, and BCL7C (Figure S4F). To further test the stability of the endogenous BAF-NSL complex, we conducted the coIPs in buffers containing increasing KCl concentrations (from 0.15 to 0.35 M). While BCL7C remained stably bound to ARID1A up to 0.3 M KCl (a decrease in the signal was detected at 0.35 M KCl), the binding of KANSL2 and KAT8 to ARID1A was significantly weakened by 0.25 M KCl and largely abolished by 0.3 M KCl (Figure S4F), revealing the salt-sensitive nature of BAF-NSL association.
We further confirmed the association of BAF with NSL by a glycerol gradient analysis. The destruction of the BAF-NSL supercomplex by 0.3 M KCl caused all KANSL2 and KAT8 present in fractions 16–18, which sedimented with ARID1A and BCL7C in the lower half of the gradient reflecting the BAF-NSL supercomplex, to migrate toward the top of the gradient, corresponding to smaller-sized NSL complexes (Figure 4D). KCl-induced disruption of BAF-NSL also caused some BCL7C and ARID1A to shift from fractions 16–18 to fractions 13–15, a likely result of the release of NSL. In contrast, KCl did not discernably change the positions of KANSL2 and KAT8 in fractions 8–10, suggesting that the KANSL2 and KAT8 interaction in the NSL complex was strong enough to withstand the higher salt concentrations. Taken together, these data indicate that in Jurkat T cells, BAF, and NSL form a modular supercomplex maintained by salt-sensitive interactions.
Within the BAF-NSL complex, BAF is known to inhibit HIV transcription by positioning a nucleosome (Nuc-1) downstream of the transcription start site.50 Thus, the increased histone acetylation induced by this complex (Figure 3N) may be mediated by KAT8, the histone acetyltransferase subunit of NSL. Indeed, overexpression of BCL7C increased the levels of KAT8 occupancy of the HIV LTR, and this increase was abolished by siRNA knockdown of KANSL2 (Figures 4E and 4F). Conversely, overexpression of KANSL2 increased BRG1 and ARID1A occupancy on the HIV LTR, and these increases were abolished by siRNA knockdown of BCL7C (Figures 4G–4I), indicating that the loading of the BAF-NSL supercomplex on HIV LTR depends on the integrity of both BAF and NSL. Finally, underlining the importance of KAT8, knocking it down abolished the increased occupancy of AcH4 and Brd4S on HIV LTR induced by overexpression of BCL7C or KANSL2 (Figures 4J–4L).
Taken together, these results identify three host repressors of HIV reactivation and indicate that two of them cooperate as part of an NSL-BAF supercomplex to acetylate the incoming Nuc-1 on HIV LTR loaded by BAF (Figure 4M). In turn, hyper-acetylated Nuc-1 attracts Brd4S (Figures 3N, 3O, 3Q, 3R, and 4J–4L), which may recruit more BAF45 to further stabilize Nuc-1 on the LTR to inhibit HIV transcription.
DISCUSSION
Here, we describe REACTS, a platform to derive comprehensive and unbiased collections of validated gene pairs that synergize to modulate biological functions. REACTS overcomes two major difficulties for genome-wide screens in human cells: weak phenotypes due to incomplete knockdown and inherently noisy phenotypes, such as reactivation of latent HIV.18 The reiterative nature of REACTS (Figure 1B) progressively enriches genotypes that underlie even relatively weak or noisy phenotypes, allowing unambiguous identification of hits from genome-wide libraries.
As demonstrated by recent transcriptome studies,51–53 different sets of cellular genes are associated with either latent or active HIV infection. Orthogonal to these forward-genetics studies, here, we used a reverse-genetics approach to investigate host gene functions in a multiplexed fashion and establish causal relationships between gene networks and HIV proviral activity. Among the 32 synergic pairs we identified, the majority are between different functional clusters: 11 are between transcription initiation and elongation, 6 are between initiation and termination, and 2 are between elongation and termination (Figure 1F). Similar synergies were observed in previous drug-based studies.2–5,43 These observations highlight the importance of simultaneously targeting multiple stages of HIV transcription to control viral rebound.
KAT8 participates in MSL and NSL complexes.44,45 While KAT8 in MSL is responsible for maintaining global H4K16Ac levels,49,54 subunits of NSL broaden KAT8’s activity toward other histone residues, including K5, K8, and K12 of histone H4,55,56 whose poly-acetylation attracts Brd4 to chromatin.57,58 Currently, it is unclear why Brd4S occupancy is preferentially increased over Brd4L on Nuc-1 following overexpression of BCL7C or KANSL2 (Figure 3Q). However, Brd4L and Brd4S have different protein interaction profiles59 that may differentially regulate their histone-binding behaviors. Of note, while H4K16Ac promotes cellular and HIV transcription,7,60 H4K5Ac and H4K12Ac are involved in transcriptional silencing and heterochromatin formation.61–63 Thus, in addition to the Brd4S-BAF axis (Figure 4M), the increased AcH4, particularly H4K5Ac and H4K12Ac, may trigger other heterochromatin pathways61,62 on HIV LTR. Given KAT8’s pleiotropic functions,64–66 our discovery of NSL’s role in maintaining HIV latency provides a potentially more specific way to regulate HIV expression by targeting a subset of KAT8-containing complexes.
Hsiao and Frouard et al. recently reported that interleukin-7 (IL-7) receptor-alpha (CD127) memory CD4 T cells from tonsil tissue preferentially support latent HIV-1 infection.53 In their RNA sequencing (RNA-seq) data, BCL7A (subunit of BAF) and KANSL1 and KAT8 (subunits of NSL) were preferentially expressed in the CD127+ tissue memory CD4 T cells relative to the CD57− CD127− cells that support active HIV replication. These results suggest that the mechanisms that maintain HIV-1 latency may be partially conserved between CD4 T cells in blood and lymphoid tissues and that the BAF-NSL supercomplex may contribute to the propensity of CD127+ cells to undergo latent HIV-1 infection.
Another host repressor identified in this study is SIRT2, a protein deacetylase that targets both tubulin and other proteins.67 Recent studies revealed that SIRT2 deacetylates and represses several enhancers of HIV transcription: NFAT,68 p65,69 and GSK3b.70 Thus, inhibition of multiple pathways involving these factors may contribute to the SIRT2-induced HIV silencing and Nuc-1 deacetylation observed in this study.
Limitations of the study
First, we did the REACTS screens in JiL-2 cells due to their low to-moderate HIV inducibility10 allowing us to exert adequate selection pressure and to obtain sufficient GFP+ cells. We anticipate that screening in primary CD4 T cells and microglia may reveal more HIV repressors. Second, our screens were conducted in uninduced conditions when some host repressors such as ZNF304 were not sufficiently expressed.9,71 In the future, broad mapping of both core and condition-specific host repressors promises to accelerate the field of HIV cure research, providing a rational understanding of the requirements for permanent silencing of latent HIV.
STAR★METHODS
RESOURCE AVAILABILITY
Lead contact
Further information and requests for resources and reagents should be directed to and will be fulfilled by the lead contact, Zichong Li (zichong.li@gladstone.ucsf.edu).
Materials availability
Newly generated items in the study are available on request from the lead contact with a completed materials transfer agreement.
Data and code availability
All additional experimental data reported in this paper will be shared by the lead contact upon request.
This paper does not report original code.
Any additional information required to reanalyze the data reported in this work paper is available from the lead contact upon request.
EXPERIMENTAL MODEL AND STUDY PARTICIPANT DETAILS
Cell lines
We cultured HEK 293T cells (American Type Culture Collection [ATCC]) in DMEM medium (10–013-CV), and Jurkat-derived cells in RPMI medium (Corning 10–040-CV) in a 5% CO2 humidified incubator at 37°C. Both mediums were supplemented with 10% fetal bovine serum (FBS, Avantor 89510–186) and 100 units/mL penicillin and 100 μg/mL of streptomycin (Corning 30–002-Cl). For HEK 293T cells, we split them by either 1:10 or 1:5 whenever the cell density reached 90%. For Jurkat-derived cells, we constantly maintain the cell density at 0.1 million to 0.8 million per mL.
Human samples
The part of this study utilizing specimens from people living with HIV was approved by the UCSF Committee on Human Research. All research participants were recruited from the UCSF SCOPE and PENNVAX cohorts after obtaining written informed consent, and all subject data and specimens were coded to protect confidentiality. All participants were adults and met strict selection criteria and had well-documented persistent viral suppression (Table S3). The age and gender of all human subjects can be found in Table S3.
Primary cell cultures
Frozen peripheral blood mononuclear cells obtained from UCSF SCOPE and PENNVAX cohorts were thawed and re-suspended in RPMI medium and subjected to CD4 T cell isolation as described below. The CD4 T cells were cultured in RPMI medium supplemented with 10% FBS and 100 units/mL penicillin and 100 μg/mL of streptomycin in a 5% CO2 humidified incubator at 37°C.
METHOD DETAILS
Development of a two-vector system for identification of pairwise genetic interactions
To introduce pairs of sgRNAs, we constructed two plasmid vectors, pQuery and pInput, based on the original sgRNA vector “pU6-sgRNA EF1α-puro-T2A-BFP” (Addgene Plasmid #60955).72 The pQuery vector was constructed by deleting the original vector’s puromycin-resistance cassette. The pInput vector was constructed by inserting a pair of specific primer binding sites that anneal with the m5F and m3R primers (Figure 1A; Table S1) into the original vector flanking the sgRNA cloning site. After sequencing and functional verifications of the two vectors, we ligated a random 200bp stuffer sequence into both vectors’ sgRNA cloning site (between the BstXI and Bpu1102I digestion sites). Digestion by these two enzymes removes the stuffer sequence and readies the vector for ligating with sgRNA cassettes digested with the same enzymes.
Using 5F and 3R primers (Table S1), we re-cloned sgRNA cassettes of the CRISPRi-v2 library27 from its original vector into pInput, and verified sgRNA representations using deep sequencing.
Reiterative Enrichment and Authentication of CRISPRi Targets for Synergies (REACTS) in JiL-2 cells
To start REACTS analysis for each of the 8 known host repressors, sgRNA targeting a known repressor (Table S1) was ligated into pQuery, packaged in HEK 293T cells using a 3rd generation lentiviral packaging system,75 and transduced into JiL-2 cells (previously generated by Dr. Warner Greene’s laboratory10). The transduced cells were selected using fluorescence-activated cell sorting (FACS) to enrich BFP-positive cells. The CRISPRi-v2 library27 that had been cloned into pInput was similarly packaged, transduced into the sorted JiL-2 cells, and transduced cells were selected by 1 μg/mL puromycin to generate a pool of cells in which each contained integrated sgQuery and sgInput cassettes (on average, one each), and each individual sgInput occupied ~1000 cells. After treating with 1 μg/mL Dox for three days, ~3×10⁸ cells were selected by FACS for the GFP/mCherry/BFP triple-positive phenotype (yield typically ~106).
As previously described,5 using m5F and m3R primers (Table S1) (as opposed to the original 5F/3R primers5), the sgInput cassettes were amplified from the sorted cells, and re-cloned into pInput to generate an enriched sgRNA library. The screens were iterated in JiL-2 cells until the enriched sgRNA library significantly enhanced HIV reactivation (compared with the original library). sgRNA sequences were then deep-sequenced from the enriched library and analyzed as previously described.5 The most-enriched sgRNAs that were not observed in previous screens5,10 were individually cloned into pInput, and their latency-reversing effects and synergies with other sgRNAs independently assessed.
Validation of synergies between sgRNAs targeting host repressors
The top 12 most enriched Input sgRNAs targeting genes that were not within the known HIV transcription regulation pathways were selected, and assessed for their synergies with the 8 Query sgRNAs by transducing them pairwise into JiL-2 cells as described in the previous section. The synergies between the 8 Query sgRNAs were also measured after cloning them into either pQuery or pInput. In the experiment for each pair of sgRNAs X and Y, the HIV latency reversing effect of three groups of sgRNA combinations were tested: sgNegative + sgRNA_X, sgNegative + sgRNA_Y, and sgRNA_X + sgRNA_Y. According to the Bliss independence model,28 the observed three experimental replicates of GFP% of the first two combinations were used to calculate the predicted additive effects, using this equation: GFP%(P) = GFP%(X) + GFP%(Y) − GFP%(X) × GFP%(Y). The observed three experimental replicates of GFP%(X + Y) were then compared with the three predicted GFP%(P): ΔGFP%(X,Y) = GFP%(X + Y) − GFP%(P). A heuristic threshold was used to call synergy: the two-tailed Student’s t-test p < 0.05 between GFP%(X + Y) and GFP%(P), and: ΔGFP%(X,Y) > 2.5% or GFP%(X + Y)/GFP%(P) > 2. The sgRNAs that synergize with multiple of the 8 Query sgRNAs were mapped into a network using Cytoscape. The quantifications of FACS data of synergistic, additive, and antagonistic sgRNA pairs were included in Figure S3.
Cloning cDNAs for overexpression
The cDNA clones were purchased from Addgene for SIRT2 (#102623),73 and from DNASU Plasmid Repository for BCL7C (HsCD00358060) and KANSL2 (HsCD00784830). The cDNAs were then cloned (using the HindIII and NotI restriction digestion sites) into pcDNA3 vectors with either an N-terminal FLAG tag or an N-terminal HA tag (“pFLAGcDNA3” or “pHAcDNA3”, previously generated by Dr. Nanhai He and used in Dr. Qiang Zhou’s laboratory74) using the primers listed in Table S1. NEB 5-alpha competent E. coli (NEB C2987H) were used in all cloning operations. All constructs were verified by Sanger sequencing.
Nucleofection in Jurkat and primary CD4 T cells
The following siRNAs were purchased from Thermo Fisher: siNegative (4390843), siBCL7C (s17730), siKANSL2 (s29791), siSIRT2 (s22706), siNFKBIA (s9510), siKAT8 (s38569), and siHDAC6 (s19459). A 4D-Nucleofector X Unit (Lonza AAF-1002X) was used for all experiments. For every 106 Jurkat cells, 2 μg plasmid DNA or 15 pmol siRNA +1 μg plasmid DNA were introduced using SE Cell Line 4D-Nucleofector X Kit L (Lonza V4XC-1024) according to the manufacturer’s protocol (program CL-120). Two days after nucleofection, 106 cells were subjected to flow cytometry and Western blot assays, and 3 × 10⁶ cells were subjected to ChIP assays as described below.
For every 107 Primary CD4 T cells, 5 μg plasmid DNA were introduced using P3 Primary Cell 4D-Nucleofector X Kit L (Lonza V4XP-3024) according to the manufacturer’s protocol (program E0–115). In two donors (#4 & #6), when there were enough cells, nucleofections were duplicated with a small amount (0.5 μg) of GFPmax vector (coming with the nucleofection kit) added into the duplicated nucleofection reactions, and the nucleofection efficiency was measured by GFP-FACS and Western blot. Two days after nucleofection, half of the cells were harvested for RNA extraction, while the other half were activated by 1 μg/mL anti-CD28 antibody (BD Biosciences 555725) in 6-well plates coated with anti-CD3 antibody (BD Biosciences 555336) for 1 day and then harvested.
Chromatin immunoprecipitation (ChIP) assay
J-Lat A2 cells were fixed with 1% formaldehyde for 10 min at room temperature, and ChIP assays were performed using the ChIP-IT Express Enzymatic kit (Active Motif 53009) according to the manufacturer’s protocol. For each ChIP reaction, 2 μg of the following antibodies were used: control rabbit IgG (Bethyl P120–101), rabbit anti-H3 (Invitrogen PA5–31954), rabbit anti-H4 (Invitrogen 720166), rabbit anti-H3K9me3 (Active Motif 39765), rabbit anti-H3K27me3 (Active Motif 39155), rabbit anti-Ac-H3 (Millipore 06–599), rabbit anti-Ac-H4 (Millipore 06–598), rabbit-anti-H4K5,8,12Ac (Invitrogen pa5–40083), mouse-anti-H4K16Ac (Invitrogen MA5–27794), rabbit anti-Brd4 (Thermo Fisher 702448), mouse anti-FLAG (Sigma F1804), rabbit anti-KAT8 (Active Motif 61245), rabbit anti-BRG1 (Cell Signaling 49360), and rabbit anti-ARID1A (Cell Signaling 12354). qPCR was performed with the primers listed in Table S1. Signals obtained by qPCR were normalized to those of input DNA, and the averages from triplicate qPCR reactions were used to generate standard deviation depicted by error bars. Two-tailed Student’s t-tests were conducted, and the different significance levels were marked by 1–3 asterisks (*: p < 0.05, **: p < 0.01, and ***: p < 0.001).
Reverse transcription and quantitative PCR (qRT-PCR) assay
Total cellular RNAs were extracted by using TRIzol Reagent (Thermo Fisher 15596018) and reverse transcribed by M-MLV Reverse Transcriptase (Promega M1701) with random primers (Thermo Fisher 48190011). The cDNAs were then subjected to qPCR using DyNAmo HS SYBR Green qPCR kit (Thermo Fisher F410L) on a CFX384 system (Bio-Rad) with the primer pairs listed in Table S1. All reactions were carried out in triplicates. The PCR signals were normalized to those of β-actin and displayed as bar graphs or scatterplots with error bars representing standard deviation (for linear graphs) or standard error of the mean (for log graphs).
Co-immunoprecipitation (Co-IP) followed by western blotting
Approximately 4 × 10⁷ HEK 293T cells (from American Type Culture Collection) in two 150-mm dishes were transfected by plasmids (20 μg/dish) expressing FLAG-tagged BCL7C, KANSL2, or nothing. The following operations were all carried out at 4°C or on ice unless stated otherwise. Two days after transfection, the cells were harvested and swollen in 10 mL hypotonic buffer A [10 mM HEPES-KOH (pH 7.9), 1.5 mM MgCl2 and 10 mM KCl] for 5 min and then centrifuged at 362 g for 5 min. The cells were then disrupted by grinding 20 times with a Dounce tissue homogenizer (Fisher K885300–0007) in 5 mL buffer A, followed by centrifugation at 3,220 g for 10 min to collect the nuclei and estimate the pellet’s volume in a 15 mL Falcon tube. The nuclei were then extracted with an approximately equal volume of hypertonic buffer C [20 mM HEPES-KOH (pH 7.9), 0.3 M NaCl, 25% glycerol, 0.2 mM EDTA, 1.5 mM MgCl2, 0.4% NP-40, 1 mM dithiothreitol and 1 × protease inhibitor cocktail (Sigma P8340)] for 30 min and then centrifuged at 20,800 g for 10 min. The supernatant (nuclear extracts or NE) was mixed with 15 μL of anti-FLAG agarose (Sigma A2220) and rotated at 4C overnight. After being washed three times with 1 mL buffer D [20 mM HEPES-KOH (pH 7.9), 0.15 M KCl, 15% glycerol, 0.2 mM EDTA and 0.4% NP-40], the beads were eluted with 30 μL 0.1 M glycine-HCl (pH 2.0) at room temperature for 15 min. For Western blot, 2% of the NE input and 50% of the IP eluate from each group were loaded into each NE and IP lane, respectively.
For salt-gradient IP targeting endogenous ARID1A, J-Lat A2 cells were subjected to nuclear extraction as described above to achieve a final NaCl concentration of 0.15 M. Per 400 μL NE, 5 μg rabbit-anti-ARID1A antibody (Abcam ab272905) or the same amount of control rabbit IgG (Bethyl P120–101) was added and rotated at 4°C for 1 h, and then mixed with 15 μL Protein A agarose (Invitrogen 15918–014) rotating at 4°C overnight. Then each IP reaction was washed three times with buffer D containing 0.15 M, 0.25 M, 0.3 M, or 0.35 M KCl, and eluted as described above.
For sequential IP, 6 × 10⁸ HEK 293T cells in 60 150-mm dishes were co-transfected with plasmids (10 μg/each cDNA/dish) expressing FLAG-tagged BCL7C and HA-tagged KANSL2. Two days after transfection, the cells were harvested and swollen in 150 mL buffer A, the nuclei were extracted in 6 mL buffer C, and 225 μL of anti-FLAG agarose were used for the first round IP, which were then eluted by 400 μL 100 μg/mL 3× FLAG peptide (Thermo Fisher A36805) diluted in Buffer C containing 0.15 M NaCl. The eluate was then subjected to the second round IP conducted as the single round IP described above using anti-HA agarose (Sigma A2095). The control group used the same number of non-transfected HEK 293T cells and subjected to the first round IP as described above. For Western blot, 2% of the NE input, 2% of the FLAG IP eluate, and 50% of the HA IP eluate from each group were loaded into each NE and IP lane, respectively.
Primary antibodies used for western blots were mouse anti-FLAG (Sigma F1804), mouse anti-α-Tubulin (Sigma CP06–100UG), mouse-anti-a-Tubulin-acetyl K40 (Abcam ab24610), rabbit anti-BCL7C (Abcam ab126944); rabbit anti-KANSL2 (Abcam ab150848); rabbit anti-SIRT2 (Abcam ab211033), rabbit anti-BRG1 (Cell Signaling 49360), rabbit anti-KAT8 (Cell Signaling 46862), rabbit anti-ARID1A (Abcam ab272905), rabbit anti-PBRM1 (Cell Signaling 89123), rabbit anti-GLTSCR1 (Cell Signaling 45441), rabbit anti-MSL1 (Santa Cruz sc-514649), and rabbit anti-WDR5 (Bethyl A302–430A). Secondary antibodies used for western blots were goat anti-mouse-680 nm (Thermo Fisher A-21057), and goat anti-rabbit-680 nm (Thermo Fisher A-21076). For endogenous proteins except α-Tubulin, the primary antibodies were diluted to 1 μg/mL, for FLAG tag and α-Tubulin, the primary antibodies were diluted 5,000-fold. Secondary antibodies were diluted 10,000-fold.
Glycerol gradient analysis
Glycerol gradients (10–30%) were established in modified buffer D [20 mM HEPES-KOH (pH 7.9), 0.15 M or 0.3 M KCl, 0.2 mM EDTA, 0.1% NP-40] in 13.2 mL 14 × 89 mm tubes (Beckman 344059). J-Lat A2 cells were subjected to nuclear extraction using the modified buffer D with KCl at final concentrations of either 0.15 M or 0.3 M. The NEs were loaded over the top of the preformed glycerol gradients, and then fractionated at 4°C by centrifugation in an SW 41Ti rotor (Beckman) at 35,000 rpm for 20 h. Fractions were collected, precipitated with trichloroacetic acid, and analyzed by Western blot with the appropriate antibodies.
QUANTIFICATION AND STATISTICAL ANALYSIS
For experiments using cell lines, three aliquots of the same cells were treated in parallel for each experimental group. For experiments using primary CD4 T cells, cells from 10 different donors were used as biological repeats. For flow cytometry experiments, The GFP-free cells were run in parallel with samples to determine the GFP+ threshold. For qRT-PCR, three replicate qPCR reactions were carried out for each sample.
Average from the experimental replicates were reported, with error bars representing mean +/− standard deviation (SD) from the experimental replicates. When log-values were used in the graph, mean +/− standard error of the mean (SEM) were reported. Two-tailed Student’s t-tests were conducted to examine statistical significance. The sample sizes, statistical tests, and p values are indicated in the figures and the figure legends. Asterisks denote levels of statistical significance: *: p < 0.05, **: p < 0.01, and ***: p < 0.001.
Supplementary Material
KEY RESOURCES TABLE.
| REAGENT or RESOURCE | SOURCE | IDENTIFIER |
|---|---|---|
|
| ||
| Antibodies | ||
|
| ||
| control rabbit IgG | Bethyl | P120-101; RRID:AB_479829 |
| rabbit anti-H3 | Invitrogen | PA5-31954; RRID:AB_2549427 |
| rabbit anti-H4 | Invitrogen | 720166; RRID:AB_2608369 |
| rabbit anti-H3K9me3 | Active Motif | 39765; RRID:AB_2793334 |
| rabbit anti-H3K27me3 | Active Motif | 39155; RRID:AB_2561020 |
| rabbit anti-Ac-H3 | Millipore | 06-599; RRID:AB_2115283 |
| rabbit anti-Ac-H4 | Millipore | 06-598; RRID:AB_2295074 |
| rabbit-anti-H4K5,8,12Ac | Invitrogen | pa5-40083; RRID:AB_2608361 |
| mouse-anti-H4K16Ac | Invitrogen | MA5-27794; RRID:AB_2735098 |
| rabbit anti-Brd4 | Thermo Fisher | 702448; RRID:AB_2688043 |
| mouse anti-FLAG | Sigma | F1804; RRID:AB_262044 |
| rabbit anti-KAT8 | Active Motif | 61245; RRID:AB_2793566 |
| rabbit anti-KAT8 | Cell Signaling | 46862; RRID:AB_2799311 |
| rabbit anti-BRG1 | Cell Signaling | 49360; RRID:AB_2728743 |
| rabbit anti-ARID1A | Cell Signaling | 12354; RRID:AB_2637010 |
| rabbit anti-ARID1A | Abcam | ab272905 |
| mouse anti-α-Tubulin | Sigma | CP06-100UG; RRID:AB_2617116 |
| mouse-anti-a-Tubulin-acetyl K40 | Abcam | ab24610; RRID:AB_448182 |
| rabbit anti-BCL7C | Abcam | ab126944; RRID:AB_11129492 |
| rabbit anti-KANSL2 | Abcam | ab150848 |
| rabbit anti-SIRT2 | Abcam | ab211033; RRID:AB_2927614 |
| rabbit anti-PBRM1 | Cell Signaling | 89123; RRID:AB_2936366 |
| rabbit anti-GLTSCR1 | Cell Signaling | 45441 |
| rabbit anti-MSL1 | Santa Cruz | sc-514649 |
| rabbit anti-WDR5 | Bethyl | A302-430A; RRID:AB_1944300 |
| rabbit anti-HDAC6 | Bethyl | A301-342A; RRID:AB_937899 |
| mouse anti-NFKBIA | Santa Cruz | sc-1643; RRID:AB_627772 |
| goat anti-mouse secondary antibody 680 nm | Thermo Fisher | A-21057; RRID:AB_141436 |
| goat anti-rabbit secondary antibody 680 nm | Thermo Fisher | A-21076; RRID:AB_2535736 |
| anti-CD28 antibody | BD Biosciences | 555725; RRID:AB_396068 |
| anti-CD3 antibody | BD Biosciences | 555336; RRID:AB_395742 |
|
| ||
| Bacterial and virus strains | ||
|
| ||
| NEB 5-alpha competent E. coli | New England Biolabs | C2987H |
|
| ||
| Biological samples | ||
|
| ||
| peripheral blood mononuclear cells (PBMCs) from people living with HIV | University of California San Francisco (UCSF) | SCOPE and PENNVAX cohorts |
|
| ||
| Chemicals, peptides, and recombinant proteins | ||
|
| ||
| Puromycin dihydrochloride from Streptomyces alboniger | Sigma | P8833 |
| FastDigest BstXI | Thermo Fisher | FD1024 |
| FastDigest Bpu1102I | Thermo Fisher | FD0094 |
| FastDigest HindIII | Thermo Fisher | FD0505 |
| FastDigest NotI | Thermo Fisher | FD0593 |
| Doxycycline hyclate | Sigma | D5207 |
| T4 DNA Ligase (1 U/μL) | Thermo Fisher | 15224025 |
| Herculase II Fusion DNA Polymerases | Agilent | 600677 |
| TRIzol Reagent | Thermo Fisher | 15596018 |
| protease inhibitor cocktail | Sigma | P8340 |
| anti-FLAG agarose | Sigma | A2220 |
| anti-HA agarose | Sigma | A2095 |
| Protein A agarose | Invitrogen | 15918–014 |
| 3× FLAG peptide | Thermo Fisher | A36805 |
| siRNA Negative control | Thermo Fisher | 4390843 |
| siRNA targeting human BCL7C | Thermo Fisher | s17730 |
| siRNA targeting human KANSL2 | Thermo Fisher | s29791 |
| siRNA targeting human SIRT2 | Thermo Fisher | s22706 |
| siRNA targeting human NFKBIA | Thermo Fisher | s9510 |
| siRNA targeting human KAT8 | Thermo Fisher | s38569 |
| siRNA targeting human HDAC6 | Thermo Fisher | s19459 |
| SE Cell Line 4D-Nucleofector X Kit L | Lonza | V4XC-1024 |
| P3 Primary Cell 4D-Nucleofector X Kit L | Lonza | V4XP-3024 |
| random primers | Thermo Fisher | 48190011 |
| M-MLV Reverse Transcriptase | Promega | M1701 |
|
| ||
| Critical commercial assays | ||
|
| ||
| DyNAmo HS SYBR Green qPCR kit | Thermo Fisher | F410L |
| ChIP-IT Express Enzymatic kit | Active Motif | 53009 |
|
| ||
| Deposited data | ||
|
| ||
| Original fold of enrichment data from REACTS screens | This paper | Table S2 |
|
| ||
| Experimental models: Cell lines | ||
|
| ||
| HEK 293T cells | ATCC | CRL-3216 |
| JiL-2 cells | Li et al.10 | N/A |
| JiL-1 cells | Li et al.10 | N/A |
| J-Lat A2 cells | Jordan et al.19 | N/A |
|
| ||
| Oligonucleotides | ||
|
| ||
| Table S1: List of DNA oligonucleotides used in this study | N/A | N/A |
|
| ||
| Recombinant DNA | ||
|
| ||
| Human Genome-wide CRISPRi-v2 library top 5 sgRNAs/gene | Horlbeck et al.27 | Addgene 83969 |
| pU6-sgRNA EF1Alpha-puro-T2A-BFP | Gilbert et al.72 | Addgene 60955 |
| pQuery | This paper | N/A |
| pInput | This paper | N/A |
| CRISPRi-v2 library top 5 sgRNAs/gene in pInput | This paper | N/A |
| pCMV4a-SIRT2-Flag | Jing et al.73 | Addgene102623 |
| BCL7C (H. sapiens) in pANT7_cGST | DNASU Repository | HsCD00358060 |
| KANSL2 (H. sapiens) in pANT7_cGST | DNASU Repository | HsCD00784830 |
| pFLAGcDNA3 | He et al.74 | N/A |
| pHAcDNA3 | He et al.74 | N/A |
| pFLAGcDNA3-BCL7C | This paper | N/A |
| pHAcDNA3-BCL7C | This paper | N/A |
| pFLAGcDNA3-KANSL2 | This paper | N/A |
| pHAcDNA3-KANSL2 | This paper | N/A |
| pFLAGcDNA3-SIRT2 | This paper | N/A |
|
| ||
| Software and algorithms | ||
|
| ||
| ScreenProcessing | Horlbeck et al.27 | https://github.com/mhorlbeck/ScreenProcessing |
Highlights.
A validated platform for identifying synergistic gene activities genome wide
A genetic interaction map of host repressors for HIV reactivation
Three HIV repressors identified: BCL7C, KANSL2, and SIRT2
A BAF-NSL “supercomplex” increases HIV LTR histone acetylation and blocks HIV transcription
ACKNOWLEDGMENTS
We are thankful for the support from the Gladstone Institutes and HOPE Collaboratory. We thank Melissa Krone at UCSF for providing primary cell samples. We thank Franç oise Chanut and Kathryn Claiborn for help with editing the manuscript. We thank Robin Givens and Veronica Fonseca for administrative assistance and Mauricio Montano for technical assistance. This research was supported by NIAID award UM1AI164559, co-funded by NHLBI, NIDA, NIMH, NINDS, and NIDDK. Additional support was received from the California HIV/AIDS Research Program Basic Biomedical Pilot Award (BB19-GI-006) to Z.L., NIH/NIDA fund R01DA049525 and NIH/NIAID fund P01 10018714 to W.C.G., and NIH S10 RR028962 to the Gladstone Flow Cytometry Facility. We also acknowledge the generous support of the James B. Pendleton Charitable Trust. The funders had no role in study design, data collection and analysis, decision to publish, or preparation of the manuscript.
Footnotes
DECLARATION OF INTERESTS
The authors declare no competing interests.
SUPPLEMENTAL INFORMATION
Supplemental information can be found online at https://doi.org/10.1016/j.celrep.2023.113055.
REFERENCES
- 1.Bullen CK, Laird GM, Durand CM, Siliciano JD, and Siliciano RF (2014). New ex vivo approaches distinguish effective and ineffective single agents for reversing HIV-1 latency in vivo. Nat. Med. 20, 425–429, [pii]. 10.1038/nm.3489nm.3489. [DOI] [PMC free article] [PubMed] [Google Scholar]
- 2.Darcis G, Kula A, Bouchat S, Fujinaga K, Corazza F, Ait-Ammar A, Delacourt N, Melard A, Kabeya K, Vanhulle C, et al. (2015). An In-Depth Comparison of Latency-Reversing Agent Combinations in Various In Vitro and Ex Vivo HIV-1 Latency Models Identified Bryostatin-1+JQ1 and Ingenol-B+JQ1 to Potently Reactivate Viral Gene Expression. PLoS Pathog. 11, e1005063, [pii]. 10.1371/journal.ppat.1005063PPATHOGENS-D-15-00502. [DOI] [PMC free article] [PubMed] [Google Scholar]
- 3.Laird GM, Bullen CK, Rosenbloom DIS, Martin AR, Hill AL, Durand CM, Siliciano JD, and Siliciano RF (2015). Ex vivo analysis identifies effective HIV-1 latency-reversing drug combinations. J. Clin. Invest. 125, 1901–1912, [pii]. 10.1172/JCI8014280142. [DOI] [PMC free article] [PubMed] [Google Scholar]
- 4.Jiang G, Mendes EA, Kaiser P, Wong DP, Tang Y, Cai I, Fenton A, Melcher GP, Hildreth JEK, Thompson GR, et al. (2015). Synergistic Reactivation of Latent HIV Expression by Ingenol-3-Angelate, PEP005, Targeted NF-κB Signaling in Combination with JQ1 Induced p-TEFb Activation. PLoS Pathog. 11, e1005066. 10.1371/journal.ppat.1005066.PPATHOGENS-D-15-00006 [pii]. [DOI] [PMC free article] [PubMed] [Google Scholar]
- 5.Li Z, Wu J, Chavez L, Hoh R, Deeks SG, Pillai SK, and Zhou Q (2019). Reiterative Enrichment and Authentication of CRISPRi Targets (REACT) identifies the proteasome as a key contributor to HIV-1 latency. PLoS Pathog. 15, e1007498. 10.1371/journal.ppat.1007498.PPATHOGENS-D-18-01894 [pii]. [DOI] [PMC free article] [PubMed] [Google Scholar]
- 6.Rathore A, Iketani S, Wang P, Jia M, Sahi V, and Ho DD (2020). CRISPR-based gene knockout screens reveal deubiquitinases involved in HIV-1 latency in two Jurkat cell models. Sci. Rep. 10, 5350, [pii]. 10.1038/s41598-020-62375-3. [DOI] [PMC free article] [PubMed] [Google Scholar]
- 7.Huang H, Kong W, Jean M, Fiches G, Zhou D, Hayashi T, Que J, Santoso N, and Zhu J (2019). A CRISPR/Cas9 screen identifies the histone demethylase MINA53 as a novel HIV-1 latency-promoting gene (LPG). Nucleic Acids Res. 47, 7333–7347, gkz493 [pii]. 10.1093/nar/gkz493.5511480 [pii]. [DOI] [PMC free article] [PubMed] [Google Scholar]
- 8.Besnard E, Hakre S, Kampmann M, Lim HW, Hosmane NN, Martin A, Bassik MC, Verschueren E, Battivelli E, Chan J, et al. (2016). The mTOR Complex Controls HIV Latency. Cell Host Microbe 20, 785–797, S1931–3128(16)30476–0 [pii]. 10.1016/j.chom.2016.11.001. [DOI] [PMC free article] [PubMed] [Google Scholar]
- 9.Krasnopolsky S, Kuzmina A, and Taube R (2020). Genome-wide CRISPR knockout screen identifies ZNF304 as a silencer of HIV transcription that promotes viral latency. PLoS Pathog. 16, e1008834, D-20–00501 [pii]. 10.1371/journal.ppat.1008834.PPATHOGENS-. [DOI] [PMC free article] [PubMed] [Google Scholar]
- 10.Li Z, Hajian C, and Greene WC (2020). Identification of Unrecognized Host Factors Promoting HIV-1 Latency. PLoS Pathog. 16, e1009055. 10.1371/journal.ppat.1009055. [DOI] [PMC free article] [PubMed] [Google Scholar]
- 11.Yang X, Wang Y, Lu P, Shen Y, Zhao X, Zhu Y, Jiang Z, Yang H, Pan H, Zhao L, et al. (2020). PEBP1 suppresses HIV transcription and induces latency by inactivating MAPK/NF-kappaB signaling. EMBO Rep. 21, e49305. 10.15252/embr.201949305. [DOI] [PMC free article] [PubMed] [Google Scholar]
- 12.Han K, Jeng EE, Hess GT, Morgens DW, Li A, and Bassik MC (2017). Synergistic drug combinations for cancer identified in a CRISPR screen for pairwise genetic interactions. Nat. Biotechnol. 35, 463–474, [pii]. 10.1038/nbt.3834nbt.3834. [DOI] [PMC free article] [PubMed] [Google Scholar]
- 13.Horlbeck MA, Xu A, Wang M, Bennett NK, Park CY, Bogdanoff D, Adamson B, Chow ED, Kampmann M, Peterson TR, et al. (2018). Mapping the Genetic Landscape of Human Cells. Cell 174, 953–967.e22, S0092–8674(18)30735–9 [pii]. 10.1016/j.cell.2018.06.010. [DOI] [PMC free article] [PubMed] [Google Scholar]
- 14.Wong ASL, Choi GCG, Cui CH, Pregernig G, Milani P, Adam M, Perli SD, Kazer SW, Gaillard A, Hermann M, et al. (2016). Multiplexed barcoded CRISPR-Cas9 screening enabled by CombiGEM. Proc. Natl. Acad. Sci. USA 113, 2544–2549, [pii]. 10.1073/pnas.1517883113.1517883113. [DOI] [PMC free article] [PubMed] [Google Scholar]
- 15.Gier RA, Budinich KA, Evitt NH, Cao Z, Freilich ES, Chen Q, Qi J, Lan Y, Kohli RM, and Shi J (2020). High-performance CRISPR-Cas12a genome editing for combinatorial genetic screening. Nat. Commun. 11, 3455, [pii]. 10.1038/s41467-020-17209-1. [DOI] [PMC free article] [PubMed] [Google Scholar]
- 16.Shen JP, Zhao D, Sasik R, Luebeck J, Birmingham A, Bojorquez-Gomez A, Licon K, Klepper K, Pekin D, Beckett AN, et al. (2017). Combinatorial CRISPR-Cas9 screens for de novo mapping of genetic interactions. Nat. Methods 14, 573–576, [pii]. 10.1038/nmeth.4225.nmeth.4225. [DOI] [PMC free article] [PubMed] [Google Scholar]
- 17.Zhou P, Chan BKC, Wan YK, Yuen CTL, Choi GCG, Li X, Tong CSW, Zhong SSW, Sun J, Bao Y, et al. (2020). A Three-Way Combinatorial CRISPR Screen for Analyzing Interactions among Druggable Targets. Cell Rep. 32, 108020, S2211–1247(20)31005–6 [pii]. 10.1016/j.celrep.2020.108020. [DOI] [PubMed] [Google Scholar]
- 18.Weinberger LS, Burnett JC, Toettcher JE, Arkin AP, and Schaffer DV (2005). Stochastic gene expression in a lentiviral positive-feedback loop: HIV-1 Tat fluctuations drive phenotypic diversity. Cell 122, 169–182, S0092–8674(05)00549–0 [pii]. 10.1016/j.cell.2005.06.006. [DOI] [PubMed] [Google Scholar]
- 19.Jordan A, Bisgrove D, and Verdin E (2003). HIV reproducibly establishes a latent infection after acute infection of T cells in vitro. EMBO J. 22, 1868–1877. 10.1093/emboj/cdg188. [DOI] [PMC free article] [PubMed] [Google Scholar]
- 20.Pearson R, Kim YK, Hokello J, Lassen K, Friedman J, Tyagi M, and Karn J (2008). Epigenetic silencing of human immunodeficiency virus (HIV) transcription by formation of restrictive chromatin structures at the viral long terminal repeat drives the progressive entry of HIV into latency. J. Virol. 82, 12291–12303, [pii]. 10.1128/JVI.01383-08.JVI.01383-08. [DOI] [PMC free article] [PubMed] [Google Scholar]
- 21.Williams SA, Chen LF, Kwon H, Fenard D, Bisgrove D, Verdin E, and Greene WC (2004). Prostratin antagonizes HIV latency by activating NF-kappaB. J. Biol. Chem. 279, 42008–42017, [pii]. 10.1074/jbc.M402124200.M402124200. [DOI] [PubMed] [Google Scholar]
- 22.Manganaro L, Pache L, Herrmann T, Marlett J, Hwang Y, Murry J, Miorin L, Ting AT, König R, García-Sastre A, et al. (2014). Tumor suppressor cylindromatosis (CYLD) controls HIV transcription in an NF-kappaB-dependent manner. J. Virol. 88, 7528–7540, [pii]. 10.1128/JVI.00239-14.JVI.00239-14. [DOI] [PMC free article] [PubMed] [Google Scholar]
- 23.Ping YH, and Rana TM (2001). DSIF and NELF interact with RNA polymerase II elongation complex and HIV-1 Tat stimulates P-TEFb-mediated phosphorylation of RNA polymerase II and DSIF during transcription elongation. J. Biol. Chem. 276, 12951–12958, [pii]. 10.1074/jbc.M006130200.M006130200. [DOI] [PubMed] [Google Scholar]
- 24.Stadelmayer B, Micas G, Gamot A, Martin P, Malirat N, Koval S, Raffel R, Sobhian B, Severac D, Rialle S, et al. (2014). Integrator complex regulates NELF-mediated RNA polymerase II pause/release and processivity at coding genes. Nat. Commun. 5, 5531, [pii]. 10.1038/ncomms6531.ncomms6531. [DOI] [PMC free article] [PubMed] [Google Scholar]
- 25.Tatomer DC, Elrod ND, Liang D, Xiao MS, Jiang JZ, Jonathan M, Huang KL, Wagner EJ, Cherry S, and Wilusz JE (2019). The Integrator complex cleaves nascent mRNAs to attenuate transcription. Genes Dev. 33, 1525–1538, [pii]. 10.1101/gad.330167.119.gad.330167.119. [DOI] [PMC free article] [PubMed] [Google Scholar]
- 26.Elrod ND, Henriques T, Huang KL, Tatomer DC, Wilusz JE, Wagner EJ, and Adelman K (2019). The Integrator Complex Attenuates Promoter-Proximal Transcription at Protein-Coding Genes. Mol. Cell 76, 738–752.e7, S1097–2765(19)30812–3 [pii]. 10.1016/j.molcel.2019.10.034. [DOI] [PMC free article] [PubMed] [Google Scholar]
- 27.Horlbeck MA, Gilbert LA, Villalta JE, Adamson B, Pak RA, Chen Y, Fields AP, Park CY, Corn JE, Kampmann M, and Weissman JS (2016). Compact and highly active next-generation libraries for CRISPR-mediated gene repression and activation. Elife 5, e19760, [pii]. 10.7554/eLife.19760.e19760. [DOI] [PMC free article] [PubMed] [Google Scholar]
- 28.Bliss CI (1939). The toxicity of poisons applied jointly. Ann. Appl. Biol. 26, 585–615. [Google Scholar]
- 29.Kadoch C, Hargreaves DC, Hodges C, Elias L, Ho L, Ranish J, and Crabtree GR (2013). Proteomic and bioinformatic analysis of mammalian SWI/SNF complexes identifies extensive roles in human malignancy. Nat. Genet. 45, 592–601, [pii]. 10.1038/ng.2628.ng.2628. [DOI] [PMC free article] [PubMed] [Google Scholar]
- 30.Mendjan S, Taipale M, Kind J, Holz H, Gebhardt P, Schelder M, Vermeulen M, Buscaino A, Duncan K, Mueller J, et al. (2006). Nuclear pore components are involved in the transcriptional regulation of dosage compensation in Drosophila. Mol. Cell 21, 811–823, S1097–2765(06) 00089-X [pii]. 10.1016/j.molcel.2006.02.007. [DOI] [PubMed] [Google Scholar]
- 31.Vaquero A, Scher MB, Lee DH, Sutton A, Cheng HL, Alt FW, Serrano L, Sternglanz R, and Reinberg D (2006). SirT2 is a histone deacetylase with preference for histone H4 Lys 16 during mitosis. Genes Dev. 20, 1256–1261, gad.1412706 [pii]. 10.1101/gad.1412706. [DOI] [PMC free article] [PubMed] [Google Scholar]
- 32.Ott M, Geyer M, and Zhou Q (2011). The control of HIV transcription: keeping RNA polymerase II on track. Cell Host Microbe 10, 426–435, [pii]. 10.1016/j.chom.2011.11.002.S1931-3128(11)00336-2. [DOI] [PMC free article] [PubMed] [Google Scholar]
- 33.Huttlin EL, Bruckner RJ, Navarrete-Perea J, Cannon JR, Baltier K, Gebreab F, Gygi MP, Thornock A, Zarraga G, Tam S, et al. (2021). Dual proteome-scale networks reveal cell-specific remodeling of the human interactome. Cell 184, 3022–3040.e28, S0092–8674(21)00446–3 [pii]. 10.1016/j.cell.2021.04.011. [DOI] [PMC free article] [PubMed] [Google Scholar]
- 34.Huttlin EL, Bruckner RJ, Paulo JA, Cannon JR, Ting L, Baltier K, Colby G, Gebreab F, Gygi MP, Parzen H, et al. (2017). Architecture of the human interactome defines protein communities and disease networks. Nature 545, 505–509, [pii]. 10.1038/nature22366.nature22366. [DOI] [PMC free article] [PubMed] [Google Scholar]
- 35.Xue Y, Canman JC, Lee CS, Nie Z, Yang D, Moreno GT, Young MK, Salmon ED, and Wang W (2000). The human SWI/SNF-B chromatin-remodeling complex is related to yeast rsc and localizes at kinetochores of mitotic chromosomes. Proc. Natl. Acad. Sci. USA 97, 13015–13020, [pii]. 10.1073/pnas.240208597.240208597. [DOI] [PMC free article] [PubMed] [Google Scholar]
- 36.Gatchalian J, Malik S, Ho J, Lee DS, Kelso TWR, Shokhirev MN, Dixon JR, and Hargreaves DC (2018). A non-canonical BRD9-containing BAF chromatin remodeling complex regulates naive pluripotency in mouse embryonic stem cells. Nat. Commun. 9, 5139, [pii]. 10.1038/s41467-018-07528-9. [DOI] [PMC free article] [PubMed] [Google Scholar]
- 37.Alpsoy A, and Dykhuizen EC (2018). Glioma tumor suppressor candidate region gene 1 (GLTSCR1) and its paralog GLTSCR1-like form SWI/SNF chromatin remodeling subcomplexes. J. Biol. Chem. 293, 3892–3903, [pii]. 10.1074/jbc.RA117.001065.S0021-9258(20)41014-2. [DOI] [PMC free article] [PubMed] [Google Scholar]
- 38.Cai Y, Jin J, Swanson SK, Cole MD, Choi SH, Florens L, Washburn MP, Conaway JW, and Conaway RC (2010). Subunit composition and substrate specificity of a MOF-containing histone acetyltransferase distinct from the male-specific lethal (MSL) complex. J. Biol. Chem. 285, 4268–4272, [pii]. 10.1074/jbc.C109.087981.S0021-9258(20)80930-2. [DOI] [PMC free article] [PubMed] [Google Scholar]
- 39.Eskandarian HA, Impens F, Nahori MA, Soubigou G, Coppée JY, Cossart P, and Hamon MA (2013). A role for SIRT2-dependent histone H3K18 deacetylation in bacterial infection. Science 341, 1238858, [pii]. 10.1126/science.1238858.341/6145/1238858. [DOI] [PubMed] [Google Scholar]
- 40.North BJ, Marshall BL, Borra MT, Denu JM, and Verdin E (2003). The human Sir2 ortholog, SIRT2, is an NAD+-dependent tubulin deacetylase. Mol. Cell 11, 437–444, S1097–2765(03)00038–8 [pii]. 10.1016/s1097-2765(03)00038-8. [DOI] [PubMed] [Google Scholar]
- 41.Li W, Zhang B, Tang J, Cao Q, Wu Y, Wu C, Guo J, Ling EA, and Liang F (2007). Sirtuin 2, a mammalian homolog of yeast silent information regulator-2 longevity regulator, is an oligodendroglial protein that decelerates cell differentiation through deacetylating alpha-tubulin. J. Neurosci. 27, 2606–2616, 27/10/2606 [pii]. 10.1523/JNEUROSCI.4181-06.2007. [DOI] [PMC free article] [PubMed] [Google Scholar]
- 42.Hubbert C, Guardiola A, Shao R, Kawaguchi Y, Ito A, Nixon A, Yoshida M, Wang XF, and Yao TP (2002). HDAC6 is a microtubule-associated deacetylase. Nature 417, 455–458. 417455a [pii]. 10.1038/417455a. [DOI] [PubMed] [Google Scholar]
- 43.Reuse S, Calao M, Kabeya K, Guiguen A, Gatot JS, Quivy V, Vanhulle C, Lamine A, Vaira D, Demonte D, et al. (2009). Synergistic activation of HIV-1 expression by deacetylase inhibitors and prostratin: implications for treatment of latent infection. PLoS One 4, e6093, [pii]. 10.1371/journal.pone.0006093.e6093.08-PONE-RA-06876R1. [DOI] [PMC free article] [PubMed] [Google Scholar]
- 44.Bisgrove DA, Mahmoudi T, Henklein P, and Verdin E (2007). Conserved P-TEFb-interacting domain of BRD4 inhibits HIV transcription. Proc. Natl. Acad. Sci. USA 104, 13690–13695, 0705053104 [pii]. 10.1073/pnas.0705053104. [DOI] [PMC free article] [PubMed] [Google Scholar]
- 45.Conrad RJ, Fozouni P, Thomas S, Sy H, Zhang Q, Zhou MM, and Ott M (2017). The Short Isoform of BRD4 Promotes HIV-1 Latency by Engaging Repressive SWI/SNF Chromatin-Remodeling Complexes. Mol. Cell 67, 1001–1012.e6, S1097–2765(17)30549-X [pii]. 10.1016/j.molcel.2017.07.025. [DOI] [PMC free article] [PubMed] [Google Scholar]
- 46.Boone C, Bussey H, and Andrews BJ (2007). Exploring genetic interactions and networks with yeast. Nat. Rev. Genet. 8, 437–449, nrg2085 [pii]. 10.1038/nrg2085. [DOI] [PubMed] [Google Scholar]
- 47.Costanzo M, VanderSluis B, Koch EN, Baryshnikova A, Pons C, Tan G, Wang W, Usaj M, Hanchard J, Lee SD, et al. (2016). A global genetic interaction network maps a wiring diagram of cellular function. Science 353, aaf1420, aaf1420 [pii]353/6306/aaf1420 [pii]. 10.1126/science.aaf1420. [DOI] [PMC free article] [PubMed] [Google Scholar]
- 48.Nie Z, Xue Y, Yang D, Zhou S, Deroo BJ, Archer TK, and Wang W (2000). A specificity and targeting subunit of a human SWI/SNF family-related chromatin-remodeling complex. Mol. Cell Biol. 20, 8879–8888. 10.1128/MCB.20.23.8879-8888.2000. [DOI] [PMC free article] [PubMed] [Google Scholar]
- 49.Smith ER, Cayrou C, Huang R, Lane WS, Côté J, and Lucchesi JC (2005). A human protein complex homologous to the Drosophila MSL complex is responsible for the majority of histone H4 acetylation at lysine 16. Mol. Cell Biol. 25, 9175–9188, 25/21/9175 [pii]. 10.1128/MCB.25.21.9175-9188.2005. [DOI] [PMC free article] [PubMed] [Google Scholar]
- 50.Rafati H, Parra M, Hakre S, Moshkin Y, Verdin E, and Mahmoudi T (2011). Repressive LTR nucleosome positioning by the BAF complex is required for HIV latency. PLoS Biol. 9, e1001206. 10.1371/journal.pbio.1001206.PBIOLOGY-D-11-01755 [pii]. [DOI] [PMC free article] [PubMed] [Google Scholar]
- 51.Golumbeanu M, Cristinelli S, Rato S, Munoz M, Cavassini M, Beerenwinkel N, and Ciuffi A (2018). Single-Cell RNA-Seq Reveals Transcriptional Heterogeneity in Latent and Reactivated HIV-Infected Cells. Cell Rep. 23, 942–950, S2211–1247(18)30478–9 [pii]. 10.1016/j.celrep.2018.03.102. [DOI] [PubMed] [Google Scholar]
- 52.Bradley T, Ferrari G, Haynes BF, Margolis DM, and Browne EP (2018). Single-Cell Analysis of Quiescent HIV Infection Reveals Host Transcriptional Profiles that Regulate Proviral Latency. Cell Rep. 25, 107–117.e3, S2211–1247(18)31450–5 [pii]. 10.1016/j.celrep.2018.09.020. [DOI] [PMC free article] [PubMed] [Google Scholar]
- 53.Hsiao F, Frouard J, Gramatica A, Xie G, Telwatte S, Lee GQ, Roychoudhury P, Schwarzer R, Luo X, Yukl SA, et al. (2020). Tissue memory CD4+ T cells expressing IL-7 receptor-alpha (CD127) preferentially support latent HIV-1 infection. PLoS Pathog. 16, e1008450. 10.1371/journal.ppat.1008450.PPATHOGENS-D-19-01972 [pii]. [DOI] [PMC free article] [PubMed] [Google Scholar]
- 54.Taipale M, Rea S, Richter K, Vilar A, Lichter P, Imhof A, and Akhtar A (2005). hMOF histone acetyltransferase is required for histone H4 lysine 16 acetylation in mammalian cells. Mol. Cell Biol. 25, 6798–6810, 25/15/6798 [pii]. 10.1128/MCB.25.15.6798-6810.2005. [DOI] [PMC free article] [PubMed] [Google Scholar]
- 55.Radzisheuskaya A, Shliaha PV, Grinev VV, Shlyueva D, Damhofer H, Koche R, Gorshkov V, Kovalchuk S, Zhan Y, Rodriguez KL, et al. (2021). Complex-dependent histone acetyltransferase activity of KAT8 determines its role in transcription and cellular homeostasis. Mol. Cell 81, 1749–1765.e8, S1097–2765(21)00098–8 [pii]. 10.1016/j.molcel.2021.02.012. [DOI] [PMC free article] [PubMed] [Google Scholar]
- 56.Chatterjee A, Seyfferth J, Lucci J, Gilsbach R, Preissl S, Böttinger L, Mårtensson CU, Panhale A, Stehle T, Kretz O, et al. (2016). MOF Acetyl Transferase Regulates Transcription and Respiration in Mitochondria. Cell 167, 722–738.e23, S0092–8674(16)31337-X [pii]. 10.1016/j.cell.2016.09.052. [DOI] [PubMed] [Google Scholar]
- 57.Filippakopoulos P, Picaud S, Mangos M, Keates T, Lambert JP, Barsyte-Lovejoy D, Felletar I, Volkmer R, Müller S, Pawson T, et al. (2012). Histone recognition and large-scale structural analysis of the human bromodomain family. Cell 149, 214–231, [pii]. 10.1016/j.cell.2012.02.013.S0092-8674(12)00213-9. [DOI] [PMC free article] [PubMed] [Google Scholar]
- 58.Gaub A, Sheikh BN, Basilicata MF, Vincent M, Nizon M, Colson C, Bird MJ, Bradner JE, Thevenon J, Boutros M, and Akhtar A (2020). Evolutionary conserved NSL complex/BRD4 axis controls transcription activation via histone acetylation. Nat. Commun. 11, 2243, [pii]. 10.1038/s41467-020-16103-0. [DOI] [PMC free article] [PubMed] [Google Scholar]
- 59.Rahman S, Sowa ME, Ottinger M, Smith JA, Shi Y, Harper JW, and Howley PM (2011). The Brd4 extraterminal domain confers transcription activation independent of pTEFb by recruiting multiple proteins, including NSD3. Mol. Cell Biol. 31, 2641–2652, [pii]. 10.1128/MCB.01341-10.MCB.01341-10. [DOI] [PMC free article] [PubMed] [Google Scholar]
- 60.Zippo A, Serafini R, Rocchigiani M, Pennacchini S, Krepelova A, and Oliviero S (2009). Histone crosstalk between H3S10ph and H4K16ac generates a histone code that mediates transcription elongation. Cell 138, 1122–1136, [pii]. 10.1016/j.cell.2009.07.031.S0092-8674(09)00911-8. [DOI] [PubMed] [Google Scholar]
- 61.Grézy A, Chevillard-Briet M, Trouche D, and Escaffit F (2016). Control of genetic stability by a new heterochromatin compaction pathway involving the Tip60 histone acetyltransferase. Mol. Biol. Cell 27, 599–607, [pii]. 10.1091/mbc.E15-05-0316.mbc.E15-05-0316. [DOI] [PMC free article] [PubMed] [Google Scholar]
- 62.Shang WH, Hori T, Westhorpe FG, Godek KM, Toyoda A, Misu S, Monma N, Ikeo K, Carroll CW, Takami Y, et al. (2016). Acetylation of histone H4 lysine 5 and 12 is required for CENP-A deposition into centromeres. Nat. Commun. 7, 13465. 10.1038/ncomms13465.ncomms13465 [pii]. [DOI] [PMC free article] [PubMed] [Google Scholar]
- 63.Braunstein M, Sobel RE, Allis CD, Turner BM, and Broach JR (1996). Efficient transcriptional silencing in Saccharomyces cerevisiae requires a heterochromatin histone acetylation pattern. Mol. Cell Biol. 16, 4349–4356. 10.1128/MCB.16.8.4349. [DOI] [PMC free article] [PubMed] [Google Scholar]
- 64.Zhou Y, and Grummt I (2005). The PHD finger/bromodomain of NoRC interacts with acetylated histone H4K16 and is sufficient for rDNA silencing. Curr. Biol. 15, 1434–1438, S0960–9822(05)00692–5 [pii]. 10.1016/j.cub.2005.06.057. [DOI] [PubMed] [Google Scholar]
- 65.Shogren-Knaak M, Ishii H, Sun JM, Pazin MJ, Davie JR, and Peterson CL (2006). Histone H4-K16 acetylation controls chromatin structure and protein interactions. Science 311, 844–847, 311/5762/844 [pii]. 10.1126/science.1124000. [DOI] [PubMed] [Google Scholar]
- 66.Fraga MF, Ballestar E, Villar-Garea A, Boix-Chornet M, Espada J, Schotta G, Bonaldi T, Haydon C, Ropero S, Petrie K, et al. (2005). Loss of acetylation at Lys16 and trimethylation at Lys20 of histone H4 is a common hallmark of human cancer. Nat. Genet. 37, 391–400, ng1531 [pii]. 10.1038/ng1531. [DOI] [PubMed] [Google Scholar]
- 67.North BJ, and Verdin E (2007). Interphase nucleo-cytoplasmic shuttling and localization of SIRT2 during mitosis. PLoS One 2, e784. 10.1371/journal.pone.0000784. [DOI] [PMC free article] [PubMed] [Google Scholar]
- 68.Sarikhani M, Maity S, Mishra S, Jain A, Tamta AK, Ravi V, Kondapalli MS, Desingu PA, Khan D, Kumar S, et al. (2018). SIRT2 deacetylase represses NFAT transcription factor to maintain cardiac homeostasis. J. Biol. Chem. 293, 5281–5294, [pii]. 10.1074/jbc.RA117.000915.S0021-9258(20)41000-2. [DOI] [PMC free article] [PubMed] [Google Scholar]
- 69.Rothgiesser KM, Erener S, Waibel S, Lüscher B, and Hottiger MO (2010). SIRT2 regulates NF-kappaB dependent gene expression through deacetylation of p65 Lys310. J. Cell Sci. 123, 4251–4258, [pii]. 10.1242/jcs.073783.jcs.073783. [DOI] [PubMed] [Google Scholar]
- 70.Sarikhani M, Mishra S, Maity S, Kotyada C, Wolfgeher D, Gupta MP, Singh M, and Sundaresan NR (2018). SIRT2 deacetylase regulates the activity of GSK3 isoforms independent of inhibitory phosphorylation. Elife 7, e32952, [pii]. 10.7554/eLife.32952.e32952. [DOI] [PMC free article] [PubMed] [Google Scholar]
- 71.Sabater L, Ashhab Y, Caro P, Kolkowski EC, Pujol-Borrell R, and Domínguez O (2002). Identification of a KRAB-containing zinc finger protein, ZNF304, by AU-motif-directed display method and initial characterization in lymphocyte activation. Biochem. Biophys. Res. Commun. 293, 1066–1072, [pii]. 10.1016/S0006291X(02)00344-3.S0006-291X(02)00344-3. [DOI] [PubMed] [Google Scholar]
- 72.Gilbert LA, Horlbeck MA, Adamson B, Villalta JE, Chen Y, Whitehead EH, Guimaraes C, Panning B, Ploegh HL, Bassik MC, et al. (2014). Genome-Scale CRISPR-Mediated Control of Gene Repression and Activation. Cell 159, 647–661, [pii]. 10.1016/j.cell.2014.09.029.S0092-8674(14)01178-7. [DOI] [PMC free article] [PubMed] [Google Scholar]
- 73.Jing H, Hu J, He B, Negrón Abril YL, Stupinski J, Weiser K, Carbonaro M, Chiang YL, Southard T, Giannakakou P, et al. (2016). A SIRT2-Selective Inhibitor Promotes c-Myc Oncoprotein Degradation and Exhibits Broad Anticancer Activity. Cancer Cell 29, 607, S1535–6108(16)30093–9 [pii]. 10.1016/j.ccell.2016.03.011. [DOI] [PubMed] [Google Scholar]
- 74.He N, Chan CK, Sobhian B, Chou S, Xue Y, Liu M, Alber T, Benkirane M, and Zhou Q (2011). Human Polymerase-Associated Factor complex (PAFc) connects the Super Elongation Complex (SEC) to RNA polymerase II on chromatin. Proc. Natl. Acad. Sci. USA 108, E636–E645, [pii]. 10.1073/pnas.1107107108.1107107108. [DOI] [PMC free article] [PubMed] [Google Scholar]
- 75.Dull T, Zufferey R, Kelly M, Mandel RJ, Nguyen M, Trono D, and Naldini L (1998). A third-generation lentivirus vector with a conditional packaging system. J. Virol. 72, 8463–8471. [DOI] [PMC free article] [PubMed] [Google Scholar]
Associated Data
This section collects any data citations, data availability statements, or supplementary materials included in this article.
Supplementary Materials
Data Availability Statement
All additional experimental data reported in this paper will be shared by the lead contact upon request.
This paper does not report original code.
Any additional information required to reanalyze the data reported in this work paper is available from the lead contact upon request.