

Abstract
Currently, all salivary ducts (intercalated, striated, and collecting) are assumed to function broadly in a similar manner, reclaiming ions that were secreted by the secretory acinar cells while preserving fluid volume and delivering saliva to the oral cavity. Nevertheless, there has been minimal investigation into the structural and functional differences between distinct types of salivary duct cells. Therefore, in this study, the expression profile of proteins involved in stimulus-secretion coupling as well as the function of the intercalated duct (ID) and striated duct cells, was examined. Particular focus was placed on defining differences between distinct duct cell populations. To accomplish this, immunohistochemistry and in situ hybridization were utilized to examine the localization and expression of proteins involved in reabsorption and secretion. Further, in vivo calcium imaging was employed to investigate cellular function. Based on the protein expression profile and functional data, marked differences between the IDs and striated ducts were observed. Specifically, the ID cells express proteins native to the secretory acinar cells while lacking proteins specifically expressed in the striated ducts. Further, the ID and striated duct cells display different calcium signaling characteristics, with the IDs responding to neural stimulus in a manner similar to the acinar cells. Overall, our data suggests that the IDs have a distinct role in the secretory process, separate from the reabsorptive striated ducts. Instead, based on our evidence, the IDs express proteins found in secretory cells, generate calcium signals in a manner similar to acinar cells, and, therefore, are likely secretory cells.
Keywords: Intravital imaging, Salivary gland, Intracellular calcium, Fluid secretion, Salivary duct
Graphical Abstract

(A) Salivary glands consist of acinar cells and various populations of duct cells, including intercalated duct (ID) and striated duct (SD) cells. The acinar cells secrete a NaCl-rich primary saliva following an increase in [Ca2+], while duct cells are generally believed to modify the ionic constituents of the fluid to result in net ion reabsorption without altering fluid volume.
(B) Immunohistochemistry in human submandibular gland (SMG) tissue demonstrates that ID cells, in contrast to SD cells, express secretory markers like acinar cells, including TMEM16a.
(C) In mice engineered to express a Ca2+ indicator in salivary gland cells, in vivo measurements demonstrate that neural stimulation of the SMG results in stimulated increases in [Ca2+] in ID cells which are comparable to acinar cells.
(D) We conclude that the function of ID cells is to secrete fluid in contrast to the reabsorptive function of SD cells.
Introduction:
Saliva is crucial for the health of the oral cavity (Pedersen et al., 2002). This is most widely appreciated in diseases that result in hypofunction, where patients have difficulty talking, chewing, and swallowing food and are at an increased risk for oral infections and dental caries (Melvin, 1991). To accomplish saliva production, numerous cell types work collectively to generate an initial isotonic secretion, modify the saliva, and then deliver the final fluid to the oral cavity. This is principally achieved by the activity of two cell types, the acinar and duct cells. The polarized acinar cells generate an initial isotonic secretion by the trans-epithelial movement of chloride (Cl−) (Foskett, 1990; Melvin, 1999; Turner & Sugiya, 2002; Melvin et al., 2005). This polarization of the acinar cells is critical and is established by the presence of the tight junctions, which physically separates the secretory machinery in the apical plasma membrane and the basolateral plasma membrane. This functional separation of the two membranes allows distinct proteins to be expressed and restricted to each domain, allowing for the unidirectional movement of ions and water into the lumen (Melvin et al., 2005). In the current model of fluid secretion, the production of the initial isotonic saliva is accomplished by loading Cl− into the cytosol of the acinar cells against its electrochemical gradient via the activity of the Na+-K+-Cl− cotransporter, NKCC1, and by coupled Na+/H+ and HCO3−/Cl− exchange (Evans et al., 2000; Pena-Munzenmayer et al., 2015). Thus, upon stimulation of secretion, Cl− ultimately leaves the acinar cell and enters the lumen through TMEM16a, a calcium-activated Cl− channel (Romanenko et al., 2010a). The accumulation of Cl− in the lumen imparts a negative potential with respect to the basolateral membrane, driving the paracellular movement of Na+ through the tight junctions (Melvin et al., 2005). As a result, water follows osmotically both through the tight junctions and transcellularly through aquaporin channels. Secretion is stimulated by neurotransmitter release, downstream second messenger signaling, and ultimately calcium (Ca2+) mobilization from the endoplasmic reticulum (ER) (Putney, 1982; Weiss et al., 1982; Gallacher & Petersen, 1983; Ambudkar, 2011, 2016). The primary neurotransmitter involved in this process is acetylcholine (ACh), released from parasympathetic neurons (Matsui et al., 2000). ACh binds to and activates muscarinic receptors on acinar cells, yielding the production of inositol 1,4,5 trisphosphate (IP3), which freely transverses the cell and activates IP3 receptors (IP3Rs) on the ER membrane (Lee et al., 1997; Futatsugi et al., 2005; Pages et al., 2019). Once open, Ca2+ is released into the cytosol from the ER, leading to ER store depletion. In response to store depletion, store-operated Ca2+ entry is activated to promote Ca2+ entry across the plasma membrane, refilling of the store, and to sustain elevated Ca2+ levels and, ultimately, saliva secretion (Takemura et al., 1989; Melvin et al., 1991; Cheng et al., 2011a; Cheng et al., 2011b). The tightly controlled and regulated elevation of Ca2+ in the cytosol of the acinar cells is critical for the activation of TMEM16a (Arreola et al., 1996a; Arreola et al., 1996b; Begenisich & Melvin, 1998; Romanenko et al., 2010a). Lastly, as Cl− exits the cell across the apical plasma membrane, the membrane potential of the cell shifts towards the equilibrium potential for Cl−. Thus, requiring the action of Ca2+-activated potassium (K+) channels, whose activity maintains a driving force for Cl− exit into the lumen (Maruyama et al., 1983; Nakamoto et al., 2007; Romanenko et al., 2007; Nakamoto et al., 2008; Romanenko et al., 2010b).
This primary saliva generated by the acinar cells then moves through the ductal network toward the oral cavity. Current dogma states that the network is responsible for delivering saliva to the oral cavity while modifying it and retaining fluid volume (Chibly et al., 2022). To accomplish this, the duct cells express a variety of ion channels and transporters involved in the secretion and reclaiming of ions- although more ions are reclaimed than secreted such that the final saliva reaching the oral cavity is hypotonic. Similar to the acinar cells, the salivary duct cells are polarized, with the apical and basolateral membranes being defined by the tight junctions, making the duct cells poised to net reabsorb ions. Specifically, Na+ and Cl− are reclaimed from the primary saliva, while HCO3− and K+ are secreted. This is accomplished through the activity of the epithelial Na+ channel (ENaC), the cystic fibrosis transmembrane conductance regulator (CFTR), anion exchangers, and Maxi-K channels, respectively (He et al., 1997; Luo et al., 2001; Li et al., 2006; Nakamoto et al., 2008; Shcheynikov et al., 2008; Catalan et al., 2010). Additionally, to reclaim ions without affecting the fluid volume, the tight junctions in the ducts are largely impermeable to water.
Currently, the vast majority of the studies on the salivary ducts have exclusively examined the striated duct cells. Thus, the structural and functional differences in each of the specific subtypes of cells has not been systematically examined. For example, in the literature, there is little documentation of the ion channels and transporters present in the intercalated ducts (IDs). Predominately, it is thought that the ID cells are reabsorptive cells and function in a similar fashion to striated duct cells. However, it has been demonstrated that the IDs express TMEM16a and AQP5, both of which are not detected in the striated ducts (Romanenko et al., 2010a; Larsen et al., 2011; Su et al., 2022). Further, current knowledge regarding Ca2+ signals in the salivary ducts is limited to a small number of in vitro studies (Valdez & Turner, 1991; Dehaye et al., 1993; Dinudom et al., 1993; Xu et al., 1996; Lee et al., 1997). In general, in vitro studies of Ca2+ signals have numerous caveats. For example, the cells are dissociated from their native environment and undergo enzymatic digestion to generate a cell preparation that can be used for imaging. Thus, in this process, there is a loss of extracellular matrix, basement membrane, and endogenous neural input to the cells. Instead, cells are bathed in agonists at a constant concentration to study Ca2+ responses, a stark difference to neurotransmitters being released from neurons in vivo. Of note, in the acinar cells, digestion of the gland has been demonstrated to affect features of the Ca2+ signals (Takano et al., 2021). Therefore, it would be predicted that preparing duct cells by enzymatic digestion would yield a similar effect and necessitates the use of in vivo Ca2+ imaging to comparatively examine Ca2+ signals in the salivary ducts.
Overall, it is unclear how the expression profile and in vivo function of the IDs compares to the striated ducts. Ultimately, subtle differences in the molecular makeup and function will dictate the precise role each of the subtypes of cells play in the secretory process. Thus, in this study, the structure and function of the ID cells was systematically evaluated. This was accomplished by utilizing immunohistochemistry and in situ hybridization to determine molecular markers of and evaluate the expression profile in the ID cells. Our investigations revealed that the IDs have an expression profile similar to the secretory acinar cells, expressing numerous proteins involved in the secretion process. Further, the function of the ID cells was evaluated by monitoring Ca2+ signals in live mice by intravital multiphoton microscopy (MP microscopy) (Takano et al., 2021; Takano & Yule, 2022, 2023). To accomplish this, mice expressing a genetically encoded Ca2+ indicator in the acinar, ID, and striated duct cells were generated. Stimulation of the endogenous neural input innervating the SMG revealed that the Ca2+ signals in the ID cells were similar to those displayed by the acinar cells and were significantly different compared to the striated ducts. Moreover, in an attempt to underpin the receptors responsible for the Ca2+ mobilization in the ID cells, various pharmacological agents were employed. Although the exact ligand(s) and receptor(s) responsible for the Ca2+ signals in the ID cells were not determined, it was established that the signals were mediated through Gαq-linked GPCRs generating IP3, which ultimately activates IP3Rs located on the ER. Overall, our data suggests that the IDs have an expression profile and function in a similar manner to the secretory acinar cells. Thus, this suggests that models of secretion should be modified to classify ID cells as secretory cells.
Results:
Molecular markers to identify intercalated duct cells in the murine submandibular gland
As the submandibular gland (SMG) contains various populations of duct cells, including ID and striated ducts, initial experiments set out to identify distinguishing features of each duct subset. To accomplish this, immunohistochemistry was utilized. The ID cells were initially identified in the tissue sections primarily based on the morphology of the cells. For example, based on previous data, the ID cells (~9.8μm) were determined to be significantly smaller in diameter when compared to the acinar (~16.9μm) and the striated duct cells (~18μm) (Su et al., 2022). Additionally, there were significantly fewer ID cells (~5 cells) that formed the radial ring surrounding the lumen when compared to the striated duct cells (~13 cells), and they were determined to have a cuboid morphology as opposed to the striated duct cells, which have an elongated cube wedge shape (Su et al., 2022). Lastly, due to the smaller size of the ID cells, the nuclei display a closer spacing when compared to other cell types within the gland.
In addition to the sum of these identifying morphological features, to further confirm the identity of the ID cells, the SMG tissue was stained for targets known to be expressed in the acinar and duct cells. First, SMG tissue sections were stained for Mist1, a basic helix-loop-helix transcription factor expressed in exocrine acinar cells (Pin et al., 2000; Pin et al., 2001; Aure et al., 2015). The sections were co-stained for keratin 7 (K7), a cytoskeletal protein found in the ducts (Aure et al., 2019). As expected, there was no overlap of Mist1 and K7 staining within the gland, with the acinar cells (denoted by #) exclusively expressing Mist1 and the ID (denoted by dashed outline without label) and striated duct cells (denoted by *) exclusively expressing K7 (Fig. 1A). Further, SMG tissue sections were stained for salivary α-amylase, to mark the acinar cells and K7 to mark the duct cells. Based on the staining, the K7 positive ID and striated duct cells did not stain for salivary α-amylase, as expected (Fig. 1B). However, salivary α-amylase was detected in the acinar cells (Fig. 1B). Therefore, the sum of this evidence indicates that the acinar cells, ID cells, and striated duct cells all represent distinct populations of cells within the gland.
Figure 1. Identification of molecular markers of the intercalated duct cells in the murine submandibular gland.

(A) SMG tissue stained for the nuclear acinar cell marker MIST1 (grey) and the cytoskeletal protein keratin 7 (red).
(B) SMG tissue stained for salivary α-amylase (green) and keratin 7 (red).
(C) SMG tissue stained for MIST1 (grey) and the Ca2+ channel IP3R3 (red).
(D) SMG tissue stained for the gap junction protein connexin 26 (green) and keratin 7 (red).
Nuclei were stained with DAPI (blue). Area bounded by the dashed box was magnified. Dashed outline without a label marks the intercalated duct cells, (*) marks striated duct cells, and (#) marks acinar cells. Scale bars, 25μm.
After identifying the ID cells in the tissue sections, putative markers of the ID cell population that distinguished them from the striated duct cells were determined. To accomplish this, tissue sections were stained with Mist1 and IP3R3, one of the receptors underpinning acinar cell Ca2+ signals (Futatsugi et al., 2005). As expected, Mist1 and IP3R3 were detected in the acinar cells (Fig. 1C). The striated duct cells did not positively stain for either protein; however, the resident ionocytes (Ascl3+ cells), a specialized subpopulation of duct cells, did label with IP3R3 (Fig. 1C) (Mauduit et al., 2022). The ID cells were negative for Mist1, but they did positively stain for IP3R3, which localized in the apical domain (Fig. 1C). Further, SMG tissue sections were stained for K7 and Connexin 26, a gap junction protein known to be expressed in the salivary gland and presumed to be an acinar cell marker (Kuraoka et al., 1994). For Cx26, as expected, the protein was detected in the salivary acinar cells, while there was a lack of staining in the striated duct cells (Fig. 1D, Fig. 2A, 2B). Unexpectedly, the IDs contained numerous strongly staining plaques (Fig. 1D, Fig. 2A). SMG tissue was additionally probed for Cx32, a second gap junction protein known to be present in the salivary gland (Kuraoka et al., 1994; Muramatsu et al., 1996; Ihara et al., 2000). It has been reported that Cx32 colocalizes with Cx26, which indeed was observed in the acinar cells (Fig. 2A, 2B). However, the IDs did not display any positive signal for Cx32 (Fig. 2A). Thus, as the IDs robustly express IP3R3 and Cx26, each of these proteins were utilized as a marker to distinguish ID from striated duct cells throughout the study.
Figure 2. Connexin 26 and connexin 32 distribution in the murine submandibular gland.

(A) SMG tissue stained for Cx26 (green) and the gap junction protein Cx32 (red).
(B) A magnified region of A that excluded the intercalated and striated duct cells. The tissue was stained with Cx26 (green) and Cx32 (red).
Nuclei were stained with DAPI (blue). Area bounded by the dashed box was magnified in B. Dashed outline without a label marks the intercalated duct cells, (*) marks striated duct cells, and (#) marks acinar cells. Scale bars, 25μm.
Examining the expression of reabsorptive duct cell markers in the intercalated ducts
Since the ID cells are presumed to function like striated duct cells, we first attempted to characterize the similarities and differences between the two populations of cells. To accomplish this, proteins expressed in the striated duct cells, vital to their reabsorptive function, were examined. These proteins included ENaC and CFTR (Catalan et al., 2010). As expected, ENaC was detected in the striated duct cells, and there was a lack of ENaC protein in the acinar cells (Fig. 3A). Surprisingly, the ID cells, labeled with IP3R3, also lacked the expression of ENaC (Fig. 3A). In an attempt to localize CFTR, numerous antibodies were tested, however, none of the antibodies generated a specific signal. As a result, in situ hybridization was performed to determine the distribution of Cftr mRNA within the various cell types in the gland (Fig. 3B). Acinar cells, ID cells, and striated duct cells were identified in the collection of images, and the total fluorescent values, representative of the Cftr mRNA in single cells, was determined for each cell type. From there, the distribution across the population of cells was determined and plotted. Based on the frequency distribution of Cftr mRNA, expression levels appear to be similar when comparing ID cells and acinar cells, which are reported to lack CFTR protein (Fig. 3C) (Catalan et al., 2010). Further, the distribution of Scnn1a (the gene coding for the ENaC α-subunit) followed a similar pattern, with the ID cells having a distribution comparable to the acinar cells, again which are not reported to express ENaC protein (Fig. 3D) (Catalan et al., 2010). Thus, it is unlikely that the ID cells express ENaC or CFTR, both of which are widely established as being present in reabsorptive cells (Catalan et al., 2010).
Figure 3. Evaluating the expression of proteins involved in reabsorption in the intercalated ducts.

(A) SMG tissue stained for the Na+ channel ENaC (green) and IP3R3 (red).
(B) In situ hybridization performed on fresh-frozen SMG tissue. Tissue was probed for Scnn1a (green) and Cftr (red).
(C) Frequency distribution plot for Cftr mRNA in striated duct cells (green, N= 167 cells), intercalated duct cells (blue, N= 153 cells), and acinar cells (magenta, N= 167 cells).
(D) Frequency distribution plot of Scnn1a mRNA in striated duct cells (green, N= 167 cells), intercalated duct cells (blue, N= 153 cells), and acinar cells (magenta, N= 167 cells).
Nuclei were stained with DAPI (blue). Area bounded by the dashed box was magnified. Dashed outline without a label marks the intercalated duct cells, (*) marks striated duct cells, and (#) marks acinar cells. Scale bars, 25μm.
Examining secretory cell markers in the intercalated ducts
As the ID cells lacked various proteins typical of a reabsorptive phenotype, proteins involved in stimulus-secretion coupling were examined in the ID cells. These included AQP5, NKCC1, TMEM16a, and IP3R2 (Ma et al., 1999; Evans et al., 2000; Futatsugi et al., 2005; Romanenko et al., 2010a). To identify the acinar and ID cells, IP3R3 was utilized as a marker. As expected, AQP5, NKCC1, TMEM16a, and IP3R2 were detected in the acinar cells, while there was an absence of staining in the striated duct cells (Fig. 4A–D, respectively). Comparatively, the ID cells positively stained for AQP5, NKCC1, TMEM16a, and IP3R2 (Fig. 4A–D). In addition to staining for NKCC1, the distribution of the Cl−-bicarbonate exchangers AE2 and AE4, both of which are known to be present in the acinar cells and contribute to intracellular Cl− loading were investigated (Pena-Munzenmayer et al., 2015). Similar to CFTR, an antibody suitable for immunohistochemistry was not identified. Thus, in situ hybridization was performed as described above. The frequency distribution for Slc4a2 indicates that the acinar cells, ID cells, and the striated duct cells likely express the AE2 protein (Fig. 5). The sum of this data revealed that the ID cells have an expression profile similar to the acinar cells, indicative of them being secretory cells.
Figure 4. Evaluating the expression of proteins involved in secretion in the intercalated ducts.

(A) SMG tissue stained for the water channel AQP5 (green) and IP3R3 (red).
(B) SMG tissue stained for the Na+ -K+- 2Cl− cotransporter NKCC1 (green) and IP3R3 (red).
(C) SMG tissue stained for the Ca2+- activated Cl− channel TMEM16a (green) and IP3R3 (red).
(D) SMG tissue sections stained for the Ca2+ channel IP3R2 (green) and IP3R3 (red).
Nuclei were stained with DAPI (blue). Area bounded by the dashed box was magnified. Dashed outline without a label marks the intercalated duct cells, (*) marks striated duct cells, and (#) marks acinar cells. Scale bars, 25μm.
Figure 5. Distribution of mRNA for Slc4a2 in the submandibular gland.

In situ hybridization performed on SMG tissue probing for Slc4a2 (grey). The right graph depicts the frequency distribution plot of Slc4a2 mRNA in striated duct cells (green, N= 180 cells), intercalated duct cells (blue, N=180 cells), and acinar cells (magenta, N= 180 cells).
Nuclei were stained with DAPI (blue). Dashed outline without a label marks the intercalated duct cells, (*) marks striated duct cells, and (#) marks acinar cells. Scale bar, 25μm.
Comparing expression profiles in murine intercalated ducts with other major salivary glands and species
To determine if the expression pattern observed in the ID cells was limited to the mouse SMG, mouse parotid gland (PG) tissue was probed for AQP5 and NKCC1. As expected, the immunohistochemistry revealed that the IDs and acinar cells in the PG express both proteins, while the striated ducts lacked signal (Fig. 6A, 6B). Further, human submandibular gland (hSMG) tissue was stained to ascertain whether the expression pattern observed in the IDs was limited to mice. Indeed, the hSMG IDs stained positively for AQP5 and TMEM16a, suggesting that the observations from the mouse SMG tissue are not tissue and species-specific (Fig. 6C, 6D).
Figure 6. Examining the expression pattern of proteins involved in secretion in the mouse parotid and human submandibular intercalated ducts.

(A) Mouse PG tissue stained for AQP5 (green) and IP3R3 (red).
(B) Mouse PG tissue stained for NKCC1 (green) and IP3R3 (red).
(C) Human SMG tissue stained for AQP5 (green).
(D) Human SMG tissue stained for TMEM16a (green).
Nuclei were stained with DAPI (blue). Area bounded by the dashed box was magnified. Dashed outline without a label marks the intercalated duct cells, (*) marks striated duct cells, and (#) marks acinar cells. Scale bars, 25μm.
Functional analysis of the intercalated ducts utilizing in vivo Ca2+ imaging
Fluid secretion in salivary glands is driven by Ca2+ signaling events (Putney, 1982; Weiss et al., 1982; Gallacher & Petersen, 1983; Ambudkar, 2011, 2016). To evaluate Ca2+ signals in the duct cells in vivo, mice expressing the genetically encoded fluorescent Ca2+ indicator GCaMP6f in numerous cell types within the salivary gland (acinar, ID, and striated duct) were generated. This was accomplished by crossing GCaMP6f mice [B6J.Cg-Gt(ROSA)26Sortm95.1(CAG-GCaMP6f)Hze/MwarJ] with K14-Cre mice [STOCK Tg(KRT14-cre)1Amc/J]. As the Cre is constitutively active, the STOP codon was excised in all cells that expressed keratin 14 at any point throughout development to adulthood. As K14 is expressed in the exocrine tissue early in development, the Ca2+ indicator was expressed in virtually all cells within the salivary gland (acinar cells, ID cells, and striated duct cells) (Lombaert et al., 2013).
Following validation of the expression of the indicator in the mouse model, animals were utilized for in vivo Ca2+ imaging. To accomplish this, surgery was performed on anesthetized mice to expose the SMGs, and a single SMG was lifted and placed on a holding platform, as previously described (Takano et al., 2021; Takano & Yule, 2022). Bipolar stimulation electrodes were inserted into the duct bundle, allowing for the stimulation of the nerves that innervate the SMG. A coverslip was then placed on top of the gland to hold the tissue in place, maintain a saline solution bathing the gland, and to allow for MP imaging of the tissue. Based on our previous experience, stimulation frequencies of 3Hz-10Hz were utilized. 3Hz and 5Hz stimulation frequencies are established as submaximal, and the 10Hz stimulation yields maximal sustained Ca2+ signals and fluid secretion (Takano et al., 2021). To identify the cell types of interest within the imaging fields, following image collection, ImageJ was utilized to produce average projection images of the first 20 frames and maximum projection images from the 10Hz stimulation period. From the average projection and maximum projection images, the acinar cells, ID cells, and SD cells were identified based on morphology as previously described. Following, a ROI was placed around randomly selected cell types of interest within the imaging field and the mean fluorescent intensity in the ROI was measured. The data was then transferred to Excel and analyzed to determine the peak height and latency of the response.
Utilizing the imaging and analysis described above, it was determined that under basal conditions (unstimulated), the acinar cells, ID cells, and striated duct cells were quiescent (Fig. 7B–E). However, following nervous stimulation (3Hz-10Hz), elevated Ca2+ signals were detected in the acinar cells and IDs (Fig. 7B, 7C, and 7E). The amplitude of the signals increased in both cell types as the stimulation frequency increased from 3Hz to 10Hz (Fig. 7F). Following the cessation of the stimulus, the Ca2+ signal rapidly decreased until it reached baseline levels in both the ACs and IDs (Fig. 7B, 7C, and 7E). Direct comparison of the Ca2+ signals revealed that following 3Hz and 5Hz stimulation, the magnitude of the signals was similar in AC and IDs (Fig. 7B, 7C, 7E, and 7F). However, at the 10Hz stimulation, the IDs displayed a significantly larger peak height (Fig. 7F). Comparatively, the SDs displayed a substantially smaller peak height, suggesting they are rather refractory to the stimulus (Fig. 7D and 7F). The latency of the signal was additionally analyzed, where at the submaximal stimulation frequencies (3Hz, 5Hz) and at the maximal stimulation frequency (10Hz), there was no significant difference in the response times for the ID cells and the acinar cells (Fig. 7G). As the IDs responded in a manner similar to the acinar cells, the possibility that IDs are directly innervated was investigated. Mouse SMG tissue was stained for β-Tubulin III to label neurons and IP3R3 to identify the IDs (Fig. 8). Staining revealed that neurons were in close proximity to the IDs, and, therefore, they are likely directly innervated. Overall, the sum of this data suggests that the IDs function in a manner similar to the ACs, at least in terms of the Ca2+ signals in response to nerve stimulation.
Figure 7. Evaluating Ca2+ signals in the intercalated duct cells in vivo.

(A) Grey-scale image depicts the average of the first 20 frames in the image series where the red dashed outline without a label marks the intercalated duct cells, (*) marks striated duct cells, and (#) marks acinar cells.
(B) 3Hz, 5Hz, and 10Hz time series images before, during, and after nervous stimulation.
(C) Individual traces representing the response to 3Hz, 5Hz, and 10Hz stimulation in randomly selected intercalated duct cells. The red line depicts the average of the cells.
(D) Individual traces representing the response to 10Hz stimulation in randomly selected striated duct cells. The red line depicts the average of the cells.
(E) Individual traces representing the response to 3Hz, 5Hz, and 10Hz stimulation in randomly selected acinar cells. The red line depicts the average of the cells.
(F) Average peak Ca2+ in the intercalated duct (3Hz, 5Hz, 10Hz), acinar cells (3Hz, 5Hz, 10Hz), and striated duct cells (10Hz).
(G) Average latency of the Ca2+ signal in the intercalated duct and acinar cells at the 3Hz, 5Hz, and 10Hz stimulations.
All data are mean ± standard deviation. Each data point for F and G represents an average of all individual cell-types in all fields of view (FOV) imaged from individual mice. In F and G, for the intercalated ducts and acinar cells 3Hz [6 mice], 5Hz [10 mice], and 10Hz [12 mice]. For the striated duct cells in F, 10Hz [3 mice]. In F and G, each individual stimulation frequency was compared using a two-tailed t-test except for the 10Hz peak height, which was analyzed using a one-way ANOVA with Tukey’s test. If the data was not normally distributed, the data set was log-transformed and then reanalyzed using the two-tailed t-test. Scale bars, 25μm.
Figure 8. Distribution of the neurons in the murine SMG.

SMG tissue stained with beta-tubulin III (green) to label neurons and IP3R3 (red).
Nuclei were stained with DAPI (blue). Area bounded by the dashed box was magnified. Dashed outline without a label marks the intercalated duct cells, (*) marks striated duct cells, and (#) marks acinar cells. Scale bars, 25μm.
Investigating the transmitter mediating Ca2+signals in the intercalated ducts
Next, experiments were designed to determine the receptors and signaling pathways utilized by the IDs to yield Ca2+ signals. In acinar cells, Ca2+ signals driving TMEM16a activation and fluid secretion are primarily driven by ACh, released by parasympathetic nerves innervating the gland, binding muscarinic- receptors (M1 and M3) on the cell surface (Culp et al., 1996; Matsui et al., 2000; Gautam et al., 2004). This leads to the activation of Gαq, yielding the generation of IP3, which binds to IP3Rs, triggering Ca2+ release from the ER (Lee et al., 1997; Futatsugi et al., 2005; Pages et al., 2019). Thus, we initially attempted blocking the action of ACh on muscarinic receptors in vivo to determine their contribution to ID Ca2+ mobilization. We predicted similar results in the ACs and IDs as both cell types express components of the secretion machinery and similarly respond to nerve stimulation. When we exposed the gland to atropine, a non-selective muscarinic antagonist, there was a complete blockade of Ca2+ signals in the acinar cells following stimulation (Fig. 9A and 9H). However, unexpectedly the IDs still responded, although the peak height was significantly reduced (Fig. 9A, 9C, and 9F). Further, the time to a measurable response in the ID cells was significantly increased when the gland was exposed to atropine (Fig. 9G). This data indicates that although muscarinic receptors may contribute to Ca2+ mobilization, it is not the sole receptor capable of initiating downstream Ca2+ signals. Therefore, we began to explore the role of other receptors known to be expressed in the salivary gland.
Figure 9. Investigating the source of the Ca2+ signals in the intercalated ducts at a maximal, 10Hz stimulation.
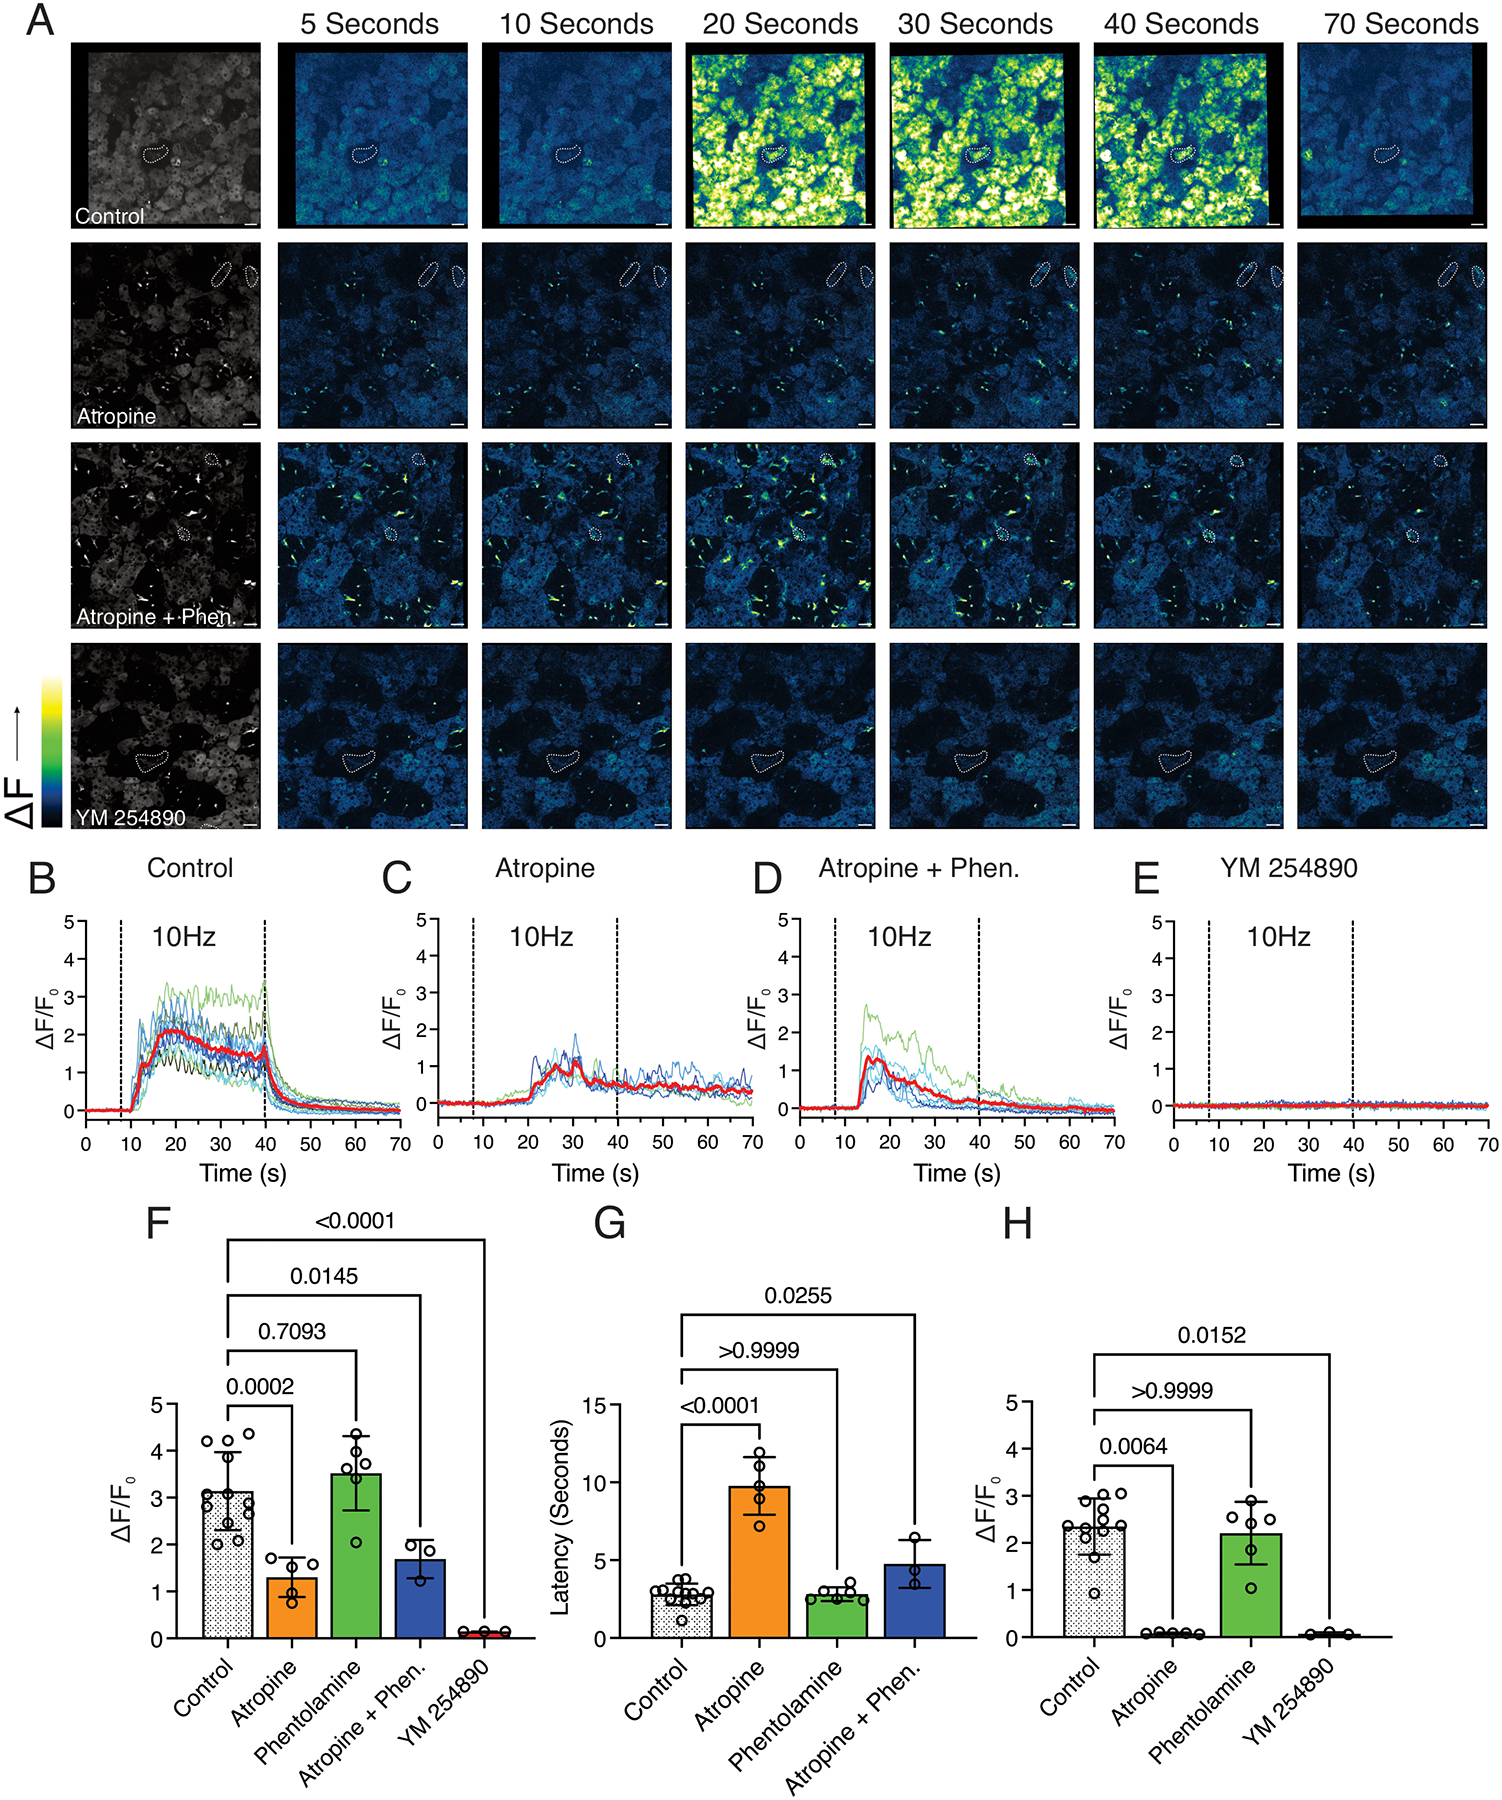
(A) Grey-scale images depict the average of the first 20 frames in the image series where the dashed outline without a label marks the intercalated duct cells. The time series to the right depict images prior to, during, and following nervous stimulation in a control, atropine, atropine + phentolamine, and YM 254890 bathed field of view.
(B) Representative traces from randomly selected intercalated duct cells in a control field of view. The red line depicts the average of the individual cells.
(C) Representative traces from randomly selected intercalated duct cells in an atropine-bathed field of view. The red line depicts the average of the individual cells.
(D) Representative traces from randomly selected intercalated duct cells in an atropine + phentolamine bathed field of view. The red line depicts the average of the individual cells.
(E) Representative traces from randomly selected intercalated duct cells in a YM 254890 bathed field of view. The red line depicts the average of the individual cells.
(F) Average peak Ca2+ in the intercalated ducts in control mice and mice where the gland was bathed in atropine, phentolamine, atropine + phentolamine, and YM 254890.
(G) Average latency of the response in the intercalated ducts in control mice and mice where the gland was bathed in atropine, phentolamine, and atropine + phentolamine.
(H) Average peak Ca2+ in the acinar cells in control mice and mice where the gland was bathed in atropine, phentolamine, and YM 254890.
All data are mean ± standard deviation. Each data point for F, G, and H represents an average of all individual cell-types in all fields of view (FOV) imaged from individual mice. For F and G, Control [12 Mice], Atropine [5 mice], Phentolamine [6 mice], Atropine + Phentolamine [3 mice], YM 254890 [3 Mice]. For H, Control [12 Mice], Atropine [5 mice], Phentolamine [6 mice], and YM 254890 [3 Mice]. One-way ANOVA with Dunnett’s test was performed in F and G. For H, the data was non-parametric and was analyzed using the Kruskal-Wallis one-way analysis of variance with Dunn’s test. Scale bars, 25μm.
In our experimental paradigm, when we stimulate the neuron bundle, we likely activate both parasympathetic and sympathetic fibers, resulting in the release of multiple neurotransmitters. As α1-adrenergic receptors, which bind norepinephrine, are established as being present in the salivary gland and are Gαq coupled, we explored their role in the ID Ca2+ signals. To accomplish this, we exposed the gland to the non-selective α-adrenergic antagonist, phentolamine. In the IDs, phentolamine had no effect on either the peak height or latency of the Ca2+ signal (Fig. 9F and 9G). In addition, in the acinar cells, the responses remained unchanged (Fig. 9H). Further, we tested a combination of atropine and phentolamine. We hypothesized that both muscarinic and adrenergic receptors may be contributing to the generation of IP3, and in the case of a single antagonist, there could be compensation for the inhibited receptor. Thus, until both receptors were blocked, we would not see a reduction of the Ca2+ signal. However, the peak height observed with the combination of atropine and phentolamine largely resembled the application of atropine alone (Fig. 9F).
As we were unsuccessful in determining the neurotransmitter and receptor responsible for the Ca2+ signals in the IDs, we decided to determine the second messenger signaling source of the Ca2+ signals. A likely candidate was IP3, generated by the activation of Gq-linked GPCRs. To test this, we bathed the gland in YM254890, an inhibitor of Gαq. As a positive control, the acinar cells failed to respond to the stimulus in the presence of the inhibitor, as expected based on the results of the atropine inhibition experiments (Fig. 9H). The IDs additionally failed to respond to the stimulus in the presence of YM254890 (Fig. 9A, 9E, and 9F). Overall, the sum of this data indicates that although muscarinic receptor signaling may play a role in the Ca2+ signals observed in the IDs, they are not the sole Gq-linked GPCR contributing to IP3 production and Ca2+ signals.
Discussion:
The function of the salivary duct cells is critical for maintaining the proper constituents in the final saliva as well as preserving fluid volume and delivering it to the oral cavity. It is well established that in transgenic animals, eliminating components of the ion exchange machinery results in an alteration in volume, ionic content, and/or pH of the final saliva (Evans et al., 2000; Catalan et al., 2010). Although the ductal network is formed by numerous types of duct cells, the similarities and differences between each of the cell populations at the level of molecular machinery (structure) and function has yet to be systematically explored. Instead, models of saliva secretion presume that all duct cells function generally in a similar manner. Recently, albeit with limited data, we modeled the activity of the ID cells in respect to the acinar and striated duct cells (Su et al., 2022). This model revealed it was likely that the IDs were secretory cells, breaking from the current dogma for salivary secretion. Thus, we set out to completely characterize the structure and function of the ID cells and to distinguish any differences they display in comparison to the striated duct cells. To accomplish this, immunostaining and in situ hybridization was utilized to examine the expression profile of the intercalated and striated ducts. Following initial structural characterization, transgenic mice that expressed a genetically encoded Ca2+ indicator in the acinar, ID, and striated duct cells were generated. These mice were then utilized to perform in vivo MP imaging to characterize the Ca2+ signals generated in each of the aforementioned cell types following stimulation of the endogenous neuron bundle. Lastly, the neurotransmitters and receptors responsible for Ca2+ mobilization in the salivary IDs were explored.
Structural characterization of the intercalated ducts reveals a secretory phenotype
In characterizing the IDs and distinguishing them from the striated ducts, it was determined that IP3R3 and Cx26 were differentially expressed in the two populations of cells, with the IDs having and the SDs lacking the proteins. This data was surprising as it had not been established that the IDs expressed either of these proteins, and instead, both were presumed to be acinar cell markers. As the IDs expressed Cx26, a second gap junction protein known to be in the salivary gland, Cx32 was examined. Interestingly, Cx32 was restricted to the salivary acinar cells, with the IDs and striated ducts lacking the protein. This suggests that even though the acinar cells and the ID cells are coupled via gap junctions, the intrinsic properties of Cx26 and Cx32 may regulate the exchange between cells. Thus, with the acinar cells expressing both Cx26 and Cx32, while the IDs lack Cx32, this may suggest that these cells have differential communication abilities. Meanwhile, the SDs lack both connexin proteins, indicating a lack of coupling between these cells.
In comparing the ID cells to the striated duct cells, stark differences between the two cell types were observed. Mainly, the IDs lacked ENaC, a protein vital to the reabsorption of Na+ (Catalan et al., 2010). Additionally, the IDs lacked Cftr and Scnn1a mRNA, having levels of signal comparable to the acinar cells, which are known to lack each of the respective proteins (Catalan et al., 2010). The sum of this data suggested that the ID cells lacked the machinery necessary for reabsorbing Na+ and Cl− ions from the primary saliva. Thus, the IDs should not be classified as traditional reabsorptive duct cells. Instead, the IDs expressed a multitude of proteins established as being present in secretory cells, including AQP5, NKCC1, TMEM16a, and IP3R2. This data overwhelmingly supports the idea that the IDs secrete ions and fluid (Fig. 10). Specifically, these cells have a means of moving Cl− across the basolateral and apical membranes into the lumen, a mechanism capable of generating Ca2+ signals to activate TMEM16a, and a route to move water into the lumen (Fig. 10). Thus, the only conceivable function of ID cells is the secretion of ions and fluid, consistent with our latest duct model (Su et al., 2022). Additionally, this expression profile in the IDs was not just a phenomenon observed in the mouse SMG. The IDs in the mouse PG expressed AQP5, IP3R3, and NKCC1. While the human SMG expressed AQP5 and TMEM16a. Therefore, this data demonstrates that the IDs likely have a secretory phenotype across both glands responsible for the majority of the saliva (SMG and PG) and across numerous species.
Figure 10. Schematic diagram of transport processes in salivary intercalated duct cells.

A depiction of the secretion machinery we identified as being present in the intercalated duct cells (color). The machinery depicted in grey would be necessary for ion and water secretion but has yet to be localized in the intercalated duct cells.
In vivo calcium imaging revealed that the intercalated ducts are capable of generating signals consistent with secretion
To characterize Ca2+ dynamics in the salivary ducts, we performed in vivo Ca2+ imaging using intravital MP microscopy and monitored the responses following intrinsic nerve stimulation. The experimental results revealed that the ID cells responded similarly to the acinar cells in terms of both peak height and latency across the various physiological stimulation frequencies (3Hz-10Hz). For the acinar cells, the in vivo signals observed were largely similar to those previously reported (Takano et al., 2021). Interestingly, the striated duct cells were rather refractory to the stimulus, having a significantly smaller peak height in comparison to the acinar and ID cells. This was surprising as in vitro studies had demonstrated that the ducts were capable of mobilizing Ca2+ and responded to the application of carbachol, acetylcholine, epinephrine, norepinephrine, and ATP, albeit with varying magnitudes (Valdez & Turner, 1991; Dehaye et al., 1993; Dinudom et al., 1993; Xu et al., 1996; Lee et al., 1997). The responses in the intercalated ducts were additionally examined in one of the above studies and were reported to be more sensitive to ATP while less sensitive to CCh and epinephrine when compared with granular duct cells (Xu et al., 1996). Thus, based on the in vitro data, one would potentially expect to see differential responses in each of the populations of cells in vivo. Although the responses in the IDs and SDs were significantly different, consistent with the in vitro data, the responses in the IDs unexpectedly resembled those seen in the acinar cells. This discrepancy could result from a number of different factors. For example, in vitro, the ducts are bathed in agonist. Therefore, it is conceivable that in vivo, if the IDs are directly innervated, the neurotransmitters being released and the concentration of the neurotransmitter reaching the duct cells would affect features of the Ca2+ response. Further, isolation of the salivary ducts would yield a loss of communication between the acinar and duct cells. This would include a loss of communication via the gap junctions and by factors released into the luminal network. Lastly, in the above in vitro scenarios, routinely, the agonists are applied individually. This would not reflect the in vivo paradigm, where numerous signaling pathways are likely integrated following stimulation. Thus, all of the above factors could account for the unexpected features of the Ca2+ signals in the salivary ducts in vivo. Overall, the in vivo experimental paradigm revealed that the ID cells are not only comparable to the acinar cells at the molecular level, they additionally respond to neurostimulation and mobilize Ca2+ in a similar manner. Therefore, this data further supports that the ID cells are secretory cells.
The intercalated ducts generate calcium signals by GPCR-driven IP3 production
The two major neurotransmitters released from the parasympathetic and sympathetic neurons are ACh and norepinephrine, respectively. Thus, their contribution to ID Ca2+ signals was explored utilizing pharmacological agents. To begin, the salivary gland was exposed to atropine, and as expected, Ca2+ mobilization was blocked in the acinar cells. However, the IDs still responded to the stimulation even though the responses were significantly smaller than the control. This data could be the result of three different possibilities. First, while direct muscarinic receptor signaling may contribute to Ca2+ mobilization in the IDs, it is not the only signaling pathway capable of generating Ca2+ responses. Alternatively, the smaller peak height observed could result from blocking secretion from the acinar cells. Thus, responses to any potential luminal agonists, such as ATP, may be blocked. Lastly, the smaller peak height could be the result of a loss of second messenger signaling through the gap junctions from the acinar to the ID cells. Nonetheless, the atropine data would still suggest the activation of at least one other receptor capable of downstream Ca2+ mobilization. Therefore, the contribution of norepinephrine driven α-adrenergic signaling in the ID cells was explored. To accomplish this, the gland was exposed to phentolamine, and there was no discernable effect in the acinar cells or the ID cells. Interestingly, this data would suggest that, in general, α1-adrenergic signaling contributes minimally to Ca2+ mobilization in both cell types. For the acinar cells, this data is consistent with the atropine data, where there was no residual Ca2+ signal observed, and thus, the contribution of adrenergic signaling is likely minimal. Lastly, an attempt was made to block Ca2+ mobilization in the ID cells by utilizing a combination of atropine and phentolamine to block both muscarinic and adrenergic responses. A significant reduction in the peak height was observed, although the inhibition was not complete, similar to the application of atropine alone.
As the above experimental strategies employing various pharmacological agents were unsuccessful in isolating the specific ligand(s) and receptor(s) responsible for Ca2+ signaling in the ID cells, the downstream signaling pathways that may be contributing to Ca2+ mobilization were explored. To achieve this, the SMG was exposed to YM 254890, a specific Gαq inhibitor which effectively blocks IP3 generation. As expected, there was a complete blockade of Ca2+ mobilization in the acinar cells, consistent with the atropine data. In the ID cells, there was also a complete blockade of the response following the application of YM 254890. This data indicated that the responses in the ID cells depend on GPCR-driven IP3 generation and downstream IP3R activation. To fully elucidate the upstream GPCRs responsible for the generation of IP3 in the ID cells, more extensive studies are necessary. However, this is beyond the scope of this current paper, where the objective was to comparatively examine the ID cells to the acinar and striated duct cells.
Potential functions of the intercalated duct cells
In sum, the structural and functional data indicate that the ID cells are secretory cells. Therefore, this raises the fundamental question of why the ID cells secrete. A few possibilities exist, the first being that they may be capable of responding to different neurotransmitters compared to the acinar cells and, thus, possibly secrete under different circumstances. In this scenario, one could imagine that the function of the IDs may be to keep the lumen hydrated. An additional possibility is that the ID cells may differentially secrete a complement of proteins. For example, in a recent study examining the transcriptome of the human submandibular gland, numerous transcripts for secreted proteins involved in inflammation were enriched in the ID cells (Horeth et al., 2023). Overall, this data may indicate that the IDs play an important role in oral immune defense. However, beyond this, there is currently no other data in the literature that supports either of these hypotheses. Thus, to definitively determine the function of the intercalated duct cells beyond them being capable of secretion, further exploration is necessary.
Methods:
Ethical Approval
All animal procedures were approved by the University of Rochester Committee on Animal Resources (UCAR-2001–214E).
Animals
Male and female 3 to 6-month-old C57BL/6J mice were utilized for immunohistochemistry (N= 3 or more mice) and in situ hybridization (N=3) unless specifically denoted. To generate K14+/−: GCaMP6f+/− transgenic mice, homozygous adult female GCaMP6fflox mice (Jackson Laboratory; Jax 028865) were crossed with adult male homozygous K14-Cre mice (Jackson Laboratory; Jax 004782). Animals had access to water and were fed ad libitum.
Tissue Processing and Immunostaining
SMG and PG tissue samples from 3 to 6-month-old mice were fixed overnight in 4% paraformaldehyde (PFA), washed twice with PBS the following day, and transferred to 70% ethanol overnight. Subsequently, the samples were placed in a Sakura Tissue Tek-VIP machine to process the tissue. The processed tissue was embedded in paraffin, 5μm sections were cut, and the sections were mounted onto Superfrost Plus microscope slides (Fisher Scientific; 12-550-15). Tissue was deparaffinized, rehydrated, and then antigen retrieval was performed and optimized depending on the antibodies utilized. Sections were blocked in 10% normal donkey serum in PBS with 0.2% BSA (PBSA) or with M.O.M (Mouse on Mouse) Blocking reagent (MKB-2213-1; Vector Laboratories) for 1h at room temperature. Following, sections were incubated with primary antibodies overnight at 4°C (Mist1 [abcam, ab187978, 1:200], IP3R3 [BD Biosciences, 610313, 1:400], Connexin 26 [ThermoFisher, 71-0500, 1:250], Cytokeratin 7 [abcam, ab9021, 1:200], ENaC [ThermoFisher, PA1-920A, 1:500], AQP5 [abcam, ab239904, 1:500], NKCC1 [Cell Signaling, D208R, 1:500], TMEM16a [abcam, ab84115, 1:250], IP3R2 [Pocono Rabbit Farms and Laboratories, Rabbit anti- mouse antibody raised against amino acids 2686-2701], Connexin 32 [ThermoFisher, 13-8200, 1:250], β- Tubulin III [abcam, ab18207, 1:100]). Secondary antibodies were applied the following day at a concentration of 1:500, diluted in 0.2% PBSA, for 1h at room temperature [Donkey anti-Rabbit Alexa 488 (A-21206; Invitrogen) and Donkey anti-Mouse Alexa 594 (A-21203; Invitrogen)]. DAPI (62248; ThermoScientific) was applied to the sections for 5 min at room temperature, and coverslips were mounted onto the slides using Immu-Mount (9990402; Epredia). To confirm the specificity of the staining, a secondary-only control was included on every slide that was stained. Slides were imaged using an Olympus Scanning Confocal Microscope with a 60X Oil Objective (1.35 NA). ImageJ software (NIH, Bethesda, MD, USA) was used to generate a 3D- projection of the image stacks and to add a scale bar. Human tissue sections were stained using the protocol described above.
In situ Hybridization
SMGs from 3- to 6-month-old C57BL/6J mice were removed, embedded in a mold containing Tissue Tek O.C.T compound (Sakura; 4583), and immediately placed on a Petri dish floating in liquid nitrogen to freeze the tissue. The frozen block was subsequently transferred to a cryostat, and 16μM sections were cut, mounted onto Superfrost Plus microscope slides (Fisher Scientific; 12-550-15), and fixed in 4% PFA. In situ hybridization was performed using the RNAScope multiplex fluorescent reagent kit (Advanced Cell Diagnostics [ACD], 320850) and probes for Cftr (ACD, 483011-C3), Scnn1a (ACD, 441391), and Slc4a2 (521341-C3). DAPI was utilized to stain the nuclei. Positive control probes (ACD, 320881) were run in parallel with every experiment to examine the quality of the RNA in each of the samples. Negative control probes (ACD, 320871) were utilized to evaluate non-specific hybridization. Slides were imaged using a Keyence BZ-X800 series all-in-one fluorescent microscope with a 40X ELWD air objective (0.60NA). The Keyence analysis software was used to generate 3D-projection image stacks, and ImageJ was utilized to add a scale bar.
In situ Hybridization Image Analysis
Analysis of the in-situ hybridization images was accomplished utilizing ImageJ software and Microsoft Excel. A minimum of three images per mouse were used in the analysis. In each analyzed image, acinar cells, ID cells, and striated duct cells were identified, and a region of interest (ROI) was placed around each of the analyzed cells. Following, the fluorescence in the ROI was measured, and the mean fluorescent intensity and area of the ROI was transferred to Excel. In Excel, the total fluorescence in each ROI was calculated using the mean intensity and area. The data for each cell type was then binned across a range of values that encompassed the entire data set. Subsequently, the percentage of the total cells in each bin for each cell type was calculated to determine the frequency distribution.
In vivo MP imaging
Transgenic K14Cre: GCaMP6f mice were anesthetized with Ketamine (80mg/kg body weight, i.p) and Xylazine (10 mg/kg body weight, i.p.). The mice were restrained, and the body temperature of the animal was maintained using a heating pad throughout the duration of the surgery and imaging. The SMGs were exposed, and the connective tissue around a single gland was teased away, allowing for the gland to be lifted away from the underlying tissue while remaining connected via a duct, nerve, and blood vessel bundle. A pair of tungsten wires (WPI, Inc) was inserted into the bundle to be utilized as stimulation electrodes. Following, the gland was placed on a 10 × 13mm custom build small holder situated directly above the neck to minimize movement effects as a result of breathing. The gland was held in place by a cover glass used to flatten the surface and keep the tissue moist with Hanks salt solution (HBSS). A 25x water immersion objective (Olympus XLPlan N 1.05 W MP) equipped with an objective heater (OKOLab COL2532) kept at 37°C was utilized for MP imaging. An upright 2-photon microscope system (FVMPE-RS, Olympus) with an excitation laser (InSight X3, Spectra-Physics) tuned at 950 nm and emission collected at 495–540 nm was utilized. Images were captured at a frame rate of 2–5 fps. Imaging depths between 10 and 55 μm from the surface of the gland were routinely utilized. PMT settings were fixed at 600V, 1X gain, and 3% black level, with excitation laser power adjusted per animal and according to imaging depth and the field of view. Stimulation was generated using a stimulus isolator (Iso-flex, A.M.P.I.) set 5 mA, 200μs, at the indicated frequency with train frequency and duration controlled by a train generator (DG2A, Warner Instruments). A minimum of 1 minute was given before imaging the same field at a different stimulation strength. In the antagonist and inhibitor experiments, atropine [500μM, Sigma, A0257], phentolamine [100μM, Sigma, P7561], atropine + phentolamine [500μM, 100μM], and YM254890 [50μM, Tocris, 7352] were diluted in HBSS to the final concentrations listed and applied to the gland for at least 10 minutes prior to imaging the tissue.
Analysis of the average peak Ca2+ and latency
Image series were initially analyzed utilizing ImageJ. XY drift was corrected by applying the Descriptor-based series registration plugin (Preibisch et al., 2010). Following, cells of interest were identified based on morphology, and a ROI was placed around randomly selected cells in the imaging field. The fluorescence in each of the ROIs was then measured over time, and the mean fluorescent intensity from each frame was transferred to Microsoft Excel. In Excel, the first 20 frames were averaged and served as the baseline fluorescence (F0). To calculate the DF/F0, [(F/F0)-1] was determined for each value. Following, the peak Ca2+ reached in each ROI was determined and then averaged for all of the particular cell type in all of the FOV from individual mice. Further, an increase in the Ca2+ 4 times the standard deviation of the F0 value was considered a responding cell. The latency was calculated by determining the frame in which the Ca2+ signal surpassed the responding cell limit following the initiation of stimulation. Non-responding cells were excluded from this analysis. Statistical analysis was performed using Prism (GraphPad, La Jolla. CA, USA).
Supplementary Material
Key Points:
Current studies examining salivary intercalated duct cells are limited, with minimal documentation of the ion transport machinery and the overall role of the cells in fluid generation.
They are presumed to function in the same manner as other duct cells, reclaiming ions, maintaining fluid volume, and delivering the final saliva to the oral cavity.
Here we systematically examine the structure and function of the salivary intercalated duct cells using immunohistochemistry, in situ hybridization, and by monitoring in vivo Ca2+ dynamics.
Structural data revealed that the intercalated duct cells lack proteins vital for reabsorption and express proteins necessary for secretion.
Ca2+ dynamics in the intercalated duct cells were consistent with those observed in secretory cells and resulted from GPCR-mediated IP3 production.
Acknowledgments:
The Authors wish to thank members of the Yule laboratory for helpful comments during the course of these studies.
Funding Information.
The study was supported by NIH grant DE019245 to DIY/JS. AMW was supported by F31 DE030670 from the NIH (NIDCR).
Biography

Amanda M. Wahl completed her Ph.D. in Pharmacology at the University of Rochester Medical Center. Since joining the Yule Laboratory in 2019, her research has focused on examining aspects of salivary gland physiology utilizing a structural and functional approach. Her current work is focused on examining salivary duct cell populations to define their precise cellular function, and this work was supported by a fellowship grant from the NIH (NIDCR).Amanda M. Wahl completed her Ph.D. in Pharmacology at the University of Rochester Medical Center. Since joining the Yule Laboratory in 2019, her research has focused on examining aspects of salivary gland physiology utilizing a structural and functional approach. Her current work is focused on examining salivary duct cell populations to define their precise cellular function, and this work was supported by a fellowship grant from the NIH (NIDCR).
Data Availability:
All original raw data (image files and analysis) are retained on a University of Rochester server, and access is available on request. The Authors state that they have no competing interests.
References:
- Ambudkar IS. (2011). Dissection of calcium signaling events in exocrine secretion. Neurochem Res 36, 1212–1221. [DOI] [PMC free article] [PubMed] [Google Scholar]
- Ambudkar IS. (2016). Calcium signalling in salivary gland physiology and dysfunction. J Physiol 594, 2813–2824. [DOI] [PMC free article] [PubMed] [Google Scholar]
- Arreola J, Melvin JE & Begenisich T. (1996a). Activation of calcium-dependent chloride channels in rat parotid acinar cells. J Gen Physiol 108, 35–47. [DOI] [PMC free article] [PubMed] [Google Scholar]
- Arreola J, Park K, Melvin JE & Begenisich T. (1996b). Three distinct chloride channels control anion movements in rat parotid acinar cells. J Physiol 490 (Pt 2), 351–362. [DOI] [PMC free article] [PubMed] [Google Scholar]
- Aure MH, Konieczny SF & Ovitt CE. (2015). Salivary gland homeostasis is maintained through acinar cell self-duplication. Dev Cell 33, 231–237. [DOI] [PMC free article] [PubMed] [Google Scholar]
- Aure MH, Symonds JM, Mays JW & Hoffman MP. (2019). Epithelial Cell Lineage and Signaling in Murine Salivary Glands. J Dent Res 98, 1186–1194. [DOI] [PMC free article] [PubMed] [Google Scholar]
- Begenisich T & Melvin JE. (1998). Regulation of chloride channels in secretory epithelia. J Membr Biol 163, 77–85. [DOI] [PubMed] [Google Scholar]
- Catalan MA, Nakamoto T, Gonzalez-Begne M, Camden JM, Wall SM, Clarke LL & Melvin JE. (2010). Cftr and ENaC ion channels mediate NaCl absorption in the mouse submandibular gland. J Physiol 588, 713–724. [DOI] [PMC free article] [PubMed] [Google Scholar]
- Cheng KT, Liu X, Ong HL, Swaim W & Ambudkar IS. (2011a). Local Ca(2)+ entry via Orai1 regulates plasma membrane recruitment of TRPC1 and controls cytosolic Ca(2)+ signals required for specific cell functions. PLoS Biol 9, e1001025. [DOI] [PMC free article] [PubMed] [Google Scholar]
- Cheng KT, Ong HL, Liu X & Ambudkar IS. (2011b). Contribution of TRPC1 and Orai1 to Ca(2+) entry activated by store depletion. Adv Exp Med Biol 704, 435–449. [DOI] [PMC free article] [PubMed] [Google Scholar]
- Chibly AM, Aure MH, Patel VN & Hoffman MP. (2022). Salivary gland function, development, and regeneration. Physiol Rev 102, 1495–1552. [DOI] [PMC free article] [PubMed] [Google Scholar]
- Culp DJ, Luo W, Richardson LA, Watson GE & Latchney LR. (1996). Both M1 and M3 receptors regulate exocrine secretion by mucous acini. Am J Physiol 271, C1963–1972. [DOI] [PubMed] [Google Scholar]
- Dehaye JP, Valdez IH & Turner RJ. (1993). Beta-adrenergic stimulation and cAMP mobilize Ca2+ from an IP3-insensitive pool in rat submandibular granular ducts. Am J Physiol 265, C1356–1362. [DOI] [PubMed] [Google Scholar]
- Dinudom A, Poronnik P, Allen DG, Young JA & Cook DI. (1993). Control of intracellular Ca2+ by adrenergic and muscarinic agonists in mouse mandibular ducts and end-pieces. Cell Calcium 14, 631–638. [DOI] [PubMed] [Google Scholar]
- Evans RL, Park K, Turner RJ, Watson GE, Nguyen HV, Dennett MR, Hand AR, Flagella M, Shull GE & Melvin JE. (2000). Severe impairment of salivation in Na+/K+/2Cl- cotransporter (NKCC1)-deficient mice. J Biol Chem 275, 26720–26726. [DOI] [PubMed] [Google Scholar]
- Foskett JK. (1990). [Ca2+]i modulation of Cl- content controls cell volume in single salivary acinar cells during fluid secretion. Am J Physiol 259, C998–1004. [DOI] [PubMed] [Google Scholar]
- Futatsugi A, Nakamura T, Yamada MK, Ebisui E, Nakamura K, Uchida K, Kitaguchi T, Takahashi-Iwanaga H, Noda T, Aruga J & Mikoshiba K. (2005). IP3 receptor types 2 and 3 mediate exocrine secretion underlying energy metabolism. Science 309, 2232–2234. [DOI] [PubMed] [Google Scholar]
- Gallacher DV & Petersen OH. (1983). Stimulus-secretion coupling in mammalian salivary glands. Int Rev Physiol 28, 1–52. [PubMed] [Google Scholar]
- Gautam D, Heard TS, Cui Y, Miller G, Bloodworth L & Wess J. (2004). Cholinergic stimulation of salivary secretion studied with M1 and M3 muscarinic receptor single- and double-knockout mice. Mol Pharmacol 66, 260–267. [DOI] [PubMed] [Google Scholar]
- He X, Tse CM, Donowitz M, Alper SL, Gabriel SE & Baum BJ. (1997). Polarized distribution of key membrane transport proteins in the rat submandibular gland. Pflugers Arch 433, 260–268. [DOI] [PubMed] [Google Scholar]
- Horeth E, Bard J, Che M, Wrynn T, Song EAC, Marzullo B, Burke MS, Popat S, Loree T, Zemer J, Tapia JL, Frustino J, Kramer JM, Sinha S & Romano RA. (2023). High-Resolution Transcriptomic Landscape of the Human Submandibular Gland. J Dent Res 102, 525–535. [DOI] [PMC free article] [PubMed] [Google Scholar]
- Ihara A, Muramatsu T & Shimono M. (2000). Expression of connexin 32 and 43 in developing rat submandibular salivary glands. Arch Oral Biol 45, 227–235. [DOI] [PubMed] [Google Scholar]
- Kuraoka A, Yamanaka I, Miyahara A, Shibata Y & Uemura T. (1994). Immunocytochemical studies of major gap junction proteins in rat salivary glands. Eur Arch Otorhinolaryngol 251 Suppl 1, S95–99. [DOI] [PubMed] [Google Scholar]
- Larsen HS, Aure MH, Peters SB, Larsen M, Messelt EB & Kanli Galtung H. (2011). Localization of AQP5 during development of the mouse submandibular salivary gland. J Mol Histol 42, 71–81. [DOI] [PMC free article] [PubMed] [Google Scholar]
- Lee MG, Xu X, Zeng W, Diaz J, Wojcikiewicz RJ, Kuo TH, Wuytack F, Racymaekers L & Muallem S. (1997). Polarized expression of Ca2+ channels in pancreatic and salivary gland cells. Correlation with initiation and propagation of [Ca2+]i waves. J Biol Chem 272, 15765–15770. [DOI] [PubMed] [Google Scholar]
- Li J, Koo NY, Cho IH, Kwon TH, Choi SY, Lee SJ, Oh SB, Kim JS & Park K. (2006). Expression of the Na+-HCO3- cotransporter and its role in pHi regulation in guinea pig salivary glands. Am J Physiol Gastrointest Liver Physiol 291, G1031–1040. [DOI] [PubMed] [Google Scholar]
- Lombaert IM, Abrams SR, Li L, Eswarakumar VP, Sethi AJ, Witt RL & Hoffman MP. (2013). Combined KIT and FGFR2b signaling regulates epithelial progenitor expansion during organogenesis. Stem Cell Reports 1, 604–619. [DOI] [PMC free article] [PubMed] [Google Scholar]
- Luo X, Choi JY, Ko SB, Pushkin A, Kurtz I, Ahn W, Lee MG & Muallem S. (2001). HCO3- salvage mechanisms in the submandibular gland acinar and duct cells. J Biol Chem 276, 9808–9816. [DOI] [PubMed] [Google Scholar]
- Ma T, Song Y, Gillespie A, Carlson EJ, Epstein CJ & Verkman AS. (1999). Defective secretion of saliva in transgenic mice lacking aquaporin-5 water channels. J Biol Chem 274, 20071–20074. [DOI] [PubMed] [Google Scholar]
- Maruyama Y, Gallacher DV & Petersen OH. (1983). Voltage and Ca2+-activated K+ channel in baso-lateral acinar cell membranes of mammalian salivary glands. Nature 302, 827–829. [DOI] [PubMed] [Google Scholar]
- Matsui M, Motomura D, Karasawa H, Fujikawa T, Jiang J, Komiya Y, Takahashi S & Taketo MM. (2000). Multiple functional defects in peripheral autonomic organs in mice lacking muscarinic acetylcholine receptor gene for the M3 subtype. Proc Natl Acad Sci U S A 97, 9579–9584. [DOI] [PMC free article] [PubMed] [Google Scholar]
- Mauduit O, Aure MH, Delcroix V, Basova L, Srivastava A, Umazume T, Mays JW, Bellusci S, Tucker AS, Hajihosseini MK, Hoffman MP & Makarenkova HP. (2022). A mesenchymal to epithelial switch in Fgf10 expression specifies an evolutionary-conserved population of ionocytes in salivary glands. Cell Rep 39, 110663. [DOI] [PMC free article] [PubMed] [Google Scholar]
- Melvin JE. (1991). Saliva and dental diseases. Curr Opin Dent 1, 795–801. [PubMed] [Google Scholar]
- Melvin JE. (1999). Chloride channels and salivary gland function. Crit Rev Oral Biol Med 10, 199–209. [DOI] [PubMed] [Google Scholar]
- Melvin JE, Koek L & Zhang GH. (1991). A capacitative Ca2+ influx is required for sustained fluid secretion in sublingual mucous acini. Am J Physiol 261, G1043–1050. [DOI] [PubMed] [Google Scholar]
- Melvin JE, Yule D, Shuttleworth T & Begenisich T. (2005). Regulation of fluid and electrolyte secretion in salivary gland acinar cells. Annu Rev Physiol 67, 445–469. [DOI] [PubMed] [Google Scholar]
- Muramatsu T, Hashimoto S & Shimono M. (1996). Differential expression of gap junction proteins connexin32 and 43 in rat submandibular and sublingual glands. J Histochem Cytochem 44, 49–56. [DOI] [PubMed] [Google Scholar]
- Nakamoto T, Romanenko VG, Takahashi A, Begenisich T & Melvin JE. (2008). Apical maxi-K (KCa1.1) channels mediate K+ secretion by the mouse submandibular exocrine gland. Am J Physiol Cell Physiol 294, C810–819. [DOI] [PMC free article] [PubMed] [Google Scholar]
- Nakamoto T, Srivastava A, Romanenko VG, Ovitt CE, Perez-Cornejo P, Arreola J, Begenisich T & Melvin JE. (2007). Functional and molecular characterization of the fluid secretion mechanism in human parotid acinar cells. Am J Physiol Regul Integr Comp Physiol 292, R2380–2390. [DOI] [PubMed] [Google Scholar]
- Pages N, Vera-Siguenza E, Rugis J, Kirk V, Yule DI & Sneyd J. (2019). A Model of [Formula: see text] Dynamics in an Accurate Reconstruction of Parotid Acinar Cells. Bull Math Biol 81, 1394–1426. [DOI] [PMC free article] [PubMed] [Google Scholar]
- Pedersen AM, Bardow A, Jensen SB & Nauntofte B. (2002). Saliva and gastrointestinal functions of taste, mastication, swallowing and digestion. Oral Dis 8, 117–129. [DOI] [PubMed] [Google Scholar]
- Pena-Munzenmayer G, Catalan MA, Kondo Y, Jaramillo Y, Liu F, Shull GE & Melvin JE. (2015). Ae4 (Slc4a9) Anion Exchanger Drives Cl- Uptake-dependent Fluid Secretion by Mouse Submandibular Gland Acinar Cells. J Biol Chem 290, 10677–10688. [DOI] [PMC free article] [PubMed] [Google Scholar]
- Pin CL, Bonvissuto AC & Konieczny SF. (2000). Mist1 expression is a common link among serous exocrine cells exhibiting regulated exocytosis. Anat Rec 259, 157–167. [DOI] [PubMed] [Google Scholar]
- Pin CL, Rukstalis JM, Johnson C & Konieczny SF. (2001). The bHLH transcription factor Mist1 is required to maintain exocrine pancreas cell organization and acinar cell identity. J Cell Biol 155, 519–530. [DOI] [PMC free article] [PubMed] [Google Scholar]
- Preibisch S, Saalfeld S, Schindelin J & Tomancak P. (2010). Software for bead-based registration of selective plane illumination microscopy data. Nat Methods 7, 418–419. [DOI] [PubMed] [Google Scholar]
- Putney JW Jr. (1982). Cellular regulation. Science 216, 1403–1404. [DOI] [PubMed] [Google Scholar]
- Romanenko VG, Catalan MA, Brown DA, Putzier I, Hartzell HC, Marmorstein AD, Gonzalez-Begne M, Rock JR, Harfe BD & Melvin JE. (2010a). Tmem16A encodes the Ca2+-activated Cl- channel in mouse submandibular salivary gland acinar cells. J Biol Chem 285, 12990–13001. [DOI] [PMC free article] [PubMed] [Google Scholar]
- Romanenko VG, Nakamoto T, Srivastava A, Begenisich T & Melvin JE. (2007). Regulation of membrane potential and fluid secretion by Ca2+-activated K+ channels in mouse submandibular glands. J Physiol 581, 801–817. [DOI] [PMC free article] [PubMed] [Google Scholar]
- Romanenko VG, Thompson J & Begenisich T. (2010b). Ca2+-activated K channels in parotid acinar cells: The functional basis for the hyperpolarized activation of BK channels. Channels (Austin) 4, 278–288. [DOI] [PMC free article] [PubMed] [Google Scholar]
- Shcheynikov N, Yang D, Wang Y, Zeng W, Karniski LP, So I, Wall SM & Muallem S. (2008). The Slc26a4 transporter functions as an electroneutral Cl-/I-/HCO3- exchanger: role of Slc26a4 and Slc26a6 in I- and HCO3- secretion and in regulation of CFTR in the parotid duct. J Physiol 586, 3813–3824. [DOI] [PMC free article] [PubMed] [Google Scholar]
- Su S, Rugis J, Wahl A, Doak S, Li Y, Suresh V, Yule D & Sneyd J. (2022). A Mathematical Model of Salivary Gland Duct Cells. Bull Math Biol 84, 84. [DOI] [PMC free article] [PubMed] [Google Scholar]
- Takano T, Wahl AM, Huang KT, Narita T, Rugis J, Sneyd J & Yule DI. (2021). Highly localized intracellular Ca(2+) signals promote optimal salivary gland fluid secretion. Elife 10. [DOI] [PMC free article] [PubMed] [Google Scholar]
- Takano T & Yule DI. (2022). In vivo Ca(2+) Imaging in Mouse Salivary Glands. Bio Protoc 12, e4380. [DOI] [PMC free article] [PubMed] [Google Scholar]
- Takano T & Yule DI. (2023). Ca(2+) signals in pancreatic acinar cells in response to physiological stimulation in vivo. J Physiol. [DOI] [PubMed] [Google Scholar]
- Takemura H, Hughes AR, Thastrup O & Putney JW Jr. (1989). Activation of calcium entry by the tumor promoter thapsigargin in parotid acinar cells. Evidence that an intracellular calcium pool and not an inositol phosphate regulates calcium fluxes at the plasma membrane. J Biol Chem 264, 12266–12271. [PubMed] [Google Scholar]
- Turner RJ & Sugiya H. (2002). Understanding salivary fluid and protein secretion. Oral Dis 8, 3–11. [DOI] [PubMed] [Google Scholar]
- Valdez IH & Turner RJ. (1991). Effects of secretagogues on cytosolic Ca2+ levels in rat submandibular granular ducts and acini. Am J Physiol 261, G359–363. [DOI] [PubMed] [Google Scholar]
- Weiss SJ, McKinney JS & Putney JW Jr. (1982). Regulation of phosphatidate synthesis by secretagogues in parotid acinar cells. Biochem J 204, 587–592. [DOI] [PMC free article] [PubMed] [Google Scholar]
- Xu X, Diaz J, Zhao H & Muallem S. (1996). Characterization, localization and axial distribution of Ca2+ signalling receptors in the rat submandibular salivary gland ducts. J Physiol 491 (Pt 3), 647–662. [DOI] [PMC free article] [PubMed] [Google Scholar]
Associated Data
This section collects any data citations, data availability statements, or supplementary materials included in this article.
Supplementary Materials
Data Availability Statement
All original raw data (image files and analysis) are retained on a University of Rochester server, and access is available on request. The Authors state that they have no competing interests.