

Abstract
Scope:
Compared to carbohydrate, milk and soy protein supplements significantly reduce blood pressure (BP) among individuals with hypertension. This study aims to discover metabolites of dietary carbohydrate, soy and milk protein supplements and evaluate their roles in BP regulation in the Protein and Blood Pressure (ProBP), a cross-over trial.
Methods and results:
Plasma metabolites were profiled at pre-trial baseline and after 8 weeks of supplementation with carbohydrate, soy protein, and milk protein, respectively, among 80 ProBP participants. After Bonferroni correction (α=6·49×10−4), dietary interventions significantly changed 40 metabolites. Changes of erucate (22:1n9), an omega-9 fatty acid, were positively associated with systolic BP changes (Beta=1·90, P=6·27×10−4); This metabolite was also associated with higher odds of hypertension among 1261 participants of an independent cohort, the Bogalusa Heart Study (Odds Ratio per unit increase=1·34; 95% confidence interval: 1·07–1·68). High levels of acylcholines dihomo-linolenoyl-choline (P=4·71E-04) and oleoylcholine (P=3·48E-04) at baseline predicted larger BP lowering effects of soy protein. Increasing cheese intake during the trial, as reflected by isobutyrylglycine and Isovalerylglycine, reduced the BP lowering effect of soy protein.
Conclusions:
We identified molecular signatures of dietary interventions. Erucate (22:1n9) increased systolic BP. Acylcholine enhanced and cheese intake reduced the BP lowering effect of soy protein supplement.
Keywords: dietary interventions, metabolomics, blood pressure, randomized controlled trial
Graphical Abstract

Eight weeks of supplementation with carbohydrate, soy protein, and milk protein significantly changed 40 blood chemicals, reflecting changes in participants’ usual diet, gut microbiota, and physiological pathways. Changes of erucate (22:1n9), an omega-9 fatty acid, were positively associated with systolic BP changes; This metabolite was also associated with higher odds of hypertension in an independent population cohort. Individuals with high levels of acylcholines or reducing cheese intake benefited more from soy protein supplement to reduce systolic BP.
1. Introduction
High blood pressure (BP) is the leading cause of mortality and accounts for more cardiovascular disease mortality than any other modifiable risk factor.[1] It is estimated that 7·7–10·4 million annual deaths are attributable to elevated BP.[2] The current guidelines on hypertension and cardiovascular diseases recommend nonpharmacological interventions to prevent and treat elevated BP.[3, 4] Randomized controlled trials have demonstrated favorable effects of milk and soy protein supplementation on lowering BP.[5, 6] In the Protein and Blood Pressure (ProBP) trial, we identified that soy protein and milk protein supplements for 8 weeks were associated with significantly larger net reduction in systolic BP compared with carbohydrate control.[5] However, the mechanisms underlying the BP-lowering effects of protein supplementations are not well understood.
The human plasma metabolome contains both endogenous and external molecular chemicals. Metabolomics profiling has been used to detect and quantify subtle changes in molecular profiles related to endogenous pathological processes, as well as dietary, environmental, and gut microbial influences.[7, 8] Several studies have investigated changes in urinary and/or plasma metabolomes after dietary tea and cocoa consumptions [9, 10] and physical activity interventions.[11] However, no studies have investigated the effects of metabolite changes on blood pressure regulation in humans.
The current study traced changes of the serum metabolome before and after dietary carbohydrate, soy protein, and milk protein supplements in the ProBP trial. The primary goal of this study is to identify metabolites associated with BP during dietary interventions, with a secondary goal of understanding the influence of dietary interventions on the plasma metabolome.
2. Experimental Section
Study participants
The ProBP was a double-blinded, randomized controlled, cross-over trial of dietary interventions conducted between September 2003 and April 2008. Details of the trial design, methods, and main outcomes have been published previously.[5] In brief, a total of 352 participants with a systolic BP between 120 and 159 mmHg and a diastolic BP between 80 and 95 mmHg and not taking antihypertensive mediation were randomly allocated to three groups. Each group took a random sequence of soy protein, milk protein, and complex carbohydrate supplementation using an efficient crossover design. Each supplementation lasted for 8 weeks, and a 3-week washout period between phases was used to reduce carryover effects of interventions. Of the original ProBP trial, more than 80% of the participants completed all three intervention phases.[5] Due to damage from Hurricane Katrina, only 80 ProBP participants who completed all intervention phases had stored plasma samples available for later analyses. Trial design and selection of these participants are shown in Figure 1. These participants had similar baseline characteristics as those in the overall trial except for a slightly higher proportion of male participants (69% in the current study vs. 56% in the original study).
Figure 1.
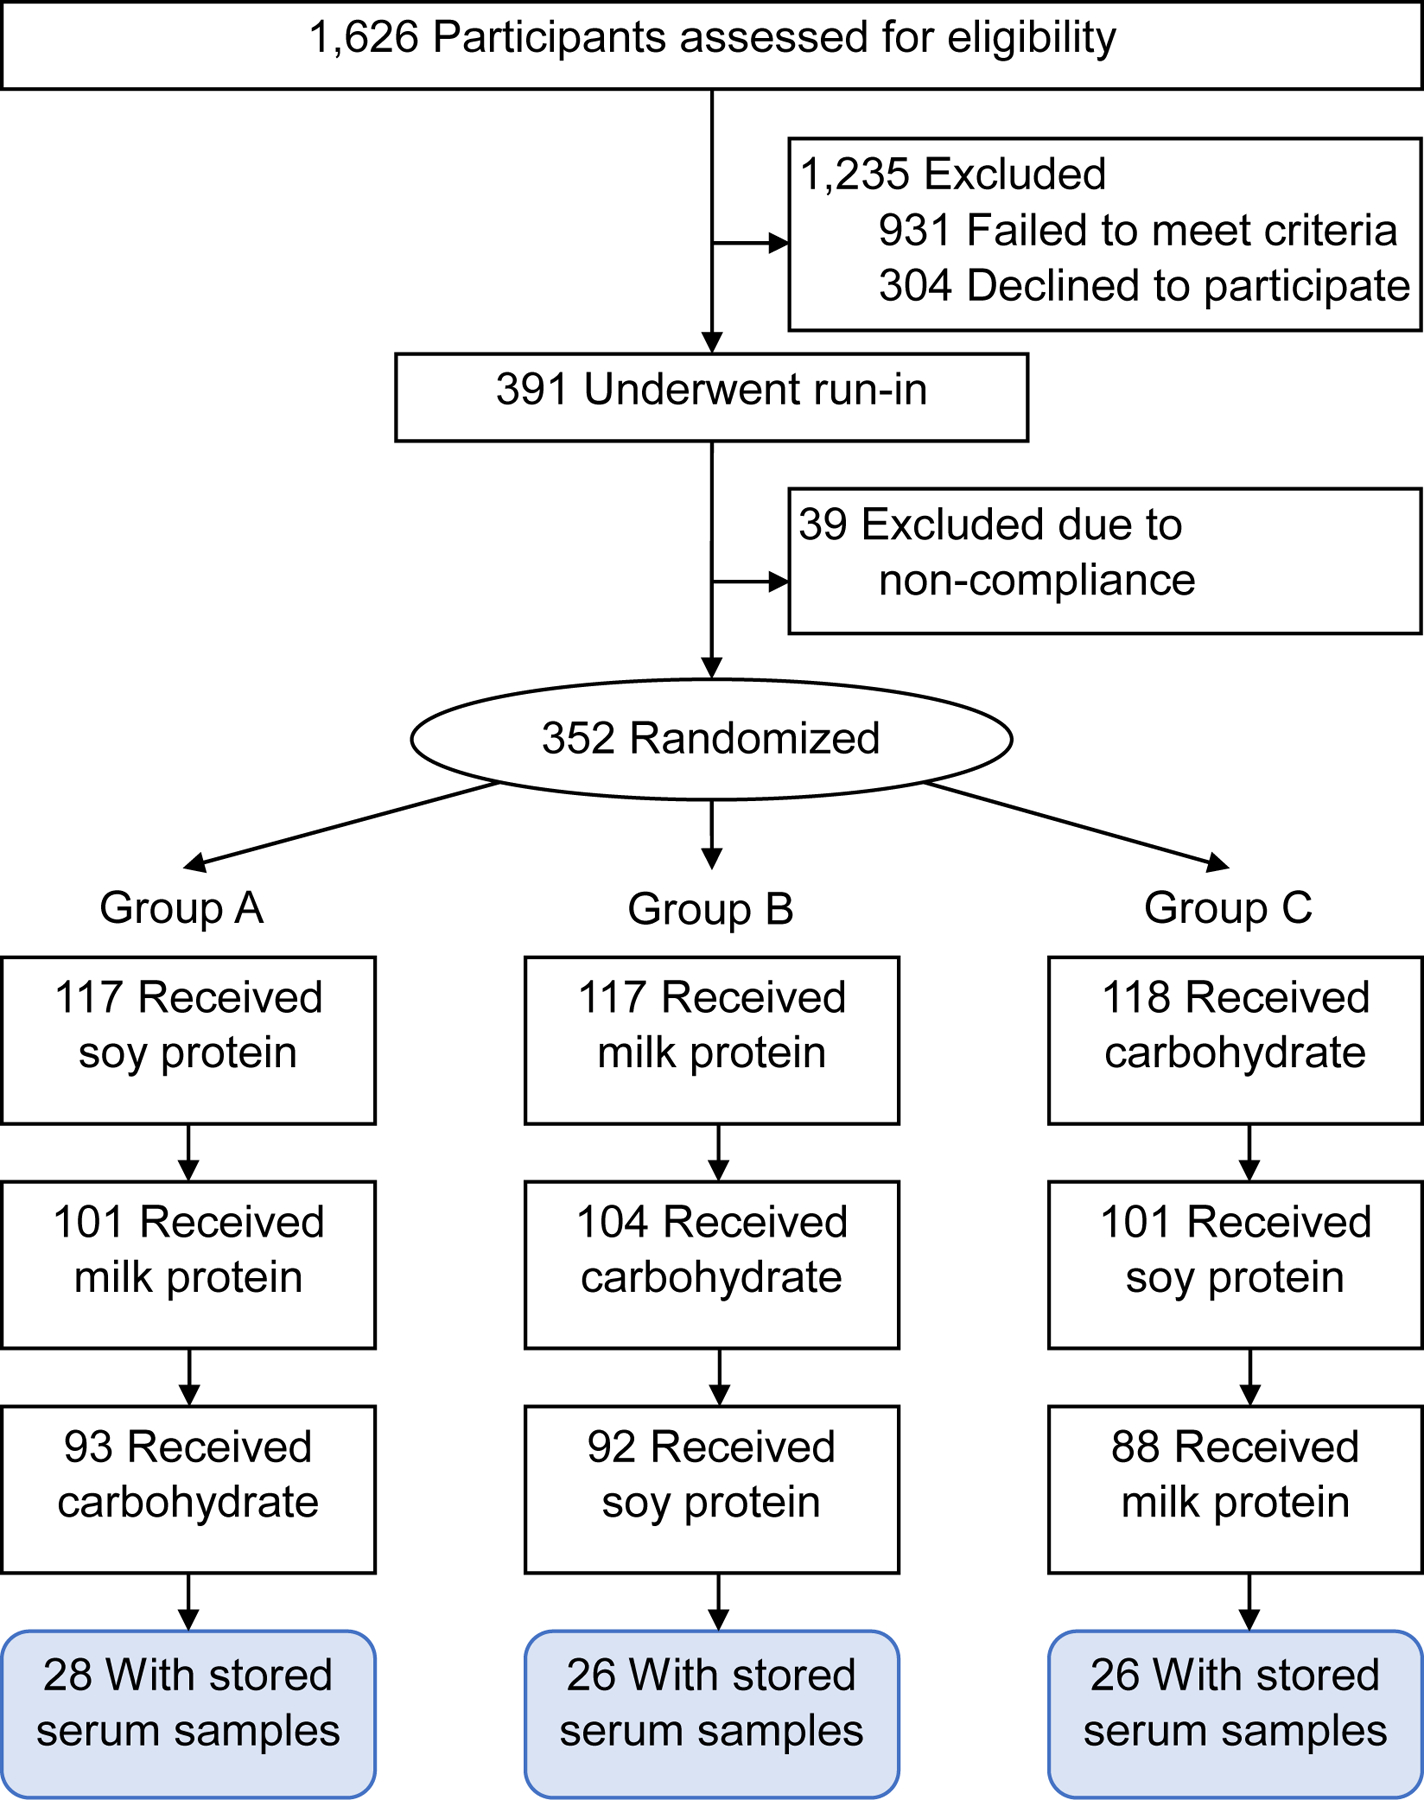
Flow chart of participants selection for the metabolomics study in the Protein and Blood Pressure (ProBP) trial.
The ProBP trial was approved by the Tulane University Institution Review Board (IRB), and all participants signed informed consents. The current study was a secondary analysis of the collected blood samples and data and was approved by the Tulane IRB after an expedited review (REF#: 2020–419).
Plasma metabolomics profiling
Plasma metabolome was profiled from fasting blood samples at pre-trial baseline and the end of each intervention phase using the untargeted, ultrahigh performance liquid chromatography-tandem mass spectroscopy (UPLC-MS/MS) by Metabolon, Inc (Durham, NC). A total of 1,343 metabolites were quantified, and 1,268 metabolites passed quality control. Details on the profiling and quality control process are described in supplementary material.
Measurement of BP
Participants were examined twice at the beginning and twice at the end of an intervention phase. During each examination, blood pressure was measured three times by trained and certified research staff using the Hawksley random-zero sphygmomanometer and following standardized methods. The research staff were blinded to group assignments. Mean BP at the beginning or end of an intervention phase was calculated using the six readings. Net changes of BP during an intervention phase were calculated as the mean BP at the end minus that at the beginning of the phase.
Covariables
Covariables included age, sex, race/ethnicity, education, current cigarette smoking, current alcohol drinking, and body mass index (BMI). Education was categorized as “having some college education or higher” and “less than college education”. BMI was calculated as kilograms per square meter.
Replication cohort
Significant metabolites identified in the ProBP trial were tested for cross-sectional associations with hypertension in the Bogalusa Heart Study (BHS). The BHS was designed to investigate the early natural history of cardiovascular disease among a biracial sample (35% African Americans and 65% whites) of residents from Bogalusa, Louisiana.[12] Plasma metabolites were profiled for all 1,261 participants during the 2013–2016 visit cycle using the UPLC-MS/MS by Metabolon, Inc (Durham, NC). In BHS, 1,466 metabolites were quantified, and 1,202 metabolites passed quality control. The same quality control and data management methods as in the ProBP were implemented in the BHS.
Statistics analyses
Characteristics of the study participants were presented according to randomization groups in the ProBP and for the overall participants of the BHS. Means and standard deviations for continuous variables and percentages for categorical variables were presented. Overview of the statistical analyses according to the study goals are shown in Figure 2.
Figure 2.

Overview of statistical analyses according to study goals in the Protein and Blood Pressure (ProBP) trial.
Mixed effects models:
Given the cross-over design, all analyses involving repeated measurements used mixed effects models, in which, participants were assumed to be random effects; treatment, intervention sequence, and intervention period were included in all models and assumed to be estimated fixed effects; and correlations of repeated measurements were corrected by an autoregressive correlation matrix.
Correction for multiple testing based on principal components:
We performed principal component analyses for all identified metabolites at pre-trial baseline and the end of each dietary intervention phase, separately. The first 77 principal components explained more than 99·7% of the total variation of all metabolites at each period. Therefore, Bonferroni correction for 77 tests (P=0·05/77=6·49E-04) was used to define statistically significant metabolites.[13]
Metabolite changes and BP changes:
Associations between metabolite changes and BP changes during the trial were tested using linear mixed effects models, while controlling for treatment, intervention sequence, period, age, sex, and race in a base model and additionally controlling for education, cigarette smoking, alcohol drinking, and BMI in a full model.
We also tested associations of metabolite changes with BP changes during a specific dietary intervention using linear regression models, while adjusting for age, sex, and race in a base model and additionally adjusting for education, cigarette smoking, alcohol drinking, and BMI in a full model. Metabolites with changes nominally associated with BP changes during an intervention were tested for enrichment in metabolic pathways and metabolite sets using the MetaboAnalyst 5·0 software.[14]
Metabolites changes and BP lowering effect of interventions:
To examine whether changes of a metabolite had different effects on BP responses across the three dietary interventions, we added an interaction term, intervention*metabolite change, in the mixed effects models in the “Metabolite changes and BP changes” section. For a significant metabolite in the interaction analyses, we categorize changes of the metabolite into tertiles and presented the effects of dietary protein supplements on BP in each tertile.
Baseline metabolites and BP lowering effect of interventions:
We examined whether baseline values of metabolites modified the effects of soy and milk protein interventions on BP responses by adding an interaction term of intervention*baseline metabolite in the mixed effects models adjusting for intervention, treatment sequence, period, and baseline metabolite. For a metabolite with significant interaction effect, we stratified the metabolite by its median and tested the effects of dietary protein supplements on BP responses within each stratum.
Metabolite responses to interventions:
Response of a metabolite to a dietary intervention was calculated as metabolite level at the end of the intervention minus that at pre-trial baseline. The paired t-test was used to evaluate whether a metabolite response was statistically significant or not. For metabolites that had nominally significant changes (P<0·05) after an intervention, we performed over-representative analyses to check for enrichment of 84 human metabolic pathways identified by the KEGG[15] and 1,571 metabolite sets identified by the RefMet[16] and LIPID MAPS[17] using the MetaboAnalyst 5·0 software.[14] False discovery rate (FDR) method was used to define significantly enriched pathways. Responses of a metabolite to different dietary interventions were compared using mixed effects models, controlling for treatment, intervention sequence, and period.
Replication analyses in BHS:
Finally, for metabolites with changes associated with BP responses, we tested their associations with BP and hypertension in the BHS using multivariable linear regression for continuous BP phenotypes and multivariable logistic regression for the binary hypertension status (systolic BP≥130, diastolic BP≥85, or taking antihypertensive medication). We controlled the same set of covariables in the BHS as in the ProBP. The FDR method was used to correct for multiple testing.
3. Results
Characteristics of the three randomization groups of the ProBP were comparable (Table 1). Both the ProBP and BHS participants were in their late 40s and had a mean BMI of around 30 kg/m2. The two cohorts also had similar race compositions, with about 30% of the participants reporting Black race. Compared to ProBP, BHS participants were more likely to be females, current cigarette smokers, and current alcohol drinkers, and had slightly lower systolic BP, diastolic BP, and education levels. In addition, 34·8% of the BHS participants were taking anti-hypertensive medications.
Table 1.
Baseline characteristics of ProBP Trial and BHS participants
| Characteristics | ProBP Trial, Randomization Groups * | BHS (n=1261) | ||
|---|---|---|---|---|
| A (n=26) | B (n=28) | C (n=26) | ||
| Age, years | 43.6 (10.0) | 48.7 (10.6) | 50.4 (8.7) | 48.2 (5.3) |
| Female, n (%) | 8 (30.8) | 7 (25.0) | 10 (38.5) | 742 (58.8) |
| Black race, n (%) | 8 (30.8) | 8 (28.6) | 10 (38.5) | 434 (34.4) |
| Some college education, n (%) | 22 (84.6) | 26 (92.9) | 19 (73.1) | 640 (50.9) |
| Current smoking, n (%) | 2 (7.7) | 0 (0.0) | 3 (11.5) | 251 (19.9) |
| Current drinking, n (%) | 10 (38.5) | 11 (39.3) | 12 (46.2) | 700 (55.8) |
| Body mass index, kg/m2 | 29.1 (3.9) | 30.4 (5.0) | 28.4 (4.0) | 31.4 (7.8) |
| Physical activity, MET-hours per day | 12.0 (11.5) | |||
| Physical activity, 3 times/wk, % | 13 (50.0) | 15 (53.6) | 17 (65.4) | |
| Systolic blood pressure, mm Hg | 125.3 (8.9) | 126.6 (8.0) | 127.9 (9.9) | 123.3 (16.8) |
| Diastolic blood pressure, mm Hg | 81.0 (4.4) | 80.8 (5.1) | 82.2 (5.6) | 78.5 (11.3) |
| Hypertension, n (%) | 19 (70.1) | 15 (53.6) | 18 (69.2) | 785 (62.3) |
| Anti-hypertensive medication, n (%) | 0 (0.0) | 0 (0.0) | 0 (0.0) | 439 (34.8) |
Values are mean (SD) or n (%). BHS indicates Bogalusa Heart Study; SD, standard deviation; MET, metabolic equivalent; and ProBP, Protein and Blood Pressure.
Sequence A received 40 g of soy protein for 8 weeks, then 40 g of milk protein for 8 weeks, and finally 40 g of complex carbohydrate for 8 weeks; those who were assigned to sequence B first received milk protein, then carbohydrate, and finally soy protein; and those who were assigned to sequence C first received carbohydrate, then soy protein, and finally milk protein.
Associations between metabolite changes and BP changes during the trial
As shown in Figure 3, one metabolite, erucate (22:1n9), had changes significantly and positively associated with systolic BP responses to dietary interventions during the trial (Beta=1·90, P=6·27E-4). Even after controlling for all covariables, the association was only slightly changed (beta=1·90, P=8·91E-4). Furthermore, this metabolite was associated with higher odds of hypertension in the BHS (Odds Ratio per unit change=1·34; 95% confidence interval: 1·07–1·68; P=0.01).
Figure 3.
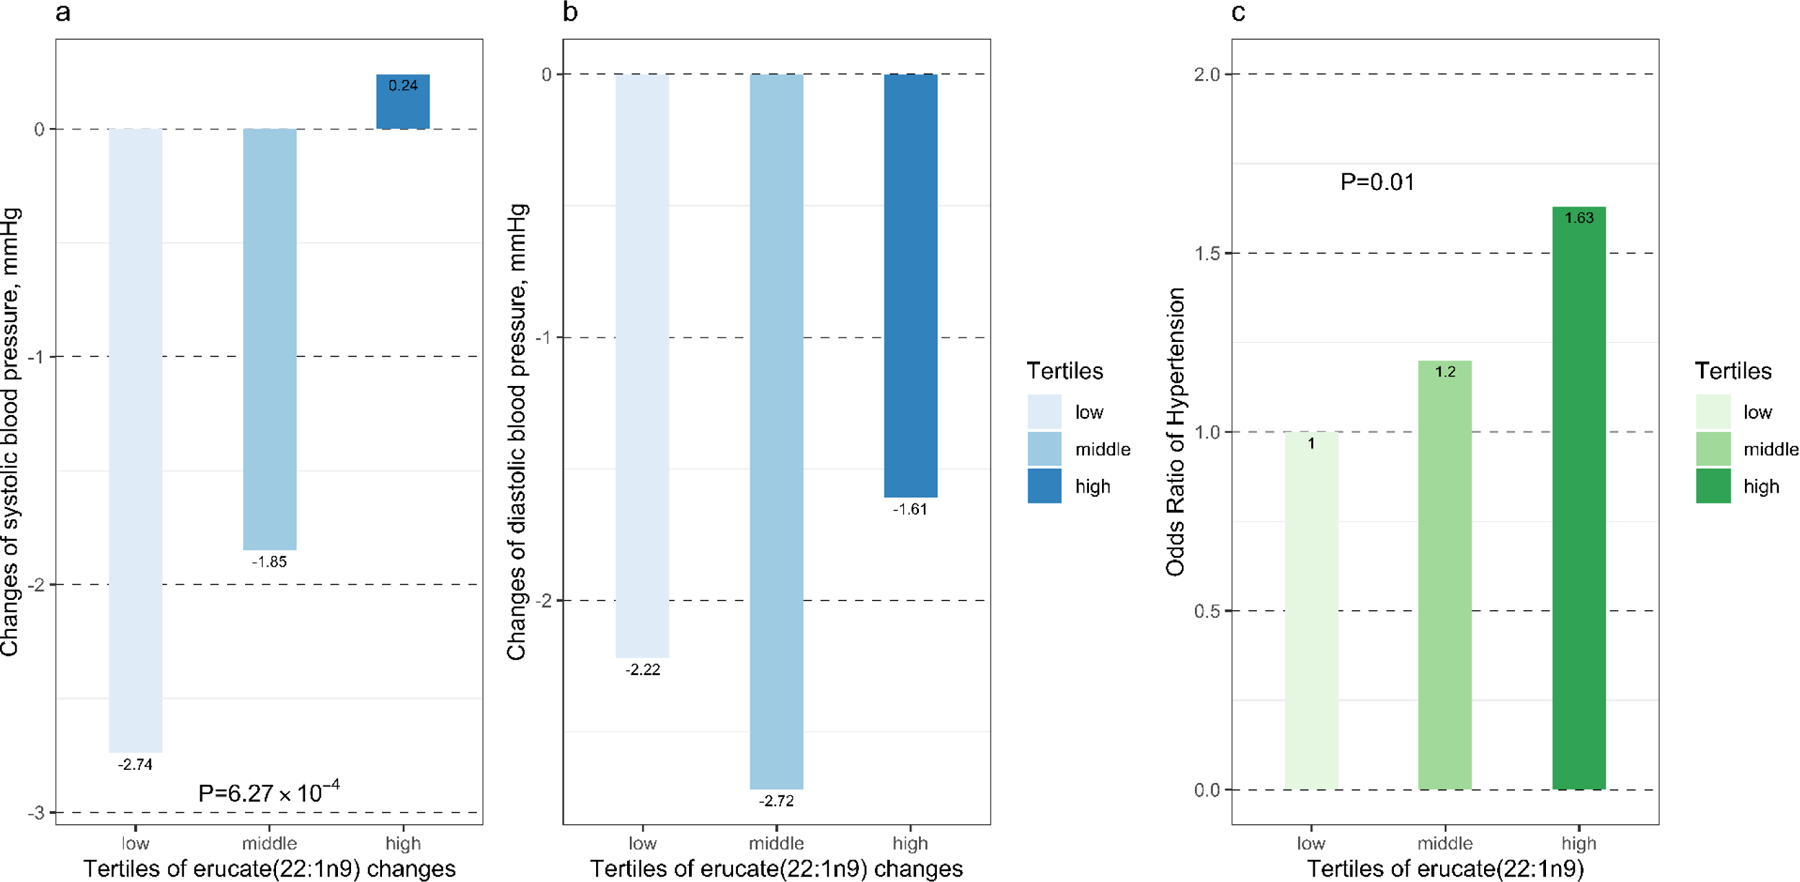
Age, sex, and race adjusted mean changes in systolic (a) and diastolic (b) blood pressure by tertiles of erucate (22:1n9) changes in the Protein and Blood Pressure study and odds of hypertension (c) in the Bogalusa Heart Study by tertiles of erucate (22:1n9). Changes were calculated as metabolite or blood pressure levels at the end of intervention minus those at baseline.
Changes of isobutyrylglycine and isovalerylglycine, two biomarkers for dietary cheese intake,[18, 19] were associated with BP responses differently between soy protein and carbohydrate supplements. In other words, the effects of soy protein intervention on systolic and diastolic BP as compared with carbohydrate control were stronger among individuals with reduced levels of isobutyrylglycine (P for interaction=4·30E-3 and 2·47E-5, respectively) and Isovalerylglycine (P for interaction=0·06 and 5·42E-4, respectively). As shown in Figure 4, in the bottom tertile of isobutyrylglycine changes (isobutyrylglycine was reduced during intervention), soy protein reduced systolic BP by 5·10 (P=0·03) mmHg and diastolic BP by 3·22 (P=0·03) mmHg; while in the top tertile (isobutyrylglycine was increased during intervention), soy protein intervention had no effect on systolic BP (βsoy protein=−0·04, P=0·98) and an increasing effect on diastolic BP (βsoy protein=3·19, P=0·02). Such differences remained after further controlling for baseline levels of the two metabolites. A similar pattern was observed for isovalerylglycine (Figure 4).
Figure 4.

Effect sizes of soy protein supplement on systolic and diastolic blood pressure as compared to carbohydrate control according to tertiles of changes of isobutyrylglycine (a) and isovalerylglycine (b).
Additionally, 75, 143, and 84 metabolites had a net change nominally (P<0·05) associated with systolic and/or diastolic BP responses to carbohydrate, milk protein, and soy protein interventions, respectively (Figures S1). These metabolites were enriched in 16 pathways (Table S4), of which, 7 overlapped with those enriched by metabolites that were changed after dietary interventions. These 7 pathways included amino acids, C24 bile acids, diacylglycerols, dicarboxylic acids, hydroxy fatty acids, monosaccharides, saturated fatty acids, vitamin E, and xanthine.
Metabolites influencing BP responses to dietary interventions
High levels of two acyl choline compounds, dihomo-linolenoyl-choline (P=4·71E-04) and oleoylcholine (P=3·48E-04), at baseline predicted larger BP lowering effects of soy protein interventions. For example, as shown in Figure 5, soy protein intervention decreased systolic BP by 6.85 mm Hg (P<0.0001) among participants with a higher than median level of oleoylcholine, while among those with a lower than median level of this metabolite, soy protein had no significant effect on systolic BP (beta=1.35, P=0.35). Milk protein supplement had similar effects on systolic BP among the two oleoylcholine groups (beta= −5.39 mm Hg, P=0.001; and 0.73 mm Hg, P=0.61).
Figure 5.

Effect sizes of soy and milk protein supplements on systolic blood pressure, as compared to carbohydrate control, by levels of oleoylcholine (a) and dihomo-linolenoyl-choline (b) at baseline.
Metabolites and metabolic pathways influenced by dietary interventions
Levels of 92, 192, and 257 metabolites were nominally changed (P<0·05) after carbohydrate, milk protein, and soy protein interventions, respectively (Figure 6). Most (80·7%) of these metabolites had a reduced level after interventions.
Figure 6.
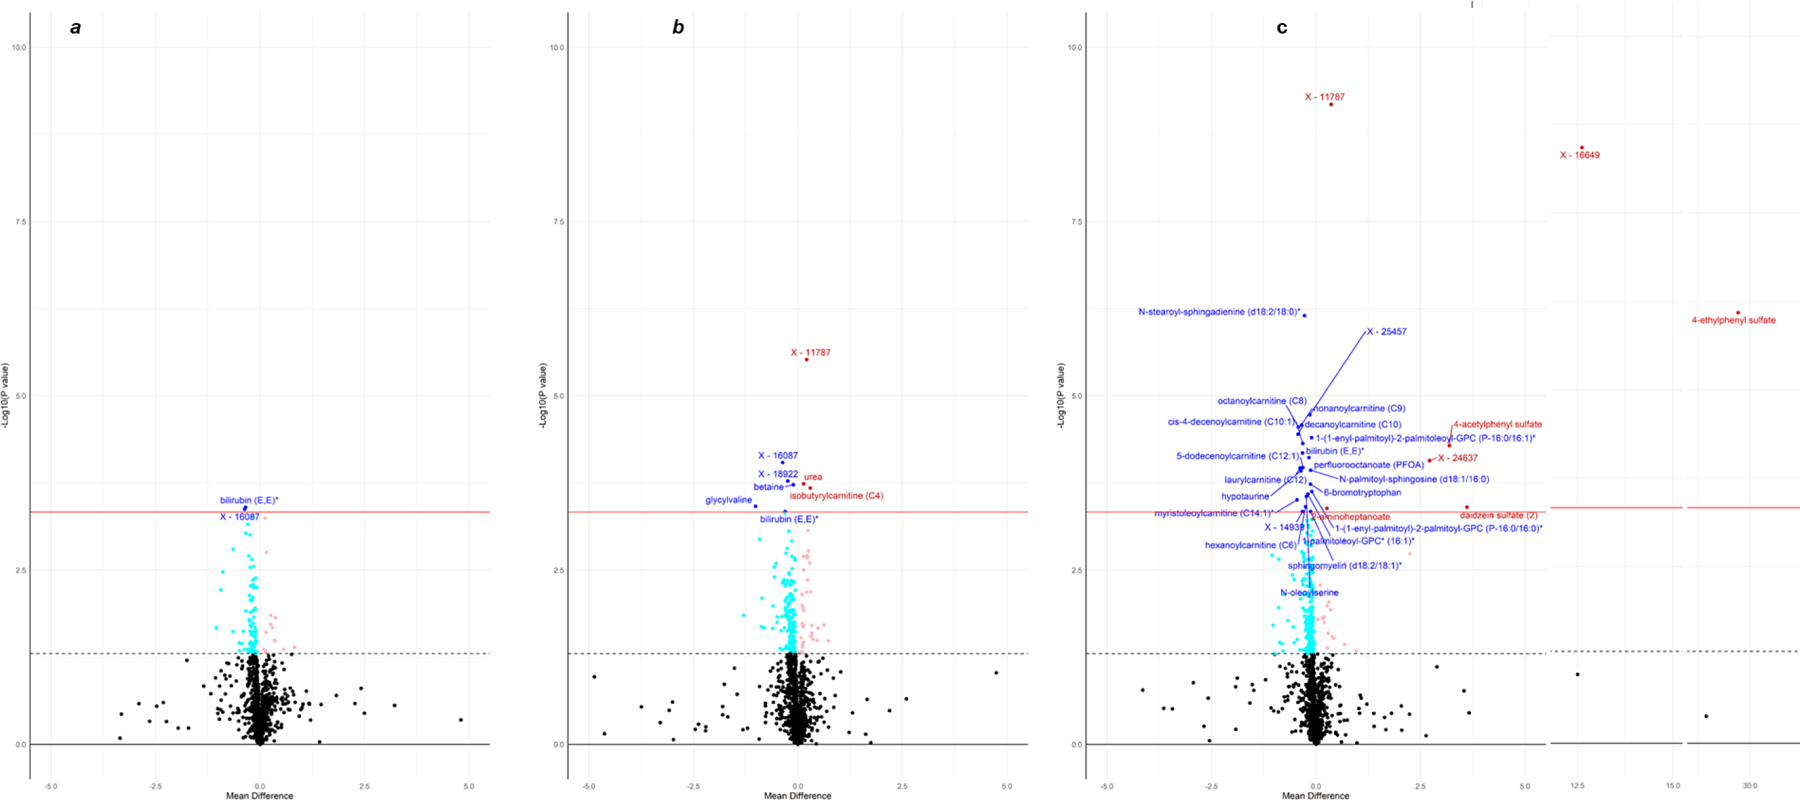
Volcano plots for the comparisons of metabolites between pre-trial baseline and the end of carbohydrate (a), milk protein (b), and soy protein (c). Significantly changed metabolites after Bonferroni correction for 77 independent metabolite clusters (P<4·65E-4) are annotated. The dashed line shows nominal significance level (P=0·05), and the solid red line indicates Bonferroni corrected significance level (P=0·05/77 independent metabolite clusters=4·65E-4). Metabolites with an increased level are shown in light red (P<0·05) and red color (P<4·65E-4), and those with a reduced level are demonstrated in light blue (P<0·05) and blue color (P<4·65E-4).
As shown in Table S1, forty metabolites were significantly changed (P<6·49E-04) after interventions. Of them, fifteen metabolites, including hypotaurine, bilirubin (E,E), peptides glycylvaline and fibrinopeptide B (1–9), xenobiotics perfluorooctanesulfonate (PFOS) and perfluorooctanoate (PFOA), and lipids N-stearoyl-sphingadienine (d18:2/18:0)*, sphingomyelin (d18:2/18:1)*, and acyl carnitine fatty acids C6, C8, C9, C10, C10:1, C12:1, and C14:1 were reduced by all interventions. These metabolites were most significantly reduced after soy protein intervention, except for the two peptides, which were mostly reduced by milk protein intervention. Phosphocholine was the only metabolite that was increased by all interventions. Milk and soy protein interventions both increased urea and decreased 6-bromotrypotophan and lipids PC(16:0/P-18:1(11Z)) and PC(P-16:0/16:1(9Z)). Finally, milk protein intervention uniquely increased isobutyrylcanitine (C4) and decreased betaine levels; and soy protein uniquely increased levels of 4 xenobiotics (4-acetylphenyl sulfate, 4-ethylphenyl sulfate, daidzein sulfate (2), and genistein sulfate*) and reduced levels of 4 lipids [N-palmitoyl-sphingosine (d18:1/16:0), N-oleoylserine, 1-palmitoleoyl-GPC* (16:1)*, and PC(P-16:0/16:0)].
After FDR correction, four pathways, including diacylglycerols (qsoy=0·002, qmilk=5·40E-06, and qcarbohydrate=1), hydroxy fatty acids (qsoy=0·002, qmilk=3·36E-04, and carbohydrate q=1), saturated fatty acids (qsoy=0·01, qmilk=4·03E-07, and qcarbohydrate=1), and vitamin E (qsoy=0·004, qmilk=0·002, and qcarbohydrate=1) were enriched by metabolites that were reduced after soy and milk protein interventions but not by those changed during carbohydrate supplement (Table S2). Finally, four pathways were uniquely enriched by metabolites changed during soy protein (Diacylglycerophosphocholines and N-acyl ethanolamines), milk protein (the Hydantoins pathway), and carbohydrate (the Solanidines and Taurine conjugates pathway) supplements, separately.
Metabolites responded differently to dietary interventions
A total of 18 metabolites showed statistically (P<6·49E-04) different responses to the three dietary supplements. As shown in Tables S3, 14 of the metabolites overlapped with those significantly influenced by an individual dietary supplement, and 4 were new. The 4 metabolites include ceramides N-palmitoyl-heptadecasphingosine (d17:1/16:0)* (P=2·62E-05) and N-stearoyl-sphingosine (d18:1/18:0)* (P=2·87E-04), uridine (P=6·78E-05), and xenobiotics 4-ethylcatechol sulfate (4-ECS, P=6·87E-06). Compared to carbohydrate and/or milk protein interventions, soy protein significantly reduced levels of the two ceramides and increased levels of uridine and 4-ECS.
4. Discussion
In this cross-over, randomized controlled trial of dietary soy protein, milk protein, and carbohydrate supplements, we discovered that an omega-9 fatty acid, erucate (22:1n9), had changes positively associated with systolic BP changes and was associated with higher odds of hypertension in an independent population-based cohort. We further demonstrated that individuals with high levels of acylcholines benefited more in BP reduction from soy protein supplement, while increasing cheese consumption during the trial reduced the BP lowering effect of soy protein supplement. These findings may help to develop more precise and effective dietary intervention programs for hypertension. We also cataloged the first metabolomics profiles in response to the three dietary supplements. We identified that 44 metabolites were significantly changed after supplementation, and 18 responded differently to the three supplements. These metabolites may serve as objective measures of the interventions.
Changes of metabolites and BP in responses to dietary interventions
We discovered that erucate (22:1n9) had changes positively associated with systolic BP change in ProBP and was associated with higher odds of hypertension in BHS. Erucate (22:1n9) is a long chain monounsaturated omega-9 fatty acid that is mainly found in the Brassica family of plants. In feeding studies among animals, erucate (22:1n9) caused cardiac steatosis.[20, 21] In the Cardiovascular Health Study and Atherosclerosis Risk in Communities Study Minnesota sub cohort, monounsaturated omega-9 fatty acid was associated with higher risk of congestive heart failure.[22] Interestingly, this fatty acid in the heart tissue was higher among spontaneously hypertensive rat than normal controls.[23] In addition, this fatty acid was significantly higher in the plasma of chronic thromboembolic pulmonary hypertension patients than healthy controls.[24] Our study provided the first longitudinal evidence that changes of this metabolite was positively associated with systolic BP change. Although efforts have been made to reduce erucate (22:1n9) in edible rapeseed oils, other common food sources of erucate (22:1n9), such as mustard and some salmons,[25] have not drawn much attention.[26] Hypertensive patients should avoid those foods to reduce erucate (22:1n9) intake and improve BP management.
Metabolites modifying BP responses to dietary interventions
Both milk and soy protein supplements showed larger BP lowering effects as compared to carbohydrate control among participants with higher levels of oleoylcholine and dihomo-linolenoyl-choline at baseline than those with lower levels of the two acylcholines. The two acylcholines are modulators of the acetylcholine signaling system and inhibit the neuronal and muscle-type nicotinic acetylcholine receptors,[36] leading to decreased BP.[37] Carbohydrate diet may have prevented the combination of these acylcholines with nicotinic acetylcholine receptors. Interestingly, absence of nicotine, the agonist of nicotinic acetylcholine receptors, led to increased consumption of complex carbohydrate,[38] and reduced intake of dairy.[39] Acylcholines are common dietary supplements. The synergic effects of acylcholines and protein diet on lowering BP warrants further investigation in clinical trials.
Finally, the BP lowering effects of soy protein was diminished among participants with an increased consumption of cheese, as reflected by biomarkers isobutyrylglycine and Isovalerylglycine.[19] Cheese is the top 10 food source of sodium intake in the US. It is possible that the increased sodium intake countered the BP lowering effect of soy protein supplement. Dietary interventions combining soy protein supplements and low salt diet may be more effective in reducing BP.
Plasma metabolome in response to dietary interventions
Dietary interventions mostly reduced levels of plasma metabolite. The reductions may be due to three reasons. First, they could reflect changes in participants’ usual diet. For example, common industrial surfactants, PFOS and PFOA have been used for non-stick cookware coating and are present in human blood.[40] The two metabolites were reduced by all interventions in ProBP, suggesting that participants’ usual diet contained high levels of PFOS and PFOA and replacing part of their usual diet with the supplements reduced the two pollutants. Similarly, one of the pathways enriched by the reduced metabolites was the monoacylglycerols pathway, which contains a series of commonly used food additives.[41] Second, the reduction may be due to low contents of the metabolites in the dietary supplements. Dairy contains a lower level of betaine than wheat and soy protein,[42] and betaine was only significantly reduced after milk protein intervention in ProBP. Third, the reduction of some metabolites may be physiological responses to dietary interventions. Among the 16 significantly reduced lipids, the reduction was most significant after soy protein intervention, which is consistent with previous findings that soy protein improved lipid profile more than carbohydrate and milk protein.[43] It is also noted that PFOS and PFOA had larger reduction during soy protein than the other two dietary interventions. It is possible that some bioactive products of soy protein may have promoted urinary excretion and/or reduced tubular reabsorption. This finding warrants further investigation.
Meanwhile, eleven metabolites were significantly increased after dietary interventions. Some of these metabolites directly originated from the intervention diet. We noted that soy isoflavones daidzein sulfate (2) and genistein sulfate*[44] were significantly increased after soy protein intervention; protein related biomarker, urea, was increased after both soy and milk protein interventions; and isobutyrylcarnitine (C4), a rich metabolite in dairy cows,[45] was significantly increased only after milk protein intervention. The other increased metabolites may reflect responses of the human body to interventions. For example, gut microbiota-derived metabolites 4-ethylphenyl sulfate (4-EPS) and 4-acetylphenyl sulfate (4-APS)[46, 47] were significantly increased after soy protein intervention, while they remained stable after carbohydrate and milk protein interventions. The two metabolites leak into the blood stream when intestinal permeability increases. A previous study discovered that dietary supplementation of Bacteroides fragilis decreased gut permeability and drastically reduced plasma levels of 4-EPS and 4-APS.[47] Interestingly, soy isoflavones can reduce the growth rate of Bacteroides fragilis.[48] It is possible that soy protein diet reduced Bacteroides fragilis and subsequently increased gut permeability, leading to leakage of 4-EPS and 4-APS into the blood stream.
Finally, responses of eighteen metabolites were significantly different among the three interventions. Most of the differences lay between soy protein and the other two interventions. Some of the metabolites, such as xenobiotics daidzein sulfate (2), genistein sulfate can be used as biomarkers for soy protein intake; some, such as 4-EPS, 4-APS, and 4-ECS, may be due to soy protein’s effect on gut microbiome, while others may reflect physiological reactions to the soy protein intervention. It is noted that soy protein intervention significantly increased uridine, a necessary pyrimidine nucleotide that showed beneficial effects on mitochondrial dysfunction and cognitive health. Our study is the first to report an increasing effect of soy protein supplement on plasma uridine.
Findings on metabolites enriched pathways
Pathway diacylglycerols, saturated fatty acids, hydroxy fatty acids, and vitamin E were enriched by metabolites that responded to soy and milk protein interventions but not to carbohydrate intervention. The four pathways were also enriched by metabolites whose changes were associated with BP responses during soy and milk protein interventions but not during carbohydrate intervention. Therefore, the four pathways may reflect the mechanisms underlying BP reducing effects of soy and milk protein. Diacylglycerols have long been identified as a risk factor for hypertension.[27, 28] Similarly, many saturated fatty acids are elevated among hypertensive individuals, and high saturated fatty acids diet increased BP.[29, 30] Hydroxy fatty acids have antifungal, anti-inflammation, and anti-diabetes functions and are produced in the process of food fermentation.[31] There are few studies investigating their role in BP regulation. Our study provided the first evidence of their involvement in BP regulation. The role of vitamin E in BP regulation has been controversial. Some studies reported a negative correlation between vitamin E intake and BP.[32, 33] However, some clinical trials demonstrated no beneficial effects[34] or even a BP increasing effect of vitamin E supplementation.[35] Our study showed that reduction of metabolites in vitamin E metabolism pathway may be beneficial for hypertension.
Strengths and limitations
Our study has important strengths. First, the study was conducted within a high quality randomized controlled trial, in which dietary interventions were implemented with high participant adherence. Therefore, unique plasma metabolites influenced by dietary interventions can be detected. Second, the means of six BP reads obtained at the beginning and end of each dietary intervention, separately, were used to estimate BP responses, which greatly reduced measurement errors. Third, metabolites were repeatedly measured during the trial. This allows us to trace changes of the plasma metabolome. Fourth, metabolomics was profiled using the UPLC-MS/MS by a leading metabolomics company, Metabolon, Inc (Durham, NC), which provided the most comprehensive list of circulating metabolites. Finally, in this cross-over trial, participants were self-compared at different time points, therefore, fixed confounding factors were well controlled.
The relatively small sample size is a main limitation of the current study. This may reduce power to detect moderately changed metabolites. However, we performed pathway enrichment analyses, which should be able to detect metabolic pathways involved by the moderately changed metabolites. Second, the gut microbiome was not measured in the current study. Therefore, it is unclear whether changes of gut microbiota-related metabolites were due to changes in gut bacteria or the abundance of nutrients for relatively stable gut microbiota. Third, dietary nutrient intake was only measured at baseline. Therefore, we were not able to assess whether changes in cheese intake modified the BP lowering effects of soy protein. However, previous research has shown that the two metabolomic markers are good surrogates of cheese intake and may provide more objective measures of cheese intake than dietary recalls. Finally, the unique interaction effects of metabolites need to be evaluated for replication in an independent clinical trial of dietary interventions for hypertension.
Conclusion.
We identified important metabolites that can serve as biomarkers of dietary carbohydrate, milk protein and soy protein supplements and, more importantly, metabolites that reflected changes in participants’ usual diet, gut microbiota, and physiological pathways in response to the supplements. Erucate (22:1n9), an omega-9 fatty acid, increased systolic BP and odds of hypertension. Dietary cheese consumption reduced the BP lowering effects of soy protein supplementation, and acylcholines enhanced the BP lowering effects of both soy and milk protein supplementation.
Clinical implications.
For hypertension patients, it may be helpful to avoid a diet rich in Erucate (22:1n9). Furthermore, cheese intake may decrease the effectiveness of soy protein interventions in lowering BP. Finally, researchers who rely on self-report to study the effects of dietary carbohydrate, soy protein, and milk protein may benefit from switching to collection of metabolite markers to objectively measure dietary intake of these nutrients.
Supplementary Material
Acknowledgment:
The authors thank the ProBP participants.
Funding:
The study was supported by a pilot study grant from the Tulane University Centers of Biomedical Research Excellence (COBRE), award 1P20GM109036–01A1 from the National Institute of General Medical Sciences.
Abbreviations
- 4-ECS
4-ethylcatechol sulfate
- BHS
the Bogalusa Heart Study
- FDR
false discovery rate correction
- PFOA
perfluorooctanoate
- PFOS
perfluorooctanesulfonate
- ProBP
the Protein and Blood Pressure trial
- SBP
systolic blood pressure
- UPLC-MS/MS
ultrahigh performance liquid chromatography-tandem mass spectroscopy
Footnotes
Conflict of Interest: None.
Data described in the manuscript, code book, and analytic code will be made available upon request pending application and approval.
Figure S1. Volcano plots for associations of metabolite changes and systolic blood pressure responses to dietary carbohydrate (a), milk protein (b), and soy protein (c) interventions.
5 References:
- [1].Zhou B, Perel P, Mensah GA, Ezzati M, Global epidemiology, health burden and effective interventions for elevated blood pressure and hypertension. Nat Rev Cardiol 2021, 18, 785–802. [DOI] [PMC free article] [PubMed] [Google Scholar]
- [2].Collaborators GRF, Global, regional, and national comparative risk assessment of 84 behavioural, environmental and occupational, and metabolic risks or clusters of risks, 1990–2016: a systematic analysis for the Global Burden of Disease Study 2016. Lancet 2017, 390, 1345–1422. [DOI] [PMC free article] [PubMed] [Google Scholar]
- [3].Arnett DK, Blumenthal RS, Albert MA, Buroker AB, et al. , 2019 ACC/AHA Guideline on the Primary Prevention of Cardiovascular Disease: A Report of the American College of Cardiology/American Heart Association Task Force on Clinical Practice Guidelines. Circulation 2019, 140, e596–e646. [DOI] [PMC free article] [PubMed] [Google Scholar]
- [4].Whelton PK, Carey RM, Aronow WS, Casey DE, et al. , 2017 ACC/AHA/AAPA/ABC/ACPM/AGS/APhA/ASH/ASPC/NMA/PCNA Guideline for the Prevention, Detection, Evaluation, and Management of High Blood Pressure in Adults: Executive Summary: A Report of the American College of Cardiology/American Heart Association Task Force on Clinical Practice Guidelines. Hypertension 2018, 71, 1269–1324. [DOI] [PubMed] [Google Scholar]
- [5].He J, Wofford MR, Reynolds K, Chen J, et al. , Effect of dietary protein supplementation on blood pressure: a randomized, controlled trial. Circulation 2011, 124, 589–595. [DOI] [PMC free article] [PubMed] [Google Scholar]
- [6].Teunissen-Beekman KF, Dopheide J, Geleijnse JM, Bakker SJ, et al. , Protein supplementation lowers blood pressure in overweight adults: effect of dietary proteins on blood pressure (PROPRES), a randomized trial. Am J Clin Nutr 2012, 95, 966–971. [DOI] [PubMed] [Google Scholar]
- [7].Walker DI, Valvi D, Rothman N, Lan Q, et al. , The metabolome: A key measure for exposome research in epidemiology. Curr Epidemiol Rep 2019, 6, 93–103. [PMC free article] [PubMed] [Google Scholar]
- [8].González-Domínguez R, Jáuregui O, Queipo-Ortuño MI, Andrés-Lacueva C, Characterization of the Human Exposome by a Comprehensive and Quantitative Large-Scale Multianalyte Metabolomics Platform. Anal Chem 2020, 92, 13767–13775. [DOI] [PubMed] [Google Scholar]
- [9].Law WS, Huang PY, Ong ES, Ong CN, et al. , Metabonomics investigation of human urine after ingestion of green tea with gas chromatography/mass spectrometry, liquid chromatography/mass spectrometry and (1)H NMR spectroscopy. Rapid Commun Mass Spectrom 2008, 22, 2436–2446. [DOI] [PubMed] [Google Scholar]
- [10].Llorach R, Urpi-Sarda M, Jauregui O, Monagas M, Andres-Lacueva C, An LC-MS-based metabolomics approach for exploring urinary metabolome modifications after cocoa consumption. J Proteome Res 2009, 8, 5060–5068. [DOI] [PubMed] [Google Scholar]
- [11].Schranner D, Kastenmüller G, Schönfelder M, Römisch-Margl W, Wackerhage H, Metabolite Concentration Changes in Humans After a Bout of Exercise: a Systematic Review of Exercise Metabolomics Studies. Sports Med Open 2020, 6, 11. [DOI] [PMC free article] [PubMed] [Google Scholar]
- [12].Li S, Chen W, Srinivasan SR, Bond MG, et al. , Childhood cardiovascular risk factors and carotid vascular changes in adulthood: the Bogalusa Heart Study 2003, 290, 2271–2276. [DOI] [PubMed] [Google Scholar]
- [13].Gao X, Starmer J, Martin ER, A multiple testing correction method for genetic association studies using correlated single nucleotide polymorphisms. Genet Epidemiol 2008, 32, 361–369. [DOI] [PubMed] [Google Scholar]
- [14].Pang Z, Chong J, Zhou G, de Lima Morais DA, et al. , MetaboAnalyst 5.0: narrowing the gap between raw spectra and functional insights. Nucleic Acids Res 2021, 49, W388–W396. [DOI] [PMC free article] [PubMed] [Google Scholar]
- [15].Kanehisa M, Furumichi M, Sato Y, Ishiguro-Watanabe M, Tanabe M, KEGG: integrating viruses and cellular organisms. Nucleic Acids Res 2021, 49, D545–D551. [DOI] [PMC free article] [PubMed] [Google Scholar]
- [16].Fahy E, Subramaniam S, RefMet: a reference nomenclature for metabolomics. Nat Methods 2020, 17, 1173–1174. [DOI] [PubMed] [Google Scholar]
- [17].O’Donnell VB, Dennis EA, Wakelam MJO, Subramaniam S, LIPID MAPS: Serving the next generation of lipid researchers with tools, resources, data, and training. Sci Signal 2019, 12. [DOI] [PubMed] [Google Scholar]
- [18].Hjerpsted JB, Ritz C, Schou SS, Tholstrup T, Dragsted LO, Effect of cheese and butter intake on metabolites in urine using an untargeted metabolomics approach
- [19].Münger LH, Garcia-Aloy M, Vázquez-Fresno R, Gille D, et al. , Biomarker of food intake for assessing the consumption of dairy and egg products. Genes Nutr 2018, 13, 26. [DOI] [PMC free article] [PubMed] [Google Scholar]
- [20].Bremer J, Norum KR, Metabolism of very long-chain monounsaturated fatty acids (22:1) and the adaptation to their presence in the diet. J Lipid Res 1982, 23, 243–256. [PubMed] [Google Scholar]
- [21].Van Vleet JF, Ferrans VJ, Myocardial diseases of animals. Am J Pathol 1986, 124, 98–178. [PMC free article] [PubMed] [Google Scholar]
- [22].Imamura F, Lemaitre RN, King IB, Song X, et al. , Long-chain monounsaturated Fatty acids and incidence of congestive heart failure in 2 prospective cohorts. Circulation 2013, 127, 1512–1521, 1521e1511–1518. [DOI] [PMC free article] [PubMed] [Google Scholar]
- [23].Li J, Kemp BA, Howell NL, Massey J, et al. , Metabolic Changes in Spontaneously Hypertensive Rat Hearts Precede Cardiac Dysfunction and Left Ventricular Hypertrophy. J Am Heart Assoc 2019, 8, e010926. [DOI] [PMC free article] [PubMed] [Google Scholar]
- [24].Heresi GA, Mey JT, Bartholomew JR, Haddadin IS, et al. , Plasma metabolomic profile in chronic thromboembolic pulmonary hypertension. Pulm Circ 2020, 10, 2045894019890553. [DOI] [PMC free article] [PubMed] [Google Scholar]
- [25].Sissener NH, Ørnsrud R, Sanden M, Frøyland L, et al. , Erucic Acid (22:1n-9) in Fish Feed, Farmed, and Wild Fish and Seafood Products. Nutrients 2018, 10. [DOI] [PMC free article] [PubMed] [Google Scholar]
- [26].Vetter W, Darwisch V, Lehnert K
- [27].Kulkarni H, Meikle PJ, Mamtani M, Weir JM, et al. , Plasma lipidomic profile signature of hypertension in Mexican American families: specific role of diacylglycerols. Hypertension 2013, 62, 621–626. [DOI] [PMC free article] [PubMed] [Google Scholar]
- [28].Kondo J, Yamada Y, Okumura K, Hashimoto H, et al. , 1,2-diacylglycerol content in myocardium from spontaneously hypertensive rats during the development of hypertension. Basic Res Cardiol 1990, 85, 453–460. [DOI] [PubMed] [Google Scholar]
- [29].Simon JA, Fong J, Bernert JT, Serum fatty acids and blood pressure. Hypertension 1996, 27, 303–307. [DOI] [PubMed] [Google Scholar]
- [30].Baranwal G, Pilla R, Goodlett BL, Coleman AK, et al. , Common Metabolites in Two Different Hypertensive Mouse Models: A Serum and Urine Metabolome Study. Biomolecules 2021, 11. [DOI] [PMC free article] [PubMed] [Google Scholar]
- [31].Liang N, Tang K, Curtis JM, Gänzle MG, Identification and Quantitation of Hydroxy Fatty Acids in Fermented Sausage Samples. J Agric Food Chem 2020, 68, 8648–8657. [DOI] [PubMed] [Google Scholar]
- [32].Boshtam M, Rafiei M, Sadeghi K, Sarraf-Zadegan N, Vitamin E can reduce blood pressure in mild hypertensives. Int J Vitam Nutr Res 2002, 72, 309–314. [DOI] [PubMed] [Google Scholar]
- [33].Emami MR, Safabakhsh M, Alizadeh S, Asbaghi O, Khosroshahi MZ, Effect of vitamin E supplementation on blood pressure: a systematic review and meta-analysis. J Hum Hypertens 2019, 33, 499–507. [DOI] [PubMed] [Google Scholar]
- [34].Palumbo G, Avanzini F, Alli C, Roncaglioni MC, et al. , Effects of vitamin E on clinic and ambulatory blood pressure in treated hypertensive patients. Collaborative Group of the Primary Prevention Project (PPP)--Hypertension study. Am J Hypertens 2000, 13, 564–567. [DOI] [PubMed] [Google Scholar]
- [35].Ward NC, Wu JH, Clarke MW, Puddey IB, et al. , The effect of vitamin E on blood pressure in individuals with type 2 diabetes: a randomized, double-blind, placebo-controlled trial. J Hypertens 2007, 25, 227–234. [DOI] [PubMed] [Google Scholar]
- [36].Akimov MG, Kudryavtsev DS, Kryukova EV, Fomina-Ageeva EV, et al. , Arachidonoylcholine and Other Unsaturated Long-Chain Acylcholines Are Endogenous Modulators of the Acetylcholine Signaling System. Biomolecules 2020, 10. [DOI] [PMC free article] [PubMed] [Google Scholar]
- [37].Jutkiewicz EM, Rice KC, Carroll FI, Woods JH, Patterns of nicotinic receptor antagonism II: cardiovascular effects in rats. Drug Alcohol Depend 2013, 131, 284–297. [DOI] [PMC free article] [PubMed] [Google Scholar]
- [38].Morabia A, Curtin F, Bernstein MS, Effects of smoking and smoking cessation on dietary habits of a Swiss urban population. Eur J Clin Nutr 1999, 53, 239–243. [DOI] [PubMed] [Google Scholar]
- [39].Patriota P, Guessous I, Marques-Vidal P, No changes in dietary intake after quitting smoking; a prospective study in Switzerland. BMC Nutr 2021, 7, 34. [DOI] [PMC free article] [PubMed] [Google Scholar]
- [40].Tukker AM, Bouwman LMS, van Kleef RGDM, Hendriks HS, et al. , Perfluorooctane sulfonate (PFOS) and perfluorooctanoate (PFOA) acutely affect human α. Sci Rep 2020, 10, 5311. [DOI] [PMC free article] [PubMed] [Google Scholar]
- [41].Administration, U. S. F. D., in: Services, D. o. H. a. H. (Ed.) 2022.
- [42].Patterson KY, Bhagwat SA, Williams JR, Howe JC, M., H. J., in: Agriculture, U. S. D. o. (Ed.) 2008.
- [43].Wofford MR, Rebholz CM, Reynolds K, Chen J, et al. , Effect of soy and milk protein supplementation on serum lipid levels: a randomized controlled trial. Eur J Clin Nutr 2012, 66, 419–425. [DOI] [PMC free article] [PubMed] [Google Scholar]
- [44].Wang Q, Ge X, Tian X, Zhang Y, et al. , Soy isoflavone: The multipurpose phytochemical (Review). Biomed Rep 2013, 1, 697–701. [DOI] [PMC free article] [PubMed] [Google Scholar]
- [45].Ghaffari MH, Jahanbekam A, Sadri H, Schuh K, et al. , Metabolomics meets machine learning: Longitudinal metabolite profiling in serum of normal versus overconditioned cows and pathway analysis. J Dairy Sci 2019, 102, 11561–11585. [DOI] [PubMed] [Google Scholar]
- [46].Needham BD, Adame MD, Serena G, Rose DR, et al. , Plasma and Fecal Metabolite Profiles in Autism Spectrum Disorder. Biol Psychiatry 2021, 89, 451–462. [DOI] [PMC free article] [PubMed] [Google Scholar]
- [47].Hsiao EY, McBride SW, Hsien S, Sharon G, et al. , Microbiota modulate behavioral and physiological abnormalities associated with neurodevelopmental disorders. Cell 2013, 155, 1451–1463. [DOI] [PMC free article] [PubMed] [Google Scholar]
- [48].Vázquez L, Flórez AB, Guadamuro L, Mayo B, Effect of Soy Isoflavones on Growth of Representative Bacterial Species from the Human Gut. Nutrients 2017, 9. [DOI] [PMC free article] [PubMed] [Google Scholar]
Associated Data
This section collects any data citations, data availability statements, or supplementary materials included in this article.