

Abstract
Objectives:
To investigate the pre-analytics of molecular testing of cytology specimens, we studied the effects of time in refrigerator storage (4°C) of malignant effusions on RNA sequencing (RNAseq) results.
Methods:
Ten effusion specimens were stored in a refrigerator (4°C) for different durations (day 0, 1, 4, and 7). Each specimen was prepared as cytospins fixed in either Carnoy’s solution or 95% ethanol (EtOH) and in an RNA preservative for a fresh frozen (FF) high quality reference. Whole transcriptome (wt) and targeted (t)RNAseq of two multigene expression signatures were performed. We then compared transcript expression level (including mutant allele fraction) according to pre-analytical variables using a concordance correlation coefficient (CCC) and a mixed effect model.
Results:
Sequencing results were mostly stable over increasing times in storage. Cytospins fixed in Carnoy’s solution were more concordant with FF samples than cytospins fixed in 95% EtOH at all timepoints. This finding was consistent for both wtRNAseq (averages: day 0 CCC = 0.98 versus 0.91; day 7 CCC = 0.88 versus 0.78) and tRNAseq methods (averages: day 0 CCC = 0.98 versus 0.81; day 7 CCC = 0.98 versus 0.90). Cytospins fixed in Carnoy’s solution did not show significant change in expression over time points or between expression signatures, whereas 95% EtOH did.
Conclusion:
RNAseq can be accurately performed on effusion specimens after prolonged refrigerator storage. RNA extracted from scraped cytospin slides fixed in Carnoy’s solution was marginally superior to 95% EtOH fixation, but either method had comparable analytic performance to high-quality FF RNA samples.
Keywords: molecular, cytopathology, RNA sequencing, liquid, effusion, cytology processing, fixative
Two-Liner Summary:

Malignant effusions prepared as cytospin slides are viable specimens for RNA sequencing analysis, even when faced with prolonged time in refrigerator storage without preservative solution.
Introduction:
RNA sequencing (RNAseq) of cytology preparations (e.g. stained alcohol-fixed smears) are relatively new to the clinical laboratory and comes with its own diagnostic challenges.1 There is an increasing need for molecular testing on cytology specimens but there is sparse literature on the relevance of pre-analytical effects of sample collection, storage, and processing on RNA sequencing.2,3 Storage of tissue over extended periods prior to nucleic acid extraction causes RNA degradation, but variably alters gene expression patterns.4,5 Furthermore, small biopsy or cytology specimens particularly benefit from liquid preservative due to their high surface area-to-volume ratio.4 We sought to simulate common scenarios for body fluid specimens received in the cytology laboratory, for example an effusion specimen received over a long weekend in refrigerator storage (4°C) until processing in the cytology laboratory several days later.
Whole transcriptome RNA sequencing (wtRNAseq) can provide an unbiased method for comparing gene expression profiles and the influence of pre-analytical conditions, such as fresh frozen (FF) versus formalin-fixed paraffin-embedded (FFPE) tissues.6 Also, different RNA purification kits did not influence gene expression profiling from formalin-fixed paraffin-embedded (FFPE) tissue using targeted RNA sequencing (tRNAseq).6,7 Furthermore, we showed that routine cytologic slide preparations can produce RNA sequencing results that are superior to FFPE cell block preparations, or FFPE tumor sections.8,9 Cytospin slides fixed in Carnoy’s solution or in 95% ethanol (EtOH) demonstrated better overall performance even to other common cytologic preparations.8,9
We chose to study hormone receptor-positive (HR-positive) metastatic breast cancer samples because this represents a common setting for molecular diagnostic testing. Furthermore, we had developed an RNAseq assay to evaluate sensitivity to endocrine therapy in Stage IV disease (SET4) for these patients by measuring the proportion of transcripts with activating mutations in ESR1 along with the non-proliferative transcriptional activity related to estrogen and progesterone receptors (SETER/PR index) as a measure of the principle function of these receptors.10 SETER/PR index has shown to successfully stratify tumor sensitivity to endocrine therapy independent from clinical-pathologic risk factors and from the detection of ESR1 gene mutations and can provide prognostic information for patients with metastatic HR-positive breast cancer.10,11,12,13 Our customized SET4 assay also measures the proportion of transcripts with an activating mutation in exons 9 and 20 of PIK3CA in addition to a 9-gene transcriptional signature (PI3Kges) of activated PIK3CA.10 Phase 3 clinical trials have shown that activating mutations in PIK3CA predict benefit from therapeutic PIK3CA inhibition combined with endocrine therapy.14,15,16 Thus, SET4 assay comprehensively evaluates the status and function of both targeted pathways in this therapeutic combination. The assay also measures selected point mutations in AKT1, PTEN, and ERBB2, and measures the expression level of other single genes (ESR1, PGR, ERBB2, AURKA, FRFR1).17
We previously demonstrated that two common cytologic preparations of malignant effusion specimens (cytospins fixed in Carnoy’s solution and cytospins fixed in 95% EtOH) were similar to optimally prepared fresh frozen (FF) high-quality RNA samples stored in an RNA preservative (RNAlater) and superior to cell blocks (FFPE), ThinPrep, SurePath and air-dried Diff-Quik stained cytospins.8 Therefore, we compared the three best preparation methods (i.e., compared Carnoy’s solution and 95% EtOH fixed cytospins with FF cell pellet) at different durations of refrigerated storage (day 0, 1, 4, and 7) using wtRNAseq and tRNAseq to measure two multigene expression signatures (SETER/PR and PI3Kges), molecular subtype, and common activating mutations. We had two objectives to our study: First, to observe the pre-analytical effects of prolonged refrigeration (4°C) of malignant effusion samples prior to processing in the cytology laboratory on the quality of RNAseq and second, to determine which cytologic preparation method yields the most reliable and accurate results from stored effusion samples.
Methods:
Cytology Samples:
We evaluated residual effusion samples that were delivered directly to the cytology laboratory and contained metastatic carcinoma cells, from 10 patients with history of HR-positive breast cancer. Our study design is summarized in Figure 1. Samples were stored in a refrigerator at 4°C until processing under three different pre-analytical cytologic preparations (FF from RNAlater, cytospins fixed in Carnoy’s solution and cytospins fixed in 95% EtOH) after four durations of storage (day 0, 1, 4, and 7). On each day, residual effusion sample (250–300 ml) was filtered through gauze to remove fibrin clots, then cell pellets were prepared using centrifugation (1,500 rpm for 10 minutes). When the effusion was blood-tinged, we used Ficoll-Hypaque gradient separation to remove blood contents prior to cytospins. Each 2–3 ml aliquot of cell pellet was added to 6 ml Ficoll-Hypaque media and centrifuged at 1,000 rpm for 10 minutes. To wash, the enriched cell preparation (Buffy layer) was obtained, resuspended in 3 ml RPMI and then cytocentrifuged (1,500 rpm for 3 minutes) and the cell pellet was resuspended in RPMI as a cellular sample. The cellular sample was then evenly divided for preparation of 12 cytospin slides and 3 drops were mixed into 0.8 ml RNAlater (Qiagen, Hilden, Germany) at room temperature as the FF sample then stored at −80°C until use. Cytospin slides were prepared in a single cytocentrifugation batch (300 rpm for 3 minutes), then smeared, fixed, stained with Papanicolaou method, coverslipped and stored at room temperature until use. All slides used in this study were positively charged and non-frosted. Six cytospin slides were fixed in modified Carnoy’s solution (60% absolute EtOH, 14% glacial acetic acid, and 26% deionized H20) and six cytospin slides were fixed in 95% EtOH.
Figure 1.

Study design. Abbreviations: FF, fresh frozen; CS_C, cytospin slides fixed in Carnoy’s solution; CS_E, cytospin slides fixed in 95% ethanol.
RNA Extraction Protocols:
A Cytopathologist (WFS) reviewed all the stained slides to ensure adequate representation of malignant cells prior to selection for purification of RNA and molecular testing. A specific cut-off for tumor cellularity was not used, but tumor cellularity was estimated to be at least above 10% for each specimen. Whole slide images of each case are available for review upon request. RNA was extracted from each sample for technical replicates at separate times. For the FF RNA sample, replicates were pulled from the same RNAlater vial. For the cytospin slides, RNA was extracted from 1–2 cytospin slides from each condition and time point. That RNA was used for wtRNAsq and tRNAseq. Subsequently, a replicate RNA sample was extracted from another 1–2 cytospins (and from the residual FF RNAlater vial) to repeat tRNAseq in all samples. Technical replicates were not created for wtRNAseq.
RNA purification kits were used as appropriate for the sample type (Figure 1). The FF samples were thawed at room temperature to completely dissolve any salt precipitate. Equal volumes of ice-cold phosphate buffered saline (pH 7.4) were added to samples followed by centrifugation at 5000 g for 10 minutes. Pellets were resuspended in 5 volumes of QIAzol reagent to homogenize the cells and then mixed with one volume of chloroform for phase separation. After centrifugation at max speed for 15 min at 4°C, the upper aqueous phase was collected and mixed with 1.5 volumes of 100% EtOH. RNA was then extracted using the RNeasy Micro Kit (Qiagen, Hilden, Germany) following the standard protocol. Cytology slides were soaked in xylene for coverslip and residual mounting media removal. Cells were scraped into a 1.5 mL microcentrifuge tube and washed with 100% EtOH. Then, RNA was extracted from the slides from the air-dried pellets using the PicoPure RNA isolation kit (ThermoFisher Scientific, Waltham, MA). RNA concentration was quantified by Nanodrop (Nanodrop Technologies, Wilmington, DE). Isolation protocols used DNase I treatment. An additional ethanol precipitation step was applied to further clean RNA with A260/230 below 1.0. Cytology preparation methods were compared with the FF standard. The minimum input of RNA required for optimal performance of the assays was established to be 25 ng and all specimens in the study reached at least that amount.
Targeted and Whole Transcriptome RNA Sequencing:
tRNAseq was performed with the SET4 assay that measures 18 SETER/PR index transcripts, 10 PI3Kges transcripts, 6 well-known breast cancer mutation hotspots (within ESR1, PIK3CA, AKT1, PTEN, and ERBB2), 10 control transcripts, and transcripts for FGFR1, AURKA, PGR, and ERBB2.17 Unique Molecular Identifier (UMI) based tRNAseq libraries were prepared using a customized protocol.17 A bulk reverse transcription reaction was carried out using gene-specific reverse primers containing UMI and universal adaptor sequences. The resultant cDNA was purified using magnetic beads. Then, the first PCR reaction mix was created by combining the cDNA with gene-specific forward primers and a common reverse primer to the universal adaptor. The RainDance Source system (RainDance Technologies, Billerica, MA) was used to partition this mixture into micro-droplets, which then underwent a PCR reaction of 40 cycles (first PCR). Products were purified and subjected to a second PCR of 10 cycles in order to incorporate RainDance DirectSeq primers for sample indexing and cluster generation. The resultant libraries were quantified by Agilent Bioanalyzer, and sequenced by Illumina MiSeq (Illumina, San Diego, CA) with up to 30 libraries pooled per flow cell. More details of sequencing, library preparation, pre-processing of sequence reads, alignment and quantification can be found in the publication by Fu et al.17
The wtRNAseq libraries were prepared using RNA HyperPrep kit with RiboErase (HMR) (Kapa Biosystems, Wilmington, MA), as we previously described, 100 bp paired-end sequencing was performed on NovaSeq 6000 using S4 Reagent Kit (Illumina, San Diego, CA), with 48 libraries pooled per lane.6,9
Statistical Analysis:
Lin’s concordance correlation coefficient (CCC) was used to measure the concordance of expression of individual genes and breast cancer signatures between different preparation methods and durations of storage to the corresponding FF samples. Correlation (rho) and the genes’ deviation from perfect agreement with corresponding FF sample (bias) were used to understand the lower CCC observations. Principal component analysis was also used to compare variance between fixed effects and methods. Correlations of allele fraction between preparation methods and FF were observed with linear regression analysis. A mixed effect model was developed to compare gene expression and mutant allele frequency over duration of sample storage (day 0, 1, 4, and 7) and sample preparation method (FF and cytospin slides fixed in Carnoy’s solution and 95% EtOH) across 10 malignant effusions.
Results:
Stability of Gene Expression Signatures over Time in Relation to Preparation Method (Concordance Analysis):
Measurements of SETER/PR and PI3Kges gene expression signatures from wtRNAseq and tRNAseq were generally stable during the 7 days of refrigerated sample storage (Figure 2). Cytospins fixed in Carnoy’s solution were more concordant with their corresponding FF samples over the duration of sample storage than cytospins fixed in 95% EtOH compared to FF samples (Table 1, Table 2, Figure 3). The correlation coefficient and the bias coefficient were weaker for cytospin samples fixed in 95% EtOH than those fixed in Carnoy’s (Table 1, Table 2, Figure 3).
Figure 2.

Stability of gene expression signatures over duration of refrigerated storage, according to condition of preservation (fixation). Values of two gene expression signatures, SET ER/PR (left) and PI3Kges (right), according to the duration of sample storage (days) until processing, separated by individual cases (A-J). Solid lines represent fitted mixed-effect models, while the color represents the sample preparation method. Both signatures are calculated from expression data measured using targeted RNA sequencing (A) and whole transcriptome RNA sequencing (B) platforms. Abbreviations: FF, fresh frozen; CS_C, cytospin slides fixed in Carnoy’s solution; CS_E, cytospin slides fixed in 95% ethanol.
Table 1.
Targeted RNA sequencing. Concordance analysis of each gene expression signature (SETER/PR and PI3Kges) measured from cytospin slides versus fresh frozen (FF) RNAlater sample at each time point (day). Abbreviations: N, number of cases; CCC, concordance correlation coefficient; LCI, lower confidence interval; UCI, upper confidence interval; CS_C, cytospin slides fixed in Carnoy’s solution; CS_E, cystopin slides fixed in 95% ethanol.
| Signature | Duration (days) | Method | N | CCC | 95% LCI | 95% UCI | Rho | Bias |
|---|---|---|---|---|---|---|---|---|
| PI3Kges | 0 | CS_C | 10 | 0.98 | 0.91 | 0.99 | 0.98 | 1.00 |
| CS_E | 9 | 0.73 | 0.34 | 0.91 | 0.86 | 0.85 | ||
| 1 | CS_C | 10 | 0.99 | 0.95 | 1.00 | 0.99 | 1.00 | |
| CS_E | 9 | 0.72 | 0.27 | 0.91 | 0.84 | 0.86 | ||
| 4 | CS_C | 10 | 0.98 | 0.91 | 0.99 | 0.98 | 1.00 | |
| CS_E | 10 | 0.83 | 0.50 | 0.95 | 0.88 | 0.94 | ||
| 7 | CS_C | 10 | 0.98 | 0.93 | 1.00 | 0.98 | 1.00 | |
| CS_E | 10 | 0.88 | 0.64 | 0.96 | 0.94 | 0.94 | ||
| SETER/PR | 0 | CS_C | 10 | 0.98 | 0.92 | 1.00 | 0.98 | 1.00 |
| CS_E | 9 | 0.89 | 0.65 | 0.97 | 0.95 | 0.93 | ||
| 1 | CS_C | 10 | 0.99 | 0.95 | 1.00 | 0.99 | 1.00 | |
| CS_E | 9 | 0.91 | 0.74 | 0.97 | 0.98 | 0.94 | ||
| 4 | CS_C | 10 | 0.98 | 0.93 | 0.99 | 0.98 | 1.00 | |
| CS_E | 10 | 0.96 | 0.84 | 0.99 | 0.97 | 0.99 | ||
| 7 | CS_C | 10 | 0.98 | 0.91 | 0.99 | 0.98 | 1.00 | |
| CS_E | 10 | 0.91 | 0.73 | 0.97 | 0.95 | 0.96 |
Table 2.
Whole transcriptome RNA sequencing. Concordance analysis of each gene expression signature (SETER/PR and PI3Kges) measured from cytospin slides versus fresh frozen RNAlater sample at each time point (day). Abbreviations: N, number of cases; CCC, concordance correlation coefficient; LCI, lower confidence interval; UCI, upper confidence interval; CS_C, cytospin slides fixed in Carnoy’s solution; CS_E, cystopin slides fixed in 95% ethanol.
| Signature | Duration (days) | Method | N | CCC | 95% LCI | 95% UCI | Rho | Bias |
|---|---|---|---|---|---|---|---|---|
| PI3Kges | 0 | CS_C | 10 | 0.96 | 0.87 | 0.99 | 0.97 | 0.99 |
| CS_E | 9 | 0.85 | 0.55 | 0.95 | 0.94 | 0.90 | ||
| 1 | CS_C | 10 | 0.96 | 0.85 | 0.99 | 0.97 | 0.99 | |
| CS_E | 10 | 0.77 | 0.44 | 0.92 | 0.89 | 0.87 | ||
| 4 | CS_C | 10 | 0.93 | 0.75 | 0.98 | 0.93 | 1.00 | |
| CS_E | 10 | 0.83 | 0.50 | 0.95 | 0.88 | 0.95 | ||
| 7 | CS_C | 10 | 0.93 | 0.76 | 0.98 | 0.95 | 0.98 | |
| CS_E | 10 | 0.64 | 0.14 | 0.88 | 0.71 | 0.91 | ||
| SET ER/PR | 0 | CS_C | 10 | 0.99 | 0.96 | 1.00 | 0.99 | 1.00 |
| CS_E | 9 | 0.97 | 0.88 | 0.99 | 0.98 | 0.99 | ||
| 1 | CS_C | 10 | 0.99 | 0.95 | 1.00 | 0.99 | 1.00 | |
| CS_E | 10 | 0.96 | 0.85 | 0.99 | 0.97 | 0.98 | ||
| 4 | CS_C | 10 | 0.94 | 0.79 | 0.98 | 0.97 | 0.97 | |
| CS_E | 10 | 0.99 | 0.95 | 1.00 | 0.99 | 0.99 | ||
| 7 | CS_C | 10 | 0.84 | 0.60 | 0.94 | 0.97 | 0.87 | |
| CS_E | 10 | 0.92 | 0.74 | 0.98 | 0.95 | 0.97 |
Figure 3.

Concordance correlation coefficient (CCC) breakdown for CS_C and CS_E compared to FF samples for (A) whole transcriptome RNA sequencing and (B) targeted RNA sequencing.
Principal component analyses of the wtRNAseq and tRNAseq measurements of the 47 genes in the SET4 assay, showed that the patients’ effusion samples most explained the differences in gene expression measurement, followed by duration of storage and cytologic preparation method (Supplementary Figure 1).
Reproducibility of Targeted RNAseq
Measurements of the two multigene signatures (Figure 4A) and the 47 individual genes in the SET4 assay (Figure 4B) were reproducible from replicates of each sample preparation method and each time point. Cytospin slides fixed in 95% EtOH produced more variable SETER/PR measurements at the baseline (day 0) time point, but not at other times (Figure 4A). There were no overall trends observed for the measurements of the 47 individual genes (Figure 4B).
Figure 4.
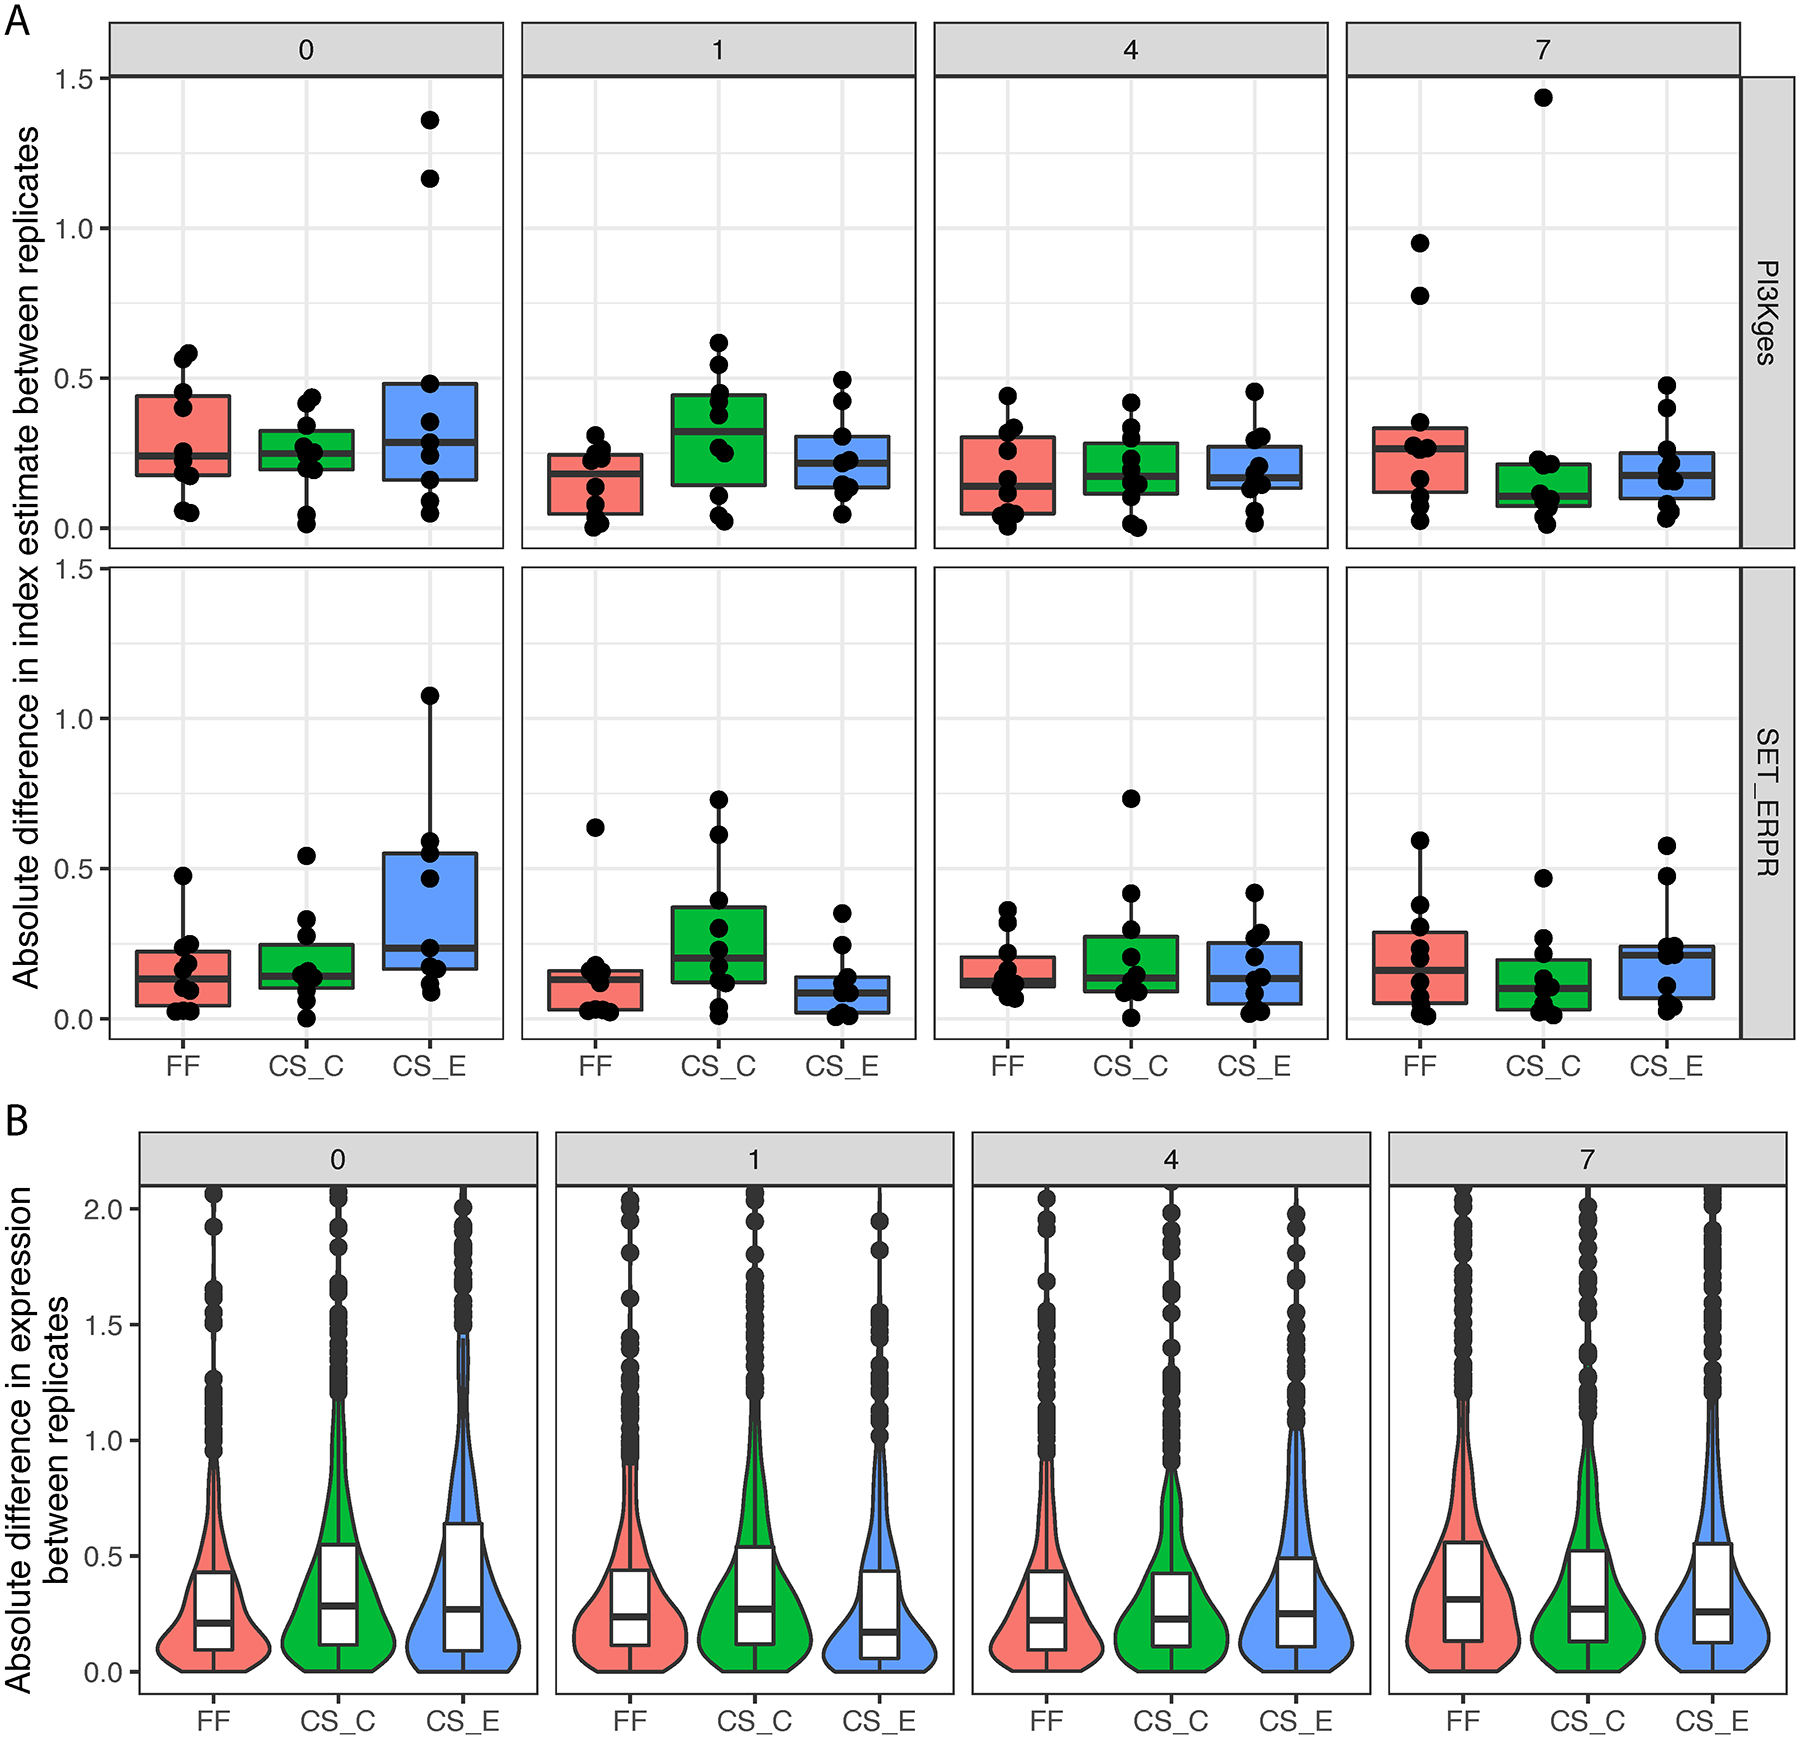
The absolute difference between the two replicates was measured on the targeted RNAseq platform for two gene expression signatures. The absolute difference in index estimate between replicates (A) and 47 genes (B). Abbreviations: FF, fresh frozen; CS_C, cytospin slides fixed in Carnoy’s solution; CS_E, cytospin slides fixed in 95% ethanol.
Mixed Effects Model of Contributions to Variance of Measurement from Targeted RNAseq
The PI3Kges signature demonstrated a statistically significant decrease when measured from cytospins fixed in 95% EtOH, compared to high-quality FF samples (Table 3). The SETER/PR signature demonstrated a statistically significant decrease in gene expression signature over time in storage and higher variance of expression signature for cytospins fixed in 95% EtOH compared to the high-quality FF samples and baseline (day 0) measurements (Table 3). Overall, measurements of both gene expression signatures from cytospin slides fixed in Carnoy’s solution did not change significantly over time, relative to FF RNA. The influences of sample preparation method and duration of sample storage on measurement of each individual gene in the SET4 assay from this mixed effects model are illustrated in Supplementary Figure 2.
Table 3.
Contributions to variance in targeted RNA sequencing to measure the PI3Kges gene expression signature (left) and the SETER/PR gene expression signature (right) in a mixed-effects model including 10 effusion specimens, 4 time points, 3 preparation conditions, and 2 technical replicates. Abbreviations: LCI, lower confidence interval; UCI, upper confidence interval; CS_C, cytospin slides fixed in Carnoy’s solution; CS_E, cystopin slides fixed in 95% ethanol.
| PI3 kinase Signature (PI3Kges) | SETER/PR signature | |||||
|---|---|---|---|---|---|---|
| Variable | Coefficient | Standard Error | P-Value | Coefficient | Standard Error | P-Value |
| Intercept | −1.42 | 0.35 | 2.5E-03 | −0.76 | 0.43 | 1.1E-01 |
| Timepoint | −0.04 | 0.02 | 1.4E-01 | −0.081 | 0.01 | 9.3E-07 |
| Method (CS_C) | 0.05 | 0.08 | 5.4E-01 | 0.06 | 0.07 | 4.1E-01 |
| Method (CS_E) | 0.46 | 0.08 | 1.3E-07 | 0.48 | 0.07 | 5.0E-11 |
| Timepoint:Method (CS_C) | −0.01 | 0.02 | 6.8E-01 | 0.00 | 0.02 | 8.6E-01 |
| Timepoint:Method (CS_E) | −0.020 | 0.020 | 3.32E-01 | −0.03 | 0.02 | 5.80E-02 |
The mixed-effects model analysis showed comparable variance of measurements of the gene expression signatures from sample preparation method or duration of refrigerated sample storage, compared to the high-quality FF sample and baseline measurements (Table 4).
Table 4.
Contributions to variance in targeted RNA sequencing of overall gene expression in a mixed-effects model. Abbreviations: LCI, lower 95% confidence interval; UCI, upper 95% confidence interval; CS_C, cytospin slides fixed in Carnoy’s solution; CS_E, cystopin slides fixed in 95% ethanol.
| Variable | Average | Standard Deviation | Median | 95% LCI | 95% UCI |
|---|---|---|---|---|---|
| Method (CS_C) | 0.07 | 0.43 | −0.06 | −0.77 | 1.31 |
| Method (CS_E) | 0.41 | 0.58 | 0.46 | −0.83 | 1.89 |
| Timepoint | −0.04 | 0.09 | −0.03 | −0.42 | 0.08 |
| Timepoint: Method (CS_C) | −0.01 | 0.04 | −0.01 | −0.12 | 0.10 |
| Timepoint: Method (CS_E) | −0.02 | 0.05 | −0.02 | −0.17 | 0.10 |
Detection of Mutant Transcript Alleles
Any mutation detected at baseline (day 0) was also detected in all of the subsequent time points and using any of the sample preparation methods (Figure 5). Also, most samples maintained the same allele fraction over time, regardless of method (Figure 5).
Figure 5.
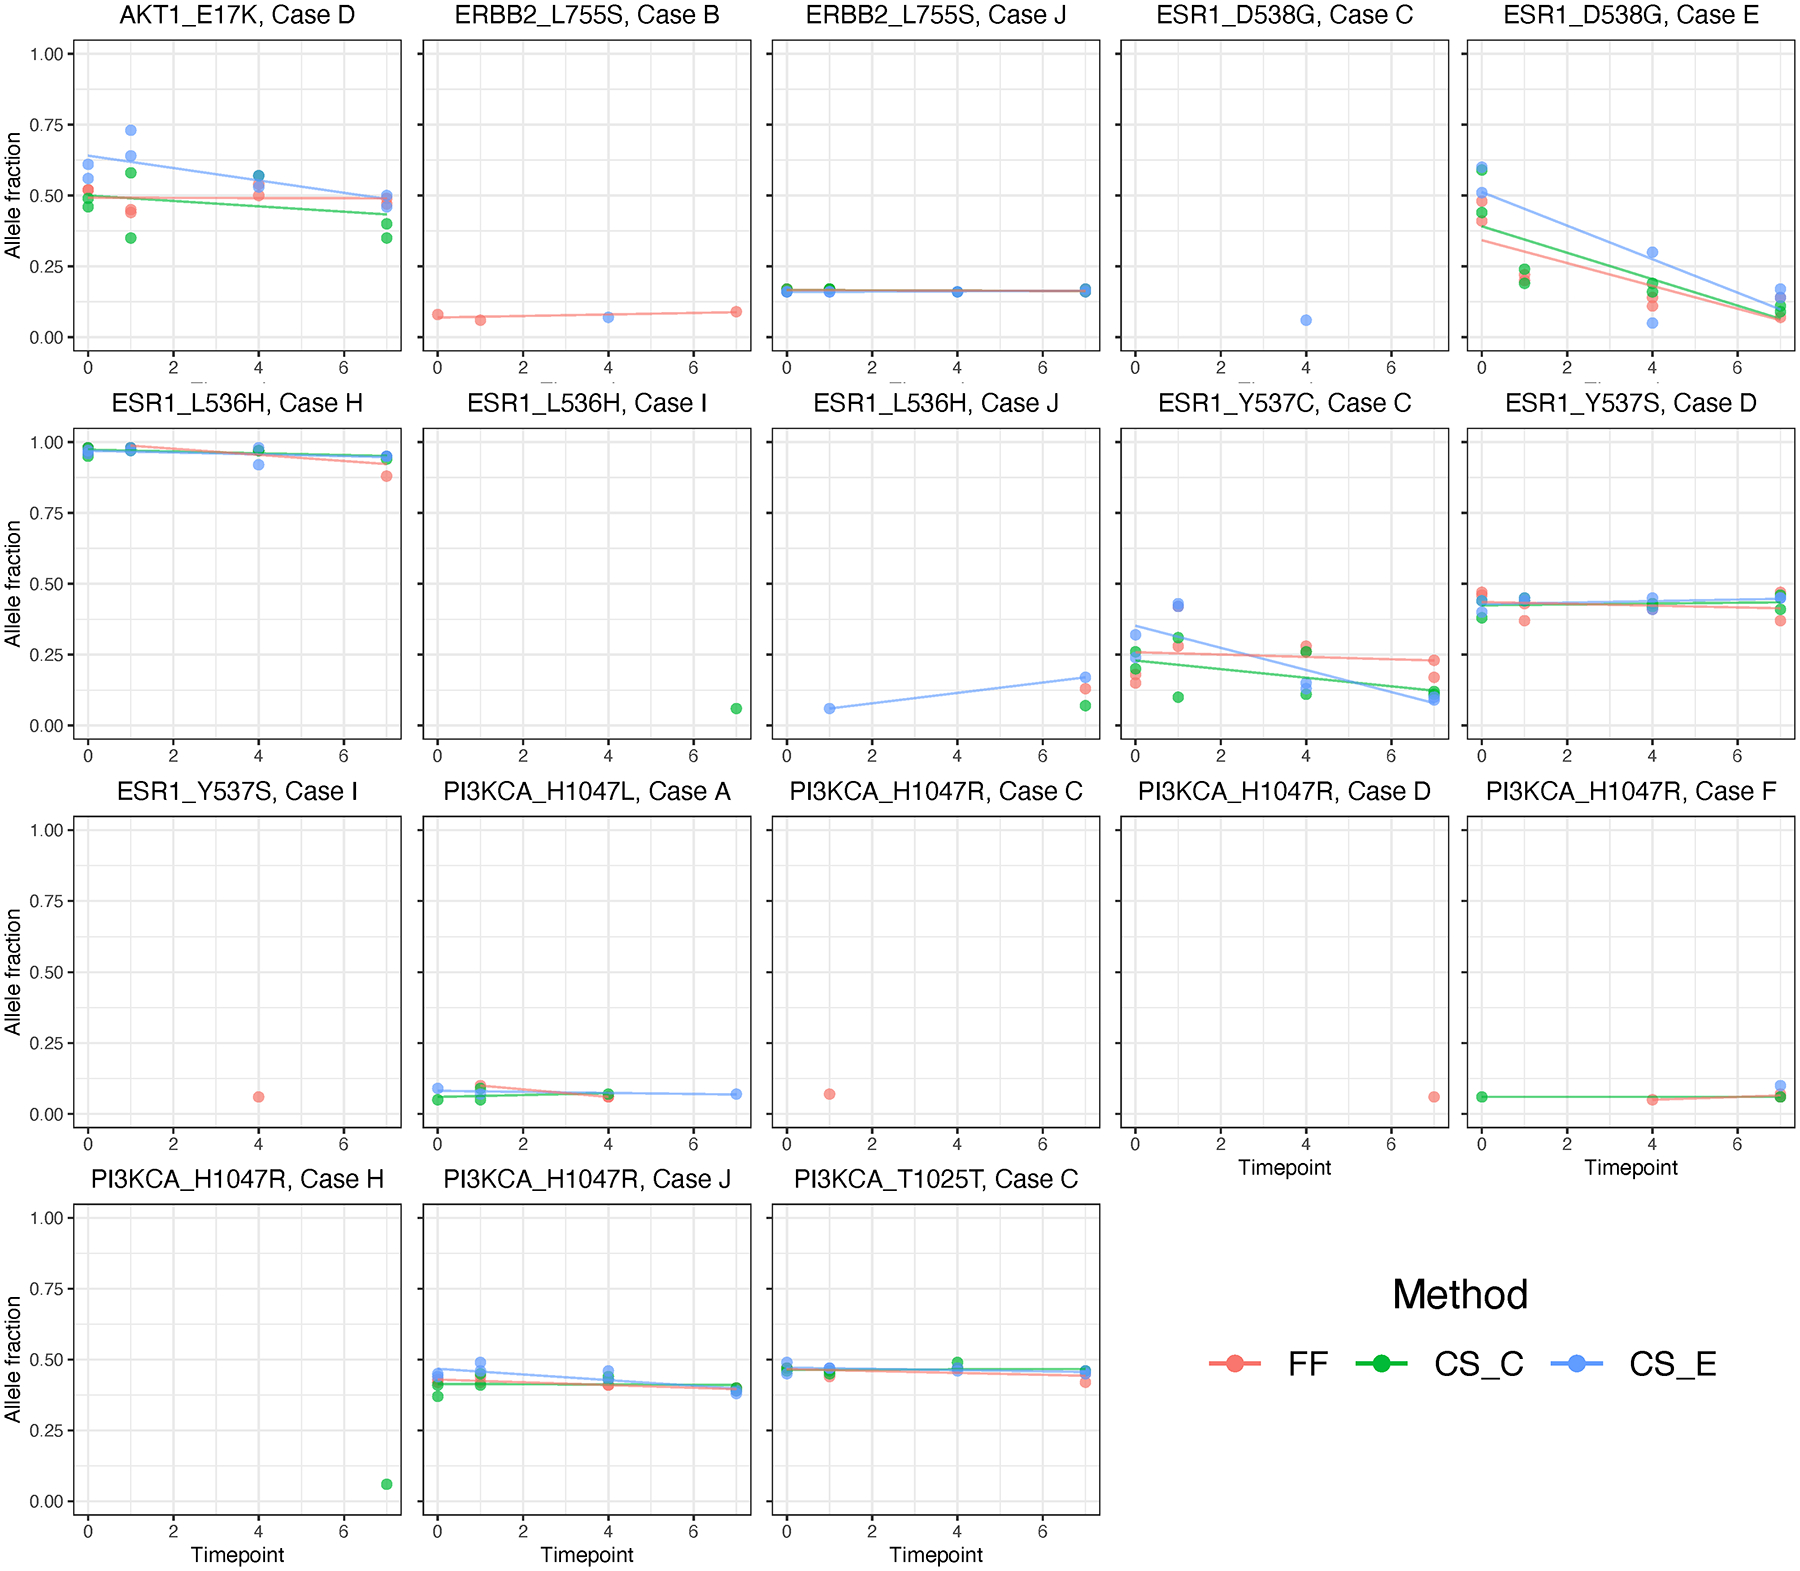
Allele fraction of selected point mutations estimated on targeted RNAseq platform according to the duration of sample storage (days) until processing, for each individual case (A-J). Abbreviations: FF, fresh frozen; CS_C, cytospin slides fixed in Carnoy’s solution; CS_E, cytospin slides fixed in 95% ethanol.
Discussion:
We have shown that cytology effusion specimens can be a reliable source of material for RNAseq analysis of gene expression signatures and transcribed mutations, even when faced with prolonged specimen storage times. In this study we assessed the performance of 10 freshly acquired malignant effusion specimens stored in a refrigerator (4°C) across a one-week timespan (processed at days 0, 1, 4, and 7) from patients with HR-positive breast cancer on wtRNAseq and tRNAseq analysis. The expression of two multigene expression signatures and four relevant activating mutations were compared at each timepoint from each preservation condition. Prolonged refrigeration of effusion samples was designed to simulate typical storage of specimens in clinic and laboratory, for any scenario where specimen processing may be delayed. Measurement of both gene expression signatures, SETER/PR and PIK3ges, appeared to be quite stable over time, with occasional, minimal decay seen at day 7 and this finding held true for both wtRNAseq and tRNAseq. Of note, cytospin slides fixed in Carnoy’s solution and stained with the Papanicolaou method showed essentially equivalent results to high-quality FF samples and demonstrated better overall performance at every time point compared to cytospin slides fixed in 95% EtOH. Additionally, in tRNAseq, cytospins fixed in Carnoy’s solution did not have significant variance of gene expression signature results over the duration of refrigerated specimen storage, while cytospins fixed in 95% EtOH sometimes had small but significant decrease in gene expression signatures, but still detected transcribed mutations.
Overall, when compared to high-quality FF samples, it is important to note that both cytospin slide preparations (Carnoy’s solution and 95% EtOH) showed comparable analytical performance on wtRNAseq and tRNAseq and were mostly stable over long storage times. However, we concluded that cytospin slides fixed in Carnoy’s solution were the marginally superior method for purposes of RNA extraction and sequencing. The more accurate sequencing performance of samples fixed in Carnoy’s solution may be due to its component of acetic acid, which may be more effective at lysis of red blood cells, denaturing proteins, and clearing other components within the effusion specimens than EtOH alone,18,19 thus providing a cleaner initial milieu for optimal RNA extraction.
In both wtRNAseq and tRNAseq analysis, the greatest difference in overall performance (measured as a comparison of concordance of cytospin fixation methods to high-quality reference FF RNA) was seen between effusion cases, followed by timepoints and cytologic preparation methods used (Figure 4). This likely indicates that there are other pre-analytical factors aside from the storage time and preservation method used that are contributing to decreased quality of RNA and subsequent decreased performance on RNA sequencing. Possible factors differing between cases include the status of the patient prior to removal of the effusion fluid, for example, the amount of time the effusion was persistent within the patient, different metabolic derangements occurring in the patient, or the presence of inflammation or infections.
With respect to tRNAseq, contributions to variance, as measured by a mixed effect model using technical replicates, we found that the variability in the data is explained chiefly by two factors that were statistically significant: one being changes over time and another being changes in components (between FF RNA and other fixation methods). Measurements from cytospin slides fixed in Carnoy’s solution did not change significantly over time, relative to FF, in both expression signatures, indicating that Carnoy’s solution can be used to reliably measure RNA expression at different time points (Table 3). Cytospins fixed in 95% EtOH demonstrated significant variability between samples in both SETER/PR and PI3Kges expression indexes. Interestingly, we observed a significant difference in expression between timepoints in only one of the expression indexes, SETER/PR. As for the PI3Kges index, the only variable with significant change was seen in the preparation method, with 95% EtOH fixed cytospins demonstrating significant variability between samples. Each index is a ratio of the geometric means of the target and reference genes, thus we only see a change in index if the change in gene expression is proportionally different. A higher percentage of SETER/PR target genes saw a significant change compared to PI3Kges genes and reference genes.
Currently, the literature recommends strict preanalytical guidelines for storage and processing of body fluids for RNA analysis. For example, body fluids are recommended to be transported immediately to the laboratory on wet ice and stored at 4°C for only a brief period of time with RNA extraction to be performed within a 4–24 hours window from collection time.20,21,22 However, our study has shown that the window of time before specimen processing and RNA extraction can be extended, at least up to 7 days, while still obtaining acceptable quality RNA sequencing results.
Literature discussing the time in storage before preservation and the difference between different cytology preservation solutions on RNA preservation is sparse, especially in regard to extraction from slide preparations. A study by Marczyk et al demonstrated that the selection of kit to purity RNA from FFPE did not influence the quality of results from wtRNAseq.7 We previously reported that high concentration EtOH-based fixatives, such as Carnoy’s solution and 95% EtOH, performed superiorly in terms of retained tumor cellularity, quality of RNA extracted, and performance on RNAseq analysis when compared to low concentration alcohol fixatives, methanol, and formalin.8 So, although FFPE cell blocks would typically be prepared for possible future molecular testing, our studies make the case that extra cytospins fixed in Carnoy’s or 95% EtOH, stained and coverslipped as usual, would provide higher quality RNA substrate for molecular testing, and would still be appropriate practice after several days of refrigerated storage.
There are certain caveats to consider. Our study was limited to 10 malignant effusion specimens that were collected under a supervised research protocol and does not represent the full diversity of specimen handling and fixation methods expected across pathology laboratories or for extracting and sequencing RNA. Measurement of RNA integrity were performed in select specimens in our patient cohort using an Agilent Bioanalyzer 2100 (Agilent Technologies, Santa Clara, CA), and RNA integrity number (RIN) were relatively consistent across time points, however an in depth comparison of RNA integrity and subsequent gene expression analysis was not performed and could be a further point of study. Also, comparison of RNA quantification to DNA was out of scope for the present study and is a possible future addition to this investigation and recommended prior to clinical implementation.
Conclusion:
Molecular testing, RNA sequencing in particular, can be reliably and accurately performed on effusion specimens that were stored in the fridge for up to a week. Cytospin slides, fixed in Carnoy’s solution or 95% EtOH, and stained with the Papanicolaou method can be reviewed under the microscope and subsequently used to measure gene expression using targeted or whole transcriptome RNA sequencing with accuracy that is equivalent to a high-quality fresh-frozen sample. Carnoy’s solution was marginally superior to 95% EtOH fixation of cytospins, but either method had comparable analytic performance to high-quality FF RNA samples. These findings are not only relevant for malignant effusion specimens in ER-positive breast cancer but are applicable to other malignant effusions. Additionally, our findings illustrate the utility of using cytology slides for extraction of RNA and further emphasize the need for more clinical validation of these methods for use in the molecular diagnostic laboratory.
Supplementary Material
Supplementary Figure 1. The principal component analysis plots of genes measured on targeted RNAseq (A) and wtRNAseq (B) platforms. Bottom plots are separated by individual cases. Abbreviations: FF, fresh frozen; CS_C, cytospin slides fixed in Carnoy’s solution; CS_E, cytospin slides fixed in 95% ethanol; PC, principal component.
Supplementary Figure 2. Fixed effect estimates of mixed effects model fitted for each gene measured on targeted RNAseq platform. Red dots represent significant effects (p-value < 0.05). Abbreviations: FF, fresh frozen; CS_C, cytospin slides fixed in Carnoy’s solution; CS_E, cytospin slides fixed in 95% ethanol.
Funding Statement:
This work was supported in part by Federal Funds from the National Cancer Institute, National Institutes of Health, under grant no. 1U01CA215547 (WFS) and in part by grant funding from The Breast Cancer Research Foundation, under grant no. BCRF-158 (WFS).
Footnotes
Conflicts of Interest Statement: WFS and CF are co-inventors on US Patent No. 11,459,617 “Targeted Measure of Transcriptional Activity Related to Hormone Receptors,” issued on October 4, 2022 (applicant proprietor: University of Texas MD Anderson Cancer Center) that is licensed to Delphi Diagnostics. WFS and CF own founder shares of Delphi Diagnostics, without employment or administrative role in the company. Disclosures unrelated to this study: WFS owns shares of IONIS Pharmaceuticals and Eiger Biopharmaceuticals, and has received consulting fees from AstraZeneca during the past 12 months. The other authors have no disclosures.
Ethics approval statement: This study involved human subjects research and was carried out in compliance with the Helsinki Declaration with review and oversight from the Institutional Review Board of MD Anderson Cancer Center (protocol LAB08-0824). The need for informed consent from human subjects specifically for the use of their samples for this research was waived by based on the new and revised Exemption categories (45CFR 46.104), meeting Exemption Category 4(ii): Information, which may include information about biospecimens, is recorded by the investigator in such a manner that the identity of the human subjects cannot readily be ascertained directly or through identifiers linked to the subjects, the investigator does not contact the subjects, and the investigator will not re-identify subjects. Institutional Review Board of MD Anderson Cancer Center approved the waiver of consent.
Data Availability Statement:
The data that support the findings of this study are available from the corresponding author upon reasonable request.
References:
- 1.Byron S, Van Keuren-Jensen K, Engelthaler D, et al. Translating RNA Sequencing into Clinical Diagnostics: Opportunities and Challenges. Nature Rev Genetics. 2016;17(5):257–271. doi: 10.1038/nrg.2016.10 [DOI] [PMC free article] [PubMed] [Google Scholar]
- 2.Huang M, Wei S. Overview of Molecular Testing of Cytology Specimens. Acta Cytol. 2020;64(1–2):136–146. doi: 10.1159/000497187 [DOI] [PubMed] [Google Scholar]
- 3.Bellevicine C, Malapelle U, Vigliar E, et al. How to prepare cytological samples for molecular testing. J Clin Pathol. 2017;70(10):819–826. doi: 10.1136/jclinpath-2017-204561 [DOI] [PubMed] [Google Scholar]
- 4.Hatzis C, Sun H, Yao H, et al. Effects of tissue handling on RNA integrity and microarray measurements from resected breast cancers. J Natl Cancer Inst. 2011;103(24):1871–1883. doi: 10.1093/jnci/djr438 [DOI] [PMC free article] [PubMed] [Google Scholar]
- 5.Chung JY, Braunschweig T, Williams R, et al. Factors in Tissue Handling and Processing that Impact RNA Obtained from Formalin-Fixed, Paraffin-Embedded Tissue. J Histochem Cytochem. 2008;56(11):1033–1042. doi: 10.1369/jhc.2008.951863 [DOI] [PMC free article] [PubMed] [Google Scholar]
- 6.Li J, Fu C, Speed T, et al. Accurate RNA Sequencing From Formalin-Fixed Cancer Tissue to Represent High-Quality Transcriptome From Frozen Tissue. JCO Precis Oncol. 2018;(2):1–9. doi: 10.1200/po.17.00091 [DOI] [PMC free article] [PubMed] [Google Scholar]
- 7.Marczyk M, Fu C, Lau R, et al. The Impact of RNA Extraction Method on Accurate RNA Sequencing from Formalin-Fixed Paraffin-Embedded Tissues. BMC Cancer. 2019;19(1). doi: 10.1186/s12885-019-6363-0 [DOI] [PMC free article] [PubMed] [Google Scholar]
- 8.Sura GH, Tran K, Fu C, et al. Molecular testing opportunities on cytology effusion specimens: the pre-analytic effects of various body fluid cytology preparation methods on RNA extraction quality and targeted sequencing. J Am Soc Cytopathol. 2023;12(1):10–19. doi: 10.1016/j.jasc.2022.09.003 [DOI] [PMC free article] [PubMed] [Google Scholar]
- 9.Marczyk M, Fu C, Lau R, et al. Assessment of stained direct cytology smears of breast cancer for whole transcriptome and targeted messenger RNA sequencing [published online ahead of print, 2023 Jan 17]. Cancer Cytopathol. 2023;10.1002/cncy.22679. doi: 10.1002/cncy.22679 [DOI] [PMC free article] [PubMed] [Google Scholar]
- 10.Sinn B, Fu C, Lau R et al. SETER/PR: A Robust 18-gene Predictor for Sensitivity to Endocrine Therapy for Metastatic Breast Cancer. NPJ Breast Cancer. 2019;5(1). doi: 10.1038/s41523-019-0111-0 [DOI] [PMC free article] [PubMed] [Google Scholar]
- 11.Speers CW, Symmans WF, Barlow WE, et al. Evaluation of the sensitivity to endocrine therapy index and 21-gene breast recurrence score in the SWOG S8814 trial. J Clin Oncol. 2023. doi: 10.1200/jco.22.01499 [DOI] [PMC free article] [PubMed] [Google Scholar]
- 12.Du L, Yau C, Brown-Swigart L, et al. Predicted sensitivity to endocrine therapy for stage II-III hormone receptor-positive and HER2-negative (HR+/HER2-) breast cancer before chemo-endocrine therapy. Ann Oncol. 2021;32(5):642–651. doi: 10.1016/j.annonc.2021.02.011 [DOI] [PMC free article] [PubMed] [Google Scholar]
- 13.Suman VJ, Du L, Hoskin T, et al. Evaluation of Sensitivity to Endocrine Therapy Index (SET2,3) for Response to Neoadjuvant Endocrine Therapy and Longer-Term Breast Cancer Patient Outcomes (Alliance Z1031). Clin Cancer Res. 2022;28(15):3287–3295. doi: 10.1158/1078-0432.CCR-22-0068 [DOI] [PMC free article] [PubMed] [Google Scholar]
- 14.Loi S, Haibe-Kains B, Majjaj S, et al. PIK3CA Mutations Associated with Gene Signature of Low mTORC1 Signaling and Better Outcomes in Estrogen Receptor-Positive Breast Cancer. Proc Natl Acad Sci USA. 2010;107(22):10208–13. [DOI] [PMC free article] [PubMed] [Google Scholar]
- 15.Andre F, Ciruelos E, Rubovszky G, et al. Alpelisib for PIK3CA-Mutated, Hormone Receptor-Positive Advanced Breast Cancer. N Engl J Med. 2019;380(20):1929–40. [DOI] [PubMed] [Google Scholar]
- 16.Luen SJ, Asher R, Lee CK, et al. Association of Somatic Driver Alterations with Prognosis in Postmenopausal, Hormone Receptor-Positive, HER2-Negative Early Breast Cancer: A Secondary Analysis of the BIG 1–98 Randomized Clinical Trial. JAMA Oncol. 2018;4(10):1335–43. [DOI] [PMC free article] [PubMed] [Google Scholar]
- 17.Fu C, Marczyk M, Samuels M et al. Targeted RNAseq Assay Incorporating Unique Molecular Identifiers for Improved Quantification of Gene Expression Signatures and Transcribed Mutation Fraction in Fixed Tumor Samples. BMC Cancer. 2021;21(1). 10.1186/s12885-021-07814-8 [DOI] [PMC free article] [PubMed] [Google Scholar]
- 18.Howat WJ, Wilson BA. Tissue fixation and the effect of molecular fixatives on downstream staining procedures. Methods. 2014;70(1):12–19. doi: 10.1016/j.ymeth.2014.01.022 [DOI] [PMC free article] [PubMed] [Google Scholar]
- 19.Goldring JPD. The Roles of Acetic Acid and Methanol During Fixing and Staining Proteins in an SDS-Polyacrylamide Electrophoresis Gel. Methods Mol Biol. 2018;1853:15–18. doi: 10.1007/978-1-4939-8745-0_2 [DOI] [PubMed] [Google Scholar]
- 20.Boyanton B Jr, Crisan D . Sample Collection, Processing, and Storage for Molecular Genetic Testing. In: Kottke-Marchant K, Davis B, editors. Lab Hematol Practice. 1st ed. West Sussex, UK: Wiley-Blackwell; 2012. pp. 145–54. [Google Scholar]
- 21.O’Leary TJ, Ben-Ezra J, Domer PH, Fletcher JA, Griffin CA, Kaul K, et al. Specimen Transport and Storage. In: Polgar P, editor. Nucleic acid amplification assays for molecular hematopathology; approved guideline. Pennsylvania, USA: CLSI; 2003. p. 8. [Google Scholar]
- 22.Sotoudeh Anvari M, Gharib A, Abolhasani M, et al. Pre-analytical Practices in the Molecular Diagnostic Tests, A Concise Review. Iran J Pathol. 2021;16(1):1–19. doi: 10.30699/ijp.2020.124315.2357 [DOI] [PMC free article] [PubMed] [Google Scholar]
Associated Data
This section collects any data citations, data availability statements, or supplementary materials included in this article.
Supplementary Materials
Supplementary Figure 1. The principal component analysis plots of genes measured on targeted RNAseq (A) and wtRNAseq (B) platforms. Bottom plots are separated by individual cases. Abbreviations: FF, fresh frozen; CS_C, cytospin slides fixed in Carnoy’s solution; CS_E, cytospin slides fixed in 95% ethanol; PC, principal component.
Supplementary Figure 2. Fixed effect estimates of mixed effects model fitted for each gene measured on targeted RNAseq platform. Red dots represent significant effects (p-value < 0.05). Abbreviations: FF, fresh frozen; CS_C, cytospin slides fixed in Carnoy’s solution; CS_E, cytospin slides fixed in 95% ethanol.
Data Availability Statement
The data that support the findings of this study are available from the corresponding author upon reasonable request.