

Abstract
Objective:
To determine the extent to which counting observation stays changes hospital performance on 30-day readmission measures.
Methods:
This was a retrospective study of inpatient admissions and observation stays among fee-for-service Medicare enrollees in 2017. We generated 3 specifications of 30-day risk-standardized readmissions measures: the Hospital wide Readmission Measure (HWR) measure utilized by the Centers for Medicare and Medicaid Services (CMS), which captures inpatient readmissions within 30 days of inpatient discharge; an expanded HWR (eHWR) measure, which captures any unplanned hospitalization (inpatient admission or observation stay) within 30-days of inpatient discharge; an all-hospitalization readmission (AHR) measure, which captures any unplanned hospitalization following any hospital discharge (observation stays are included in both the numerator and denominator of the measure). Estimated excess readmissions for hospitals were compared across the 3 measures. High performers were defined as those with a lower-than-expected number of readmissions whereas low performers had higher-than-expected or excess readmissions. Multivariable logistic regression identified hospital characteristics associated with worse performance under the measures that included observation stays.
Results:
Our sample had 2,586 hospitals with 5,749,779 hospitalizations. Observation stays ranged from 0% to 41.7% of total hospitalizations. Mean (SD) readmission rates were 16.6% (5.4) for the HWR, 18.5% (5.7) for the eHWR, and 17.9% (5.7) in the AHR. Approximately 1 in 7 hospitals (14.9%) would switch from being classified as a high performer to a low performer or vice-versa if observation stays were fully included in the calculation of readmission rates. Safety net hospitals and those with a higher propensity to use observation would perform significantly worse.
Conclusions:
Fully incorporating observation stays in readmission measures would substantially change performance in value-based programs for safety net hospitals and hospitals with high rates of observation stays.
INTRODUCTION
Hospital readmissions are a significant and potentially preventable source of spending in the Medicare population.1 Accordingly, the Centers for Medicare and Medicaid Services (CMS) has sought to tie provider reimbursement to readmission rates in several of its quality programs. The most notable of these is the Hospital Readmissions Reduction Program (HRRP), which penalizes hospitals for higher-than-expected readmissions following inpatient discharge for 6 clinical conditions.2 However, readmission measures are also important benchmarks of accountable care organization (ACO) performance in the Medicare Shared Savings Program, provider group performance in the Merit Based Incentive Program, and nursing home performance under the Skilled Nursing Facility Value Based Purchasing program, among others.2
A significant criticism of the HRRP—and readmission quality measures in general—is that they fail to include observation stays in the calculation of risk-standardized readmission rates.3 Hospital observation is an outpatient service originally intended to allow physicians to bill for a short period of monitoring or treatment (usually < 24 hours) to determine if a patient requires inpatient admission.4 However, CMS policies like the Recovery Audit Contract program and 2-Midnight Rule (both of which aimed to ensure that hospitals were using observation billing codes for appropriate short hospitalizations) greatly expanded the use of observation stays among hospitals.5–7 From 2011 to 2016, Medicare spending for observation stays increased by 349%8 such that, today, nearly 1 in 5 of Medicare enrollees complete their hospital treatment as outpatients under observation.9
Although policymakers have debated whether to include observation stays in readmission measures for more than a decade,10 there remains a lack of consensus. Hospitals argue that observation stays are qualitatively different than inpatient admissions and should be excluded from readmission measures. However, only a minority of observation patients receive treatment in settings such as a dedicated observation unit, post-acute care unit, or emergency department, with the vast majority cared for on a general hospital ward, otherwise clinically indistinguishable from an inpatient admission.11,12 Research suggests that observation stays have largely substituted for hospitalizations that would have been billed as inpatient admissions in the past, rather than reflect the growth of a unique population of patients.13 More recently, CMS has moved to capture observation stays in some of its quality programs, including the incorporation of the Excess Days in Acute Care (EDAC) measure in the Hospital Inpatient Quality Reporting program and adding observation stays to the Plan All Cause Readmissions measure utilized in the Medicaid Adult Core and Home Health Core measure sets.14
The continued omission of observation stays from readmission measures has important ramifications. First, it provides an incomplete picture of the care that a hospital or other provider delivers. Hospitals vary widely in their use of observation,15,16 which may result in misclassification of their true performance based on local observation practices, capacity, and financial pressures. Second, it provides an incomplete picture of trends in patient outcomes over time at the population level. Indeed, much of the decline in readmissions over the past decade can be explained by the growth of observation stays.17–19 Third, current readmission measures do not align with the patient experience. Articles in the lay press have highlighted the confusion that patients experience when they receive higher bills as a result of their hospitalization being classified as outpatient, indicating that patients do not distinguish a difference between types of hospitalizations.20–22 Including observation stays in the calculation of readmission measures is arguably the most important step for capturing holistic, patient-centered outcomes through readmissions measures in quality programs. To date, the implications of expanding readmission measures to include observation stays for hospital performance are unclear.
This study aimed to determine the extent to which including observation stays in 30-day risk-standardized readmission measures would change the assessment of hospital quality performance. We also sought to determine the characteristics of hospitals that may be adversely impacted by implementing a more holistic and patient-centered readmission measure that incorporates observation stays.
METHODS
Data & Study Population
We examined inpatient admissions and observation stays at short term hospitals in 100% Medicare fee-for-service claims during calendar year 2017. Observation stays were identified from outpatient claims with a revenue center code of 0760 or 0762. We used the same hospital- and patient-level inclusion and exclusion criteria as CMS’ hospital wide readmission (HWR) measure to identify our study population,23 applying these criteria to both inpatient and observation stay discharges. To capture hospital characteristics, we linked publicly available data on hospital size, ownership, teaching status, public payer mix, case-mix (safety-net status and Medicare share of hospitalizations), rurality, operating margins, and hospital occupancy from the Medicare Hospital Cost Reports for 2017.24 We excluded 60 hospitals who were outliers (defined as 1.5x the IQR above 75th percentile) with respect to observation stay use as well as hospitals that did not contribute data in the Hospital Cost Reports. To characterize safety net status, we classified hospitals into quintiles based on the proportion of total hospitalizations occurring among individuals dually eligible for both Medicare and Medicaid, defining those in the highest quintile as safety net hospitals.25,26 Operating margin was calculated as the difference between net patient revenue and operating expenses, divided by net patient revenue.27
Readmission Measures
We constructed 3 alternate specifications of 30-day risk standardized readmissions measures. As our base measure, we generated CMS’ HWR measure for each hospital, which captures unplanned inpatient readmissions within 30 days of inpatient discharge. Next, we created an expanded HWR (eHWR) measure, which captures any unplanned hospitalization (either inpatient admission or observation stay) within 30 days of discharge (e.g. observation stays included in the numerator only). Finally, we created an all-hospitalization (AHR) readmission measure, which captures any unplanned hospitalization following any index hospital discharge (observation stays included in both the numerator and denominator). Thirty-day risk-standardized readmission rates and excess readmission ratios (ERR) from hierarchical logistic regression models for each of the 3 alternate measures were generated using the methods outlined in the HWR 2017 Measure update.23 Our only deviation from this was an adjustment for primary diagnosis using indicators for the condition group assigned by Clinical Classification Software from the Agency for Healthcare Research and Quality directly,28 rather than the 5 broad diagnosis cohorts (surgery, cardiovascular, cardiorespiratory, neurological, medicine) used by the HWR measure. This modification was necessary because Medicare outpatient records lack International Classification of Diseases, 10th Revision (ICD-10) procedure codes needed to replicate the surgical cohort among individuals with observation stays. We then dichotomized performance as follows: an ERR >1 indicated low performance (i.e., a higher-than-expected number of readmissions), whereas an ERR <1 indicated high performance (i.e., a lower-than-expected number of readmissions).
Statistical Analysis
To determine how hospital performance would change under alternate measures incorporating observation stays, we first identified hospitals that showed any decline in performance (rounded to ERR of 0.01) under each alternative measure compared to the base measure, irrespective of the magnitude of that decline. Next, because this approach categorizes hospitals as having a decline in performance even in cases where the estimated increase in readmissions is trivial or in which the hospital remains a high performer after recalculation, we also assessed the proportion of hospitals that switched between low and high performance. Next, we used multivariable logistic regression to identify hospital characteristics associated with a) any decline in performance and b) switching performance status. We conducted analyses in SAS version 9.4 and Stata version 16. This study uses de-identified claims and was determined to be exempt by the institutional review board at the University of Washington.
RESULTS
Our analytic sample included 2,586 hospitals with 5,749,779 hospitalizations in 2017 (Appendix Figure A1). Across the hospitals in our sample, the proportion of observation stays ranged from 0% to 41.7% of total hospitalizations. The mean (SD) HWR measure was 16.1% (1.4). This increased to 17.9% (1.5) under the eHWR measure, when observation stays were counted as readmission events after an inpatient discharge, and 17.3% (2.8) in the AHR measure, when observation stays were counted as both readmission events and index discharges.
Performance Under Alternate Measures
When we recalculated hospitals’ readmission rates using the eHWR and AHR measures, 1,088 (42.1%) and 1,019 (39.4%) hospitals had worse performance, respectively, though changes were generally small. Among those with any decline in performance, the average shift in readmission rates was 0.53 (0.44) percentage points for the eHWR measure (corresponding to 9 additional rehospitalizations on average and an 8.4% relative change), and 0.57 (0.57) percentage points for the AHR measure (corresponding to 17 additional rehospitalizations on average and an 9.1% relative change). Slightly more hospitals, 1,498 (57.9%) and 1,567 (60.6%), improved under the eHWR and AHR measures. This average shift in readmission rates was −0.49 (0.52) percentage points, or a 7.8% relative decrease and −0.52 (0.38) percentage points or an 8.3% relative decrease for the two measures, respectively (or 10 and 12 fewer rehospitalizations, respectively).
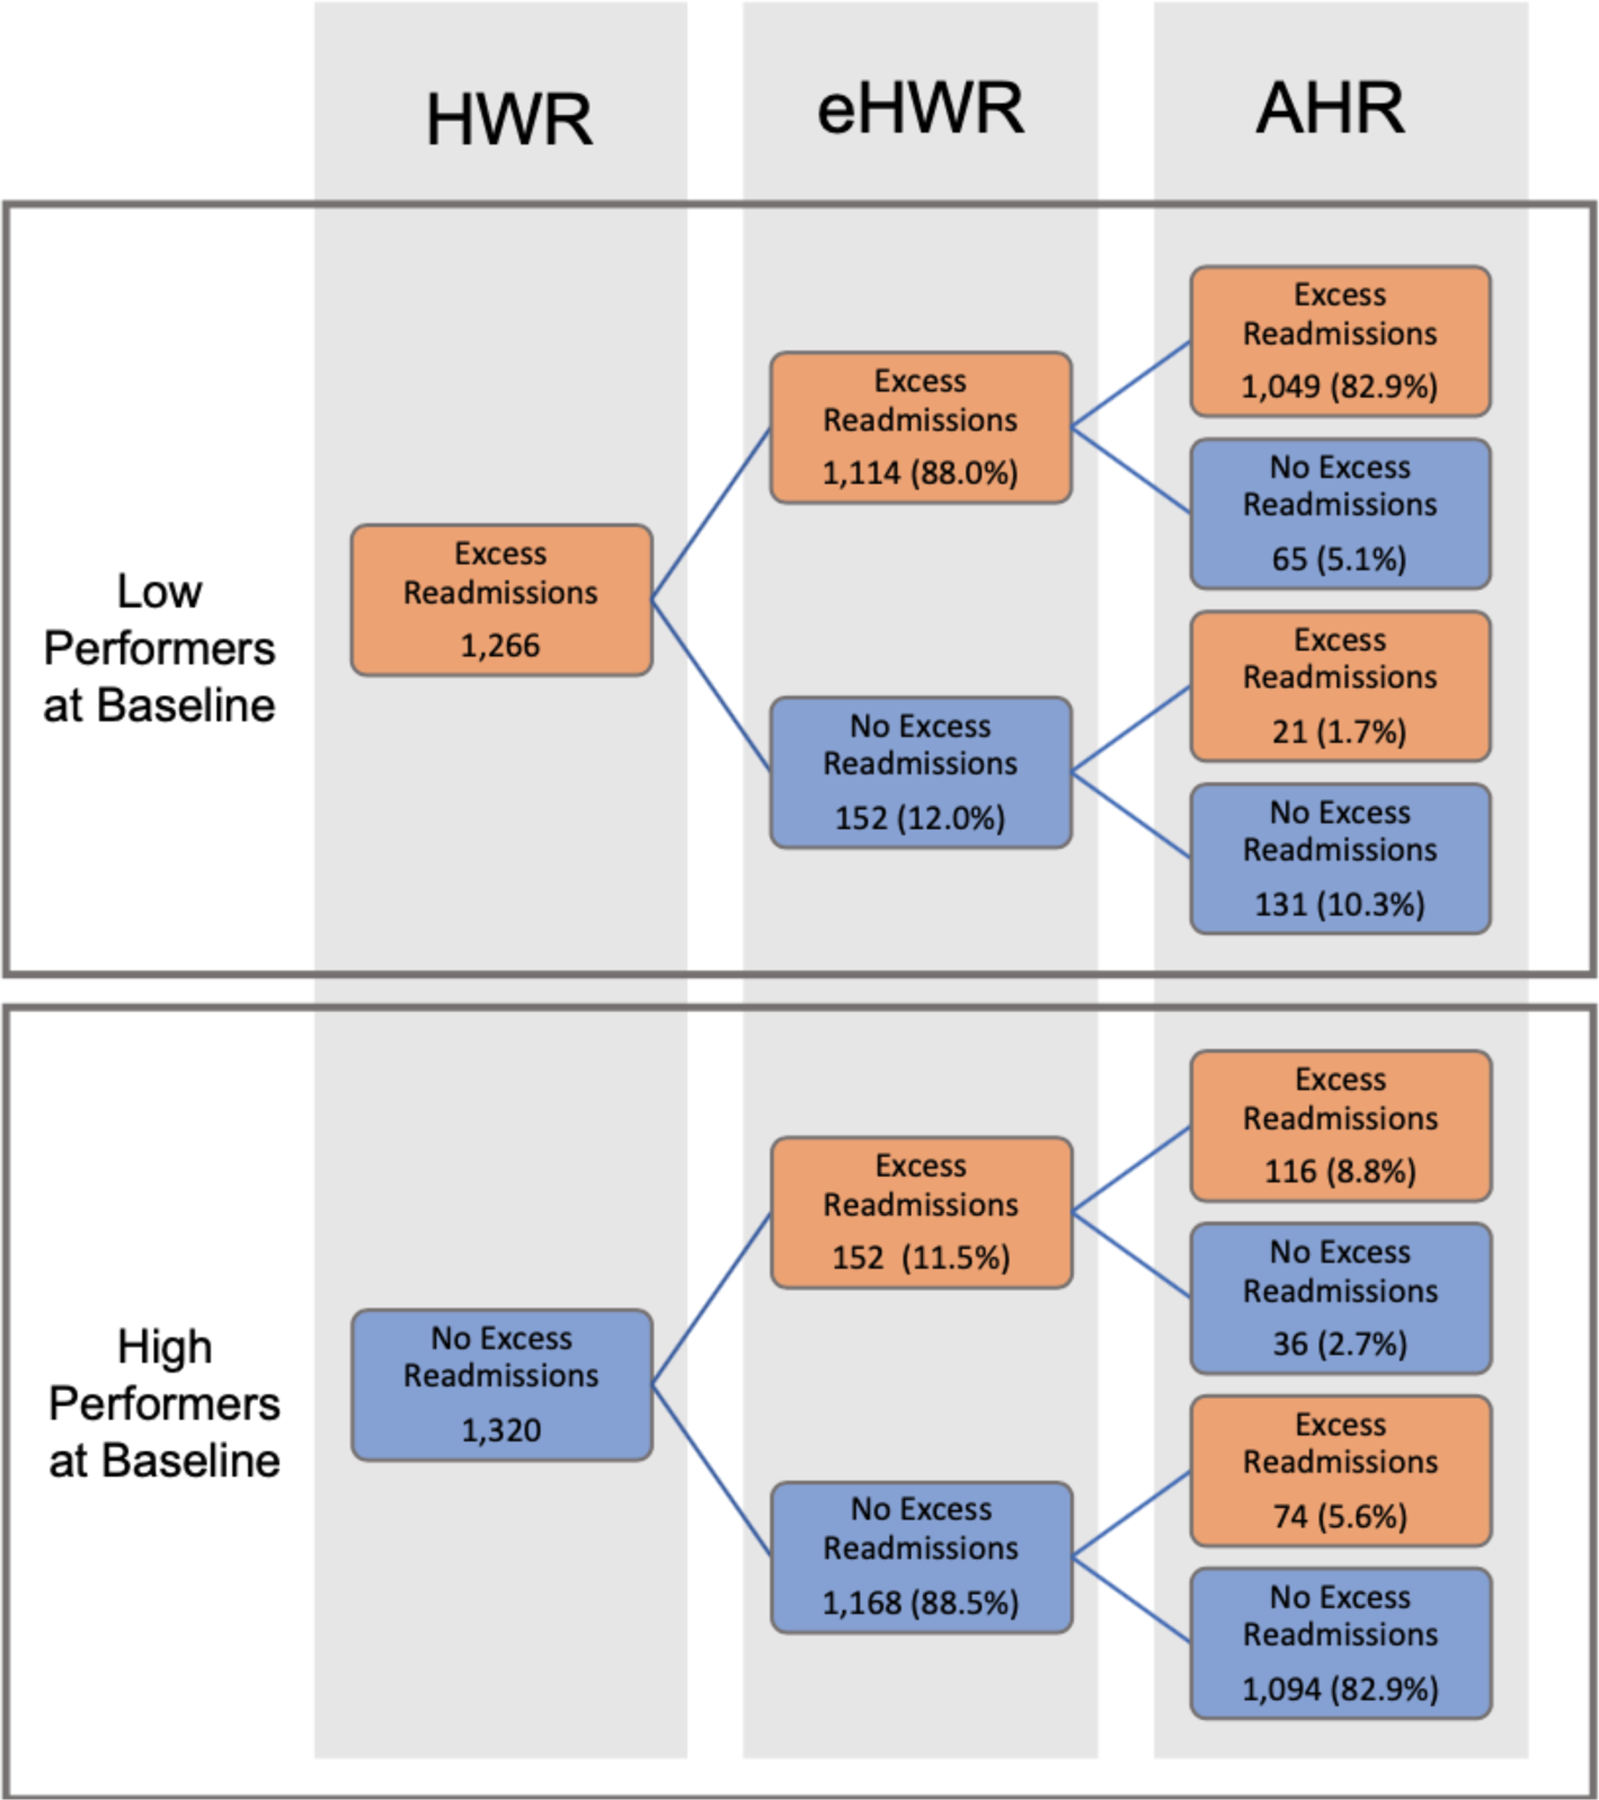
Figure 1 indicates how hospitals at the margins switched in performance status under each alternate readmission measure. With the HWR measure, 1,320 (51.0%) hospitals were classified as high performers (e.g. lower-than-expected number of readmissions or ERR < 1) and 1,266 (48.9%) were classified as low performers (e.g. higher-than-expected number of readmissions or ERR > 1). Overall, around 88% and 85% of hospitals kept their same performance status regardless of whether observation stays were included as readmission events alone (eHWR) or as both readmission events and index discharges (AHR), respectively.
Figure 1.
Hospital characteristics associated with any decline in performance under alternative readmission measures
Notes: HWR: Centers for Medicare and Medicaid Services’ Hospitalwide Readmission Measure. eHWR: Expanded HWR that counts observations stays after inpatient discharge as readmissions (numerator only). AHR: All Hospitalizations Measure counts observation stays as both index hospitalizations and readmissions (numerator and denominator). We calculate an Excess Readmission Ratio (ERR), which is the predicted-to-expected ratio of readmissions from hierarchical models. High-performing hospitals have fewer readmissions than expected (e.g. “no excess readmissions”) and are indicated by an ERR < 1. Low performers are hospitals that have a higher-than-expected number of readmissions (e.g. excess readmissions) with an ERR > 1. This figure shows how hospitals who are characterized as low and high performers under CMS’ current HWR measure will shift in performance status when observation stays are added to the numerator of the measure (eHWR) and when they are added to both the numerator and denominator (AHR).
A total of 152 (11.5%) hospitals identified as high performers under the HWR measure became low performers under the eHWR measure. Similarly, 152 hospitals (12.0%) initially identified as low performers under the HWR measure became high performers under the eHWR measure. Slightly more hospitals switched performance status under the AHR measure. A total of 190 (14.4%) hospitals classified as high performers under the HWR measure became low performers under the AHR measure. Similarly, 196 hospitals (15.5%) initially identified as low performers under the HWR measure became high performers under the AHR measure. Just under two-thirds of hospitals that switched performance status under the AHR measure did not switch under the eHWR measure.
Hospital Characteristics Associated Lower Performance on Alternative Measures
Table 1 shows the association between hospital characteristics and the likelihood of having any decline in performance under the alternative measure. Under the eHWR measure, greater use of observation was the only characteristic associated with worse performance. Eighty percent of hospitals in the highest quintile of observation stay use had worse performance under the eHWR measure versus 10% of hospitals in the lowest quintile of observation use, a nearly 39-fold greater odds of a decline in performance relative to other hospitals; 95% CI 26.99, 55.30).
Table 1.
Hospital Characteristics Associated with Any Decline in Performance Under Alternative Readmission Measures
| eHWR |
AHR |
|||||
|---|---|---|---|---|---|---|
| prop | OR | (95% CI for OR) | prop | OR | (95% CI for OR) | |
| Hospital Location | ||||||
| Urban Hospital (ref) | 0.42 | Ref | 0.40 | Ref | ||
| Rural Hospital | 0.45 | 1.20 | (0.95, 1.51) | 0.40 | 0.96 | (0.77, 1.20) |
| Hospital Size | ||||||
| Small <200 beds | 0.43 | Ref | 0.38 | Ref | ||
| Medium (200–399 beds) | 0.41 | 0.88 | (0.68, 1.16) | 0.42 | 1.23 | (0.95, 1.60) |
| Large (400+ beds) | 0.46 | 1.27 | (0.89, 1.81) | 0.47 | 1.63 | (1.16, 2.31) |
| Hospital Control | ||||||
| Nonprofit (ref) | 0.45 | Ref | 0.41 | Ref | ||
| For Profit | 0.38 | 0.65 | (0.50, 0.84) | 0.37 | 0.80 | (0.63, 1.02) |
| Government | 0.40 | 0.76 | (0.57, 1.01) | 0.40 | 0.94 | (0.72, 1.23) |
| Teaching Status | ||||||
| Non-teaching | 0.41 | Ref | 0.39 | Ref | ||
| Major teaching | 0.45 | 1.27 | (0.88, 1.83) | 0.43 | 1.29 | (0.91, 1.83) |
| Minor teaching | 0.45 | 1.25 | (0.96, 1.63) | 0.41 | 1.14 | (0.88, 1.46) |
| Dual Eligible Case-Mix* | ||||||
| Quintile 1 | 0.44 | Ref | 0.37 | Ref | ||
| Quintile 2 | 0.43 | 0.92 | (0.66, 1.27) | 0.39 | 1.08 | (0.79, 1.48) |
| Quintile 3 | 0.43 | 0.91 | (0.66, 1.26) | 0.41 | 1.21 | (0.86, 1.65) |
| Quintile 4 | 0.41 | 0.81 | (0.59, 1.10) | 0.40 | 1.14 | (0.85, 1.54) |
| Quintile 5 | 0.41 | 0.81 | (0.59, 1.10) | 0.43 | 1.36 | (1.01, 1.83) |
| Observation Stay Use | ||||||
| Quintile 1 | 0.10 | Ref | 0.09 | Ref | ||
| Quintile 2 | 0.12 | 1.25 | (0.82, 1.90) | 0.14 | 1.71 | (1.14, 2.58) |
| Quintile 3 | 0.28 | 3.51 | (2.43, 5.05) | 0.31 | 4.66 | (3.22, 6.74) |
| Quintile 4 | 0.56 | 12.19 | (8.58, 17.33) | 0.51 | 11.24 | (7.85, 16.09) |
| Quintile 5 | 0.80 | 38.63 | (26.99, 55.30) | 0.73 | 29.74 | (20.78, 42.56) |
| Operating Margins | ||||||
| Positive | 0.43 | Ref | 0.40 | Ref | ||
| Negative | 0.42 | 0.93 | (0.76, 1.14) | 0.40 | 1.00 | (0.82, 1.21) |
Notes: prop = proportion, OR = odds ratio. The Expanded Hospital Wide Readmission (eHWR) measure counts observation stays in the numerator of the readmission measure only (e.g. both inpatient admissions and observation stays within 30-days of inpatient discharge are considered a readmission event). (The All Hospitalization Measure (AHR) counts observation stays in both the numerator (as a readmission event) and denominator (as an index hospital discharge).
A similar pattern emerged under the AHR measure, though with slightly fewer hospitals being disadvantaged. Seventy-three percent of hospitals in the highest quintile of observation use would have worse performance versus 9% of hospitals in the lowest quintile of observation use, or roughly 30 times the odds of having a decline in performance relative to other hospitals (95% CI 20.78, 42.56). Additionally, under the AHR measure, safety net hospitals (OR 1.36; 95% CI 1.02, 1.82) and large hospitals (OR 1.63; 95% CI 1.16, 2.31) would also have relatively worse performance on average.
Under our performance switching model, safety net hospitals and hospitals with high rates of observation use that were high performers under the HWR measure were again substantially more likely to switch to the low performance group under both alternative readmission measures (Appendix, Tables A1 & A2). Safety-net hospitals had roughly 2.4 times the odds of switching from high-to-low performance under both the eHWR and AHR measures. Hospitals’ rate of observation use was the strongest predictor of switching performance status. Among hospitals in the highest quintile of observation stay use, 30% and 35% would switch from being a high performer to a low performer under the eHWR and AHR measures respectively versus none of the hospitals in the lowest quintile. Larger hospital size was also associated with switching from high to low performance on the eHWR measure but not the AHR measure.
To further assess the strong association we identified between hospital observation use and readmission performance, we summarized the estimated HWR, eHWR, and AHR measures by quintile of observation stay use (Figure 2). Characteristics of hospitals stratified by observation use are also described in our Appendix (Table A3). Hospitals in the lowest quintile of observation use had largely similar performance under all 3 readmission measures. However, performance diverged for hospitals in the higher quintiles of observation use, which were disproportionately smaller, rural, safety-net hospitals. Under the HWR measure, hospitals in the highest quintile of observation stay use had similar or slightly better readmission rates compared with those in the lowest quintile (16.32% vs. 16.47%; difference of −0.15 percentage points). However, under the eHWR measure, readmission rates increased progressively across quintiles of observation stay use from 16.81% among hospitals in the lowest quintile to 19.80% among hospitals in the highest quintile (difference 2.99 percentage points). Similarly, under the AHR measure, readmission rates increased from 16.61% to 19.43% for hospitals in the lowest to highest quintiles of observation stay use, respectively (difference 2.82 percentage points). Comparing just those hospitals in the highest quintile of observation stay use, mean rates of readmission were 16.32% for the HWR, and 19.80% and 19.43% for the eHWR and AHR, respectively (difference 3.48 and 3.11 percentage points, respectively). These differences were driven by substantially higher rates of rehospitalization to observation stays following any type of hospital discharge.
Figure 2.
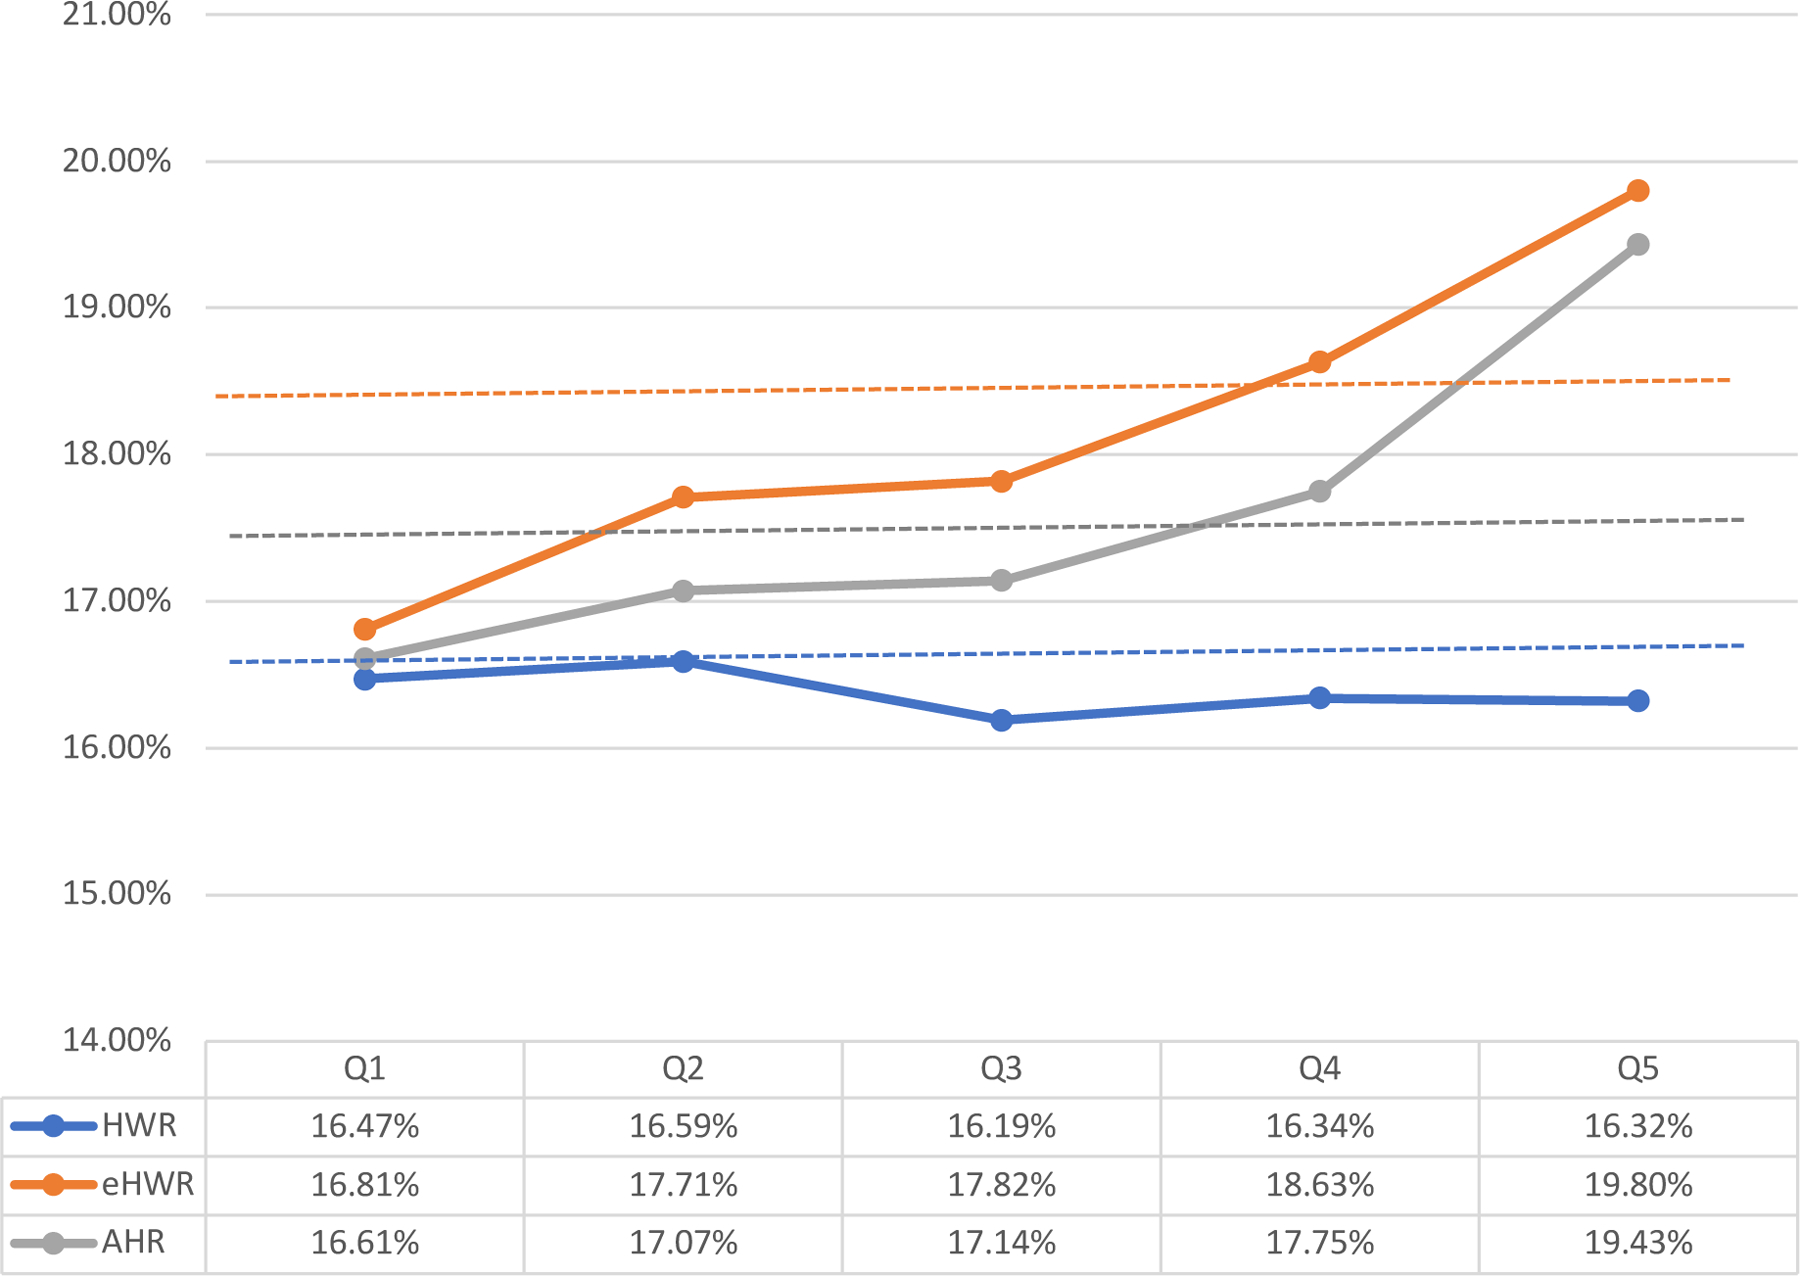
Estimated 30-day risk-standardized readmission rates under alternate measure specifications, stratified by quintiles of hospital observation stay use.
Notes. HWR: Centers for Medicare and Medicaid Services’ Hospitalwide Readmission Measure. eHWR: expanded HWR that counts observations stays after inpatient discharge as readmissions (numerator only). AHR: All Hospitalizations Measure counts observation stays as both index hospitalizations and readmissions (numerator and denominator). Dotted lines represent the mean rate for each measure across the multi-year sample.
DISCUSSION
Observation stays have grown to include a substantial portion of hospitalizations in the Medicare population but are ignored in readmission measures used across CMS’ value-based programs. In this study, we found that including observation stays in hospital readmission rates substantially changed assessed performance for a small but potentially important subset of hospitals. While a majority of hospitals would experience minimal improvements or declines in performance, more than 1 out of every 7 hospitals, would experience a meaningful shift in performance status if observation stays were fully included in both the numerator (as readmission events) and denominator (as hospital discharges) of the 30-day readmission measure. Specifically, safety net hospitals and hospitals with a greater propensity to use observation stays would perform significantly worse under an alternate readmission measure that incorporates observation stays.
While hospitals with the highest use of observation stays had similar rates of readmissions as comparator hospitals when only inpatient hospitalizations were considered, they had substantially worse performance when readmission rates included observation stays. This is largely because these high observation hospitals also had disproportionately higher rates of rehospitalization among their observation discharges compared with hospitals that use observation less frequently. In other words, a patient is both more likely to be hospitalized as an outpatient under observation during their index visit and to be re-hospitalized within 30 days if they receive care at a ‘high observation’ hospital versus a ‘low observation’ hospital.
Our findings suggest that the current approach to measuring readmissions in national quality programs may have the unintended consequence of rewarding hospitals based on how they use observation stays. This includes rewarding some hospitals that have relatively high rates of rehospitalization across the totality of patients receiving hospital care. Although our study was not designed to assess the reasons for differences across hospitals, our results suggest that those with the highest rates of observation stays may be using observation inefficiently or ineffectively if patients are returning to the hospital at higher rates. A convergence of clinical practices, organizational characteristics and policy influences may lead to more aggressive observation stay use, incentivize rapid bed turnover, and result in fewer resources being directed to discharge processes and hospital follow-up among patients hospitalized under observation. Each of these mechanisms could account for the higher rates of hospital return we note in this population. However, it is also possible that high observation hospitals may be generating lower costs for the Medicare program if the reimbursements for a 30-day episode of care are paid out at lower observation rates versus inpatient rates. Thus, there is a potential trade-off between the payer cost and the patient experience of relapsing symptoms and slower resolution of an acute medical illness that may be reflected in repeated hospitalizations. Future work should elucidate the dynamics underlying these changes in order to inform policies that incentivize hospitals to focus on improving quality of care for patients hospitalized under observation, incentives that have largely been lacking to date.
While this study focuses on hospitals, our work is applicable to CMS’s quality programs more broadly. Depending on the program, all-cause readmission rates are calculated for different populations of beneficiaries attributed to a provider. Yet, whether the measure is being calculated for an ACO, a provider group under MIPS, or a nursing home, we would expect that providers who share more patients with a high observation hospital will also see greater deviations in performance if readmission measures were expanded. Thus, unless observation stays are included in the definition of readmissions (and admissions), these measures will continue to provide only a partial picture of a provider’s performance.
A recent, related study by Wadhera et al. explored the hospital performance implications of switching the HRRP from 30-day readmission rates to an Excess Days in Acute Care (EDAC) measure.29 Unlike the alternate readmission measures we tested here, the EDAC measure counts the number of days a patient spends in the hospital for an inpatient admission, observation stay, or emergency department (ED) visit in the 30 days following inpatient discharge. They found that over a quarter of hospitals penalized under the HRRP would not incur penalties under the EDAC measure, a somewhat greater shift than our current study, likely owing to the inclusion of ED visits.
Arguments for and against inclusion of treat-and-release ED visits in hospital readmission measures exist, however, unlike observation stays which have increasingly replaced short inpatient admissions, ED visits are qualitatively different than a hospitalization and their inclusion would change the scope of the measure substantially. Additionally, the EDAC measure, which is currently reported on Hospital Compare as a condition-specific measure, still does not capture outcomes following an observation stay discharge.
Aside from concerns around misclassification of hospitals’ true performance, observation stays should also be included in readmission measures because they more closely align with the patient experience of being hospitalized. However, our data suggest that safety net hospitals, which care for higher proportions of marginalized patients, may be further disadvantaged if CMS were to move to a measure that incorporates observation stays. Concerns about safety net hospitals being disproportionately penalized under Medicare’s value-based programs have existed since the passage of the Affordable Care Act. Social determinants of health including poverty and neighborhood deprivation are strongly linked to higher readmission rates.30,31 Even without the inclusion of observation stays in readmissions measures, safety-net hospitals are more likely than non-safety net hospitals to be penalized, as well as incur higher penalties under the HRRP and other value-based programs.32–35 In our study, we find that safety net hospitals (especially smaller, rural hospitals) have higher use of observation, which was the strongest predictor of reduced performance on the observation-inclusive measures. However, safety net status remained an independent predictor in multivariable models, suggesting other factors are contributing. Patients treated at safety net hospitals may have a lower severity of medical illness but high social complexity, making them both more likely to be hospitalized under observation and return at 30-days.36 This could, in part, explain the patterns we see in this study. Moreover, in a recent study, replacing condition-specific measures with the HWR in the HRRP would result in more safety-net hospitals being penalized.37 Thus, broader specifications of readmission measures that include a more heterogenous set of conditions may be capturing this social risk that results in worse performance for safety-net hospitals. If policymakers incorporate observation stays into a broader approach for measuring readmissions, commensurate attention is needed to ensure that programmatic changes do not worsen existing inequities among hospitals already limited in resources.
Our study has limitations. First, we are unable to distinguish between observation stays that occur in a dedicated observation unit or ED, which may be qualitatively different than an inpatient hospitalization and have different readmission profiles. Second, our study is a cross-sectional analysis of a single year and these results may or may not hold for different years. Third, we used dual-eligible case-mix to define safety-net status in this study; other definitions of safety-net hospitals could yield different results than those found here. Fourth, our study excludes short-term hospitals (N=628) that did not have information in the Hospital Cost Reports. The extent to which the characteristics of these hospitals differed from those included in the study is unknown, though readmission rates across the 3 measures are similar for included and excluded hospitals (Appendix Table A4).
In conclusion, fully incorporating observation stays in 30-day readmission measures would substantially change performance in value-based programs for safety net hospitals and hospitals with high rates of observation stays. While such readmission measure changes might increase the patient-centeredness of quality measurement, they should be implemented in ways that avoid exacerbating existing inequities for marginalized populations and hospitals that care for them.
Supplementary Material
Funding:
Work funded by a grant from the National Institute of Aging 1R01-AG063759-01A1
Footnotes
Conflicts of Interest: None of the authors have COI to disclose.
REFERENCES
- 1.Weiss AJ, Jiang HJ. Overview of Clinical Conditions With Frequent and Costly Hospital Readmissions by Payer, 2018. HCUP Statistical Brief #278 July 2021. Agency for Healthcare Research and Quality, Rockville, MD. Accessed December 7, 2022 from www.hcup-us.ahrq.gov/reports/statbriefs/sb278-Conditions-Frequent-Readmissions-By-Payer-2018.pdf. [PubMed] [Google Scholar]
- 2.Centers for Medicare and Medicaid Services. CMS’ Value-Based Programs Accessed December 7, 2022. https://www.cms.gov/Medicare/Quality-Initiatives-Patient-Assessment-Instruments/Value-Based-Programs/Value-Based-Programs
- 3.Wadhera RK, Yeh RW, Joynt Maddox KE. The Hospital Readmissions Reduction Program — Time for a Reboot. N Engl J Med 2019;380(24):2289–2291. [DOI] [PMC free article] [PubMed] [Google Scholar]
- 4.Ross MA, Granovsky M. History, Principles, and Policies of Observation Medicine. Emergency medicine clinics of North America 2017;35(3):503–518. [DOI] [PubMed] [Google Scholar]
- 5.Poon SJ, Wallis CJD, Lai P, Podczerwinski L, Buntin MB. Medicare Two-Midnight Rule Accelerated Shift To Observation Stays. Health Affairs 2021;40(11):1688–1696. [DOI] [PubMed] [Google Scholar]
- 6.Harrison JP, Barksdale RM. The impact of RAC audits on US hospitals. Journal of Health Care Finance 2013;39(4):1–14. [PubMed] [Google Scholar]
- 7.Locke C, Sheehy AM, Deutschendorf A, Mackowiak S, Flansbaum BE, Petty B. Changes to inpatient versus outpatient hospitalization: Medicare’s 2-midnight rule. Journal of Hospital Medicine 2015;10(3):194–201. [DOI] [PubMed] [Google Scholar]
- 8.Medicare Payment Advisory Commission. 2018. Report to the Congress: Medicare and the health care delivery system Washington, DC: MedPAC. Accessed December 7. 2022 from https://www.medpac.gov/document/http-www-medpac-gov-docs-default-source-reports-mar18_medpac_entirereport_sec_rev_0518-pdf/ [Google Scholar]
- 9.Sheehy AM, Kaiksow F, Powell WR, et al. The Hospital Readmissions Reduction Program and Observation Hospitalizations. Journal of Hospital Medicine 2021;16(7). [DOI] [PMC free article] [PubMed] [Google Scholar]
- 10.Medicare Payment Advisory Commission. 2013. Report to Congress: Refining the hospital readmissions reduction program Washington, DC: MedPAC. Accessed May 9, 2023 from https://www.medpac.gov/wp-content/uploads/import_data/scrape_files/docs/default-source/reports/jun13_ch04.pdf [Google Scholar]
- 11.Sheehy AM, Locke CFS, Bonk N, Hirsch RL, Powell WR. Health care policy that relies on poor measurement is ineffective: Lessons from the hospital readmissions reduction program. Health Services Research 2023;58(3):549–553. doi: 10.1111/1475-6773.14161 [DOI] [PMC free article] [PubMed] [Google Scholar]
- 12.Society for Hospital Medicine. The Hospital Observation Care Problem - Perspectives from the Society of Hospital Medicine Public Policy Committee September 2017. Accessed May 9, 2023. https://www.hospitalmedicine.org/globalassets/policy-and-advocacy/advocacy-pdf/shms-observation-white-paper-2017
- 13.Lind KD, Noel-Miller CM, Sangaralingham LR, et al. Increasing Trends in the Use of Hospital Observation Services for Older Medicare Advantage and Privately Insured Patients. Medical Care Research and Review 2019;76(2):229–239. [DOI] [PMC free article] [PubMed] [Google Scholar]
- 14.Medicare and Medicaid Programs; Policy and Technical Changes to the Medicare Advantage, Medicare Prescription Drug Benefit, Programs of All-Inclusive Care for the Elderly (PACE), Medicaid Fee-For-Service, and Medicaid Managed Care Programs for Years 2020 and 2021. Federal Register Published April 16, 2019. Accessed May 9, 2023. https://www.federalregister.gov/documents/2019/04/16/2019-06822/medicare-and-medicaid-programs-policy-and-technical-changes-to-the-medicare-advantage-medicare
- 15.Department of Health and Human Services, Office of Inspector General. Hospitals’ Use of Observation Stays and Short Inpatient Stays for Medicare Beneficiaries Report (OEI-02–12-00040) July 2013. Accessed December 7, 2022 from https://oig.hhs.gov/oei/reports/oei-02-12-00040.asp
- 16.Tian Y, Hall M, Ingram ME, Hu A, Raval MV. Trends and Variation in the Use of Observation Stays at Children’s Hospitals. Journal of Hospital Medicine 2021;16(11):645–651. [DOI] [PubMed] [Google Scholar]
- 17.Figueroa JF, Burke LG, Horneffer KE, Zheng J, John Orav E, Jha AK. Avoidable Hospitalizations And Observation Stays: Shifts In Racial Disparities. Health Affairs 2020;39(6):1065–1071. [DOI] [PMC free article] [PubMed] [Google Scholar]
- 18.Figueroa JF, Burke LG, Zheng J, Orav EJ, Jha AK. Trends in Hospitalization vs Observation Stay for Ambulatory Care–Sensitive Conditions. JAMA Internal Medicine 2019;179(12):1714–1716. [DOI] [PMC free article] [PubMed] [Google Scholar]
- 19.Sabbatini AK, Wright B. Excluding Observation Stays from Readmission Rates - What Quality Measures Are Missing. The New England journal of medicine 2018;378(22):2062–2065. [DOI] [PubMed] [Google Scholar]
- 20.Span P “Under ‘Observation,’ Some Hospital Patients Face Big Bills.” The New York Times September 1, 2017. Accessed May 5, 2023 from https://www.nytimes.com/2017/09/01/health/medicare-observation-hospitals.html.
- 21.Kanne JL. “Medicare patients: Beware of ‘observation’ status in hospitals.” Reuters June 11, 2014. Accessed May 5, 2023 from https://www.reuters.com/article/us-medicare-patients-observation-idUSKBN0EM1US20140611.
- 22.Moeller P “Why your observation stay at the hospital could end with a big bill.” PBS NewsHour Published April 25, 2018. Accessed May 5, 2023 from https://www.pbs.org/newshour/economy/making-sense/why-your-observation-stay-at-the-hospital-could-end-with-a-big-bill
- 23.Yale New Haven Health Services Corporation/Center for Outcomes Research & Evaluation. 2017. All-Cause Hospital-Wide Measure Updates and Specifications Report Accessed December 7, 2022 from https://qualitynet.cms.gov/files/5d26a75fcbc787001f617348?filename=2017_Rdmsn_Updates&Specs_Repts.zip=
- 24.Centers for Medicare and Medicaid Services. Hospital Cost Report Public Use File Accessed December 7, 2022 from https://www.cms.gov/Research-Statistics-Data-and-Systems/Statistics-Trends-and-Reports/Medicare-Provider-Cost-Report/HospitalCostPUF
- 25.Carey K, Lin MY. Hospital Readmissions Reduction Program: Safety-Net Hospitals Show Improvement, Modifications To Penalty Formula Still Needed. Health Affairs 2016;35(10):1918–1923. [DOI] [PubMed] [Google Scholar]
- 26.Joynt Maddox KE, Reidhead M, Qi AC, Nerenz DR. Association of Stratification by Dual Enrollment Status With Financial Penalties in the Hospital Readmissions Reduction Program. JAMA Internal Medicine 2019;179(6):769–776. [DOI] [PMC free article] [PubMed] [Google Scholar]
- 27.Cecil G Sheps Center for Health Services Research, University of North Carolina. A Primer on Interpreting Hospital Margins July 2003. Accessed December 7, 2022 from https://www.shepscenter.unc.edu/wp-content/uploads/2014/10/Primer.pdf28.
- 28.Healthcare Cost and Utilization Project. Clinical Classifications Software, 2015. Rockville (MD): Agency for Healthcare Quality and Research; March 2016. Accessed June 20, 2019 from https://www.hcup-us.ahrq.gov/toolssoftware/ccs/CCSUsersGuide.pdf [Google Scholar]
- 29.Wadhera RK, Joynt Maddox KE, Desai NR, et al. Evaluation of Hospital Performance Using the Excess Days in Acute Care Measure in the Hospital Readmissions Reduction Program. Ann Intern Med 2021;174(1):86–92. [DOI] [PMC free article] [PubMed] [Google Scholar]
- 30.Hu J, Gonsahn MD, Nerenz DR. Socioeconomic status and readmissions: evidence from an urban teaching hospital. Health Affairs 2014;33(5):778–785. [DOI] [PubMed] [Google Scholar]
- 31.Calvillo–King L, Arnold D, Eubank KJ, et al. Impact of Social Factors on Risk of Readmission or Mortality in Pneumonia and Heart Failure: Systematic Review. Journal of General Internal Medicine 2013;28(2):269–282. [DOI] [PMC free article] [PubMed] [Google Scholar]
- 32.Gilman M, Hockenberry JM, Adams EK, Milstein AS, Wilson IB, Becker ER. The Financial Effect of Value-Based Purchasing and the Hospital Readmissions Reduction Program on Safety-Net Hospitals in 2014. Ann Intern Med 2015;163(6):427–436. [DOI] [PubMed] [Google Scholar]
- 33.Sheingold SH, Zuckerman R, Shartzer A. Understanding Medicare Hospital Readmission Rates And Differing Penalties Between Safety-Net And Other Hospitals. Health Affairs 2016;35(1):124–131. [DOI] [PubMed] [Google Scholar]
- 34.Gilman M, Adams EK, Hockenberry JM, Wilson IB, Milstein AS, Becker ER. California Safety-Net Hospitals Likely To Be Penalized By ACA Value, Readmission, And Meaningful-Use Programs. Health Affairs 2014;33(8):1314–1322. [DOI] [PubMed] [Google Scholar]
- 35.Joynt KE, Jha AK. Characteristics of Hospitals Receiving Penalties Under the Hospital Readmissions Reduction Program. JAMA 2013;309(4):342–343. [DOI] [PubMed] [Google Scholar]
- 36.Wright B, Akiyama J, Potter AJ, et al. Racial and Ethnic Disparities in Hospital-Based Care Among Dual Eligibles Who Use Health Centers. Health Equity 2023;7(1):9–18. doi: 10.1089/heq.2022.0037 [DOI] [PMC free article] [PubMed] [Google Scholar]
- 37.Zuckerman RB, Joynt Maddox KE, Sheingold SH, Chen LM, Epstein AM. Effect of a Hospital-wide Measure on the Readmissions Reduction Program. The New England journal of medicine 2017;377(16):1551–1558. [DOI] [PubMed] [Google Scholar]
Associated Data
This section collects any data citations, data availability statements, or supplementary materials included in this article.