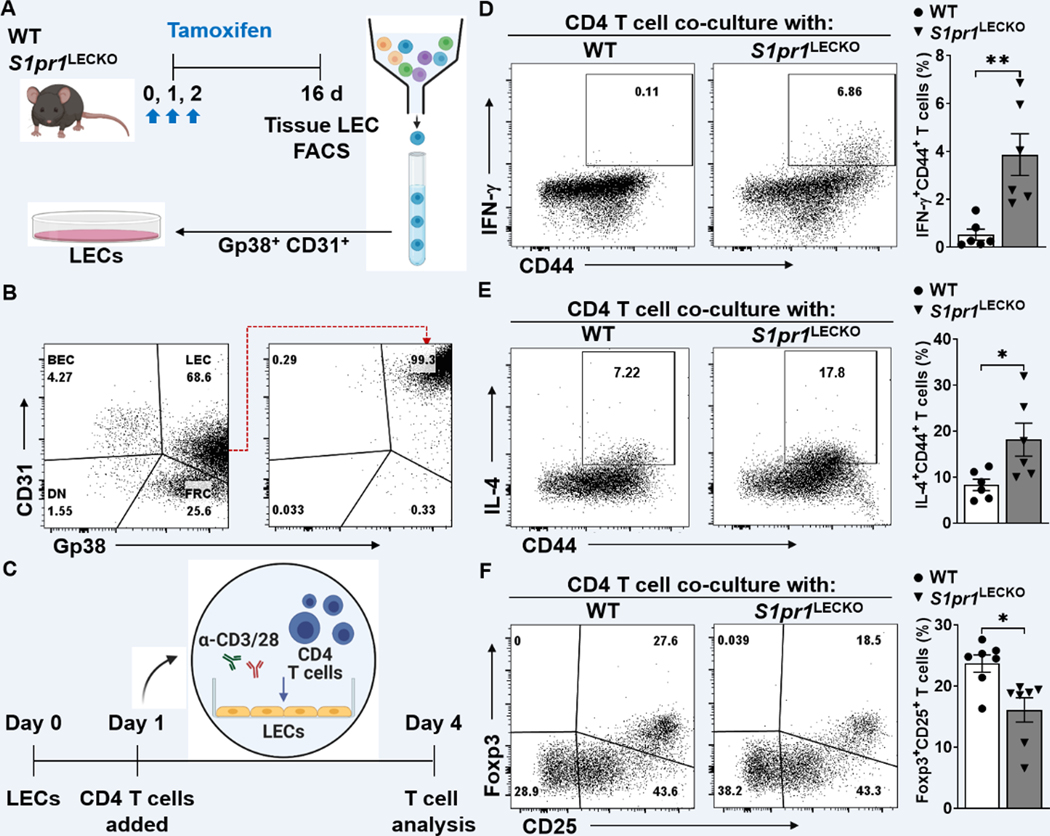
Figure 4. Decreased S1PR1 signaling in LECs promotes T cell activation.
(A) Schematic diagram of LEC (Gp38+CD31+) purification. (B) Representative flow cytometry sorting strategy for the isolation of LECs from cultured lymph node stromal cells. (C) Timeline of co-culture with purified LECs and naïve CD4 T cells activating with to α-CD3/28 Abs. LECs to T cell ratio was 1:5. (D-F) Flow cytometric analysis was performed d4 after co-culture. Representative flow cytometric plots and quantification of IFN-ɣ+CD44+ in CD4+ T cells (D), IL-4+CD44+ in CD4+ T cells (E), and Foxp3+CD25+ in CD4+ T cells (F) (n ≥ 6 per each group). Data are presented as mean ± SEM; * p < 0.05 and ** p < 0.01 by the Mann-Whitney test.

