

Abstract
Purpose.
Anti-angiogenic therapies are known to cause high radiographic response rates due to reduction in vascular permeability resulting in a lower degree of contrast extravasation. In the current study, we investigate the prognostic ability for model-derived parameters describing enhancing tumor volumetric dynamics to predict survival in recurrent glioblastoma treated with anti-angiogenic therapy.
Experimental Design.
patients in two phase II trials were used as training data, including bevacizumab +/− irinotecan (NCT00345163) and cabozantinib (NCT00704288), and patients in the bevacizumab arm of a phase III trial (NCT02511405) were used for validation. Enhancing volumes were estimated using T1 subtraction maps, and a biexponential model was used to estimate regrowth and regression rates, time to tumor regrowth , and the depth of response . Response characteristics were compared to diffusion MR phenotypes previously shown to predict survival.
Results:
Optimized thresholds occurred at (, ; , ); , ; , ); months (, ; ); and (; , ). Multivariable Cox regression controlling for age and baseline tumor volume confirmed these factors as significant predictors of survival. Patients with a favorable pre-treatment diffusion MRI phenotype had a significantly longer and slower regrowth.
Conclusions:
Recurrent glioblastoma patients with a large, durable radiographic response to anti-angiogenic agents have significantly longer survival. This information is useful for interpreting activity of anti-angiogenic agents in recurrent glioblastoma.
Keywords: Anti-VEGF therapy, recurrent glioblastoma, biomarker, treatment response, bevacizumab, glioblastoma, tumor growth model, antiangiogenic therapy, anti-VEGF, recurrent GBM
INTRODUCTION
Notwithstanding the importance of vascular epithelial growth factor (VEGF) in brain tumor biology (1,2) and promising initial responses to a variety of anti-VEGF therapies (3–7), confirmatory randomized phase II-III trials have not shown an overall survival (OS) benefit for patients with recurrent glioblastoma and there appears to be no direct association between objective response rate (ORR) and median OS when examining the literature (5,8–15) (Fig. 1A). However, anecdotally, there are patients who experience robust responses to anti-VEGF therapy and subsequently appear to have a survival benefit when treated with anti-VEGF therapies, including those with specific diffusion MR phenotypes (16–18). Furthermore, bevacizumab is used with increasing frequency as the control arm in recurrent glioblastoma trials, or in combination trials with new therapeutics. Thus, a diagnostic tool for identifying patients having a beneficial response to anti-VEGF therapy, beyond traditional measures of simple tumor shrinkage vis-à-vis response rate, may have high clinical, scientific, social, and economic impact, as this costly form of therapy could be withheld until other options have been exhausted.
Fig. 1.
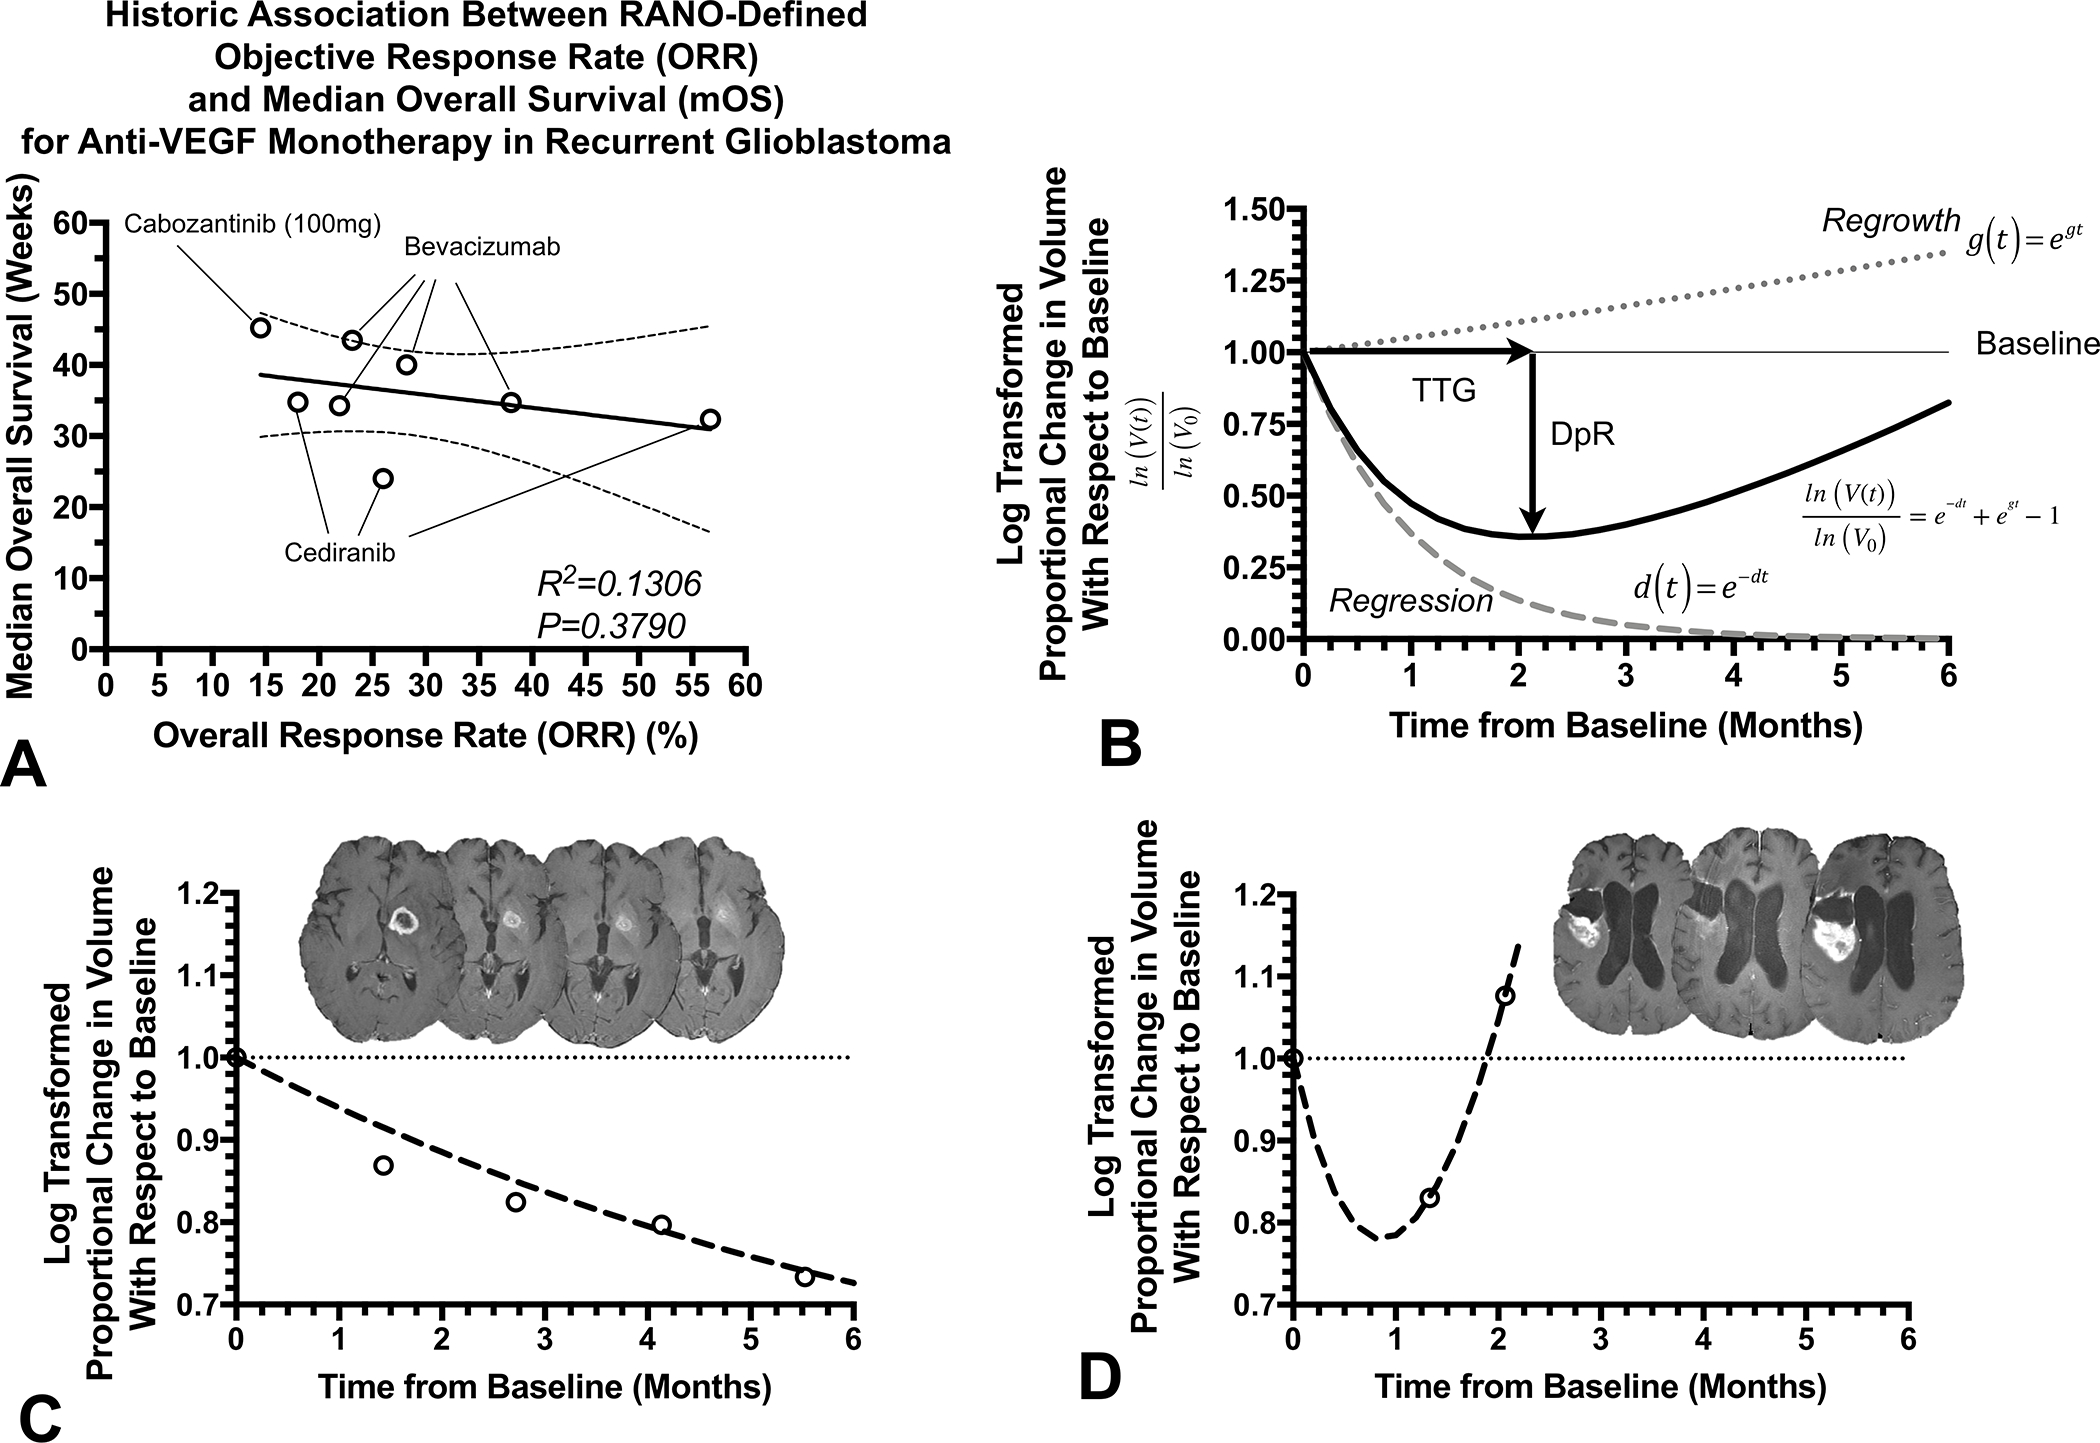
A) Historic lack of association between RANO response rate and median survival in recurrent glioblastoma treated with anti-VEGF agents (based on data summarized in Ellingson et al.(15) and documented in various trials (5,8–14)). B) Diagram depicting biexponential model of volumetric response. Time to tumor regrowth () is defined as the inflection point between the regression curve, , and the regrowth curve, , while depth of response is defined as the maximum decrease in (log-transformed) volume relative to baseline. C) Example patient with a favorable outcome demonstrating a slow response rate and . D) Example patient illustrating a rapid response and regrowth rate, with a less than 30 days.
Due to the fact most patients with recurrent glioblastoma treated with anti-VEGF therapies show some radiographic response, we theorized a mathematical model that characterizes both this initial response component along with a rebound, or regrowth phase may be appropriate for describing the temporal behavior of these tumors. Consistent with this concept, evidence suggests tumor regrowth rate during experimental treatment estimated using a biexponential model that incorporates both growth and regression rates showed a strong association with OS via serial serum prostate-specific antigen (19) and tumor volume measurements (20,21) in prostate and metastatic colorectal cancers, respectively. Thus, we hypothesized a comparable biexponential model could be used to model recurrent glioblastoma response to anti-angiogenic therapy, and parameters associated with this model will be predictive of OS. Further, we theorized the use of T1-weighted digital subtraction maps (22,23), where pre-contrast images are subtracted voxel-by-voxel from post-contrast images to highlight areas of subtle enhancement, would significantly improve the accuracy of tumor measurements in the context of anti-angiogenic therapies (22,23). The current study aimed to test this hypothesis by investigating the association between model-derived parameters describing enhancing tumor volumetric dynamics and OS in two phase II trials (training) and one phase III trial (validation) of recurrent glioblastoma treated with anti-VEGF therapies including bevacizumab and cabozantinib.
MATERIALS AND METHODS
Patient Population
A total of 276 anti-VEGF treatment naïve recurrent glioblastoma patients with measurable enhancing tumor (>1cm3) and at least 3 time points including baseline available from 2 separate multicenter phase II clinical trials were included in this study as training data. Among these 276 patients were 139 patients treated with bevacizumab with or without irinotecan as part of the BRAIN trial (5) (Roche/Genentech, AVF3708g; NCT00345163), an open-label, multicenter (11 sites), randomized, noncomparative phase II trial performed to assess the effectiveness of bevacizumab or bevacizumab (10mg/kg every 2 weeks) and irinotecan hydrochloride (340 mg/m2 or 125 mg/m2) with or without concomitant enzyme-inducing antiepileptic drugs. The remaining 137 patients were treated with cabozantinib monotherapy as part of XL184–201 (12), a multicenter (8 sites), phase II, open-label, uncontrolled study of cabozantinib (XL184; Exelixis; NCT00704288), a tyrosine kinase inhibitor with principal targets of MET, VEGF receptors, AXL, and RET, at a dose of 140 or 100 mg (free base equivalent weight, oral, daily) at first or second relapse. Along with these 276 phase II patients, an additional 74 patients with measurable enhancing tumor and at least 3 time points including baseline in the bevacizumab control arm in the phase III GLOBE trial (13) (VBL Therapeutics; NCT02511405), a randomized controlled trial comparing the efficacy and safety of upfront combination of ofranergene obadenovec (VB-111) and bevacizumab versus bevacizumab monotherapy (10mg/kg every 2 weeks), were included as a validation cohort. All patients enrolled in all trials signed institutional review board-approved written consent at the respective study sites and all studies were conducted in accordance with the Declaration of Helsinki. Additional information for these respective trials can be found in Friedman et al. (5) (BRAIN), Wen et al. (12) (XL184–201), and Cloughesy et al. (24) (GLOBE).
Magnetic Resonance Imaging
All anatomical MR images were acquired for all patients using a 1.5T or 3T MR scanner and included study-specific standardized pre- and post-contrast T1-weighted images and 2D axial T2-weighted FLAIR images. A subset of patients had diffusion MRI data at baseline available for analysis. For the current study, T1-weighted images pre- and post-administration of gadolinium-based contrast agents were used to quantify enhancing volumes, and consisted of either 2D axial turbo spin echo images with a slice thickness of 3–6-mm with an interslice gap of 0–2.5 mm, or a 3D inversion-prepared gradient echo with a 1–1.5-mm isotropic voxel size, consistent with international recommendations (25). In a subset of patients with diffusion MRI available, diffusion-weighted images (DWIs) were acquired before injection of contrast with TE/TR=80–110msec/4–10sec, NEX=1, slice thickness=5 with 0–1mm interslice gap, matrix size=128×128, and FOV=220–256mm using a monopolar spin-echo echo-planar preparation. Apparent diffusion coefficient (ADC) maps were calculated offline from the acquired DWIs using s/mm2 and s/mm2 images and used for subsequent analyses.
Post-Processing of MRI Data
Contrast-enhanced T1-weighted digital subtraction maps were used to extract contrast-enhancing tumors while excluding blood products and necrotic lesions within the tumor as previously described (23,26,27). First, pre- and post-contrast T1-weighted images were co-registered using a six-degree-of-freedom rigid transformation and a mutual information cost function using FSL software (flirt; FMRIB Software Library, Oxford, England; http://www.fmrib.ox.ac.uk/fsl/). Then, Gaussian normalization of image intensity for both non-enhanced and contrast-enhanced T1-weighted images was performed using custom code courtesy of the National Institute of Mental Health Magnetoencephalography Core Facility (3dNormalize; NIMH MEG Core, kurage.nimh.nih.gov/meglab/Meg/3dNormalize). Next, bias field correction was performed (FAST; FMRIB Software Library, Oxford, England; https://fsl.fmrib.ox.ac.uk/fsl/fslwiki/FAST) and voxel-by-voxel subtraction between normalized non-enhanced and contrast-enhanced T1-weighted images was performed. Image voxels with a positive (greater than zero) change in normalized contrast enhancement signal intensity (ie, voxels increasing in MR signal after contrast agent administration) were isolated within the lesion area, and estimates of tumor volume were obtained by combining areas of contrast enhancement on T1 subtraction maps with any regions of central necrosis (defined as being enclosed by contiguous, positive enhancing disease). A team of trained lab technologists generated initial segmentations, and all final volumes were reviewed by a single investigator (B.M.E.) who was blinded to other relevant metrics until study completion.
Mathematical Modeling
To describe both the initial volumetric regression plus tumor regrowth, a biexponential mathematical model(21) was applied to log-transformed, normalized volumetric measurements (Fig. 1B):
| [Equation 1] |
Here, is the tumor volume (in mL) at time point is the baseline tumor volume (in mL), is the tumor regression rate (months−1), is the tumor regrowth rate (months−1), and is the natural logarithm. The curve_fit method from the SciPy python library (version 1.7.3) was used for nonlinear regression to fit the model to the volumetric data for each patient. The level of significance for curve fitting was set to for the best estimate possible. Once estimates for and were obtained for each patient, the time to tumor regrowth (TTG) was estimated by finding the minimum of the curve through setting the derivative of Equation 1 to zero and solving for .
| [Equation 2] |
Lastly, the depth of response (DpR) was estimated by using model estimations of , and :
| [Equation 3] |
Note that for patients where or and could not be estimated.
ADC Histogram Analysis
T1 subtraction-defined enhancing tumor volumes were used to extract ADC values for ADC histogram analysis. Nonlinear regression of a double Gaussian mixed model was then performed for the extracted ADC histograms using GraphPad Prism, Version 4.0c (GraphPad Software, San Diego, California). The model used for the double Gaussian was defined by the following equation:
| [Equation 4] |
where is the probability of obtaining a particular value of ADC in the histogram, is the relative proportion of voxels represented by the lower histogram, represents a normal (Gaussian) distribution with mean, , and standard deviation, represents the lower and represents the higher of the two mixed Gaussian distributions. Resulting model fits were visually inspected and rerun with different initial conditions until adequate convergence was obtained. Goodness of fit was determined to be adequate if the adjusted . Patients with favorable diffusion MR phenotypes were defined as those having and those with non-favorable diffusion MR phenotypes were defined as those having , based on previous studies (16,17,28–30).
Statistical Analysis
A Kruskal-Wallis test and Dunn’s test for multiple comparisons were used to test differences in estimates of , and across trial datasets used in the current study. Pearson’s correlation analyses and nonlinear regression were used to investigate the association between parameters. Optimal thresholds for each variable were determined from phase II data by finding the minimum log-rank hazard ratio and corresponding p-values with respect to OS in patients categorized as “high” vs. “low”, while changing the variable thresholds through the range of values as described previously (16). Reported p-values for phase II data were calculated using the approach described by Lausen and Schumacher (31). These thresholds were then validated using the phase III dataset to confirm these are meaningful cutoffs for identifying survival differences between patients. Next, univariate Cox regression analysis was performed to assess the association between OS and continuous estimates of , and . Additional multivariate Cox regression analysis were performed by including age and baseline tumor volume in addition to each model parameter. Lastly, the association between estimates of , and were compared between pre-treatment diffusion MR phenotypes (higher or lower than ) using unpaired t-tests. Statistical significance was set at and P-values were adjusted for multiple comparisons when stated. Statistical analyses were performed using a combination of GraphPad Prism (v7.0e; GraphPad Software, Boston, MA), Python 3.11.1, and Matlab (MATLAB 2022b, The MathWorks, Natick, MA).
RESULTS
A total of 255 of the eligible 276 phase II patients (92.4%) and 63 of the eligible 74 phase III patients (85.1%) had sufficient model fit to experimental data and were included in subsequent analyses. Patient demographic data for the included patients can be found in Table 1. Fig. 1C illustrates an example patient with a strong radiographic response to bevacizumab in the phase II group, suggestive by a relatively low regression rate, , and tumor regrowth rate, . This is contrasted with an example patient in Fig. 1D showing rapid failure on bevacizumab as evidence by a rapid regression, , and subsequently high regrowth rate, and short .
Table 1:
Patient Demographics.
| Trial/Arm | Patients Included in Imaging Analysis (Total Patients in Trial) | Age [years] (average ± S.E.M.) | Baseline Tumor Volume [cc] (average ± S.E.M.) | Tumor Regrowth Rate g [months−1] (average ± S.E.M.) | Tumor Response Rate d [months−1] (average ± S.E.M.) | Time to Tumor Regrowth TTG [months] (average ± S.E.M.) | Depth of Response DpR [%] (average ± S.E.M.) | Median OS [months] |
|---|---|---|---|---|---|---|---|---|
|
| ||||||||
| Phase II - Bevacizumab Monotherapy (NCT00345163) | 65 (of 68) | 53.8 ± 1.45 | 17.4 ± 2.02 | 0.083 ± 0.005 | 0.185 ± 0.011 | 5.06 ± 1.37 | 17.2 ± 2.04 | 11.83 |
| Phase II - Bevacizumab + Irinotecan (NCT00345163) | 69 (of 71) | 54.8 ± 1.49 | 21.8 ± 2.22 | 0.091 ± 0.008 | 0.238 ± 0.020 | 4.14 ± 0.31 | 20.4 ± 1.43 | 9.95 |
| Phase II - Cabozantinib (NCT00704288) | 121 (of 137) | 53.7 ± 1.09 | 19.2 ± 1.80 | 0.127 ± 0.007 | 0.345 ± 0.023 | 2.83 ± 0.24 | 19.6 ± 1.13 | 8.51 |
| Phase III - Bevacizumab Monotherapy (NCT02511405) | 63 (of 74) | 54.9 ± 1.46 | 21.6 ± 2.07 | 0.079 ± 0.005 | 0.171 ± 0.012 | 3.61 ± 0.41 | 15.1 ± 1.42 | 10.25 |
S.E.M. = Standard Error of the Mean
Distribution of Model Parameters Across Trials
Tumor regrowth rate () was significantly higher in patients treated with cabozantinib compared with bevacizumab monotherapy (Fig. 2A; Phase II BRAIN Trial, adjusted ; Phase III VB111 control arm, adjusted ) and bevacizumab in combination with irinotecan (adjusted ). Also, tumor regression rate was significantly higher in patients treated with cabozantinib compared with bevacizumab monotherapy (Fig. 2B; Phase II, adjusted ; Phase III, adjusted ). Consequently, was shorter for patients treated with cabozantinib compared with bevacizumab with or without irinotecan as part of the BRAIN trial (Fig. 2C; monotherapy, adjusted ; combination, adjusted ), but not when evaluated with respect to phase III data . Also, was significantly higher in patients treated with combination bevacizumab plus irinotecan compared with bevacizumab monotherapy in the phase III trial (Fig. 2D; adjusted ). Together, these results suggest slightly different volumetric responses across the different therapeutic arms.
Fig. 2. Volumetric response parameter measurements for phase II and III trials.
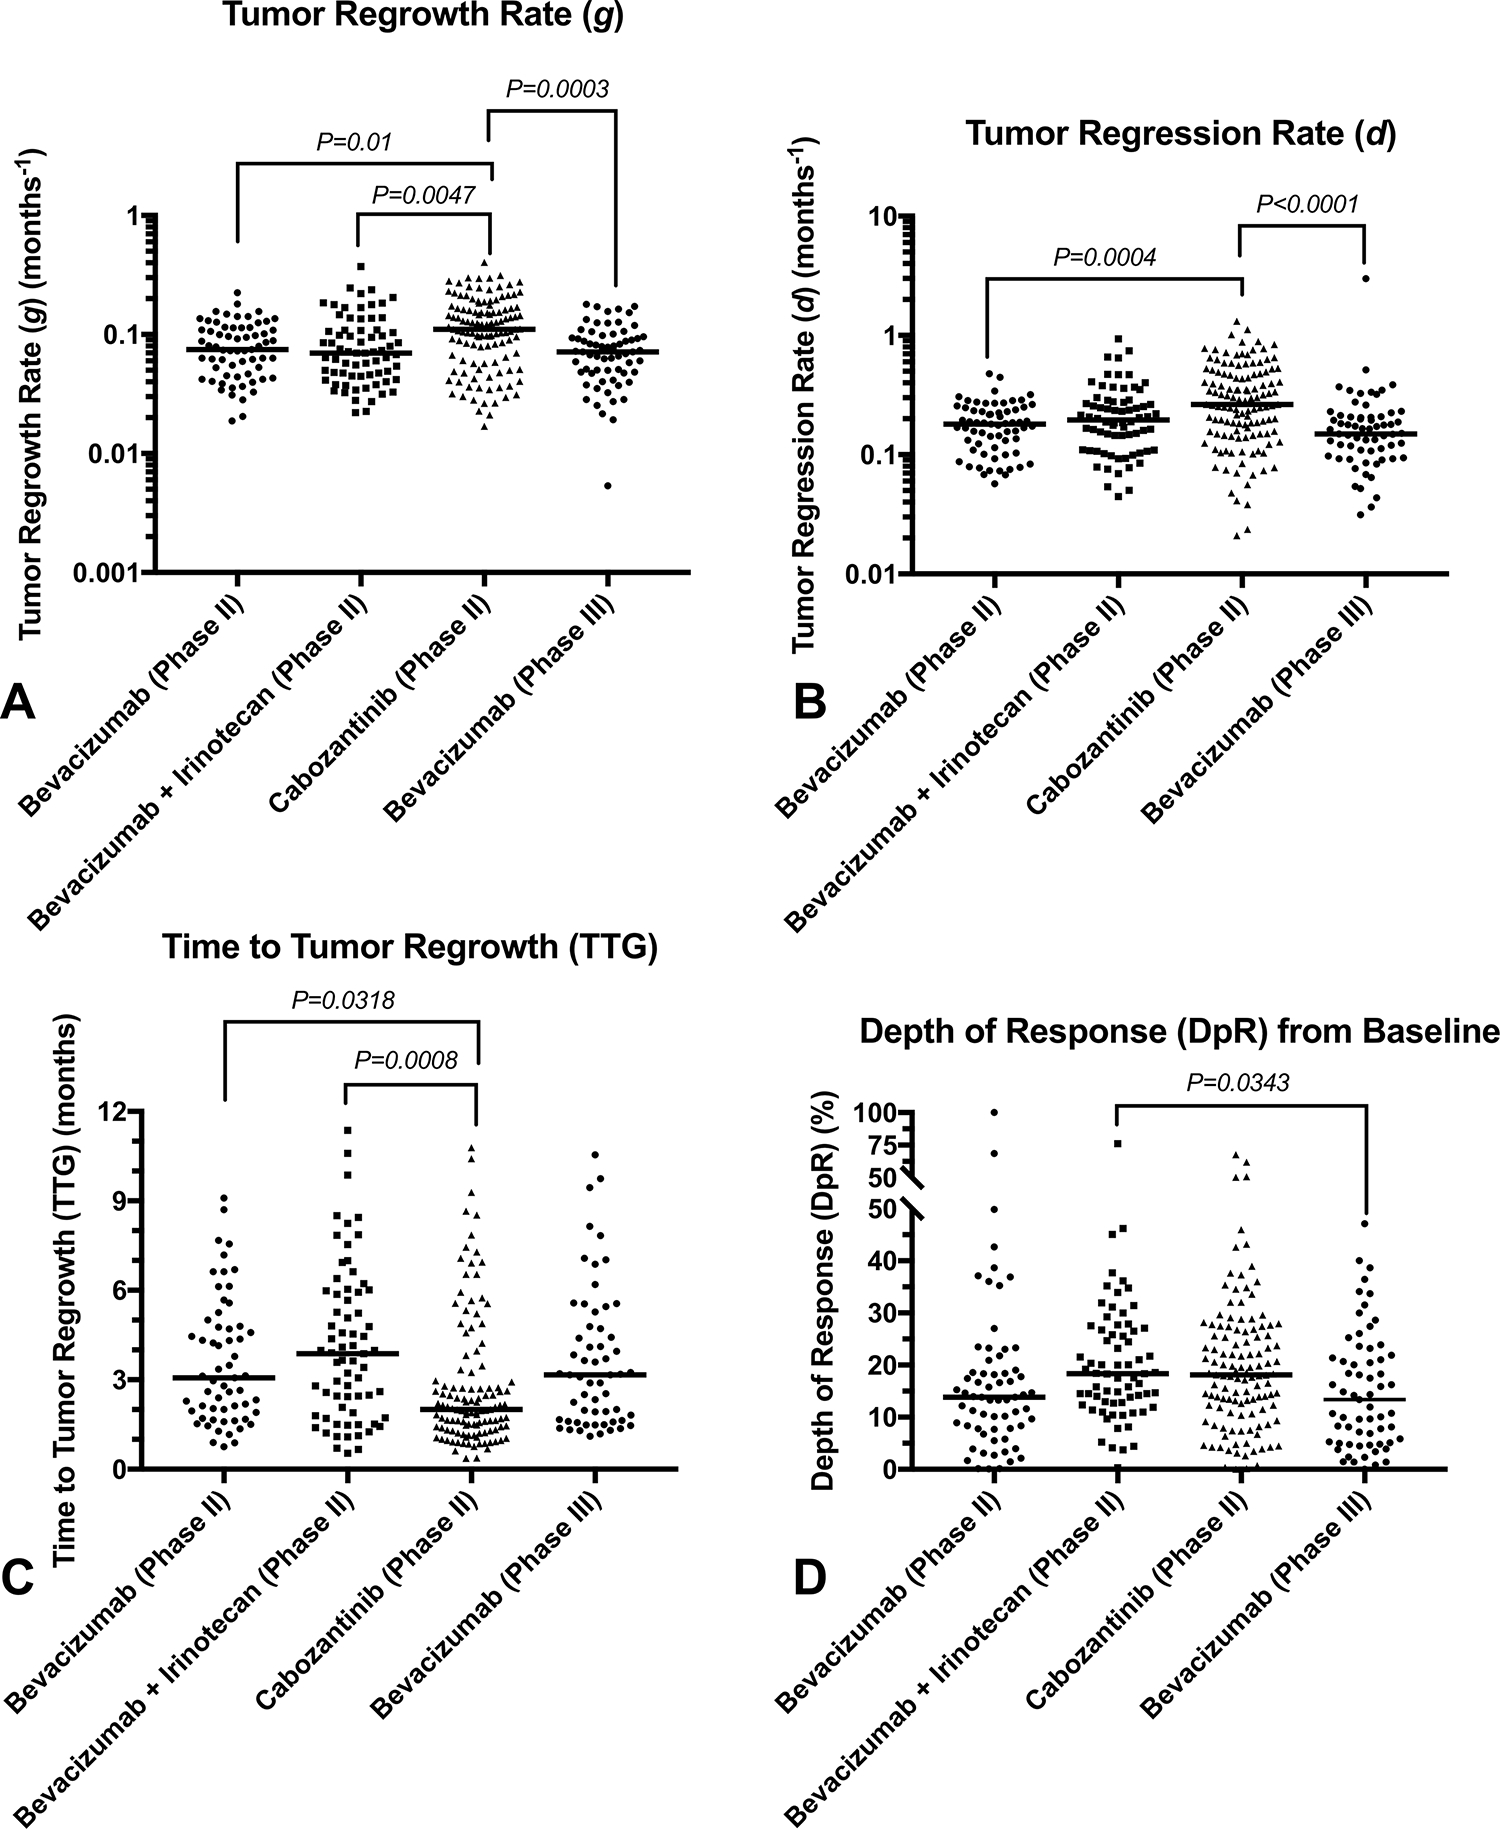
A) Tumor regrowth rate , B) regression rate , C) time to tumor regrowth (), and D) depth of response for bevacizumab monotherapy (phase II), bevacizumab and irinotecan (phase II), cabozantinib (phase II), and an independent phase III bevacizumab monotherapy cohort.
Optimized Biomarker Thresholds
The optimal cutoffs for each model parameter were chosen by quantifying the minimum log-rank hazard ratio and p-values for increasing thresholds (Fig. 3A–D). The optimal cutoff for the largest difference in OS between groups was (Fig. 3A), (Fig. 3B), months (Fig. 3C), and or 35.2% (Fig. 3D). (Note that is different than simply percentage change from baseline because the ratio is log-transformed.). An apparent log-log correlation was observed between and regrowth rate (Fig. 3E), indicating that patients with short regrowth rates have longer time to tumor regrowth. Additionally, a significant linear correlation was observed between tumor regression rate and regrowth rate (Fig. 3F; Pearson’s correlation, ).
Fig. 3. Optimization of thresholds and correlation between volumetric response parameters.
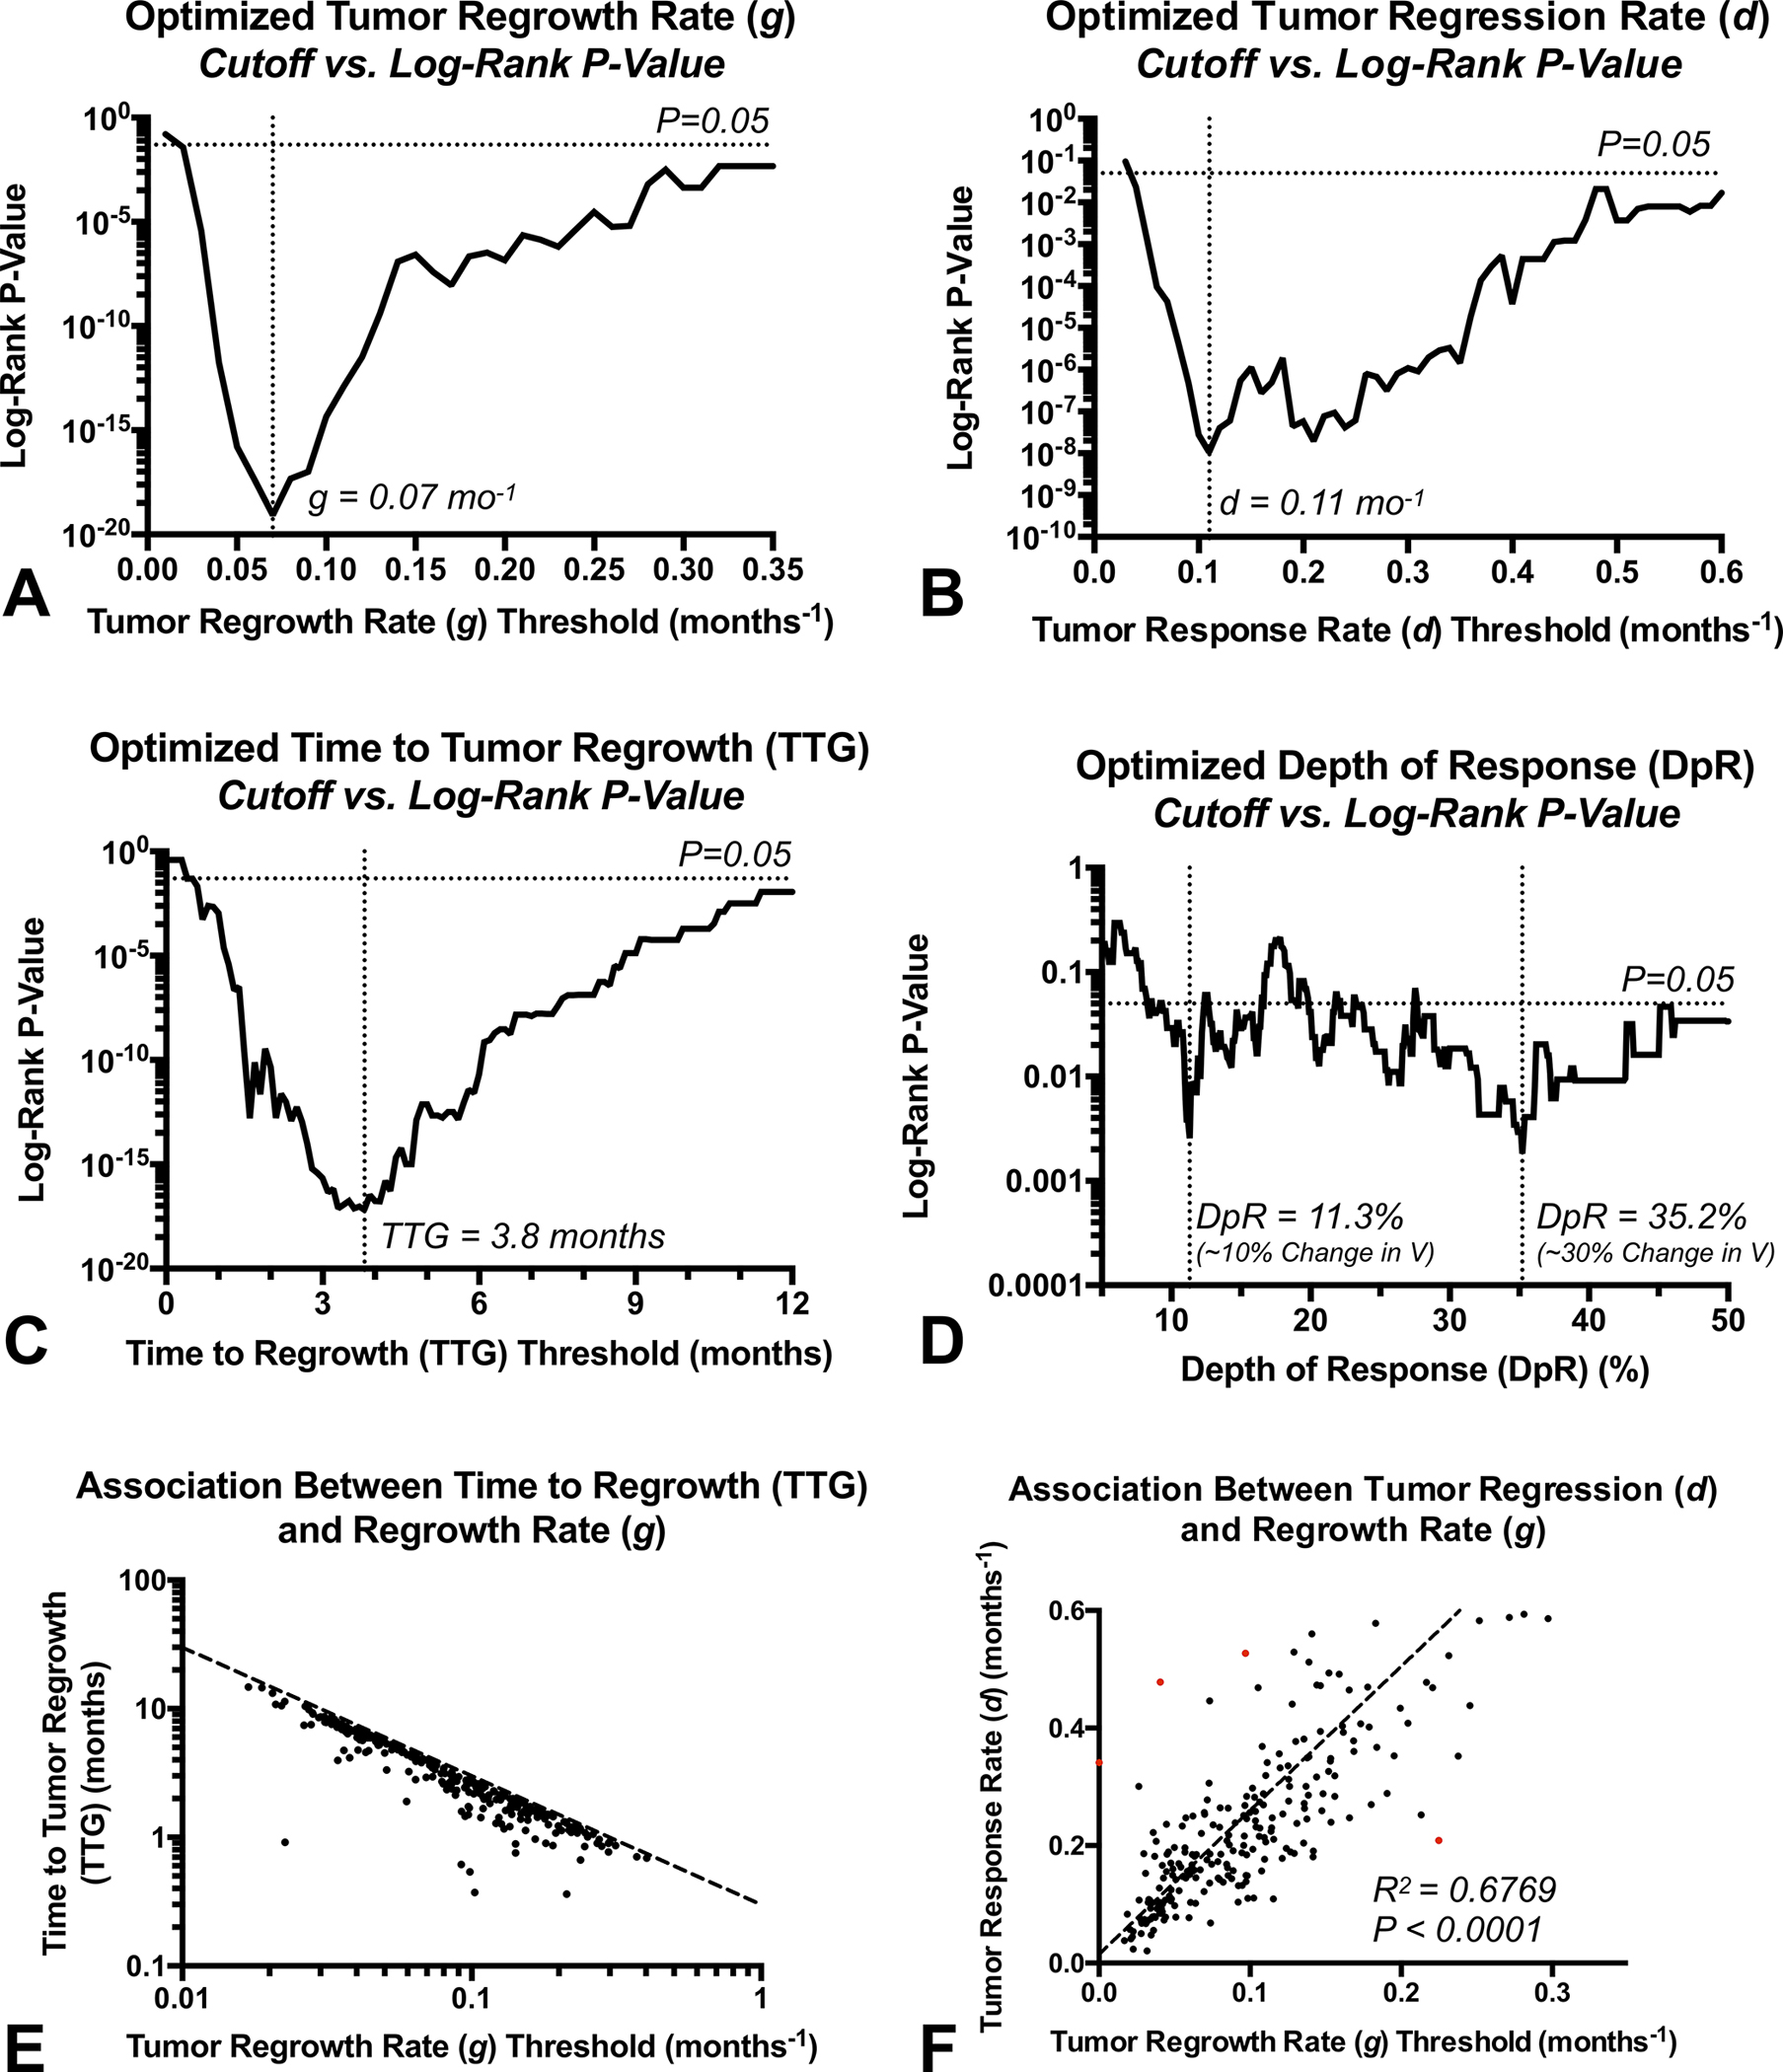
A) Log-rank P-values for different thresholds of tumor regrowth rate , B) regression rate , C) time to tumor regrowth (), and D) depth of response (). Optimized values were chosen based on the lowest P-value, or , and or 35.2%. E) Association between and tumor regrowth rate (). F) Association between tumor response rate () and regrowth rate ().
Univariate Evaluation and Validation Using Optimized Thresholds or Continuous Values
Kaplan-Meier curves applied to univariate Cox analyses for the combined phase II data was used to visualize the significant OS advantage in patients with lower tumor regrowth rate (Supplemental Table S1, Fig. 4A; threshold , Adjusted ), lower regression rate (Fig. 4B; threshold , Adjusted ) longer time to tumor regrowth (Fig. 4C; threshold mo; , Adjusted ), and deeper response using a threshold of (Fig. 4D; , Adjusted ) or (Fig. 4E; ) based on the optimized thresholds. These same trends toward longer survival were observed within each individual phase II trial (Supplemental Table S2; Supplemental Fig. S1), with the exception of in the phase II cabozantinib monotherapy trial . When these same thresholds were applied to an independent phase III dataset (Table 3), results confirmed the OS differences based on regrowth rate () (Fig. 4F; ), regression rate () (Fig. 4G; ), time to regrowth () (Fig. 4H; ), and depth of response using a threshold of 11.3% (Fig. 4I; ). However, a survival advantage in patients with a was not demonstrated with this independent dataset (Fig. 4J; ).
Fig. 4. Kaplan-Meier curves showing differences in overall survival for phase II and III studies using optimized thresholds for volumetric response parameters.
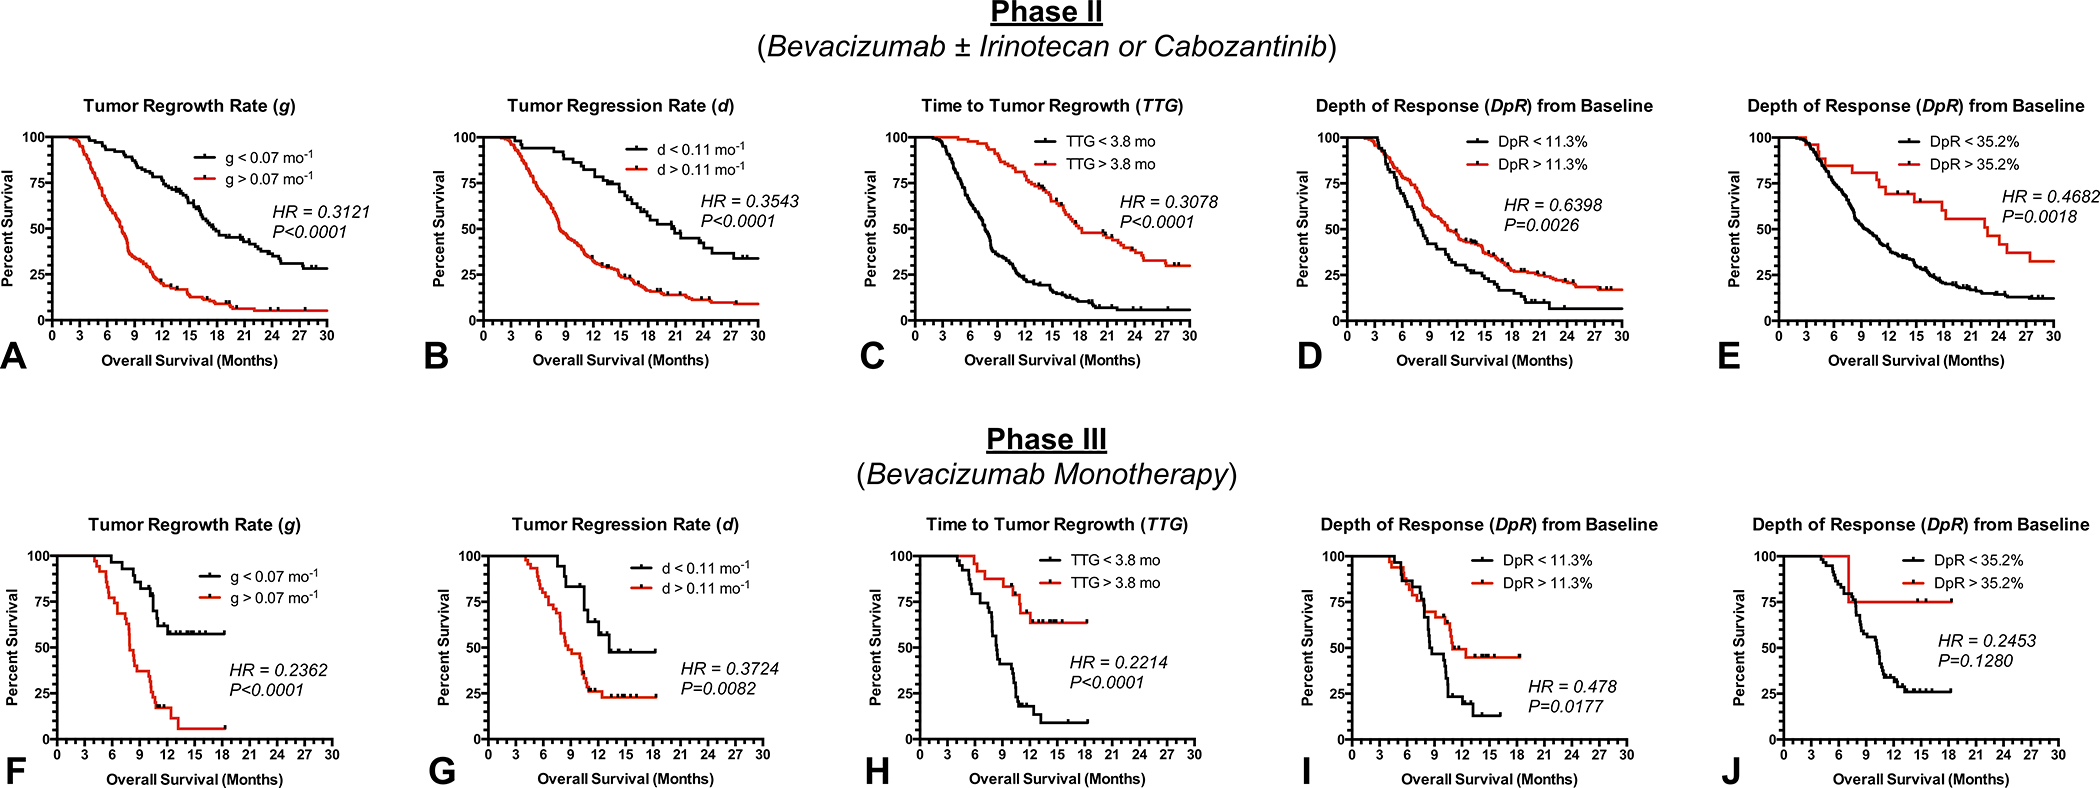
A) Survival in pooled phase II data stratified by , B) , C) , D) and E) . F) Survival in phase III validation stratified by , G) , H) , I) and J) .
While these optimal values were chosen to maximize the difference in survival between groups, Fig. 3A–D suggests most thresholds for , and result in a significant survival difference. Univariate Cox regression analysis using continuous values confirmed these findings (Supplemental Tables S1, S4, S5), showing a significant survival advantage in patients demonstrating a slower tumor regrowth rate, , (Phase II, ; Phase III, ), slower regression rate, , (Phase II, ; Phase III, ), longer time to regrowth, , (Phase II, ; Phase III, ), and larger depth of response, (Phase II, ; Phase III, ) in the combined phase II and independent phase III trials. Individual phase II trials also showed similar trends (Supplemental Table S3), again with the exception of in the phase II cabozantinib monotherapy trial .
Multivariable Cox Evaluation and Validation Using Optimized Thresholds or Continuous Values
To verify that , and were prognostic factors for survival independent of both age and baseline tumor volume, multivariable Cox regression was performed. Using continuous values, data from combined phase II trials confirmed that (Supplemental Table S3; Cox, , , and were independent predictors of survival, which was verified using the independent phase III dataset (). Importantly, baseline enhancing tumor volume was a strong independent prognostic factor for all Cox evaluations . In addition to continuous values, we verified that high and low risk groups defined using the optimal cutoff values were also predictors of survival independent of age and baseline tumor volume. Similar to continuous values, results from phase II trials confirmed and phase III trials verified that (Table 2; Phase II, ; Phase III, (Phase II, ; Phase III, (Phase II, ; Phase III, ), and (Phase II, ; Phase III, ) were independent predictors of survival.
Table 2:
Multivariable Cox Regression Results for Dichotomized Response Variables Using Optimized Threshold Applied to Phase II and III Data.
| Treatment | Variable (Controlling for Age & Baseline Volume) | Coefficient | Cox Hazard Ratio (95% C.I.) | P-Value |
|---|---|---|---|---|
|
| ||||
| Phase II Combined Arms | Tumor Regrowth Rate (g) (g < 0.07 mo.−1 threshold) | −1.3340 ± 0.1575 | 0.2634 (0.1935 – 0.3587) | P < 0.0001 **** |
| Tumor Regression Rate (d) (d < 0.11 mo.−1 threshold) | −1.0979 ± 0.2003 | 0.3336 (0.2252 – 0.4940) | P < 0.0001 **** | |
| Time to Tumor Regrowth (TTG) (TTG > 3.8 months threshold) | −1.3152 ± 0.1602 | 0.2684 (0.1961 – 0.3674) | P < 0.0001 **** | |
| Depth of Response (DpR) (DpR > 11.3%) [%] | −0.5530 ± 0.1564 | 0.5752 (0.4233 – 0.7815) | P = 0.0004 *** | |
| Phase III Validation | Tumor Regrowth Rate (g) (g < 0.07 mo.−1 threshold) | −1.5259 ± 0.3587 | 0.2174 (0.1076 – 0.4392) | P < 0.0001 **** |
| Tumor Regression Rate (d) (d < 0.11 mo.−1 threshold) | −1.0153 ± 0.3985 | 0.3623 (0.1659 – 0.7911) | P = 0.0108 * | |
| Time to Tumor Regrowth (TTG) (TTG > 3.8 months threshold) | −1.6420 ± 0.4033 | 0.1936 (0.0878 – 0.4268) | P < 0.0001 **** | |
| Depth of Response (DpR) (DpR > 11.3%) [%] | −0.8918 ± 0.3383 | 0.4099 (0.2112 – 0.7955) | P = 0.0084 ** | |
=P<0.05
=P<0.01
=P<0.001
=P<0.0001
A composite index based on the combination of DpR and TTG was then created to further stratify risk for early death in recurrent glioblastoma patients treated with anti-VEGF therapy (Fig. 5). Patients were stratified based on whether they had a favorable , favorable ), or both a favorable DpR and TTG. Results for the combined phase II datasets illustrated a significantly longer OS in patients exhibiting both a high and compared with those showing either a favorable or (Fig. 5A; vs. 11.3 mo.; , Log-rank, ) or those with neither a favorable or (Fig. 5A; vs. 7.5 mo.; ). Additionally, patients exhibiting either a favorable or had a significantly longer OS compared with those showing neither a high or (Fig. 5A; vs. 7.5mo.; ). These observations were then confirmed using the independent phase III dataset, where patients exhibiting both a favorable and had a significantly longer OS compared with patients showing either a favorable or (Fig. 5B; mOS=undefined vs. 8.4mo.; ) and patients exhibiting either a favorable or showing a longer OS compared with those illustrating neither (Fig. 5B; vs. 8.4mo.; ). Importantly, phase III data did not confirm the previously observed survival difference between patients illustrating both high and and those showing either a high or (Fig. 5B; ).
Fig. 5. Survival benefit of anti-VEGF treatment is dependent on depth and durability of response.
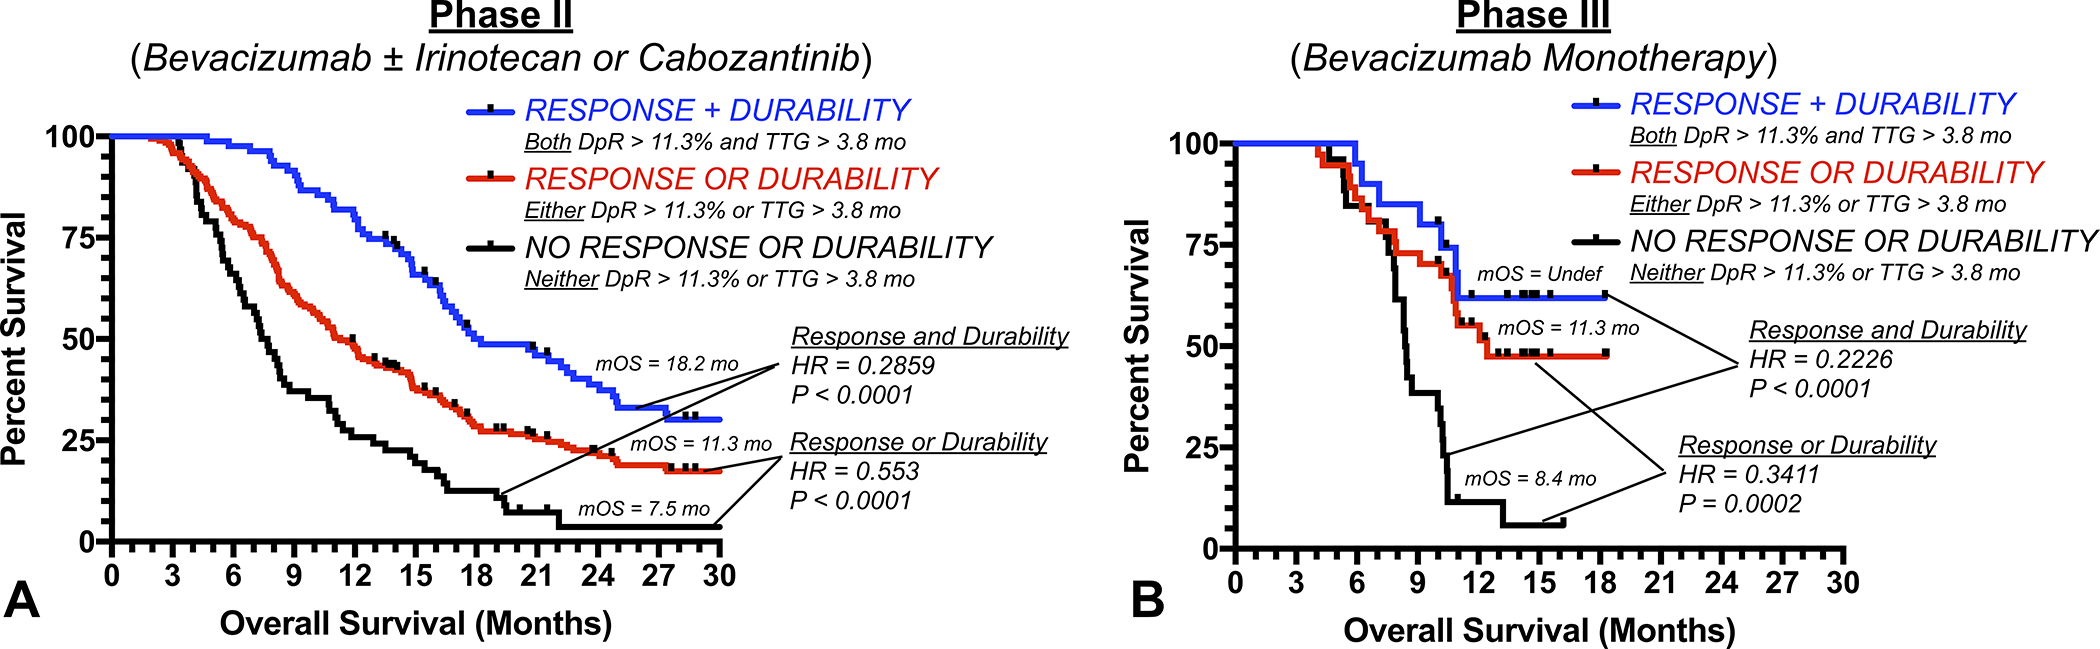
A) Kaplan-Meier curves for pooled phase II and B) phase III validation patients stratified by whether they had (1; black) no response or durability of tumor control (neither nor ), (2; red) either a response or durable tumor control (either or ), or (3; blue) a response and durable tumor control ( and ).
Diffusion MR Phenotypes Reflect Distinct Response Characteristics
Lastly, we tested whether response characteristics were intrinsic to diffusion MR phenotypes known to be predictive of anti-VEGF response (16–18). Phase II data in patients treated with bevacizumab with or without irinotecan showed that patients with a favorable diffusion MR phenotype () had a significantly lower regrowth rate (Supplemental Fig. S1A; ), lower regression rate (), and longer . Phase II data in patients treated with cabozantinib similarly showed that lower regrowth rate (Supplemental Fig. S1B; ) and longer was associated with a favorable diffusion MR phenotype.
DISCUSSION
While anti-VEGF agents have not shown a significant survival advantage compared to cytotoxic chemotherapies in recurrent glioblastoma, bevacizumab received regulatory approval and is used often for clinical care in the end stages of glioblastoma as well as a control arm or in combination with experimental therapy in clinical trials (32). As inexpensive bioequivalents of bevacizumab are becoming available, clinicians are increasingly using anti-VEGF therapies to manage vasogenic edema, inflammation, and neurologic symptoms without the side effects of corticosteroids. Given the high reported response rate and lack of apparent association between RANO response and survival benefit in anti-angiogenic agents (15), however, the field has been skeptical to use anatomic imaging to monitor these patients.
Results from the current study confirm that the combination of T1-weighted digital subtraction maps and mathematical modeling of the volumetric response can be used to identify patients who have a significant survival benefit when treated with anti-VEGF therapies, including bevacizumab and cabozantinib. Results pooled from multiple clinical trials indicate that tumors with more rapid regression rates after anti-VEGF treatment also tend to have a more rapid rebound or regrowth rate. These rapidly responding tumors also tend to have a shorter , or durability of response, and have a significantly shorter survival. Multivariable Cox regression analysis confirmed these observations, validating that all volumetric response measures were independent predictors of OS (i.e. , and ), even when controlling for both age and baseline tumor volume. Data also clearly demonstrates that the combination of the depth of response, , larger than 11% and the durability of response, , longer than 3.8 months was meaningful in terms of predicting long-term survival in patients treated with anti-VEGF therapies.
In addition to confirming that anatomic changes were meaningfully associated with survival benefit in anti-VEGF treatment, results from the current study also confirmed that patients with favorable diffusion MR phenotypes prior to treatment largely reflected the same patients with a favorable radiographic response and survival benefit. Our previous work has shown that diffusion MRI is one of the strongest predictive factors for anti-VEGF treatment outcome in recurrent glioblastoma (16–18), and appears to be associated with increased expression of molecules that modulate the stiffness of the extracellular matrix, namely decorin (33). The current study adds to this previous body of literature and specifically suggests that diffusion MRI, or perhaps intratumoral decorin expression, may be associated with benefit from anti-VEGF therapy as evidenced through a longer time to tumor regrowth () and slower tumor regrowth rate ().
While the proposed biexponential model appears sufficient to characterize the response to anti-angiogenic agents, it may have utility in other treatments. However, the average objective response rate for recurrent GBM ranges between 3–8% for cytotoxic, biologic, and immunotherapies (34) therefore, tumor regression rate term (), depth of response (DpR), and time to regrowth (TTG) may be of limited use in these (non-antiangiogenic) therapies. However, the model is flexible such that if a patient doesn’t have tumor shrinkage (), a slow tumor regrowth rate, , may be of use to quantify tumor control and therapeutic benefit.
While results from the current study have important clinical and trial implications, there are some critical limitations that should be discussed. First, the current study was retrospective and some of the trials were conducted 10–15 years ago, so IDH mutation status and other genetic factors were not available for all the patients. Thus, inclusion of other tumor types may have slightly contaminated our study cohort. Secondly, not all patients treated in the trials were evaluable using the approaches outlined in the current study, as adequate images were required and at least three time points including baseline were required to estimate the response parameters. Despite this limitation, a total of 255 of the eligible 276 phase II patients (92.4%) and 63 of the eligible 74 phase III (85.1%) could be evaluated, suggesting the outlined approach for characterizing volumetric response may not be as restrictive as initially thought.
CONCLUSIONS
Estimates of volumetric tumor regression rate (), regrowth rate (), time to regrowth (), and depth of response () are significant and independent predictors of overall survival in recurrent glioblastoma treated with anti-VEGF therapy. Additionally, patients with favorable diffusion MRI characteristics prior to treatment had a significantly longer and slower tumor regrowth rate than patients with tumors exhibiting restricted diffusion. This information is useful for interpreting activity of anti-angiogenic agents in recurrent glioblastoma.
Supplementary Material
Translational Relevance.
Anti-angiogenic agents are often used as a control group in clinical trials and/or used to control late-stage disease in patients with recurrent glioblastoma, yet there are limited tools for interpreting radiographic changes due to the fact these agents directly alter vascular permeability within the tumor. The current study demonstrates that recurrent glioblastoma patients treated with anti-VEGF therapy who experience a large reduction in tumor size and long durability of the response measured using T1 subtraction maps have a significant survival benefit compared to patients who do not experience a response that is durable, providing confidence that long-term radiographic control of disease is meaningful for patient outcomes.
Financial Support
National Brain Tumor Society (NBTS) and the Sontag Foundation; NIH-NIGMS Training Grant T32 GM008042 (Morris, Cho); NIH/NINDS R01NS078494 (Ellingson); NIH/NCI R01CA270027 (Ellingson, Cloughesy); NIH/NCI P50CA211015 (Ellingson, Cloughesy); ABTA ARC1700002 (Ellingson)
Footnotes
Conflict of interest disclosures
BME is on the advisory board and is a paid consultant for Medicenna, MedQIA, Servier Pharmaceuticals, Siemens, Janssen Pharmaceuticals, Imaging Endpoints, Kazia, Oncoceutics/Chimerix, Sumitomo Dainippon Pharma Oncology, ImmunoGenesis, Ellipses Pharma, Monteris, Neosoma, Alpheus Medical, Sagimet Biosciences, Sapience Therapeutics, and the Global Coalition for Adaptive Research (GCAR).
TFC is cofounder, major stock holder, consultant and board member of Katmai Pharmaceuticals, holds stock for Erasca, member of the board and paid consultant for the 501c3 Global Coalition for Adaptive Research, holds stock in Chimerix and receives milestone payments and possible future royalties, member of the scientific advisory board for Break Through Cancer, member of the scientific advisory board for Cure Brain Cancer Foundation, has provided paid consulting services to Blue Rock, Vida Ventures, Lista Therapeutics, Stemline, Novartis, Roche, Sonalasense, Sagimet, Clinical Care Options, Ideology Health, Servier, Jubilant, Immvira, Gan & Lee, BrainStorm, Katmai, Sapience, Inovio, Vigeo Therapeutics, DNATrix, Tyme, SDP, Kintara, Bayer, Merck, Boehinger Ingelheim, VBL, Amgen, Kiyatec, Odonate Therapeutics QED, Medefield, Pascal Biosciences, Bayer, Tocagen, Karyopharm, GW Pharma, Abbvie, VBI, Deciphera, VBL, Agios, Genocea, Celgene, Puma, Lilly, BMS, Cortice, Novocure, Novogen, Boston Biomedical, Sunovion, Insys, Pfizer, Notable labs, Medqia, Trizel, Medscape and has contracts with UCLA for the Brain Tumor Program with Roche, VBI, Merck, Novartis, BMS, AstraZeneca, Servier. The Regents of the University of California (T.F.C. employer) has licensed intellectual property co-invented by TFC to Katmai Pharmaceuticals.
PYW receives research support from Astra Zeneca, Black Diamond, Bristol Meyers Squibb, Celgene, Chimerix, Eli Lily, Erasca, Genentech/Roche, Kazia, MediciNova, Merck, Novartis, Nuvation Bio, Servier, Vascular Biogenics, VBI Vaccines. He also serves on the advisory board and/or a consultant for Astra Zeneca, Black Diamond, Celularity, Chimerix, Day One Bio, Genenta, Glaxo Smith Kline, Merck, Mundipharma, Novartis, Novocure, Nuvation Bio, Prelude Therapeutics, Sapience, Servier, Sagimet, Vascular Biogenics, VBI Vaccines.
LEA is a previous employee of Genentech, is currently an employee of InCephalo Therapeutics, and holds stock in Novartis, Inc.
JG is a previous employee of Genentech.
DTA is an employee and stockholder of Exelixis.
CH is a previous employee of Exelixis.
TRM is a previous employee of VBL Therapeutics.
DH is a current employee of VBL Therapeutics.
DAN is a co-founder, major stockholder, consultant and board member of Katmai Pharmaceuticals, holds stock for Erasca which has licensed intellectual property related to ERAS-801, and have equity in the company; a co-founder of Trethera Corporation and has equity in the company; and has equity in Sofie Biosciences.
Data generated by others were used under license by the authors
The data analyzed in this study are available from Roche/Genentech, Exelixis, and VBL Therapeutics. Restrictions apply to the availability of these data, which were used under license for this study. Data are available from the authors upon reasonable request with the permission of Roche/Genentech, Exelixis, and VBL Therapeutics.
REFERENCES
- 1.Jensen RL, Ragel BT, Whang K, Gillespie D. Inhibition of hypoxia inducible factor-1alpha (HIF-1alpha) decreases vascular endothelial growth factor (VEGF) secretion and tumor growth in malignant gliomas. J Neurooncol 2006;78(3):233–47 doi 10.1007/s11060-005-9103-z. [DOI] [PubMed] [Google Scholar]
- 2.Plate KH, Breier G, Weich HA, Risau W. Vascular endothelial growth factor is a potential tumour angiogenesis factor in human gliomas in vivo. Nature 1992;359(6398):845–8 doi 10.1038/359845a0. [DOI] [PubMed] [Google Scholar]
- 3.Batchelor TT, Reardon DA, de Groot JF, Wick W, Weller M. Antiangiogenic therapy for glioblastoma: current status and future prospects. Clin Cancer Res 2014;20(22):5612–9 doi 10.1158/1078-0432.CCR-14-0834. [DOI] [PMC free article] [PubMed] [Google Scholar]
- 4.Gerstner ER, Batchelor TT. Antiangiogenic therapy for glioblastoma. Cancer J 2012;18(1):45–50 doi 10.1097/PPO.0b013e3182431c6f. [DOI] [PMC free article] [PubMed] [Google Scholar]
- 5.Friedman HS, Prados MD, Wen PY, Mikkelsen T, Schiff D, Abrey LE, et al. Bevacizumab alone and in combination with irinotecan in recurrent glioblastoma. J Clin Oncol 2009;27(28):4733–40 doi 10.1200/JCO.2008.19.8721. [DOI] [PubMed] [Google Scholar]
- 6.Kreisl TN, Kim L, Moore K, Duic P, Royce C, Stroud I, et al. Phase II trial of single-agent bevacizumab followed by bevacizumab plus irinotecan at tumor progression in recurrent glioblastoma. J Clin Oncol 2009;27(5):740–5 doi 10.1200/JCO.2008.16.3055. [DOI] [PMC free article] [PubMed] [Google Scholar]
- 7.Wick W, Gorlia T, Bendszus M, Taphoorn M, Sahm F, Harting I, et al. Lomustine and Bevacizumab in Progressive Glioblastoma. N Engl J Med 2017;377(20):1954–63 doi 10.1056/NEJMoa1707358. [DOI] [PubMed] [Google Scholar]
- 8.Reardon DA, Brandes AA, Omuro A, Mulholland P, Lim M, Wick A, et al. Effect of Nivolumab vs Bevacizumab in Patients With Recurrent Glioblastoma: The CheckMate 143 Phase 3 Randomized Clinical Trial. JAMA Oncol 2020;6(7):1003–10 doi 10.1001/jamaoncol.2020.1024. [DOI] [PMC free article] [PubMed] [Google Scholar]
- 9.Batchelor TT, Duda DG, di Tomaso E, Ancukiewicz M, Plotkin SR, Gerstner E, et al. Phase II study of cediranib, an oral pan-vascular endothelial growth factor receptor tyrosine kinase inhibitor, in patients with recurrent glioblastoma. J Clin Oncol 2010;28(17):2817–23 doi 10.1200/jco.2009.26.3988. [DOI] [PMC free article] [PubMed] [Google Scholar]
- 10.Brown N, McBain C, Nash S, Hopkins K, Sanghera P, Saran F, et al. Multi-Center Randomized Phase II Study Comparing Cediranib plus Gefitinib with Cediranib plus Placebo in Subjects with Recurrent/Progressive Glioblastoma. PLOS ONE 2016;11(5):e0156369 doi 10.1371/journal.pone.0156369. [DOI] [PMC free article] [PubMed] [Google Scholar]
- 11.Batchelor TT, Mulholland P, Neyns B, Nabors LB, Campone M, Wick A, et al. Phase III randomized trial comparing the efficacy of cediranib as monotherapy, and in combination with lomustine, versus lomustine alone in patients with recurrent glioblastoma. J Clin Oncol 2013;31(26):3212–8 doi 10.1200/jco.2012.47.2464. [DOI] [PMC free article] [PubMed] [Google Scholar]
- 12.Wen PY, Drappatz J, de Groot J, Prados MD, Reardon DA, Schiff D, et al. Phase II study of cabozantinib in patients with progressive glioblastoma: subset analysis of patients naive to antiangiogenic therapy. Neuro Oncol 2018;20(2):249–58 doi 10.1093/neuonc/nox154. [DOI] [PMC free article] [PubMed] [Google Scholar]
- 13.Cloughesy TF, Brenner A, de Groot JF, Butowski NA, Zach L, Campian JL, et al. A randomized controlled phase III study of VB-111 combined with bevacizumab vs bevacizumab monotherapy in patients with recurrent glioblastoma (GLOBE). Neuro Oncol 2020;22(5):705–17 doi 10.1093/neuonc/noz232. [DOI] [PMC free article] [PubMed] [Google Scholar]
- 14.Taal W, Oosterkamp HM, Walenkamp AM, Dubbink HJ, Beerepoot LV, Hanse MC, et al. Single-agent bevacizumab or lomustine versus a combination of bevacizumab plus lomustine in patients with recurrent glioblastoma (BELOB trial): a randomised controlled phase 2 trial. Lancet Oncol 2014;15(9):943–53 doi 10.1016/s1470-2045(14)70314-6. [DOI] [PubMed] [Google Scholar]
- 15.Ellingson BM, Wen PY, Chang SM, van den Bent M, Vogelbaum MA, Li G, et al. Objective response rate (ORR) targets for recurrent glioblastoma clinical trials based on the historic association between ORR and median overall survival. Neuro Oncol 2023. doi 10.1093/neuonc/noad002. [DOI] [PMC free article] [PubMed] [Google Scholar]
- 16.Ellingson BM, Gerstner ER, Smits M, Huang RY, Colen R, Abrey LE, et al. Diffusion MRI Phenotypes Predict Overall Survival Benefit from Anti-VEGF Monotherapy in Recurrent Glioblastoma: Converging Evidence from Phase II Trials. Clin Cancer Res 2017;23(19):5745–56 doi 10.1158/1078-0432.Ccr-16-2844. [DOI] [PMC free article] [PubMed] [Google Scholar]
- 17.Ellingson BM, Sahebjam S, Kim HJ, Pope WB, Harris RJ, Woodworth DC, et al. Pretreatment ADC histogram analysis is a predictive imaging biomarker for bevacizumab treatment but not chemotherapy in recurrent glioblastoma. AJNR Am J Neuroradiol 2014;35(4):673–9 doi 10.3174/ajnr.A3748. [DOI] [PMC free article] [PubMed] [Google Scholar]
- 18.Schell M, Pflüger I, Brugnara G, Isensee F, Neuberger U, Foltyn M, et al. Validation of diffusion MRI phenotypes for predicting response to bevacizumab in recurrent glioblastoma: post-hoc analysis of the EORTC-26101 trial. Neuro Oncol 2020;22(11):1667–76 doi 10.1093/neuonc/noaa120. [DOI] [PMC free article] [PubMed] [Google Scholar]
- 19.Wilkerson J, Abdallah K, Hugh-Jones C, Curt G, Rothenberg M, Simantov R, et al. Estimation of tumour regression and growth rates during treatment in patients with advanced prostate cancer: a retrospective analysis. Lancet Oncol 2017;18(1):143–54 doi 10.1016/S1470-2045(16)30633-7. [DOI] [PubMed] [Google Scholar]
- 20.Stein WD, Wilkerson J, Kim ST, Huang X, Motzer RJ, Fojo AT, et al. Analyzing the pivotal trial that compared sunitinib and IFN-α in renal cell carcinoma, using a method that assesses tumor regression and growth. Clin Cancer Res 2012;18(8):2374–81 doi 10.1158/1078-0432.CCR-11-2275. [DOI] [PMC free article] [PubMed] [Google Scholar]
- 21.Maitland ML, Wilkerson J, Karovic S, Zhao B, Flynn J, Zhou M, et al. Enhanced Detection of Treatment Effects on Metastatic Colorectal Cancer with Volumetric CT Measurements for Tumor Burden Growth Rate Evaluation. Clin Cancer Res 2020;26(24):6464–74 doi 10.1158/1078-0432.CCR-20-1493. [DOI] [PMC free article] [PubMed] [Google Scholar]
- 22.Ellingson BM, Kim HJ, Woodworth DC, Pope WB, Cloughesy JN, Harris RJ, et al. Recurrent glioblastoma treated with bevacizumab: contrast-enhanced T1-weighted subtraction maps improve tumor delineation and aid prediction of survival in a multicenter clinical trial. Radiology 2014;271(1):200–10 doi 10.1148/radiol.13131305. [DOI] [PMC free article] [PubMed] [Google Scholar]
- 23.Ellingson BM, Aftab DT, Schwab GM, Hessel C, Harris RJ, Woodworth DC, et al. Volumetric response quantified using T1 subtraction predicts long-term survival benefit from cabozantinib monotherapy in recurrent glioblastoma. Neuro Oncol 2018;20(10):1411–8 doi 10.1093/neuonc/noy054. [DOI] [PMC free article] [PubMed] [Google Scholar]
- 24.Cloughesy TF, Brenner A, de Groot JF, Butowski NA, Zach L, Campian JL, et al. A randomized controlled phase III study of VB-111 combined with bevacizumab vs bevacizumab monotherapy in patients with recurrent glioblastoma (GLOBE). Neuro Oncol 2020;22(5):705–17 doi 10.1093/neuonc/noz232. [DOI] [PMC free article] [PubMed] [Google Scholar]
- 25.Ellingson BM, Bendszus M, Boxerman J, Barboriak D, Erickson BJ, Smits M, et al. Consensus recommendations for a standardized Brain Tumor Imaging Protocol in clinical trials. Neuro Oncol 2015;17(9):1188–98 doi 10.1093/neuonc/nov095. [DOI] [PMC free article] [PubMed] [Google Scholar]
- 26.Ellingson BM, Kim HJ, Woodworth DC, Pope WB, Cloughesy JN, Harris RJ, et al. Recurrent glioblastoma treated with bevacizumab: contrast-enhanced T1-weighted subtraction maps improve tumor delineation and aid prediction of survival in a multicenter clinical trial. Radiology 2014;271(1):200–10 doi 10.1148/radiol.13131305. [DOI] [PMC free article] [PubMed] [Google Scholar]
- 27.Hagiwara A, Oughourlian TC, Cho NS, Schlossman J, Wang C, Yao J, et al. Diffusion MRI is an early biomarker of overall survival benefit in IDH wild-type recurrent glioblastoma treated with immune checkpoint inhibitors. Neuro Oncol 2022;24(6):1020–8 doi 10.1093/neuonc/noab276. [DOI] [PMC free article] [PubMed] [Google Scholar]
- 28.Woodworth DC, Pope WB, Liau LM, Kim HJ, Lai A, Nghiemphu PL, et al. Nonlinear distortion correction of diffusion MR images improves quantitative DTI measurements in glioblastoma. J Neurooncol 2014;116(3):551–8 doi 10.1007/s11060-013-1320-2. [DOI] [PMC free article] [PubMed] [Google Scholar]
- 29.Pope WB, Kim HJ, Huo J, Alger J, Brown MS, Gjertson D, et al. Recurrent glioblastoma multiforme: ADC histogram analysis predicts response to bevacizumab treatment. Radiology 2009;252(1):182–9 doi 10.1148/radiol.2521081534. [DOI] [PubMed] [Google Scholar]
- 30.Pope WB, Qiao XJ, Kim HJ, Lai A, Nghiemphu P, Xue X, et al. Apparent diffusion coefficient histogram analysis stratifies progression-free and overall survival in patients with recurrent GBM treated with bevacizumab: a multi-center study. J Neurooncol 2012;108(3):491–8 doi 10.1007/s11060-012-0847-y. [DOI] [PMC free article] [PubMed] [Google Scholar]
- 31.Lausen B, Schumacher M. Evaluating the effect of optimized cutoff values in the assessment of prognostic factors. Comput Stat Data An 1996;21(3):307–26 doi Doi 10.1016/0167-9473(95)00016-X. [DOI] [Google Scholar]
- 32.Kim MM, Umemura Y, Leung D. Bevacizumab and Glioblastoma: Past, Present, and Future Directions. The Cancer Journal 2018;24(4):180–6 doi 10.1097/ppo.0000000000000326. [DOI] [PubMed] [Google Scholar]
- 33.Patel KS, Yao J, Raymond C, Yong W, Everson R, Liau LM, et al. Decorin expression is associated with predictive diffusion MR phenotypes of anti-VEGF efficacy in glioblastoma. Sci Rep 2020;10(1):14819 doi 10.1038/s41598-020-71799-w. [DOI] [PMC free article] [PubMed] [Google Scholar]
- 34.Ellingson BM, Wen PY, Chang SM, van den Bent M, Vogelbaum MA, Li G, et al. Objective response rate targets for recurrent glioblastoma clinical trials based on the historic association between objective response rate and median overall survival. Neuro Oncol 2023;25(6):1017–28 doi 10.1093/neuonc/noad002. [DOI] [PMC free article] [PubMed] [Google Scholar]
Associated Data
This section collects any data citations, data availability statements, or supplementary materials included in this article.