

Structured Abstract
INTRODUCTION:
Vascular damage in Alzheimer Disease (AD) has resulted in conflicting findings particularly when analyzing longitudinal data. We introduce WMH longitudinal morphometric analysis (WLMA) that quantifies WMH expansion as the distance from lesion voxels to a region of interest boundary.
METHODS:
WMH segmentation maps were derived from 270 longitudinal Fluid-Attenuated Inversion Recovery (FLAIR) ADNI images. WLMA was performed on 5 data-driven WMH patterns with distinct spatial distributions. Amyloid accumulation was evaluated with WMH expansion across the 5 data-driven WMH patterns.
RESULTS:
The preclinical group had significantly greater expansion in the posterior ventricular WM compared to controls. Amyloid significantly associated with frontal WMH expansion primarily within AD individuals. WLMA outperformed WMH volume changes for classifying AD from controls primarily in periventricular and posterior WMH.
DISCUSSION:
This data supports the concept that localized WMH expansion continue to proliferate with amyloid accumulation throughout the entirety of the disease in distinct spatial locations.
Keywords: AD, WMH, WLMA, Preclinical, Longitudinal
Background
The etiology of Alzheimer disease (AD) has been described as the accumulation of beta-amyloid, phosphorylated tau, and neurodegeneration leading to cognitive impairment.1 Classically referred to as the AT(N) hypothesis, this evolving concept has expanded to infer vascular changes, but its role remains undefined in the pathophysiology of AD.2 Pathological evidence suggests that a majority of individuals with AD have mixed pathology with concurrent vascular changes present. A commonly used method for measuring the severity of vascular changes is by quantifying regions of high intensity on fluid attenuated inversion recovery (FLAIR) images called white matter hyperintensities (WMH).3 Vascular changes are inherently a risk factor for the development of not only AD but other neurodegenerative diseases. However, it remains unclear whether AD pathology includes vascular damage, or whether AD pathology and vascular damage are co-pathologies contributing to the AD process.4
In observational studies, increases in WMH are associated with both cumulative and longitudinal beta-amyloid burden, even in healthy controls.5 In contrast, WMH presence is less associated with CSF t-tau or p-tau. In the ATN framework, amyloid accumulation occurs earlier in the disease suggesting that WMH changes might occur earlier in AD process.6 A known genetic risk factor for AD, apolipoprotein (APOE) ε4 allele, often associate with both elevated WMH presence and increased levels of beta-amyloid supporting a related mechanism.7 Prior works has shown that presence of at least one APOE ε4 allele can promote cerebrovascular injury and is associated with earlier cognitive loss.8–9 While the role of WMH in AD remains unclear, the aforementioned studies implicate WMH occurrence can relate to biomarkers and severity risk for AD.10–12
Growing evidence in neurodegenerative diseases have shown that WMH are heterogeneous and that the spatial location of WMH is more important than the cumulative WMH global burden for determining disease severity.13–14 Global WMH summary metrics ignore specific regional effects and may undermine the sensitivity for detecting AD-specific WMH patterns. Prior strategies have focused on anatomical boundaries to evaluate regional specificity rather than spatially defined ROIs based on WMH relationships with pathological markers.12,15 A growing trend is to identify data-driven WMH spatial patterns in both healthy16 and neurodegenerative populations.17 Evaluating WMH patterns in AD has shown that certain patterns are distinct for vascular and amyloid risk factors.17 WMH within the posterior white matter regions are uniquely associated with AD biomarkers implying the importance of analyzing location-specific WMH burden cross-sectionally. This demonstrates location-specific WMH that were associated with unique pathologies including AD and AD related disorders (ADRD). However, these findings are based on cross-sectional findings and it remains unclear whether these patterns persist for longitudinal analyses across AD severity.
Measurement of WMH volume has been the standard approach to quantifying lesion burden, but shape irregularity creates challenges for volume-based comparisons in location-specific WMH volume changes, particularly for longitudinal data. However, evaluation on WMH shape changes are not restricted by these limitations which quantify changes of the lesion boundary across time. We propose a novel approach—white matter hyperintensity longitudinal morphometric analysis (WLMA)—for quantifying longitudinal WMH expansion to identify AD-specific longitudinal WMH change. Within each of the previously identified etiology-specific WM regions (juxtacortical, deep frontal, periventricular, parietal and posterior),17 we evaluated WMH change using WLMA compared to traditional volume for cognitively normal, preclinical, and symptomatic AD individuals. We further evaluated the contribution of APOE ε4 and amyloid on observed WMH change.
Methods
Participants:
Data utilized in this study were obtained from the ADNI database (www.adni.loni.usc.edu), a private-public partnership established in 2003, led by the principal investigator Michael W. Weiner, MD. ADNI is a longitudinal multi-center study designed to develop clinical, imaging, genetic, and biochemical biomarkers for detection and prognosis of AD. Appropriate Institutional Review Boards approval occurred at each ADNI site and informed consent in accordance with the Declaration of Helsinki was obtained from each participant or authorized representative. All ADNI participants were between 55–90 years old, had at least 6 years of education, and were free of any significant neurological disease or systemic illness. We included only participants with baseline and follow-up 3.0-Tesla 2D FLAIR images obtained at least 2 years apart from ADNI GO and ADNI 2 in the present analyses (n = 368).
Clinical Dementia Rating (CDR):
Experienced clinicians conducted semi-structured interviews with each participant and a knowledgeable collateral source. The CDR® was used to evaluate a participant’s degree of impairment. A score of CDR 0 indicates that the individual is cognitively normal, CDR 0.5 corresponds to very mild dementia, and CDR ≥ 1 specifies mild-to-moderate dementia. Participants with a score of CDR > 0 had a clinical diagnosis of dementia due to AD. Individuals were considered symptomatic if they had a CDR score >0.
APOE Status:
APOE genotyping for all participants were extracted from the ADNI database as previously described.18 For APOE analyses, individuals were grouped according to the number of ε4 alleles (none, one or two).
PET Processing:
Florbetapir PET scan date was matched to the closest baseline MR imaging date for each participant, and the summary values were extracted from the ADNI database derived from a post-reconstruction processed format. Processing steps included co-registration and averaging of the individual PET frames and orientation to the AD PC line. Full details of the processing steps can be found online (http://adni.loni.usc.edu/methods/pet-analysis/pre-processing/). For this study we used the standard global cortical SUVRs with the cerebellum serving as a reference region (https://adni.loni.usc.edu/methods/pet-analysis). Global amyloid-positivity was defined and downloaded from ADNI using the cut-off SUVR >1.19–20
White Matter Hyperintensity Regional Volume:
All detailed acquisition steps for the FLAIR and MR images are available at the ADNI website (https://adni.loni.usc.edu/methods/). FLAIR images were brain extracted, bias field corrected and we normalized the mode and standard deviation of the FLAIR image to allow for consistent intensity thresholds across different participants. FLAIR images were brain extracted, bias field corrected and were subsequently normalized using a modified Z-score transformation with 2*SD for intensity standardization across all participant images. Further preprocessing details and methodologies regarding the automated WMH segmentation pipeline have been previously described.17 Following WMH segmentation, each individual’s T1 map was warped to the corresponding FLAIR timepoint. A mid-space was then made with halfway warps created from a variation of siena_flirt in FSL using the linear warp matrix and inverse warp matrix between the two FLAIR timepoints. After aligning the T1 timepoints together in a halfway space we averaged the two T1 timepoints together then proceeded to create the registration matrix to the icbm template space. This was performed with both linear and nonlinear registration tools from FSL.21–22 The corresponding halfway space and template warp matrices generated from the average T1 image in halfway space were then applied to the corresponding FLAIR and WMH segmentation images. We derived region-based longitudinal WMH volume change for each of the five etiology-specific WMH spatial patterns by subtracting WMH burden for timepoint 2 (TP2) from timepoint 1 (TP1) within regions demarcated by each of the WMH spatial pattern (Supplemental F1). This provided a metric of WMH volume change, and this term will be used throughout the paper to refer to the output for the standard longitudinal WMH methodology (Evaluation of WMH volume vs. shape change in predicting AD for further details). WMH volumes were not normally distributed and were log transformed for both TP1 and TP2.
White Matter Hyperintensity Regional Expansion:
Figure 1 is a visual schematic that demonstrates the overall concept of quantifying WMH expansion with regards to distance. As the white matter lesion expands over time, regardless of uniformity, the distance between the ROI and lesion boundaries would shrink representing WMH expansion. WLMA was conducted on each of the etiology-specific WMH spatial patterns in template space (MNI). First, the pattern boundary is created from the voxels that reside on the outer edge of each WMH spatial pattern (Supplemental F1). Distance maps were then generated for each of the WMH spatial patterns across all participants and for both time points. The intensity values for the pattern boundary voxels were defined as the Euclidean distance from each boundary voxel to the first lesion voxel within the confines of the corresponding pattern. This operation was performed using distancemap as part of FMRIB’s Integrated Registration and Segmentation Tool (FIRST) a package for gray matter shape analysis.23 Throughout the paper we will only refer to WMH expansion/reduction as the output from the WLMA methodology (Evaluation of WMH volume vs. shape change in predicting AD for further details).
Figure 1:

Example schematic of the WLMA technique for capturing WMH expansion. The blue translucent box (region) represents a WMH cluster. As the WMH (teal structure) expands from timepoint 1 to timepoint 2 that change is reflected along the box’s outer edge as a change in distance visually depicted as the transformation from blue to yellow.
Distance difference (DD) maps were created by subtracting the TP2 from TP1 WMH maps where greater positivity represented increased WMH expansion (Figure 2C). Average DD maps were constructed at the voxel-level for each of the five WMH spatial patterns and combined qualitatively to observe localized patterns of expansion or reduction across all participants. This process allows the distance measurements to be spatially fixed by performing the analyses on the boundaries with subject specific intensity values rather than spatially distinct WMH clusters.
Figure 2:

A) Shows the difference frequency map with a range of WMH overlap from 0% to maximum of 25%. Increased intensity represents greater overlap. B) Isolation of the robust maximum overlap for WMH volume. C) WMH distribution across all five clusters. D) Average DD map and units are in mm.
WMH association with AD Process:
Participants were classified based on their baseline status as either cognitively normal controls (CN), preclinical (PC), or AD for a voxel-wise ANOVA across each WMH spatial pattern. CN individuals were defined as CDR =0 with low levels of amyloid-PET (amyloid SUVR <1.1). PC individuals were defined as CDR =0 with elevated PET amyloid (amyloid SUVR >1.1). AD individuals were defined as CDR>0 with amyloid SUVR >1.1.
WMH volume change for each WMH pattern were compared across the three groups with an omnibus ANOVA. Bonferroni correction was used to address multiple comparisons yielding a p<0.01 as our threshold for significance. T-tests were subsequently performed for any pattern that survived our statistical threshold for the ANOVA.
The WLMA-based DD maps (WMH expansion) were evaluated across groups at the voxel-level pattern boundary. The voxel-wise ANOVA was performed to assess WMH expansion across the three groups. This analysis was conducted with Randomise,24,25 the statistical toolbox in FSL. A statistical threshold of p < 0.05 corrected for multiple comparisons was performed using 5000 Monte Carlo permutations and threshold-free clustering. For significant patterns, voxel-wise t-tests were performed to determine the group or groups driving the effect using the same statistical parameters as described in the ANOVA.
DD regional map association with Amyloid and APOE:
Voxel-wise correlations were performed between the WMH spatial patterns’ DD maps and baseline PET amyloid summary values. APOE status was evaluated with voxel-wise ANOVA for each WMH pattern comparing WMH expansion and APOE ε4 allele frequency. Both the correlation and ANOVA were performed on the DD maps for all patterns analyzed with Randomise. All comparisons used a statistical threshold of p < 0.05 corrected for multiple comparisons with FDR and performed using 5000 Monte Carlo permutations and threshold free clustering.
Evaluation of WMH volume vs. shape change in predicting AD
We hypothesized that voxel-wise WLMA, which incorporates etiology-specific WMH spatial pattern information are more sensitive and specific for AD-related WMH changes. We implemented two different machine-learning (ML) classifier algorithms using Python library Scikit-learn. We applied support vector machine (SVM) and random forest (RF) classifiers to test whether WLMA is a more selective feature compared to longitudinal changes in total and regional WMH volumes for predicting AD versus CN. We made comparisons across different ML algorithms to demonstrate if WLMA was more robust for predicting AD. The ML experiments were performed on only the AD and control study cohort (n = 230), and consist of two steps: feature selection followed by the actual classification. For feature selection, we considered a total of 28,872 voxels with longitudinal WMH morphometric changes as potential features for WLMA, identified 274 principal components (PC) using principal component analysis, then utilized Kruskal-Wallis feature selection with a threshold of p <0.10 to select 22 PCs as discriminative input features of WMLA. In a separate region-based analysis, we performed similar feature selection as above restricted to voxels within the boundaries of each of the five previously-defined WMH spatial patterns resulting in 21–30 PCs representing longitudinal WMH morphometric changes for each WMH spatial pattern. In contrast, 6 input features were selected as representative of longitudinal WMH volume changes (global and regional WMH based on the etiology-specific WMH spatial patterns). We utilized a 70–30% train-test split with 160 individuals randomly selected as the training and validation dataset, whereas 68 individuals formed the test dataset that was later used to test the ability of the final ML models to predict AD. Model training, validation, and testing were performed using repeated 5-fold cross validation with 10 iterations. Hyperparameter optimization was performed within validation sets for SVM: kernel type, and regularization strength, and for RF: the number of trees, the depth of each tree, and the number of features selected for determining tree split, using GridSearchCV to obtain the combination of hyperparameters that maximizes model performance. Model performance was evaluated on the test sets by measuring performance indices of accuracy (percent correctly classified), recall (sensitivity), precision (positive predictive value), and F1-Score (harmonic mean of precision and recall) for SVM and RF-based models using WLMA and volumetric-based features separately. McNemar’s test was applied to explore for significant difference in prediction accuracies between different feature types (WLMA vs. volumetry-based) and different ML classifier algorithms.
Results
Demographics:
368 individuals with at least one follow-up assessment within years were included in our study. 98 individuals were excluded from analyses for exhibiting non-AD pathology (n=93), poor registration (n=4), and poor scan quality (n=1). This yielded a total of 270 individuals that were included into the following analyses (n=270: 98 CN, 42 PC and 130 AD) (Supplemental F2). Further details are provided in Table 1. The average time period between TP1 and TP2 was 3 years with a standard deviation of 1.02 years. For this analysis cohort, no group differences across all three groups were observed for age, education or race. There were differences in sex distribution by diagnosis group: more females were CN, whereas the PC group had a greater proportion of males. The machine learning analysis was only performed on the AD and CN groups resulting in 228 individuals. Baseline demographic and clinical variables including APOE ε4 genotype, and education years were extracted for our study cohort.
Table 1:
Demographics Table for each of the disease stages and the non-AD group. Hypertension was based on binary clinical classification. The p-values represent the findings from an ANOVA between each disease stage not including the non-AD group.
| Control | Preclinical | AD | p-value | |
|---|---|---|---|---|
| N | 98 | 42 | 130 | NA |
| Age; M (years) (SD) | 71(6.0) | 74(6.05) | 73(6.83) | 0.07 |
| Gender (M/F) | 46/52 | 23/16 | 73/58 | 0.014 |
| Education (years) (SD) | 17(2.43) | 16(2.7) | 16(2.65) | 0.17 |
| Race | ||||
| Amyloid M(STD) | 1.02(0.05) | 1.32(0.19) | 1.36(0.17) | <0.001 |
| Hypertension | 4.1 (2.63) | 4.2 (3.36) | 4.2 (3.67) | 0.84 |
| APOE e4 Status (0,1,2) | 76/20/2 | 23/17/2 | 47/62/21 | <0.001 |
| Time Gap (yrs) | 3(1.07) | 2.9(1.14) | 3(1.05) | 0.88 |
Changes in Regional WMH Volume vs Expansion:
At the group level, traditional approaches at quantifying WMH data rely on frequency overlap of lesions and can be insensitive to spatially specific WMH changes. This can be challenging as WMH are often spatially distinct and small deviations in location can result in no overlap despite similar spatial localization. This issue for determining WMH spatial patterns is compounded for longitudinal data as region-based WMH analyses have greater reliance on lesion overlap across time (Figure 2A-B). Figure 2A is a frequency overlap map based on WMH volume change set with an intensity maximum threshold at 25% across the entire cohort (Figure 2B). Very little overlap in WMH volume change was observed. Although individually, WMH volume change is diffusely present across the entire brain (Figure 2A), analyses restricted by lesion frequency are more limited in group comparisons (Figure 2B).
WMH expansion was observed across all participants from T1 to T2 (Supplemental F3). Unlike, WMH volume, WLMA does not rely on lesion voxel overlap to evaluate WMH spatial information. Although brain structures are aligned based on the registration matrices to template space the WMH clusters among individuals can be innately distinct at the voxel level. Spatial information is preserved without sacrificing statistical power because WLMA quantifies shifts in WMH boundaries at the individual level that we refer to as WMH expansion. Analyzing the data in this manner incorporates the changes in individual level WMH morphometrics across timepoints allowing for evaluation at the voxel level (Figure 2C-D). Figure 2C is the same WMH frequency overlap map as seen in Figure 2A but organized by the 5 WMH patterns. The main point is the distinction between Figure 2B and Figure 2D which highlights the benefit of evaluating WMH expansion as opposed to WMH volume. When considering differences in WMH volume 86% of individuals are not represented in Figure 2B whereas all participants contributed to the statistical analyses of WMH expansion.
WLMA with AD Process:
The average DD maps for each group (AD, PC, CN) are represented across all WMH spatial patterns in Figure 3. The quantitative ANOVA revealed that only the periventricular WMH patterns had significantly different rates of change in WMH expansion across all three groups (CN, PC, AD). Paired T-tests revealed this difference was driven by greater expansion of WMH for the preclinical compared to the CN group but not the AD group (Supplemental F4). The AD group was also not significantly different from preclinical group for this WMH pattern.
Figure 3:
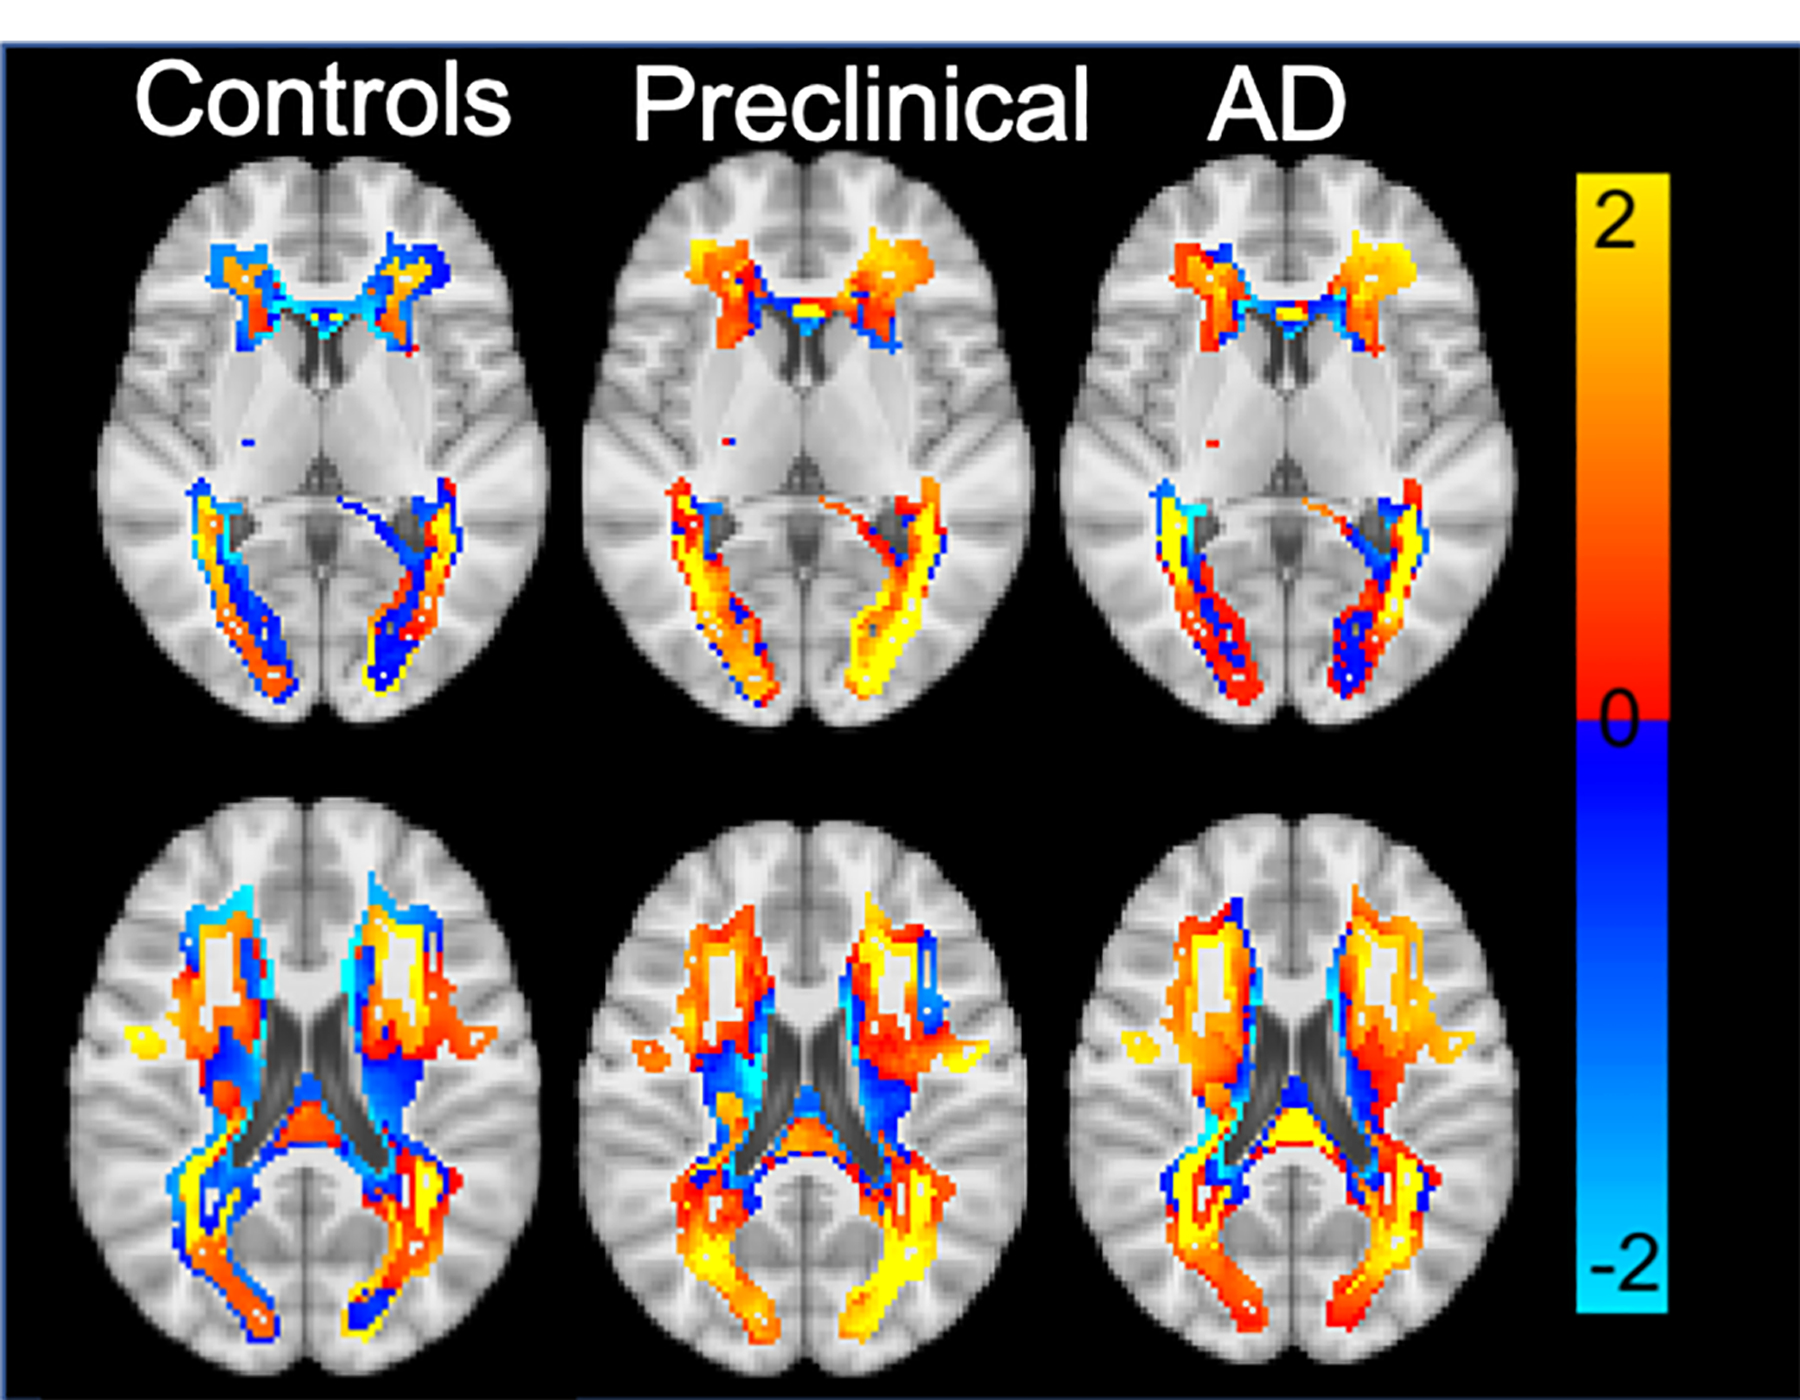
Average DD maps across all clusters for each disease stage. Units are in mm.
DD regional map association with Amyloid and APOE:
Amyloid accumulation associated with WMH expansion in the posterior WMH pattern (Figure 4) and in the deep frontal WMH pattern across all subjects. Reanalyzing the voxel-wise correlations for the posterior and deep frontal WMH patterns within the groups individually revealed a significant association with amyloid in the deep frontal but only for the AD group (Figure 4). There was no difference observed between groups for individuals with a single APOE ε4 allele but 75% of the individuals with two ε4 alleles were designated as AD. The ANOVA for APOE status across the genetic profile revealed no significant associations with any WMH spatial pattern.
Figure 4:

The images show the 3D rendering of where significant associations between amyloid and WMH expansion was observed across all three disease stages. The deep frontal regions were driven by the Dementia group that revealed a significant association within group. The posterior region relationship between WMH expansion and amyloid was only observed across the entire group.
WMH morphometric change is more predictive of AD
We compared the selectivity of WLMA and volumetric WMH change as features for different ML classifiers in predicting AD. SVM and random forest-based classifiers using WLMA features were able to more effectively and robustly identify individuals with AD compared to volumetric WMH changes across all classification performance metrics (Table 2). The McNemar’s test confirmed that WMH expansion quantified with WLMA classified AD individuals with significantly greater accuracy than WMH volume (SVM, p=0.02; RF, p=0.04). No statistical difference was observed in prediction accuracy between ML models (WLMA: SVM vs. RF, p=0.15; Volume: SVM: SVM vs. RF, p=0.68). The confusion matrices evaluating the performance of both classifiers using WLMA and volumetric features are shown in Supplemental F5. On average, SVM and RF models using WLMA features correctly classified 70.0% and 67.0% of AD individuals, with sensitivity of 0.67 and 0.74, and specificity of 0.81 and 0.73, respectively. For the region-based WMH analysis, WMH morphometric change for both periventricular and parietal WMH patterns had the highest sensitivity for predicting AD for both SVM (0.88 and 0.81) and RF (0.88 and 0.84) classification models.
Table 2:
Machine Learning Output comparing the prediction capabilities of WLMA and Volumetrics with two Machine Learning methods. ML= Machine Learning; SVM= Support Vector Machine: RF=Random Forest; WLMA= WMH longitudinal Morphometric Analysis.
| WLMA | Volumetrics | |||
|---|---|---|---|---|
| ML Model | SVM | RF | SVM | RF |
| Accuracy | 0.70 | 0.67 | 0.55 | 0.59 |
| Sensitivity for AD (Recall) | 0.67 | 0.74 | 0.37 | 0.70 |
| Precision for AD | 0.81 | 0.73 | 0.80 | 0.67 |
| F1 score (AD) | 0.73 | 0.74 | 0.51 | 0.68 |
Discussion
In this study, we assessed a novel application of lesion shape analysis to evaluate WMH expansion in AD over an average 3-year period. Compared to standard WMH volume metrics, WLMA repeatedly outperformed classical approaches for identifying unique WMH changes over time in our PC group and in distinguishing controls from AD with ML-based prediction models. The preclinical (CDR=0) individuals demonstrated WMH expansion in distinct posterior periventricular WM regions but increasing amyloid burden in the AD individuals was associated with greater WMH expansion in frontal regions.
The literature is divided on the role of WMH in AD and some have postulated that this WMH initialization process is entirely independent but may have additive effects on process to early symptomatic stages in AD.26 Post-mortem work has found that the periventricular posterior WM region contains underlying, gliosis, and axonal loss specifically in AD individuals.27 Conversely WMH of non-presumed AD origin are predominantly more prevalent in frontal areas implicating spatial location is disease specific.17,28 Evidence to support separate mechanisms is based on a lack of evidence supporting a longitudinal link with between WMH and AD biomarkers.29 This minimizes the role of WMH development in AD, despite strong associations with cognition and neurodegeneration.30–31 This infers that WMH changes associate with amyloid accumulation in AD pathology but can be overlooked with methods that fail to incorporate the spatial topography.
Increased dysfunction and damage in the brains blood vessels associates with increased Aß formation.32 The resultant damage to cerebral vasculature can potentially promote formation of diffuse plaques and phosphorylated tangles.33–35 This feedforward process may explain the associations between amyloid and WMH expansion that were observed within the deep frontal and posterior WM across the entire group. However, the deep frontal association was uniquely associated with the AD group. Individuals with AD have demonstrated reduced vascular reactivity primarily in the rostral frontal cortex compared to controls independent of cardiovascular factors.37 Similarly, pathological findings reveal frontal WMH associates with both SVD and disease specific AD neurodegenerative mechanisms.38 Our data suggests that AD individuals with greater amyloid accumulation at baseline associates with faster WMH expansion of frontal WMH within individuals with AD.
Most of the prior work involving WMH in AD only evaluated WMH as a global score, whereas regional WMH measurements may allow for more accurate interpretation.12,15 We argue that analyzing the data as a global score, or via similar strategies like voxel-based lesion symptom mapping (VLSM), often rely on voxel-based overlap and are incapable of producing significant findings longitudinally across groups.36 Additionally, the spatial information obtained by the aforementioned techniques cannot be applied at the voxel level effectively. However, WLMA spatially fixes the data within a given region, thereby allowing greater spatial specificity for detecting subtle changes in WMH expansion (Figure 2). This point was clearly emphasized in Figure 2, which showed very limited change in lesion overlap at 25% even though WMH expansion was diffusely prominent. WLMA allowed for more sensitive localized findings when analyzing disease stages with healthy aging or increased disease severity by identifying spatially specific changes at the voxel level.
Our study has several limitations. WLMA is not a lesion segmentation technique and we did not assess how the segmentation technique can influence the outcome of WLMA. However, the segmentation technique utilized has been shown to be reliable with manual segmentations and employ deep learning to differentiate lesion from non-lesion voxel-by-voxel.17 The WMH patterns used to define our longitudinal region-based WMH analysis were determined from a larger cross-sectional cohort but WLMA is not restricted to these regions. Although no longitudinal information was used in the pattern calculations for deriving the WMH regions, all baseline images were involved in the original study albeit a subset. This study focused only on global baseline levels of amyloid but longitudinal PET studies that assess regional changes would improve our understanding of WMH expansion. Although the findings from this study suggest a mechanistic link between spatially specific WMH expansion and AD, further studies that incorporate biomarkers related to other non-AD sources of variance are needed to bolster this claim. Replication of this work in another large longitudinal cohort with more detailed stroke history is necessary to validate these findings. For this study we utilized the ADNI cohort due to its large cohort size of AD focused longitudinal data. However, the ADNI cohort is limited due to the acquisition of 2D FLAIR sequences as opposed to 3D sequences that are recently growing in popularity. Therefore, future longitudinal studies within large cohorts using 3D sequences are warranted. The focus of this study was to determine whether we could detect subtle changes in WMH expansion, and therefore did not evaluate other stages that make up traditional ATN models to fully understand WMH’s role in AD process. Acquiring longitudinal data for each stage of the ATN in conjunction with longitudinal FLAIR would greatly improve the interpretations of the findings presented here. Lastly, this is the first application of this technique and external validation would improve its validity to the scientific community.
Conclusion
In conclusion, we introduced a novel approach to evaluating regional WMH expansion. We demonstrated that WLMA provides similar information as WMH volume but is also more sensitive to spatial information that we demonstrate to be clinically relevant. Our analyses of individuals with AD yielded distinct localized regions of WMH expansion for cognitively impaired AD individuals and individuals at the preclinical stage without cognitive symptoms. This strongly supports that WMH changes continue to evolve morphometrically throughout the disease and can precede cognitive changes. Therefore, the development of WMH may play an undervalued role in AD pathogenesis and offer alternative treatment strategies.
Supplementary Material
Acknowledgements
Data collection and sharing for this project was funded by the Alzheimer’s Disease Neuroimaging Initiative (ADNI) (National Institutes of Health Grant U01 AG024904) and DOD ADNI (Department of Defense award number W81XWH-12–2-0012). ADNI is funded by the National Institute on Aging, the National Institute of Biomedical Imaging and Bioengineering, and through generous contributions from the following: AbbVie, Alzheimer’s Association; Alzheimer’s Drug Discovery Foundation; Araclon Biotech; BioClinica, Inc.; Biogen; Bristol-Myers Squibb Company; CereSpir, Inc.; Cogstate; Eisai Inc.; Elan Pharmaceuticals, Inc.; Eli Lilly and Company; EuroImmun; F. Hoffmann-La Roche Ltd and its affiliated company Genentech, Inc.; Fujirebio; GE Healthcare; IXICO Ltd.; Janssen Alzheimer Immunotherapy Research & Development, LLC.; Johnson & Johnson Pharmaceutical Research & Development LLC.; Lumosity; Lundbeck; Merck & Co., Inc.; Meso Scale Diagnostics, LLC.; NeuroRx Research; Neurotrack Technologies; Novartis Pharmaceuticals Corporation; Pfizer Inc.; Piramal Imaging; Servier; Takeda Pharmaceutical Company; and Transition Therapeutics. The Canadian Institutes of Health Research is providing funds to support ADNI clinical sites in Canada. Private sector contributions are facilitated by the Foundation for the National Institutes of Health (www.fnih.org). The grantee organization is the Northern California Institute for Research and Education, and the study is coordinated by the Alzheimer’s Therapeutic Research Institute at the University of Southern California. ADNI data are disseminated by the Laboratory for Neuro Imaging at the University of Southern California.
Funding
This study was supported by the National Institute on Aging (NIA) grant R01 AG053550 (Dr. Xiong), NIH-NINDS (K23 NS110927), NIA (R01AG052550, R01AG057680, R01AG067103) and the American Heart Association (19CDA34620004). Further support was provided from NIH-NIA through P01 AG026276 and R01 AG052550, the Daniel J Brennan MD Fund, and the Paula and Rodger O. Riney Fund.
Footnotes
Conflicts of Interest
Jeremy Strain: None
Chia-Ling Phuah: None
Babatunde Adeyemo: None
Kathleen Cheng: None
Kyle Womack: None
John McCarthy: None
Manu Goyal: none
Yasheng Chen: none
Aristeidis Sotiras: Personal compensation for serving as a grant reviewer for BrightFocus Foundation. Holds equity in TheraPanacea
Hongyu An: None
Chengjie Xiong:
Andrea Scharf: None
Catherine Newsome-Stewart: None
John C. Morris: He is currently participating in clinical trials of antidementia drugs developed by Eli Lilly and Company, Biogen and Janssen. Dr. Morris serves as a consultant for Lilly USA. Research support from Eli Lilly/Avid Radiopharmaceuticals.
Tammie L.S. Benzinger: Involved in a clinical trial sponsored by Avid.
Jin-Moo Lee: None
Beau Ances: Involved in a clinical trial sponsored by Avid.
Consent Statement
The authors complied with the guidelines of the International Committee of Medical Journal Editors and study approval was obtained by the Human Subjects Institutional Review Board (IRB) of Washington University in St. Louis and other collaborating sites. There are no financial conflicts of interest. Appropriate Institutional Review Boards approval occurred at each ADNI site and informed consent in accordance with the Declaration of Helsinki was obtained from each participant or authorized representative.
References
- 1.Jack CR, Bennett DA, Blennow K, Carrillo MC, et al. NIA-AA Research Framework: Toward a biological definition of Alzheimer’s disease. Alzheimers Dement 2018; 14:535–562. [DOI] [PMC free article] [PubMed] [Google Scholar]
- 2.Vemuri et al., Lesnick TG, Przybelski SA, et al. Age, Vascular Health, and Alzheimer Disease Biomarkers in an Elderly Sample. Ann Neurol 2017; 82:706–718. [DOI] [PMC free article] [PubMed] [Google Scholar]
- 3.Prins ND, Scheltens P White matter hyperintensities, cognitive impairment and dementia: an update. Nature Reviews Neurology 2015; 11:157–165. [DOI] [PubMed] [Google Scholar]
- 4.Kim HW, Hong J, Jeon JC Cerebral Small Vessel Disease and Alzheimer’s Disease: A Review. Front Neurol 2020; 11–927. 10.3389/fneur.2020.00927. [DOI] [PMC free article] [PubMed] [Google Scholar]
- 5.Wong FCC, Saffari SE, Yatawara C, Ng PK, et al. Influence of White Matter Hyperintensities on Baseline and Longitudinal Amyloid-B in Cognitively Normal Individuals. Journal of Alzheimer’s Disease: 2021; 84:91–101. [DOI] [PubMed] [Google Scholar]
- 6.Walsh P, Sudre CH, Fiford CM, Ryan NS, Lashley T, Frost C, Barnes J CSF amyloid is a consistent predictor of white matter hyperintensities across the disease course from aging to Alzheimer’s disease. Neurobiology of Aging 2020; 91:5–14. [DOI] [PubMed] [Google Scholar]
- 7.Luo X, Jiarken Y, Yu X, et al. Associations between APOE genotype and cerebral small-vessel disease: a longitudinal study. Oncotarget 2017;8:44477–44489. [DOI] [PMC free article] [PubMed] [Google Scholar]
- 8.Zhao C, Strobino K, Moon YP, et al. APOE e4 modifies the relationship between infectious burden and poor cognition. Neurology 2020; 10.1212/NXG.0000000000000462. [DOI] [PMC free article] [PubMed] [Google Scholar]
- 9.Youjin J, Raymond V, Sanneke R, et al. White Matter Hyperintensities and Apolipoprotein E affect the Association Between Mean Arterial Pressure and Objective and Subjective Cognitive Functioning in Older Adults. Journal of Alzheimer’s Disease 2021; 84:1337–1350. [DOI] [PubMed] [Google Scholar]
- 10.Wang Y, Chen W, Cai W, Hu H, Xu W, Wang et al. Associations of White Matter Hyperintensities with Cognitive Decline: A Longitudinal Study. J Alz Dis 2020; doi: 10.3233/JAD-191005. [DOI] [PubMed] [Google Scholar]
- 11.Carmichael O et al. Longitudinal changes in white matter disease and cognition in the first year of the Alzheimer disease neuroimaging initiative. Arch. Neurol 2010; 67:1370–1378. [DOI] [PMC free article] [PubMed] [Google Scholar]
- 12.Rizvi B, Lao PJ, Chesebro AG, et al. Association of Regional White Matter Hyperintensities with Longitudinal Alzheimer-Like Pattern of Neurodegeneration in Older Adults. JAMA Neuro 2021;4:10–32125166 [DOI] [PMC free article] [PubMed] [Google Scholar]
- 13.Lampe L, Kharabian-Masouleh S, Kynast J, et al. Lesion Location matters: The relationships between white matter hyperintensities on cognition in the healthy elderly. Journal of Cerebral Blood Flow & Metabolism 2019; 10.1177/0271678X17740501. [DOI] [PMC free article] [PubMed] [Google Scholar]
- 14.Biesbroek JM, Lam BYK, Zhao L, et al. High white matter hyperintensity burden in strategic white matter tracts relates to worse global cognitive performance in community-dwelling individuals. Journal of the Neurological Sciences 2020;414:116835. [DOI] [PubMed] [Google Scholar]
- 15.Brickman AM, Provenzano FA, Muraskin J, Manly JJ, Blum S, et al. Regional white matter hyperintensity volume, not hippocampal atrophy, predicts incident Alzheimer disease in the community. Arch Neurol 2012; 69:1621–1627. [DOI] [PMC free article] [PubMed] [Google Scholar]
- 16.Habes M, Sotira A, Erus G, et al. White matter lesions spatial heterogeneity, links to risk factors, cognition, genetics and atrophy. Neurology 2018;91: 10.1212/WNL.0000000000006116 [DOI] [PMC free article] [PubMed] [Google Scholar]
- 17.Phuah C, Chen Y, Strain JF, et al. Association of Data-Driven White Matter Hyperintensity Spatial Signatures With Distinct Cerebral Small Vessel Disease Etiologies. Neurology 2022;10: WNL.0000000000201186 [DOI] [PMC free article] [PubMed] [Google Scholar]
- 18.Saykin AJ, Shen L, Foroud TM, Potkin SG, Swaminathan S, et al. Alzheimer’s Disease Neuroimaging Initiative biomarkers as quantitative phenotypes: Genetics core aims, progress, and plans. Alzheimer Dementia 2010; 6:265–273. [DOI] [PMC free article] [PubMed] [Google Scholar]
- 19.Joshi A, Pontecorvo M, Breault C, Lu M, Carpenter A, Skovronsky D, Mintun M Use of florbetapir-PET to assess progression of amyloid burden over time. J Nuclear Medicine 2012; 53:89. [Google Scholar]
- 20.Landau SM, Jagust WJ Florbetapir processing methods 2015; https://adni.bitbucket.io/reference/docs/UCBERKELEYAV45/ADNI_AV45_Methods_JagustLab_06.25.15.pdf [Google Scholar]
- 21.Jenkinson M, Smith SM. A global optimization method for robust affine registration of brain images. Medical Image Analysis 2001;5:143–156. [DOI] [PubMed] [Google Scholar]
- 22.Jenkinson M, Bannister PR, Brady JM, Smith SM. Improved optimization for the robust and accurate linear registration and motion correction of brain images. NeuroImage 2002;17:825–841. [DOI] [PubMed] [Google Scholar]
- 23.Patenaude B, Smith SM, Kennedy D, Jenkinson M A Bayesian Model of Shape and Appearance for Subcortical Brain. NeuroImage 2011; 56:907–922. [DOI] [PMC free article] [PubMed] [Google Scholar]
- 24.Winkler AM, Ridgway GR, Webster MA, Smith SM, Nichols TE Permutation inference for the general linear model. NeuroImage 2014; 92:381–397. [DOI] [PMC free article] [PubMed] [Google Scholar]
- 25.Anderson MJ, Robinson J. Permutation Tests for Linear Models; Aust New Zeal J Stat Stat 2001;43:75–88. [Google Scholar]
- 26.Soldan A, Pettigrew C, Zhu Y, et al. White matter hyperintensities and CSF Alzheimer disease biomarkers in preclinical Alzheimer disease. Neurology 2019;94:WNL.000000000008864. [DOI] [PMC free article] [PubMed] [Google Scholar]
- 27.Alber J, Alladi S, Bae HJ, et al. White matter hyperintensities in vascular contributions to cognitive impairments and dementia (VCID): Knowledge gaps and opportunities. Alzheimer’s Dement Transl Res Clin Interv Elsevier Inc; 2019;5:107–117. [DOI] [PMC free article] [PubMed] [Google Scholar]
- 28.Palhaugen L, Sudre CH, Tecelao S, et al. Brain amyloid and vascular risk are related to distinct white matter hyperintensity patterns. J Cereb Blood Flow Metab 2021;41:1162–1174. [DOI] [PMC free article] [PubMed] [Google Scholar]
- 29.Dodge HH, Zhu J, Harvey D, et al. Biomarker Progressions Explain Higher Variability in Specific Cognitive Decline than Baseline Values in Alzheimer Disease. Alzheimers Dement 2014;690–703. [DOI] [PMC free article] [PubMed] [Google Scholar]
- 30.Mielke MM, Frank RD, Dage JL, et al. Comparison of Plasma Phosphorylated Tau Species With Amyloid and Tau Positron Emission Tomography, Neurodegeneration, Vascular Pathology, and Cognitive Outcomes. JAMA Neurol 2021; 78:1108–1117. [DOI] [PMC free article] [PubMed] [Google Scholar]
- 31.Schwarz CG, Knopman DS, Vijay RK, et al. Longitudinally increasing Elevated Asymmetric Flortaucipir Binding in a Cognitively Unimpaired Amyloid-Negative Older Individual. Journal of Alzheimer’s Disease 2022;85:59–64. [DOI] [PMC free article] [PubMed] [Google Scholar]
- 32.Karran E, De Strooper B. The amyloid cascade hypothesis: are we poised for success or failure? Journal of Neurochemistry 2016. 139:237–252. [DOI] [PubMed] [Google Scholar]
- 33.Cox SR, Lyall DM, Ritchi SJ, Bastin ME, et al. Associations between vascular risk factors and brain MRI indices in UK Biobank. European Heart Journal 2019; 28:2290–2300. [DOI] [PMC free article] [PubMed] [Google Scholar]
- 34.Torre De la, Jack C Cerebral Hemodynamics and Vascular Risk Factors: Setting the Stage for Alzheimer’s Disease 1 Jan. 2012:553–567. [DOI] [PubMed] [Google Scholar]
- 35.Sweeney MD, Kisler K, Montagne A, Toga AM, Zlokovic BV The role of brain vasculature in neurodegenerative disorders. Nat Neuroscie 2018;21:1318–1331. [DOI] [PMC free article] [PubMed] [Google Scholar]
- 36.Kimberg DY, Coslett HB, Schwartz MF. Power in Voxel-based Lesion-Symptom Mapping. Journal of Cognitive Neuroscience 2007;19:1067–1080. [DOI] [PubMed] [Google Scholar]
- 37.Yezhuvath US, Uh J, Cheng Y, Martin-cook et al. Forebrain-dominant deficit in cerebrovascular reactivity in Alzheimer’s disease. Neurobiology of aging 2012;33:75–82. [DOI] [PMC free article] [PubMed] [Google Scholar]
- 38.McAleese KE, Miah M, Graham S, Hadfield GM, et al. Frontal white matter lesions in Alzheimer’s disease are associated with both small vessel disease and AD-associated cortical pathology. Acta Neuropathologica 2021;142:937–950. [DOI] [PMC free article] [PubMed] [Google Scholar]
Associated Data
This section collects any data citations, data availability statements, or supplementary materials included in this article.