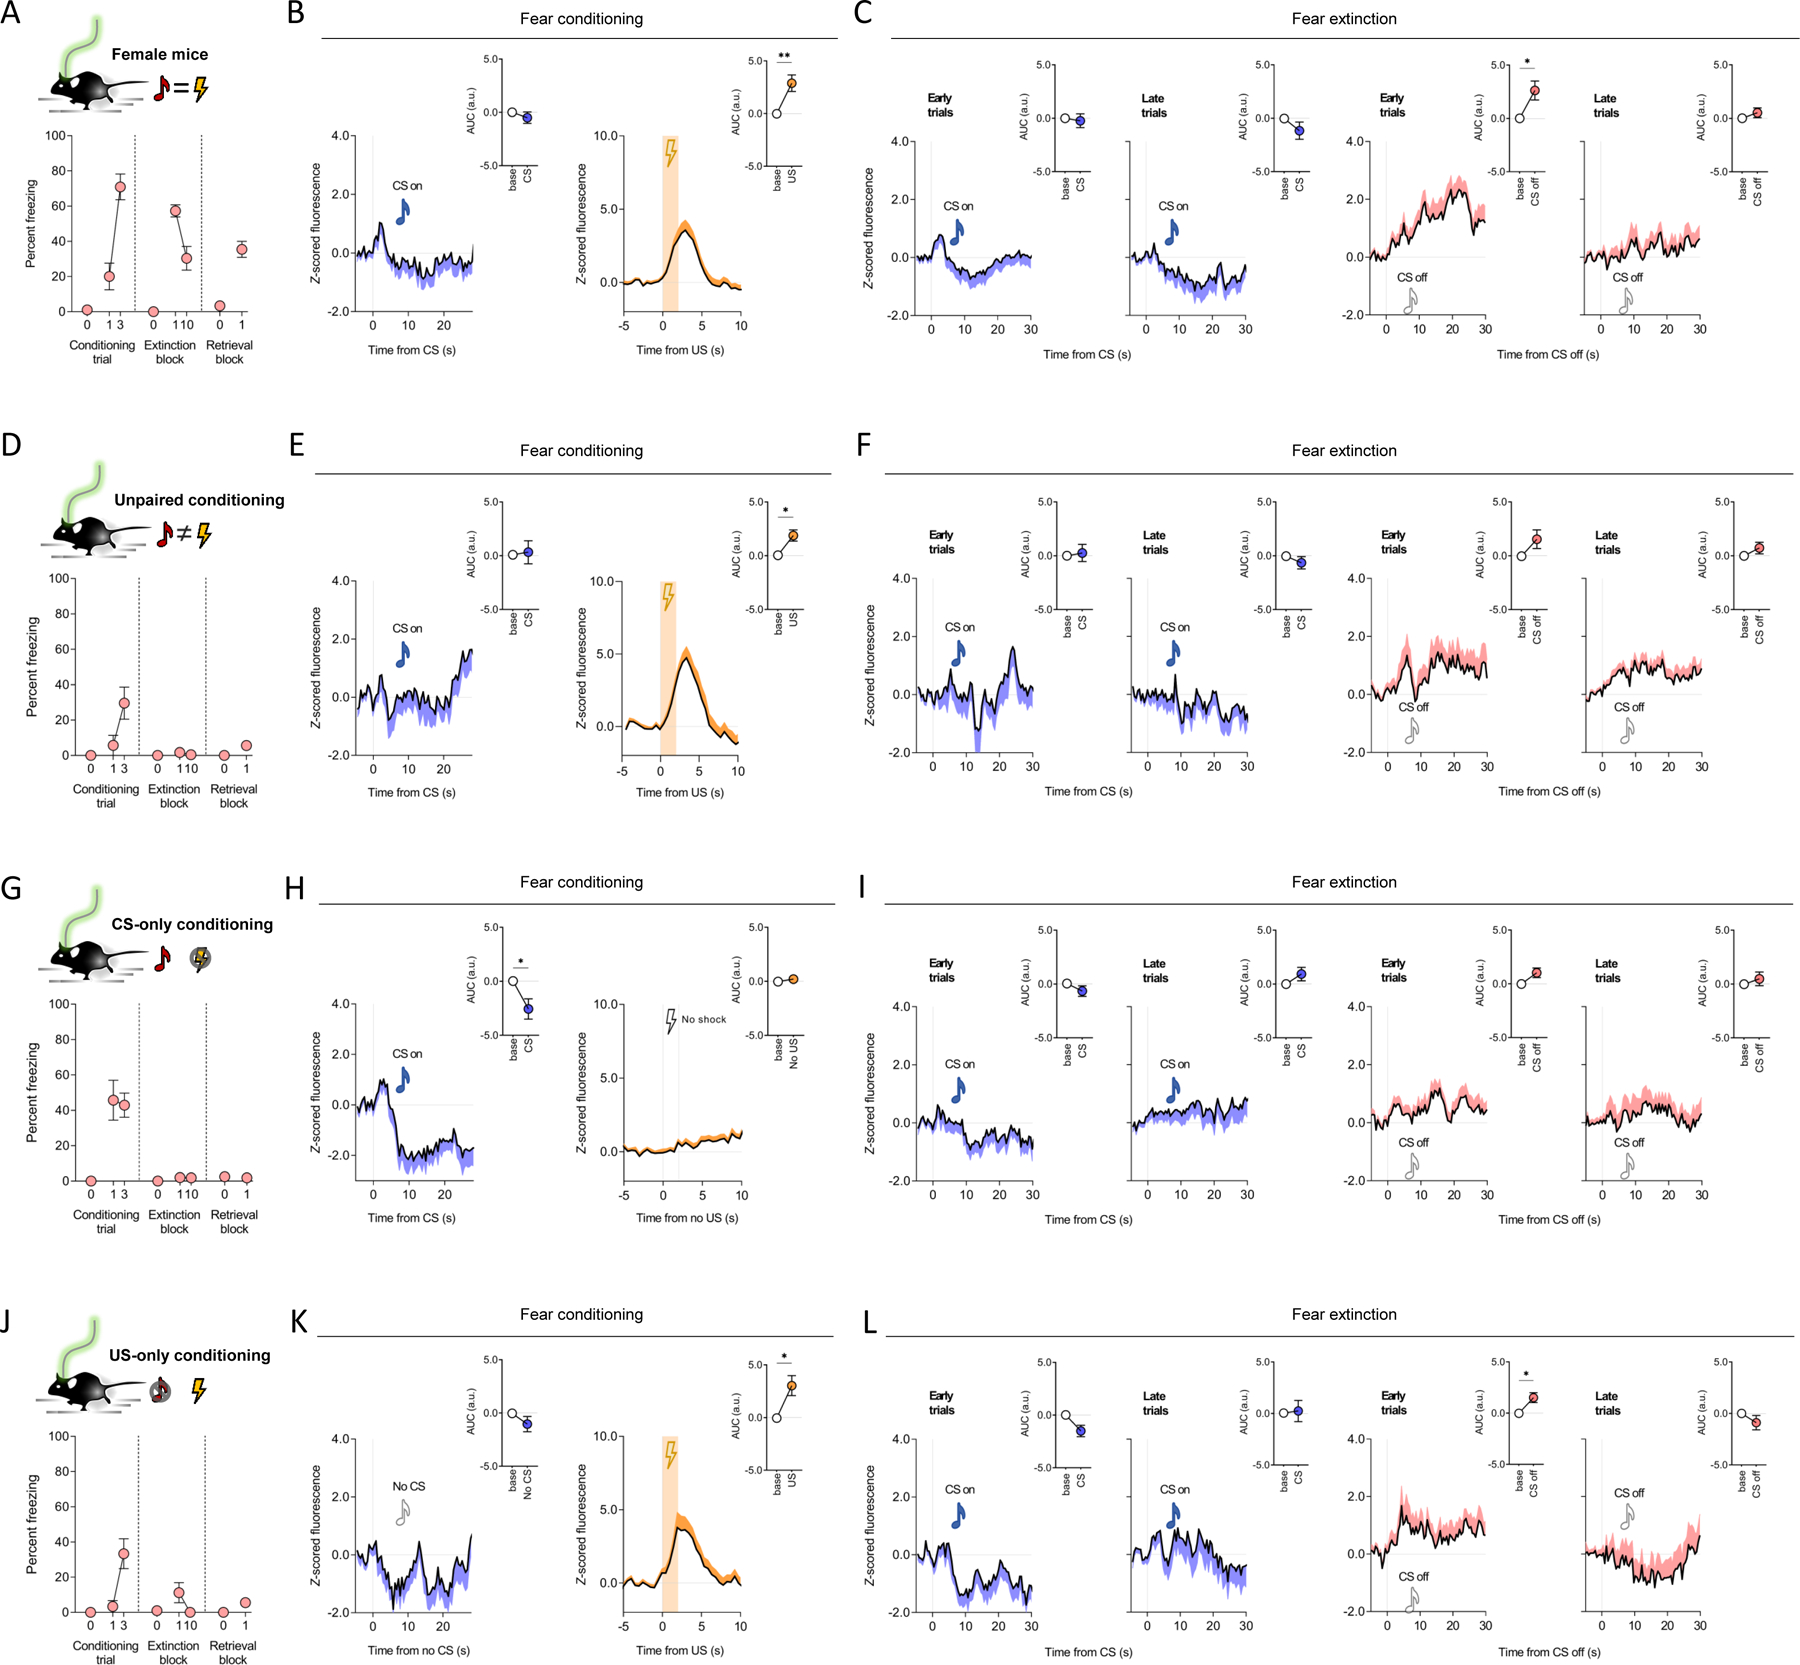
Figure 3: Extinction-related eCBs at mPFC→BLA neurons in females and non-conditioned males.

(A-C) In females (n=11 mice) freezing increased over conditioning trials (paired t-test for trial 1 versus trial 3: t(10)=5.369, P=0.0003, ηp2=0.74) and decreased from early (first trial-block) to late (last trial-block) extinction training (paired t-test: t(10)=4.006, P=0.0025, ηp2=0.62). Lower freezing on retrieval versus early extinction (paired t-test: t(10)=4.092, P=0.0022, ηp2=0.63) (A). Increased GRABeCB2.0 signal during conditioning US presentation (paired t-test for US versus baseline: t(10)=3.659, P=0.0044, η 2=0.57) (not CS P>0.05) presentation (B) and during CS off periods on early (paired t-test for CS off versus baseline: t(10)=2.927, P=0.0151, ηp2=0.46) (not late P>0.05) extinction training (C).
(D-F) In unpaired conditioned males (n=7 mice), freezing did not increase over conditioning trials (paired t-test for trial 1 versus trial 3: t(6)=2.443, P=0.0503, ηp2=0.50) and was low during extinction and retrieval
(D). Increased GRABeCB2.0 signal during conditioning US presentation (paired t-test for US versus baseline: t(6)=3.469, P=0.0133, ηp2=0.67) (not CS P>0.05) presentation (E) and no change on extinction trials (P<0.05) (F).
(G-H) In CS-only conditioned males (n=7 mice), freezing did not increase over conditioning trials (P<0.05) and was low during extinction training and retrieval (G). Decreased GRABeCB2.0 signal during conditioning CS presentation (paired t-test for CS versus baseline: t(6)=0.311, P=0.7663, ηp2=0.02) (not the US-equivalent period, P>0.05) (H) and showed no change during extinction training CS on (P>0.05) or CS off periods (P>0.05) (I).
(J-L) In US-only conditioned males (n=6 mice), freezing increased over conditioning trials (paired t-test for trial 1 versus trial 3: t(5)=3.503, P=0.0172, ηp2=0.71) and was low on extinction trials. (J). Decreased GRABeCB2.0 signal during conditioning US presentation (paired t-test for US versus baseline: t(5)=3.181, P=0.0245, ηp2=0.67) (not CS-equivalent period, P>0.05) (K) and CS off period during early (paired t-test for CS off versus baseline t(5)=3.183, P=0.0245, ηp2=0.67) (not late, P>0.05) extinction training (L).
Data are represented as mean±SEM population average Z-scores normalized to 5-second pre-event baseline. Time-normalized AUC values correspond to 28 post-CS and 2 seconds post-US during conditioning, and 30 seconds post-CS on and CS off for extinction training, retrieval and renewal. ***P<0.001, **P<0.01, *P<0.05 with multiple-comparison Bonferroni correction for extinction GRABeCB2.0 data.
