

Abstract
Objectives.
To measure the fractions of benign and malignant nodules in lung cancer screening that grow on follow-up, and to measure the volume doubling time (VDT) of those that grow.
Methods.
In this retrospective study, we included nodules from CT lung cancer screening in our healthcare network, for which a follow-up CT performed at least 2 months later showed the nodule to be persistent. The nodules were measured using semi-automated volumetric segmentation software at both timepoints. Growth was defined as an increase in volume by 25%. VDTs were calculated, and the fraction <400 days was recorded. Categorical variables were compared with Fisher’s exact test, and continuous variables by the Wilcoxon test.
Results.
The study included 153 nodules, of which 44 were malignant and 109 benign. Thirty (68%) of malignant nodules and 36 (33%) of benign nodules grew (p<0.001). For growing nodules, VDT was 318 days for malignant nodules and 389 for benign nodules (p=0.21). For growing solid nodules, VDT was 204 days for malignant nodules and 386 days for benign nodules (p=0.01); of these, VDT was <400 days for 12/13 (92%) of malignant nodules and 15/26 (58%) of benign nodules.
Conclusion.
Malignant nodules were more likely to grow, and solid malignant nodules grew faster, than benign nodules. However, there was substantial overlap between benign and malignant nodules.
Advances in knowledge.
There is a substantial overlap in growth rates of benign and malignant nodules, limiting the utility of volume doubling time in determining malignant nodules.
Keywords: Lung cancer screening, volume doubling time, pulmonary nodule
Introduction
As CT lung cancer screening becomes more prevalent, optimal management of any nodules detected will become increasingly important. There are a number of management algorithms for pulmonary nodules. In the United States, the vast majority of screening sites use the American College of Radiology’s Lung-RADS(1). Lung-RADS v1.1 is predominantly based on linear measurements for nodule triage, and assessment of growth is defined by an increase in diameter of 1.5 mm. However, in Europe, many sites use volumetric nodule triage algorithms; the best known is that used by the NELSON trial (Dutch-Belgian screening trial)(2). This algorithm defines growth as an increase in nodule volume of 25% (or development of a solid component in a ground glass nodule). If a nodule is deemed to have growth, further management is determined by the growth rate, measured as volume doubling time (VDT). The volume doubling time calculation assumes an exponential growth rate of nodule volume and extrapolates growth over an observed interval to calculate the number of days in which a nodule would be expected to double in volume. VDTs are then classified into 3 categories, in order of increasing suspicion of malignancy: >600 days, 400 – 600 days, and < 400 days.
Whether linear or volumetric growth thresholds perform best for determining nodule malignancy and management remains to be proven. Previous studies comparing linear and volumetric triage strategies have come to different conclusions about which performs best(3–5). Challenges for growth rate-based algorithms include indolent lung cancers, particularly subsolid nodules(6) as well as other slowly growing malignant neoplasms such as carcinoid tumors(7). One recent study of 305 surgically resected nodules found that volume doubling time did not discriminate well between benign and malignant nodules, although this study included a large number of subsolid nodules(8).
Here, we set out to evaluate growth of pulmonary nodules detected at lung cancer screening CT. We evaluated the fraction of nodules growing, and their growth rates, stratified by malignant versus benign diagnosis as well as nodule density.
Methods
Patient selection.
This study was approved by our Institutional Review Board, with waiver of informed consent. Nodules were drawn from two previously reported cohorts, one of nodules detected at follow-up lung cancer screening CT(5), and one of Lung-RADS category 4 nodules(9). All patients were in an established lung cancer screening program within one of the hospitals in our healthcare network. All CTs were performed with low-dose technique (lung cancer screening protocol) on a multidetector row CT scanner, and images were reconstructed at 1–1.25 mm slice thickness. As this is a retrospective study in a multi-site healthcare network, individual scanner parameters varied from site to site.
Inclusion criteria were patients with a pulmonary nodule that was detected on a lung cancer screening CT, for which a follow-up chest CT (screening or diagnostic) was obtained at least 60 days later, in which the nodule persisted. Nodules that resolved were excluded. Only the dominant nodule (used to determine Lung-RADS category) was recorded for analysis. Only 1 nodule per patient (and 1 timepoint pair per nodule) was included.
Patient demographics were extracted from the electronic medical record. Diagnosis of lung cancer associated with the dominant nodule was established by manual chart review. Malignant nodules were diagnosed with pathology except in 8 cases, which were diagnosed and treated empirically by the clinical oncology team after growth of a suspicious nodule. Benign nodules were established either by benign pathology or by long-term stability and lack of lung cancer diagnosis during follow-up (at least 2 years) in the screening program.
Image review.
A subspecialty-trained thoracic radiologist with 6 years of experience reviewed the CTs blinded to diagnosis. The radiologist classified nodules as solid, part-solid, or ground glass per Fleischner Society guidelines. The CTs were loaded into an advanced visualization software (Syngo.VIA, version VB40, Siemens Healthcare). This software provides semi-automated segmentation of nodules; the radiologist adjusted the segmentation as appropriate to conform to nodule margins. The software then provides long- and short-axis diameters at the largest slice, as well as nodule volume. For part-solid nodules, the solid component was segmented separately after segmentation of the total nodule.
Data analysis.
Data were entered in REDCap(10) and analyzed in JMP Pro (v16.1, SAS Institute). Patient and nodule characteristics were compared using Fisher’s exact test for categorical variables or the Wilcoxon test for continuous variables. Nodule average diameter was calculated as the average between the short and long axes at the largest slice. Nodule growth was defined as per the NELSON trial algorithm (growth by 25% of the total nodule or solid component, or development of a solid component in a ground glass nodule). For growing nodules, volume doubling time was calculated for standard exponential growth and was capped at 10 years (3650 days). For part-solid nodules, we recorded either the total nodule or solid component growth rate, whichever was faster. Analyses were stratified by benign versus malignant nodules, as well as by nodule density (solid, part-solid, or ground glass). We also categorized VDTs as per the NELSON trial algorithm, into: < 400 days, 400 – 600 days, or > 600 days (corresponding to GROWCAT C, B, or A, respectively).
Results
Patient and nodule characteristics.
A total of 153 nodules were included, 44 malignant and 109 benign (Table 1). For malignant nodules, the median patient age was 66, 50% were male, and median baseline nodule diameter was 11 mm. For benign nodules, the median patient age was 67, 54% were male, and the median baseline nodule diameter was 8 mm. Malignant nodules were larger than benign nodules (p<0.001). Lung-RADS categories in the clinical report were: 48 (31%) category 2, 21 (14%) category 3, 45 (29%) category 4A, 26 (17%) category 4B, and 13 (8%) category 4X. The median follow-up CT interval was 250 days (range 61 – 990 days); the follow-up interval was shorter for malignant nodules (median 186 days) versus benign nodules (median 412 days, p=0.01).
Table 1.
Patient and Nodule Characteristics
| Malignant (n=44) | Benign (n=109) | p-value | |
|---|---|---|---|
| Age, yr, median (range) | 66 (55 – 78) | 67 (55 – 79) | 1.0 |
| Male sex | 22 (50%) | 59 (54%) | 0.39 |
| Average diameter, mm, median (range) | 11 (4 – 25) | 8 (1 – 30) | <0.001 |
| Volume, ml, median (range) | 0.44 (0.01 – 4.62) | 0.15 (0.00 – 8.62) | <0.001 |
| Lung-RADS* | <0.001 | ||
| 2 | 0 | 48 (44%) | |
| 3 | 3 (7%) | 18 (17%) | |
| 4A | 15 (34%) | 30 (28%) | |
| 4B | 15 (34%) | 11 (10%) | |
| 4X | 11 (25%) | 2 (2%) | |
| Density | <0.001 | ||
| Ground glass | 12 (27%) | 15 (14%) | |
| Part-solid | 8 (18%) | 3 (3%) | |
| Solid | 24 (55%) | 91 (83%) | |
| Follow-up interval, | 186 (63 – 973) | 412 (61 – 990) | 0.01 |
| days, median (range) | |||
| Growth† | <0.001 | ||
| Growing | 30 (68%) | 36 (33%) | |
| Not growing | 14 (32%) | 73 (67%) |
Lung-RADS category in the clinical report.
Growth defined by NELSON trial algorithm.
Nodule growth.
Overall, 30/44 (68%) of malignant nodules and 36/109 (33%) of benign nodules grew by NELSON algorithm criteria (p<0.001). By density, 10/12 (83%) of malignant ground glass nodules and 8/15 (53%) of benign ground glass nodules grew; 7/8 (88%) of malignant part-solid nodules and 2/3 (67%) of benign part-solid nodules grew; and 13/24 (54%) of malignant solid nodules and 26/91 (29%) of benign solid nodules grew. An example of a solid malignant nodule that did not grow is shown in Figure 1.
Figure 1.
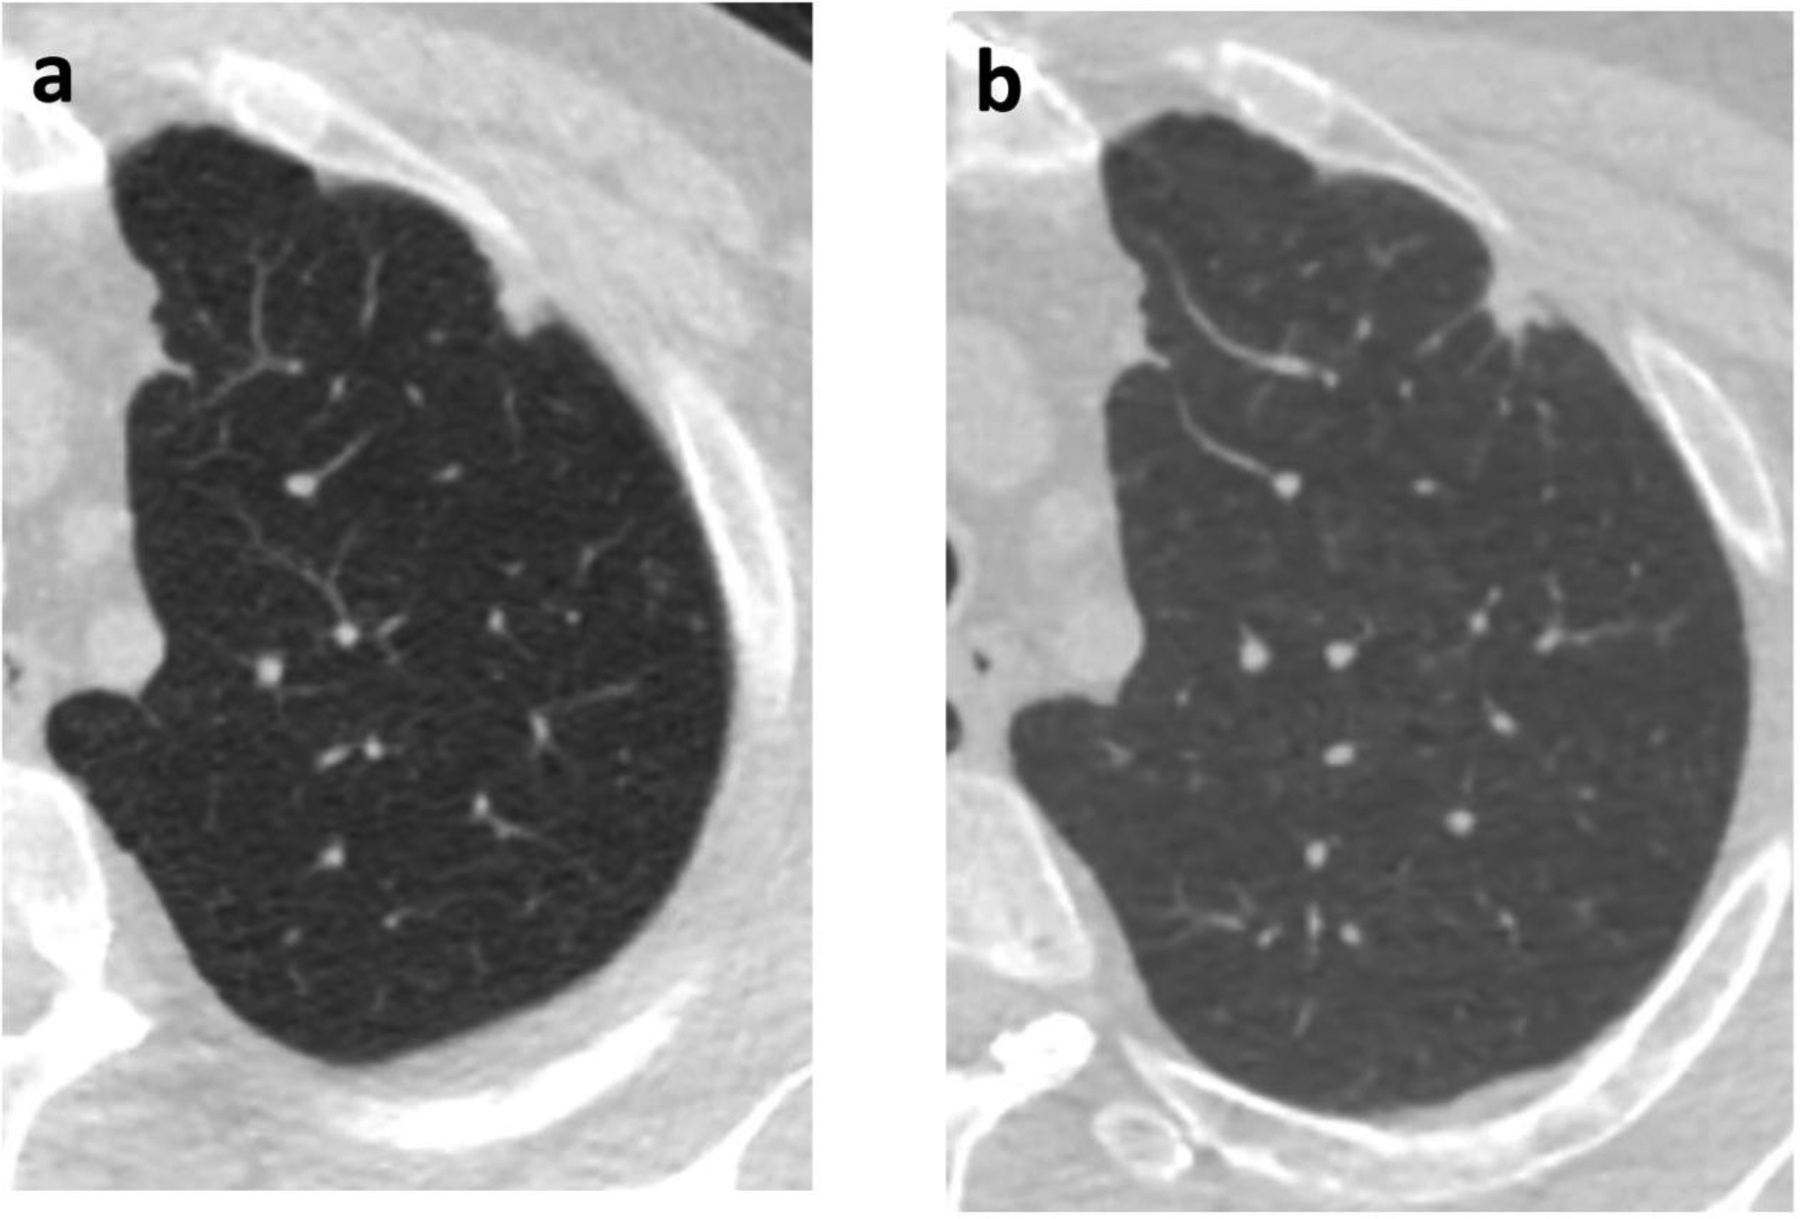
60-year-old man with a left upper lobe solid subpleural nodule. (a) Initial chest CT, at which time the nodule measured 11 mm in diameter with volume of 0.581 ml. (b) Follow-up CT after 364 days, when the volume was 0.531 ml. Subsequent wedge resection demonstrated adenocarcinoma
Volume doubling time.
VDTs were calculated for growing nodules (Table 2). For malignant nodules (n=30), the median VDT was 318 days, while for benign nodules (n=36) the median VDT was 389 days (p=0.21). Growth rates for growing ground glass and part-solid nodules are also given in Table 2.
Table 2.
Volume doubling time of growing nodules
| Malignant | Benign | p-value | |
|---|---|---|---|
| All nodules | 0.21 | ||
| n | 30 | 36 | |
| VDT | 318 (61 – 3650) | 389 (65 – 3650) | |
| Ground glass | 0.82 | ||
| n | 10 | 8 | |
| VDT | 715 (319 – 3650) | 1018 (266 – 3650) | |
| Part-solid* | 0.77 | ||
| n | 7 | 2 | |
| VDT | 218 (72 – 904) | 180 (159 – 202) | |
| Solid | 0.01 | ||
| n | 13 | 26 | |
| VDT | 204 (61 – 838) | 386 (65 – 1295) |
VDT values are volume doubling time (VDT) in days, given as median (range). VDT is capped at 10 years (3650 days).
For part-solid nodules, the VDT reported is either for the total nodule or solid component, whichever is faster.
For growing solid nodules, VDTs are shown in Figure 2, with the median VDT for malignant nodules was 204 days, whereas for benign nodules it was 386 days (p=0.01). Solid nodule growth rates by VDT category are given in Table 3. Notably, for growing solid nodules, 12/13 (92%) of malignant nodules had VDT < 400 days, and 15/26 (58%) of benign nodules had VDT < 400 days (p=0.1). One solid lung cancer had a VDT of > 600 days (Figure 3). Several benign nodules had growing times of < 400 days (Figure 4).
Figure 2.

Volume doubling times of growing solid nodules
Table 3.
Volume doubling time of growing solid nodules
| Malignant (n=13) | Benign (n=26) | |
|---|---|---|
| < 400 days | 12 (92%) | 15 (58%) |
| 400 – 600 days | 0 (0%) | 4 (15%) |
| > 600 days | 1 (8%) | 7 (27%) |
For comparison of malignant versus benign, p=0.10.
Figure 3.

62-year-old man with a left upper lobe nodule. (a) Initial chest CT, at which time the nodule measured 8 mm with a volume of 0.433 ml. (b) Follow-up chest CT after 278 days, at which time the volume was 0.545 ml, corresponding to a VDT of 838 days. Subsequent wedge resection demonstrated adenocarcinoma.
Figure 4.

74-year-old woman with a right upper lobe nodule. (a) Initial chest CT, at which time the nodule measured 6 mm with a volume of 0.074 ml. (b) Follow-up chest CT after 434 days, at which time the nodule developed cavitation and grew to 0.16 ml, corresponding to a VDT of 390 days. The nodule resolved on subsequent follow-up imaging.
Discussion
In summary, we evaluated 153 non-resolving nodules detected in a lung cancer screening program. Malignant nodules were more likely to grow than benign nodules (68% versus 33%), although there were sizable minorities of stable malignant nodules as well as growing benign nodules. Within the group of growing nodules, growth rates did not differ substantially between benign and malignant nodules. Even for growing solid nodules, while the growth rate for malignant nodules was faster than benign nodules (204 days versus 386 days), there was substantial overlap. Indeed, while 92% of malignant solid nodules had VDT < 400 days, i.e. in the ‘malignant’ range, 58% of growing benign solid nodules were also in this range.
The fact that malignant nodules are more likely to grow than benign nodules is not surprising. Indeed, previous studies have shown the malignancy risk in growing nodules is substantially higher than in stable nodules(5). However, it is worth noting that malignancies can be stable over short or intermediate term follow-up. One previous study showed that strict application of Lung-RADS stability criteria led to downgrading almost one quarter of malignancies to category 2 (benign)(5). While this is more likely to occur with subsolid cancers, which grow more slowly, it does also occur for some slowly growing solid nodules, as shown here. While it has been argued that volumetric measurement may be more sensitive for growth than linear diameters, as we have shown, it can still not detect growth in a substantial fraction (32%) of malignant nodules.
Once a nodule has grown, some triage algorithms advocate use of growth rates to determine nodule management. However, use of growth rate to discriminate between malignant and benign nodules is subject to a number of limitations. For example, lung adenocarcinomas, even when solid, can be indolent. Moreover, other slow growing malignancies occur in the lungs, most notably carcinoid tumors which can grow slowly over many years but retain metastatic potential. Furthermore, benign nodules can grow. Growth can be overestimated by measurement error or inability to segment the nodule from adjacent vessels or scarring; and infectious processes, particularly granulomatous infections (e.g. mycobacteria), can grow relatively rapidly without making a patient systemically ill. Other inflammatory conditions such as sarcoidosis can also produce growing nodules, and intrapulmonary lymph nodes have also been shown to grow(11). Thus, it is not surprising that, within the subset of growing nodules, growth rate is an imperfect method to distinguish benign from malignant nodules.
Volumetric assessment of lung nodules also has a number of limitations itself(12). First, the volumetric software may incorrectly segment the nodule on one timepoint, leading to spurious assessment of growth. This is particularly true for nodules that are adjacent to the pleura or vessels, as those structures may be incorporated by the software into the nodule volume(13). Volumetric assessment may be less reliable for nodules with ground glass components, as the ground glass component is very similar to background lung in attenuation, and distinguishing solid components from intralesional vessels is challenging for software(12). In this study, we used a single software package, but if different software is used for each timepoint (e.g., at different sites or institutions within a healthcare network), that may lead to substantial variability in measured volumes(14). Finally, technical parameters of the CT, particularly reconstruction kernel, can affect the software segmentation and resulting volume(15). Of note, in this retrospective study, patients may have been scanned on different CT machines during the follow-up of their nodules, which may have led to variability in nodule volumes and resulting VDTs.
This study has a number of limitations. Being retrospective, patient management was driven by clinical decisions rather than a standardized protocol. Follow-up CT intervals varied in the study, and we included follow-ups as soon as 60 days, which could lead to inaccurate estimates of growth. Additionally, the cohort is biased to higher Lung-RADS categories and therefore includes more larger nodules that may have a higher likelihood of growing. Finally, we only included data from a single observer performing the semi-automated volumetric segmentation. However, we have previously shown low inter-observer variability for this method(5,16).
In conclusion, growth is an important predictor of malignancy in pulmonary nodules. However, once a nodule grows, the growth rate itself is limited in its ability to discriminate between benign and malignant nodules. Radiologists should integrate multiple factors, particularly nodule density and morphology, when assessing nodules at follow-up. Slow growth or stability of nodules cannot be relied upon to signify benignity.
Funding
MMH is funded by NIH 1R01CA260889-01. The authors have no relevant financial disclosures.
Footnotes
Publisher's Disclaimer: This is a PDF file of an unedited manuscript that has been accepted for publication. As a service to our customers we are providing this early version of the manuscript. The manuscript will undergo copyediting, typesetting, and review of the resulting proof before it is published in its final form. Please note that during the production process errors may be discovered which could affect the content, and all legal disclaimers that apply to the journal pertain.
Declaration of Competing Interest
The authors declare that they have no known competing financial interests or personal relationships that could have appeared to influence the work reported in this paper.
References
- 1.American College of Radiology. Lung- RADS® Version 1.1 Available from: https://www.acr.org/-/media/ACR/Files/RADS/Lung-RADS/LungRADSAssessmentCategoriesv1-1.pdf?la=en. 2019. Accessed June 21, 2019.
- 2.Xu DM, Gietema H, de Koning H, et al. Nodule management protocol of the NELSON randomised lung cancer screening trial. Lung Cancer 2006;54:177–184. [DOI] [PubMed] [Google Scholar]
- 3.Hammer MM, Palazzo LL, Kong CY, et al. Cancer Risk in Subsolid Nodules in the National Lung Screening Trial. Radiology 2019;293:441–448. [DOI] [PMC free article] [PubMed] [Google Scholar]
- 4.Horeweg N, van Rosmalen J, Heuvelmans MA, et al. Lung cancer probability in patients with CT-detected pulmonary nodules: a prespecified analysis of data from the NELSON trial of low-dose CT screening. Lancet Oncol 2014;15:1332–1341. [DOI] [PubMed] [Google Scholar]
- 5.Hammer MM, Byrne SC. Cancer Risk in Nodules Detected at Follow-up Lung Cancer Screening CT. Am J Roentgenol. Epub ahead of print November 10, 2021. DOI: 10.2214/AJR.21.26927. [DOI] [PMC free article] [PubMed] [Google Scholar]
- 6.Obayashi K, Shimizu K, Nakazawa S, et al. The impact of histology and ground-glass opacity component on volume doubling time in primary lung cancer. J Thorac Dis 2018;10:5428–5434. [DOI] [PMC free article] [PubMed] [Google Scholar]
- 7.Russ D, Julie Barta MD, Nathaniel Evans MD, et al. Tumor Doubling Time of Pulmonary Carcinoid Tumors Measured by CT. Phase 1 Available from: https://jdc.jefferson.edu/si_ctr_2023_phase1/74. 2021. [DOI] [PubMed] [Google Scholar]
- 8.Zhang R, Tian P, Qiu Z, et al. The growth feature and its diagnostic value for benign and malignant pulmonary nodules met in routine clinical practice. J Thorac Dis 2020;12:2019–2030. [DOI] [PMC free article] [PubMed] [Google Scholar]
- 9.Gupta S, Jacobson FL, Kong CY, et al. Performance of Lung Nodule Management Algorithms for Lung-RADS Category 4 Lesions. Acad Radiol. Epub ahead of print June 12, 2020. DOI: 10.1016/j.acra.2020.04.041. [DOI] [PubMed] [Google Scholar]
- 10.Harris PA, Taylor R, Thielke R, et al. Research Electronic Data Capture (REDCap) - A metadata-driven methodology and workflow process for providing translational research informatics support. J Biomed Inform 2009;42:377–381. [DOI] [PMC free article] [PubMed] [Google Scholar]
- 11.de Hoop B, van Ginneken B, Gietema H, et al. Pulmonary Perifissural Nodules on CT Scans: Rapid Growth Is Not a Predictor of Malignancy. Radiology 2012;265:611–616. [DOI] [PubMed] [Google Scholar]
- 12.Nair A, Dyer DS, Heuvelmans MA, et al. Contextualizing the Role of Volumetric Analysis in Pulmonary Nodule Assessment: AJR Expert Panel Narrative Review. AJR Am J Roentgenol 2023;220:314–329. [DOI] [PubMed] [Google Scholar]
- 13.Wang Y, van Klaveren RJ, van der Zaag–Loonen HJ, et al. Effect of Nodule Characteristics on Variability of Semiautomated Volume Measurements in Pulmonary Nodules Detected in a Lung Cancer Screening Program. Radiology 2008;248:625–631. [DOI] [PubMed] [Google Scholar]
- 14.Zhao YR, Ooijen PM van, Dorrius MD, et al. Comparison of three software systems for semi-automatic volumetry of pulmonary nodules on baseline and follow-up CT examinations. Acta Radiol 2014;55:691–698. [DOI] [PubMed] [Google Scholar]
- 15.Devaraj A, van Ginneken B, Nair A, et al. Use of Volumetry for Lung Nodule Management: Theory and Practice. Radiology 2017;284:630–644. [DOI] [PubMed] [Google Scholar]
- 16.Hammer MM, Hunsaker AR. Strategies for Reducing False-Positive Screening Results for Intermediate-Size Nodules Evaluated Using Lung-RADS: A Secondary Analysis of National Lung Screening Trial Data. Am J Roentgenol. Epub ahead of print March 23, 2022. DOI: 10.2214/AJR.22.27595. [DOI] [PMC free article] [PubMed] [Google Scholar]