Abstract
Objective:
To develop a flexible miniaturized photoacoustic (PA) imaging probe for detecting anatomical structures during laparoscopic surgery. The proposed probe aimed to facilitate intraoperative detection of blood vessels and nerve bundles embedded in tissue not directly visible to the operating physician to preserve these delicate and vital structures.
Methods:
We modified a commercially available ultrasound laparoscopic probe by incorporating custom-fabricated side-illumination diffusing fibers that illuminate the probe’s field of view. The probe geometry, including the position and orientation of the fibers and the emission angle, was determined using computational models of light propagation in the simulation and subsequently validated through experimental studies.
Results:
In wire phantom studies within an optical scattering medium, the probe achieved an imaging resolution of 0.43 ± 0.09 mm and a signal-to-noise ratio of 31.2±1.84 dB. We also conducted an ex vivo study using a rat model, demonstrating the successful detection of blood vessels and nerves.
Conclusion:
Our results indicate the viability of a side-illumination diffusing fiber PA imaging system for guidance during laparoscopic surgery.
Significance:
The potential clinical translation of this technology could enhance the preservation of critical vascular structures and nerves, thereby minimizing post-operative complications.
Keywords: Photoacoustic Imaging, Laparoscopy, Image-Guided Intervention, Diffusing Fiber, Side Illumination
I. Introduction
LAPAROSCOPY is a minimally invasive surgical technique frequently employed for abdominal and pelvic surgeries such as prostatectomy and hysterectomy. In contrast to traditional open surgery, laparoscopy utilizes an endoscopic camera and specialized tools introduced through small incisions. The benefits of laparoscopy encompass reduced blood loss, expedited recovery, and overall enhanced functional outcomes (e.g., improved post-operative urinary continence and erectile function after prostate removal [1]). Laparoscopic surgery can be performed either manually or using a robotic surgical system. Commercially available laparoscopic robotic systems include the da Vinci Surgical System (Intuitive Surgical, USA) [2], the Senhance System (Asensus Surgical, USA) [3], and the Hugo System (Medtronic, USA) [4].
Despite its numerous advantages, laparoscopic surgery carries a significant risk of injury to the underlying anatomy, which may not be directly visible to the operating physician and could contain vital structures. Vascular injuries are not uncommon [5], [6] and can be life-threatening [7]–[10]. In the most severe hemorrhage control cases, surgeons must rapidly adapt their approach and convert to open surgery [11], [12]. The prevalence of nerve damage is also high, often stemming from patient malpositioning on the surgical table or endopelvic damage during surgery, particularly in robot-assisted laparoscopic prostatectomy [13], [14]. We hypothesize that refining methods to intraoperatively localize underlying anatomical structures will reduce complication rates for laparoscopic surgery.
Intraoperative guidance frequently employs ultrasound (US) imaging. Previous studies have explored the use of laparoscopic US guidance for adrenalectomy [15], [16] and procedures involving the liver [17], [18] and pancreas [19]. However, this imaging method does not offer sufficient differentiation between vessels, nerves, and the surrounding soft tissue. Although doppler imaging can facilitate vascular mapping, detecting nerves embedded in the tissue remains challenging. This paper investigates photoacoustic (PA) imaging, an emerging biomedical imaging modality based on laser-generated US [20]. Compared to conventional US, PA imaging can differentiate soft tissue by selectively targeting various chromophores (absorbing substances present in the tissue) by applying multiple laser wavelengths. PA imaging has been successfully applied in neurovascular mapping [20]–[27], monitoring ablation treatment [28], [29], catheter localization [30], [31], and tumor detection [32]–[34].
The device we propose in this paper, depicted in Fig.1, consists of an off-the-shelf US probe retrofitted with custom-designed laser-emission diffusing fibers. This design aligns the illumination field with the transducer imaging region without requiring a focusing mechanism. To maximize the illumination energy at the desired imaging depth and enhance imaging contrast, we modeled the illumination field of our customized fiber and conducted simulation analyses to calculate the optimal angles between the two fibers. The proposed system also features two degrees of freedom (DoF), allowing the tip rotation to adjust the imaging angle and maintain manipulability.
Fig. 1.
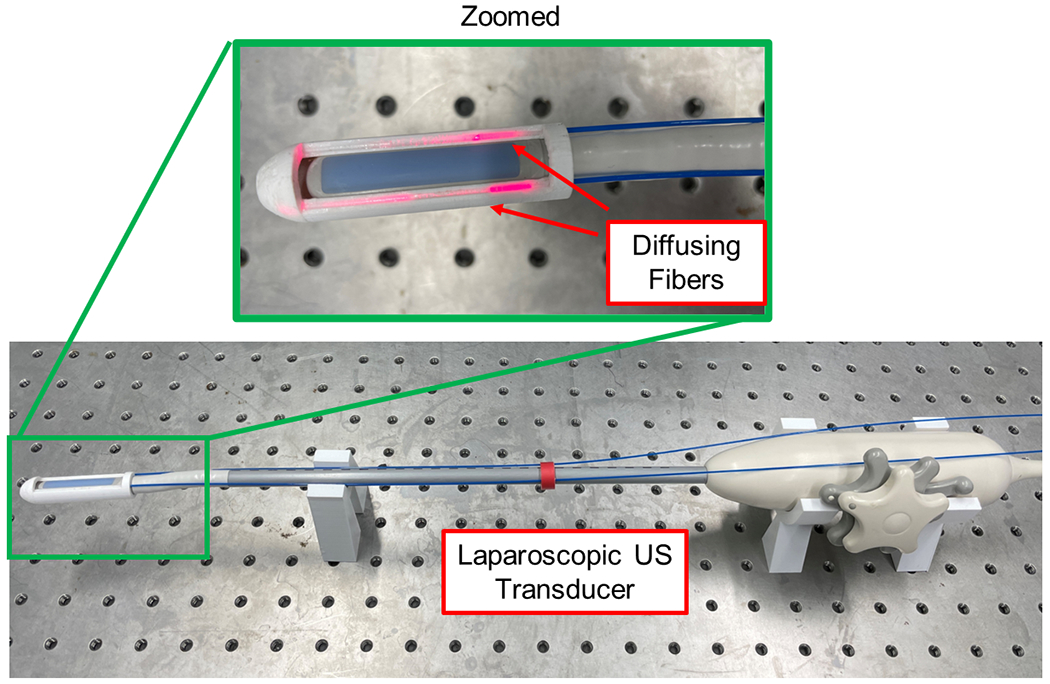
Proposed laparoscopic photoacoustic imaging system based on dual side-illumination diffusing fibers.
Section II of the manuscript discusses related work and summarizes the contributions of this paper. Section III introduces the methodology for preparing side-illumination diffusing fibers and the algorithm for detecting neurovascular anatomy. Section IV details the simulation-based design optimization, drawing on the measured fiber illumination model and evaluating the device’s working range. Section V presents phantom study results and ex vivo validation using a rat model to assess the imaging performance and functionality of the device in highlighting vessels and nerves. Finally, Section VI discusses the study’s findings and limitations. A preliminary version of this work has been reported [35].
II. Related Works and Contributions
A typical PA imaging probe comprises optical fibers for laser energy delivery and a US transducer. Although acoustic signals can penetrate longer distances in tissue, significant optical attenuation reduces illumination energy in deeper tissue, thereby limiting PA imaging’s utility for surgical guidance. Previous research has explored various approaches to introduce the light delivery system through an invasive incision for close illumination of the surgical area. Wiacek et al. described PA guidance in laparoscopic hysterectomy procedures by separating the light delivery fiber from the US transducer. The fiber was attached to the laparoscopic tool, illuminating the operating field while the endo-vaginal probe received the PA signal [36]. Despite achieving a high PA signal contrast, the illuminated region was narrow and prone to going off-plane due to alignment difficulties. Similarly, Song et al. used a separate light delivery system and transrectal US transducer, introducing PA marker technique for image alignment [37]; however, the PA illumination region remained narrow. Ai et al. integrated diffusing fibers with a transrectal US probe, inserting the fiber into the urethra channel and shaping the illumination using a mirror to direct the light as needed [38]. Li et al. employed an incisional diffusing fiber to illuminate the region of interest (ROI) while receiving the signal via a linear transducer on the skin surface [39]. Although the diffusing fiber illuminated a wider area, the imaging quality heavily relied on the alignment between fiber and transducers.
An integrated minimally invasive PA imaging device with illumination aligned with the transducer imaging plane is expected to deliver superior images for surgical guidance. In laparoscopic procedures, the remote center of motion (RCM) mechanism mechanically constrains the body entry point’s position in the operating space, thus minimizing patient trauma [40]. A device with a smaller diameter creates less trauma for the patient and allows for field angle adjustments in a narrow operational field within the abdomen, which the RCM also constrains.
The literature has reported several miniaturized integrated PA imaging devices. Basij et al. utilized customized angled tips fiber for side-illumination to reduce the diameter compared to bulky fiber bundles, which either necessitate multiple fibers or offer a limited illumination region [41]. Additionally, alignment between multiple fibers can limit the imaging device’s flexibility to adjust the imaging angle. A more straightforward light-delivery mechanism should be explored. The setup should employ fewer fibers while providing adequate illumination, enabling miniaturization of the probe’s diameter and maximizing its motion flexibility. While illumination from the optical fiber tip is common practice, fiber processing techniques, such as core etching [38] and tapered tips [42], [43], can diffuse light or create a larger illuminated area. Diffusing fibers can illuminate a broader region than the same number of angled-tip side-illumination fibers. Utilizing diffusing fibers for PA excitation could reduce the device diameter and simplify the design. An integrated laparoscopic PA imaging device with a miniaturized diameter and a streamlined alignment mechanism is necessary to provide intraoperative guidance with a flexible imaging angle.
Our contributions can be delineated into two aspects. First, we introduced an integrated laparoscopic PA system outfitted with a miniaturized light illumination method. This method incorporated two directional-diffusing side-illumination fibers affixed to the side of the US array, enabling the delivery of laser energy in alignment with the transducer imaging region without necessitating a focusing mechanism. Second, we performed simulation-based design optimization to maximize the illumination energy emanating from the diffusing fiber at the desired imaging depth, enhancing PA imaging contrast.
III. Materials and Methods
A. System Architecture
The proposed side-imaging laparoscopic PA imaging system is depicted in Fig.2. A side-imaging US transducer probe (Philips ATL Lap L9-5, Philips, Netherlands) serves as a signal-sensing device. Processed diffusing optical fibers (FT600EMT, Thorlabs, USA) were mounted on the probe via a custom 3D-printed component. The fiber features a diameter of 1,040 μm and a core diameter of 600 μm. The Verasonics Vantage system (Vantage 128, Verasonics, USA) functions as a data acquisition device. A Q-switched Nd:YAG laser (Q-smart 450, Quantel, USA) equipped with an optical parametric oscillator (OPO) (MagicPRISM, OPOTEK, USA) is utilized, capable of generating wavelengths in the range of 690 - 950 nm at a repetition rate of 20 Hz and a pulse duration of 5 ns.
Fig. 2.
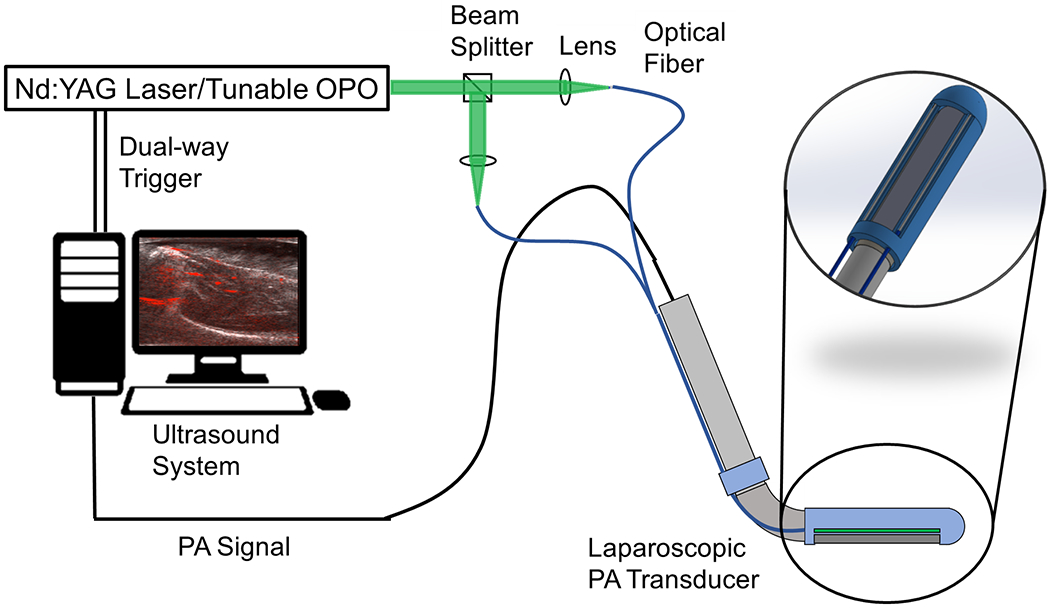
The system architecture of the proposed laparoscopic photoacoustic system.
B. Diffusing Fiber Preparation
The customized diffusing fiber underwent processing to facilitate directional side-illumination. The optical fiber (FT600EMT, Thorlabs, USA) implemented in this system is a multimode fiber designed for tip illumination. This fiber consists of a pure silica core (600 μm in diameter) with a polymer cladding (30 μm thickness), as depicted in Fig.3. A customized diffusing process was applied to illuminate a more extensive area from each fiber’s sidewall. Specifically, part of the fiber cladding was modified according to established methods [38]. Initially, a fiber stripper removed the fiber buffer, exposing the fiber cladding. The cladding on one tangent plane of the fiber’s side surface was eliminated to reveal the fiber core, as illustrated in Fig.3. Subsequently, the processed fiber was etched with glass etching cream (Armour Etch, Armour Product, USA) for two hours and rinsed with water. As the cladding remained unreactive to the cream, only the exposed portion of the fiber core was etched, resulting in light emission in the desired azimuthal direction.
Fig. 3.
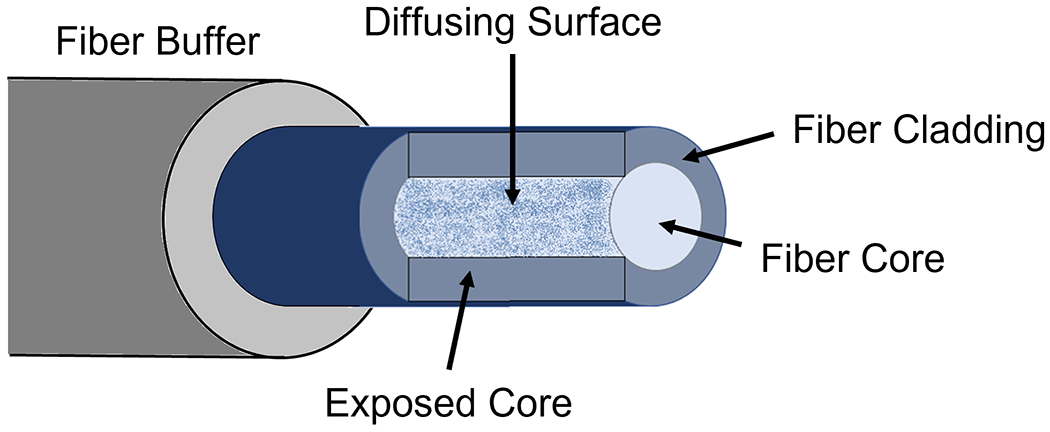
Schematic of the diffusing fiber with side-illumination.
C. Spectroscopic Decomposition
Biomedical materials each possess a unique PA spectrum that can be leveraged to identify their material composition. The measured PA signals contain absorptions from multiple chromophores and contrast agents. The process of extracting contrasts from each source is called spectral decomposition or spectral unmixing. This technology has been explored in applications such as blood oxygenation mapping [44], contrast agent-enhanced imaging [32], and intraoperative monitoring for radiofrequency ablation [28]. Under the assumption that the PA spectrum received from the tissue is a linear combination of multiple signal sources, the contribution from each contrast can be calculated using Eq.(1). In the equation, p represents the measured PA spectrum, i denotes the contrast source number, M signifies the number of absorbers, μa is the absorption spectrum of contrast source i at wavelength w, and W indicates the number of wavelengths used. The variable m is the estimated composition of the contrast source.
| (1) |
In the proposed work, the same approach is implemented to differentiate the contributions of hemoglobin and lipids, which represent vessel and nerve tissue, respectively. By utilizing the hemoglobin and lipid PA spectra as inputs for the algorithm, this equation can map the contributions of these tissue spectra.
IV. Evaluation
A. Diffusing Fiber Evaluation and Alignment Optimization
1). Fiber Illumination Measurement:
The limited energy emitted from the diffusing fiber necessitates maximizing illumination at the desired depth range to enhance the quality of the resulting PA image. Consequently, we conducted a simulation-based design optimization to investigate the angular alignment between the two diffusing fibers and the US transducer. We initially performed an experimental assessment of the optical intensity distribution of light emissions from our specially designed diffusing fiber to evaluate the optical capabilities. This result was employed to simulate the light beam from the diffusing fiber. We utilized the setup depicted in Fig.4, featuring a linear translation actuator capable of precisely moving the imaging screen along the light propagation axis. With the fiber secured, the illumination screen—measuring 10 by 10 mm2—moved in 10 mm increments within the 0 to 300 mm range. A Q-switched Nd: YAG laser (Q-smart 450, Quantel, USA) with an optical parametric oscillator (OPO) (MagicPRISM, OPOTEK, USA) generated a laser at the wavelength of 700 nm, which was coupled into the other end of the fiber to facilitate emission. A camera (C920 HD PRO, Logitech, Switzerland) captured photographs with fixed parameters, including sensitivity and exposure time at each step. The three-dimensional (3D) distribution of the light illuminated by the fiber was subsequently reconstructed from the camera images. The setup was positioned in a dark room to minimize the noise captured on the target image screen.
Fig. 4.
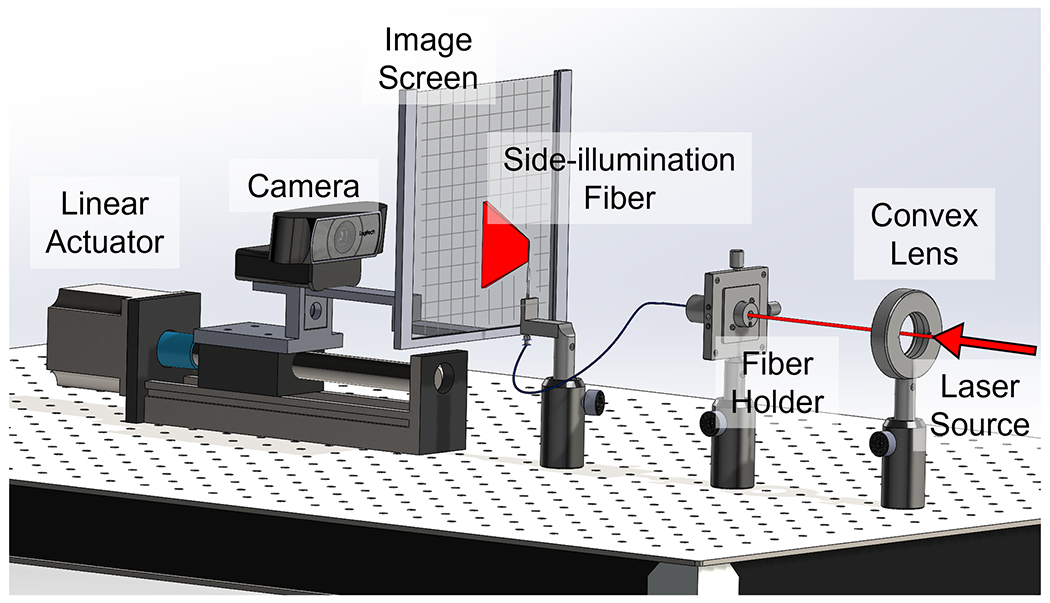
Experimental setup to map the optical field of the fiber side-illumination.
We employ Eq.(2) and Eq.(3) as our analytical model for describing the Gaussian beam performance:
| (2) |
| (3) |
CI denotes the center line illumination intensity, and IW represents the illumination region full width at half maximum (FWHM) at a distance of x, with x = 0 mm at the fiber sidewall surface. Variable a describes the on-axis optical intensity, while k indicates the spot size measured by the FWHM. Both a and k depend on the screen’s position, x.
2). Finite Element Method (FEM) Optical Simulation:
We conducted a single light source propagation simulation (optical simulation) of light propagation from the sidewall of a diffusing fiber using Valo MC [45], which is based on the finite element method (FEM) and the Monte Carlo method. Our objective was to construct an accurate numerical FEM model that described the experimentally measured light propagation mentioned in previous subsection. In our optical simulation, a two-dimensional simulation was performed on the axial-elevational (Y-Z) plane to understand the experimentally measured optical performance of the diffusing fiber. Due to computational limitations, a grid size of 1 mm was defined in the FEM. Although the experimental sidewall emission exhibited numerous optical modes in addition to the TEM00 mode (fundamental Gaussian beam), we considered only the latter in the optical simulation for simplicity.
Similar to the experimental data, we identified the values of a and k in the analytical model (Eq.(2) and (3)) that best fit the optical simulation results of optical propagation. We conducted a parametric study in optical simulation by changing the input parameter, which defines the Gaussian distribution of the initial light angle until the values of a and k from the optical simulation were within a 5% difference compared to aexp and kexp. We employed this optimized optical simulation model to investigate the subsequent PA simulation, which is described in further detail in the following section.
3). Angular Alignment Simulation:
After simulating the light propagation of side-illumination diffusion, two identical light sources were placed in the simulation environment (PA simulation) in the axial-elevational plane to replicate the design of the proposed imaging device. The interaction of two light beams and the PA response of targets at different depths can be studied to determine the optimized angular alignment between the light emission and the US transducer to maximize PA imaging quality. The K-wave [46] was implemented and connected with the optical simulation to compute the PA response. The PA signal amplitude generated by a material is proportional to its absorption coefficient. Compared to the surrounding simulated air medium, a single-pixel point with a high absorption coefficient setting was placed in the PA simulation environment as a point PA target. One point target was placed in each simulation condition, at a depth within the range of interest (0 - 300 mm with 10 mm steps).
At each target depth, various angular alignments were simulated between the centerlines of the two light emissions and the axial direction of the US transducer imaging plane. In this work, we selected an angular range of 0–10 degrees with an intermediate step of 0.5 degrees. The width between the two light sources was set to be identical to the width of our US transducer-sensing array to achieve a miniaturized design. A single-point US detector was placed in the center of the two light sources to simulate the transducer element. With PA excitation from two light beams, the point detector detected the PA signal of the point target. The intensity of this PA signal was recorded, along with the angular alignment setup and the target depth.
B. Device Working Range Evaluation
This system’s original side-imaging US transducer features two DoF on the imaging array rotation, controlled by a pair of handle knobs. This design enables sufficient device flexibility for imaging at desired positions and orientations within the abdomen. Our proposed system attaches optical fibers and their holder components to the US transducer. To assess the impact of these additional attachments on the probe’s tip rotation manipulability, we measured the working range limits of the proposed imaging system on both axes with the optical parts attached and compared them to the original off-the-shelf transducer range.
C. Photoacoustic Imaging Evaluation
1). Phantom Study:
We initially validated the PA imaging capability of the proposed dual-fiber side-imaging laparoscopic PA system through a phantom study to evaluate the system’s imaging quality. Nylon fish wire, serving as an imaging target, was mounted on a 3D-printed wire holder. The phantom comprises five vertically aligned wires and four horizontally aligned wires, facilitating a comparison of PA imaging quality along both the axial and lateral axes. The study setup is presented in Fig.5. The vertical wires are situated at 6.5, 11.5, 16.5, 21.5, and 26.5 mm depths from the transducer surface, while the four horizontal wires are positioned at a depth of 16.5 mm. The wire features a diameter of 0.2 mm. To more accurately simulate imaging performance in an optical scattering environment, we used a 2% concentration by volume of diluted milk as the imaging medium, introducing optical scattering into the study. The acquired PA signal was beamformed using Delay-and-Sum (DAS) algorithms [47]. We measured the FWHM of the PA signal profile to evaluate the spatial resolution of the acquired data. The image contrast was quantified using the signal-to-noise ratio (SNR), mathematically defined as follows:
| (4) |
Fig. 5.
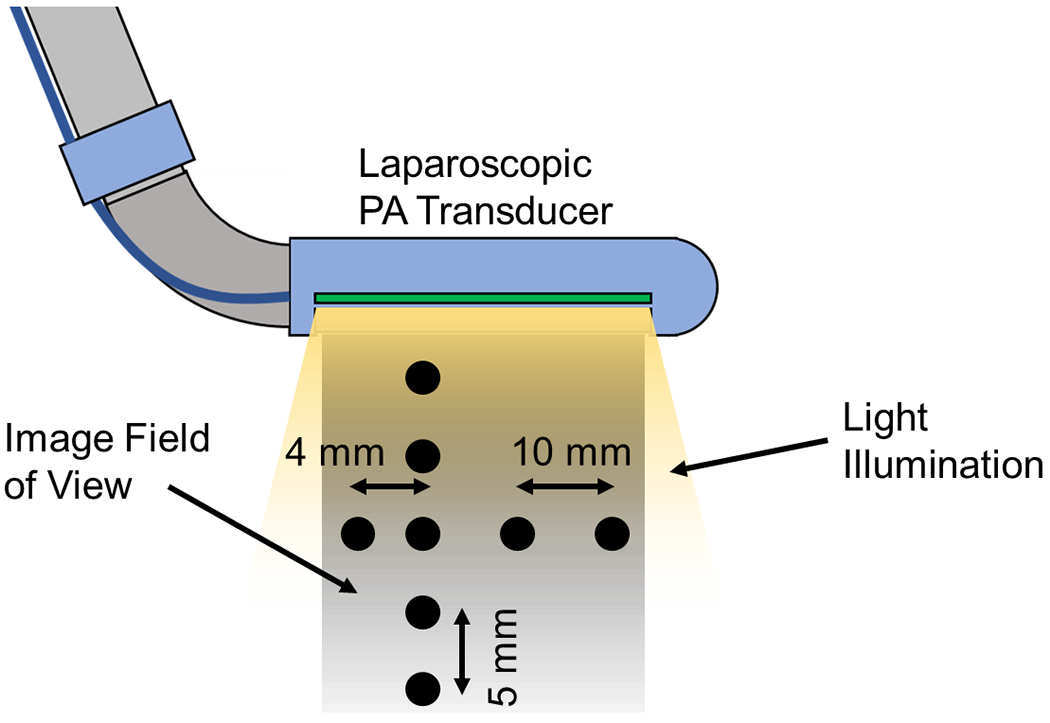
Phantom study target setup. The black points in the image indicate the location of the target wires.
Here, Ppeak represents the PA signal amplitude, and σnoise denotes the standard deviation of background noise. The noise region was selected at the same depth as the peak signal presented and more than 1 mm away from each peak’s lateral direction.
2). Ex vivo Study:
In addition to phantom evaluation, an ex vivo study was conducted to more effectively demonstrate the functionality of the proposed laparoscopic PA imaging device in detecting functional structures for surgical guidance. Spectroscopic PA (sPA) imaging was performed on ex vivo tissue to visualize the vessels and nerves beneath the tissue surface. The proposed laparoscopic PA system was employed to image the thigh of a female Sprague Dawley rat cadaver, euthanized during a surgery class at our institution and imaged within two hours post-euthanasia. The subject’s thigh was scanned, as shown in Fig.6, with the skin removed before scanning to simulate the laparoscopic surgical setup, exposing the underlying muscular layer for imaging. A neurovascular bundle was clearly visible in the center of the targeted thigh region. The spectroscopic decomposition algorithm utilized the spectra of oxygenated hemoglobin (HbO2), deoxyhemoglobin (HbR) [48], and lipid [49] to identify the PA signals generated by vessels and nerves, respectively. A total of 26 wavelengths were selected for PA excitation, ranging from 700 to 950 nm with a 10-nm step size, encompassing the local peaks of both hemoglobin and lipid spectra. An averaging filter with a sample size of 64 frames per wavelength was implemented to enhance the contrast of the sPA images. A DAS algorithm was applied for beamforming the acquired sPA data. A US image was also obtained at the same location for reference.
Fig. 6.
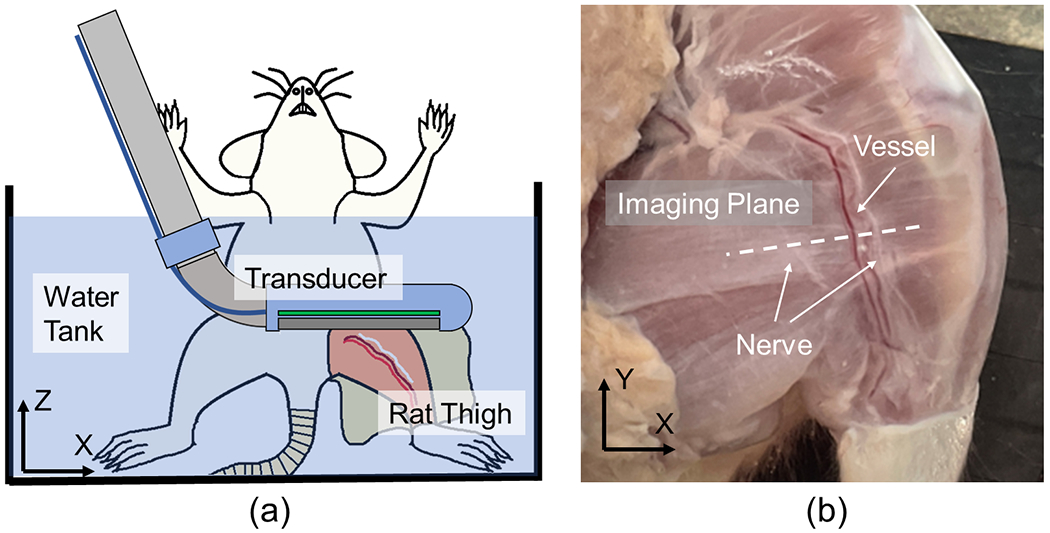
(a) Ex vivo study sample setup sketch, and (b) the scanned rat thigh with a white dashed line indicating the scanning plane.
V. Results
A. Diffusing Fiber Evaluation and Alignment Optimization
1). Experimental Measurements of Light Propagation from Fiber Sidewall Emissions:
The optical performance of the diffusing fibers was experimentally measured to simulate their light distribution. The diffusing illumination pattern from the fiber sidewall was measured at various distances. Fig.7 (a–e) displays the experimentally measured light distribution results. The Y-Z plane in Fig.7 (f) is defined as the x position indicated by the white line in Fig.7 (a–e), where maximum energy is measured along the x-axis. The intensity distribution along each z position in Fig.7 (f) follows a Gaussian profile that fits the raw intensity measurements obtained from the experiment at the corresponding z position. The beam intensity attenuates exponentially along the illumination distance, while a larger area is illuminated due to optical divergence. We observed that the experimental measurements could be well represented by the analytical model (Eq.(2) and (3)) when aexp = 1.017 and kexp = 0.156, as plotted in the white lines in Fig.7 (f).
Fig. 7.
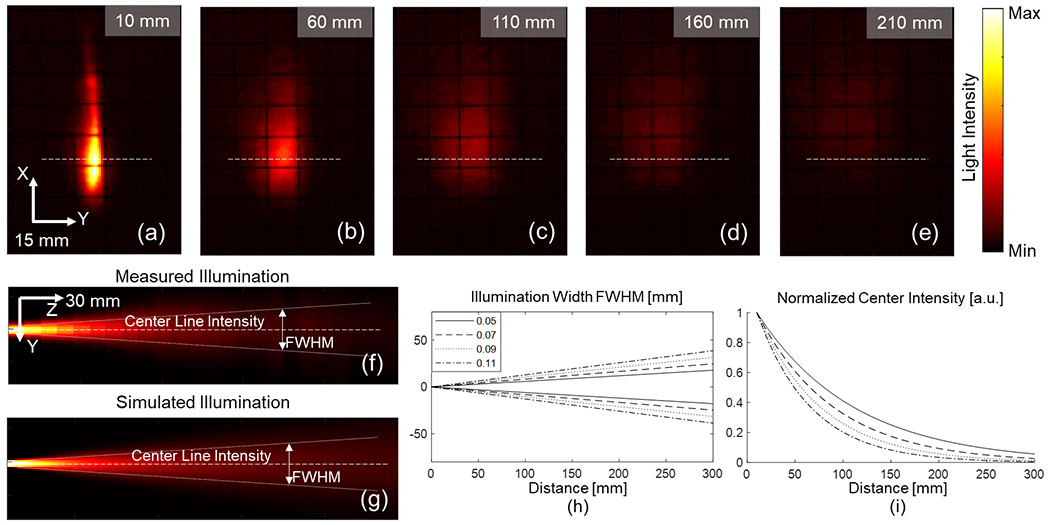
Fiber illumination measurement. (a)–(e) Measured illumination distribution using our proposed experimental setup at various depths; The white dashed line indicates the location of the Y–Z plane display; (f) Measured Y–Z plane light distribution; (g) Simulated light beam illumination; (h) Illuminated region width under different lateral Gaussian distribution settings; and (i) Normalized centerline intensity.
The output laser energy from the diffusing fiber was quantified using an energy meter (PE50BF-C, Ophir Optronics, Israel) to measure illumination intensity. At a wavelength of 700 nm, the laser output energy from the dual-diffusing fiber was measured to be 0.945±0.052 mJ during 1,100 illumination cycles. The diffusing energy efficiency was approximately 45.2% in a separate measurement during 1,000 illumination cycles.
2). Understanding Experimentally Measured Light Propagation through FEM-based Optical Field Simulation:
The diffusing light distribution was replicated in the optical simulation. A diffusing light beam was simulated, as shown in Fig.7 (g). The light source size in the optical simulation was 1 mm, limited by the simulation grid size of 1 mm, although it was larger than the fiber diameter of 660 μm. The simulated beam was fitted by the same analytical model (Eq.(2) and (3)) and compute the corresponding variables a and k. With the light source Gaussian distribution parameter tuned, the changes in the analytical model are demonstrated in Figs.7 (h) and (i), which plotted the light beam width and center line intensity, respectively. The simulated light beam with a and k within a 5% difference compared to aexp and kexp was selected to represent the experimentally measured light beam in the alignment study.
3). Simulation-based Optimization of Angular Alignment between Light Emissions and US Transducer:
Using the same diffusing light distribution model to mimic the diffusing fiber, two identical diffusing light sources were placed in the simulation environment (PA simulation) following the design of the proposed imaging device as shown in Fig. 8 (a). The PA response across the depth axis was recorded during light beam interaction angle changes. The optimized angular alignment between the interaction of two light beams to maximize the PA response at each depth was studied. The relationship between the PA intensity of the target at various depths under different angular alignments between light emission and the US transducer is exhibited in Fig.8 (b). As the figure demonstrates, when the fiber rotation is at 10 degrees, a shorter depth range (0 to 3 mm) is highlighted, indicating strong PA excitation. The PA intensity in the deeper region is enhanced as the fibers become more parallel to one another. The focus range ceases to extend any further when the alignment angle is less than 2 degrees.
Fig. 8.
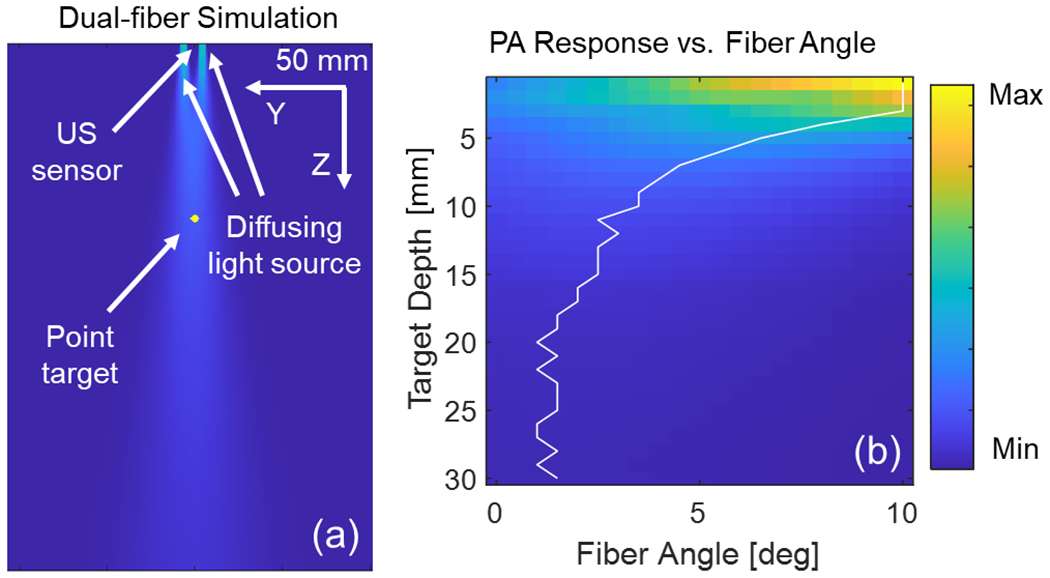
(a) Simulation of dual-fiber photoacoustic (PA) excitation, and (b) simulated PA intensity at target depths for various light beam interaction angles. The white line highlights the angle with maximum PA intensity at different depths.
B. Device Working Range Evaluation
The proposed PA device’s rotational working range was measured and displayed in Fig.9. The assignment of Cartesian coordinates is shown in Fig.9 (a). The X-axis is aligned with the centerline of the laparoscopic device, while the Z-axis points in the imaging direction when the probe is in its neutral rotational position. The rotational limit of the Z-axis ranges from −60 to 90 degrees, and the rotation of the Y-axis extends from −75 to 90 degrees. This measured working range corresponds precisely to that of the original off-the-shelf US laparoscopic transducer, as illustrated in Fig.9 (b) and (c).
Fig. 9.
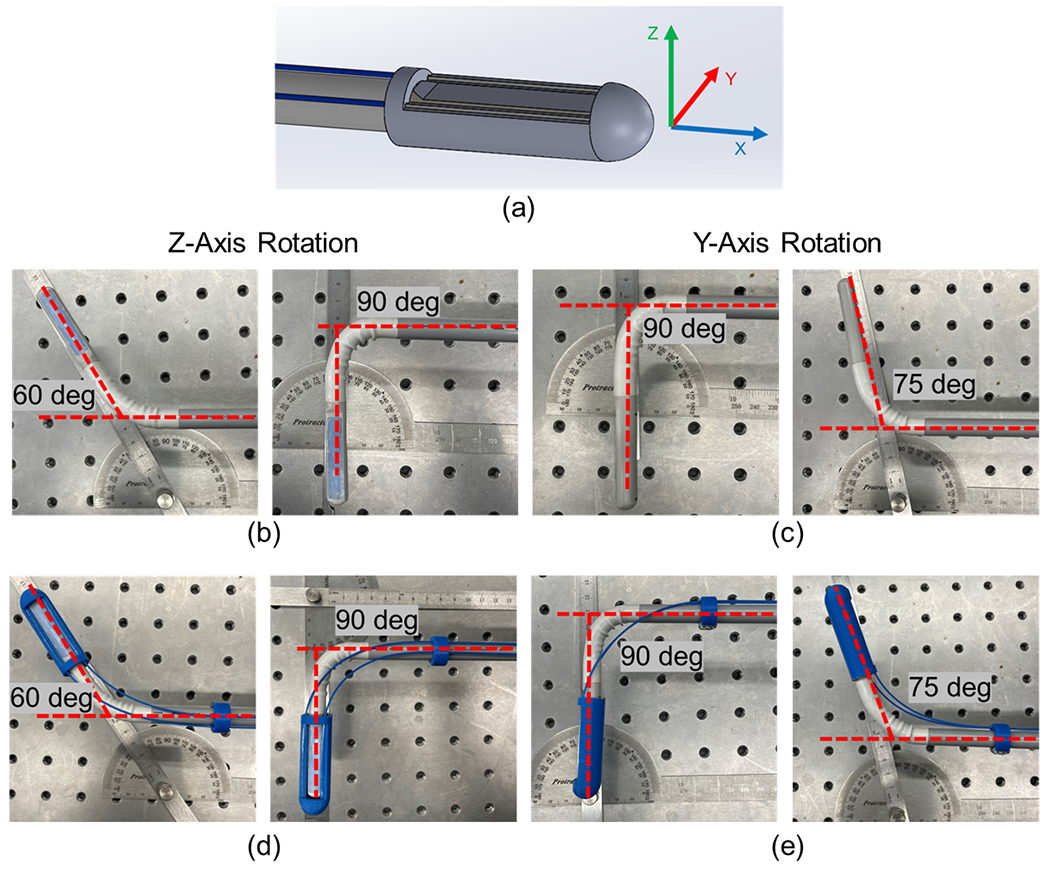
Evaluation of the working range for the proposed photoacoustic (PA) laparoscope. (a) Assignment of the Cartesian coordinate frame; (b) Z-axis rotation working range for the original probe; (c) Y-axis rotation working range for the original probe; and (d, e) Working range of the customized PA probe in the Z-axis and Y-axis, respectively.
C. Photoacoustic Imaging Evaluation
1). Quantitative Evaluation of PA Imaging Quality:
A phantom study was conducted to quantitatively validate the imaging capability of the proposed system before scanning biological tissue. The results of the wire phantom study are displayed in Fig.10. The US scanning of the phantom setup is shown in Fig.10 (a), which serves as the baseline for imaging, while Fig.10 (b) presents the beamformed PA image. The PA image was averaged over 64 frames before beamforming to enhance the contrast of the target signal. All eight wires, located from 6.5 to 26.5 mm in depth and left to right along the transducer array, were clearly visible and focused after beamforming. The target locations correspond to their positions in the US image. The PA image quality was quantitatively evaluated for each target wire. The image resolution (FWHM) and SNR were calculated and are listed in Table I. An average target lateral resolution of 0.43±0.09 mm and SNR of 31.2±1.84 dB were achieved in an optical scattering scanning medium across all eight wires with a dimension of 0.2 mm. The average axial resolution was 0.43 ± 0.18 mm.
Fig. 10.
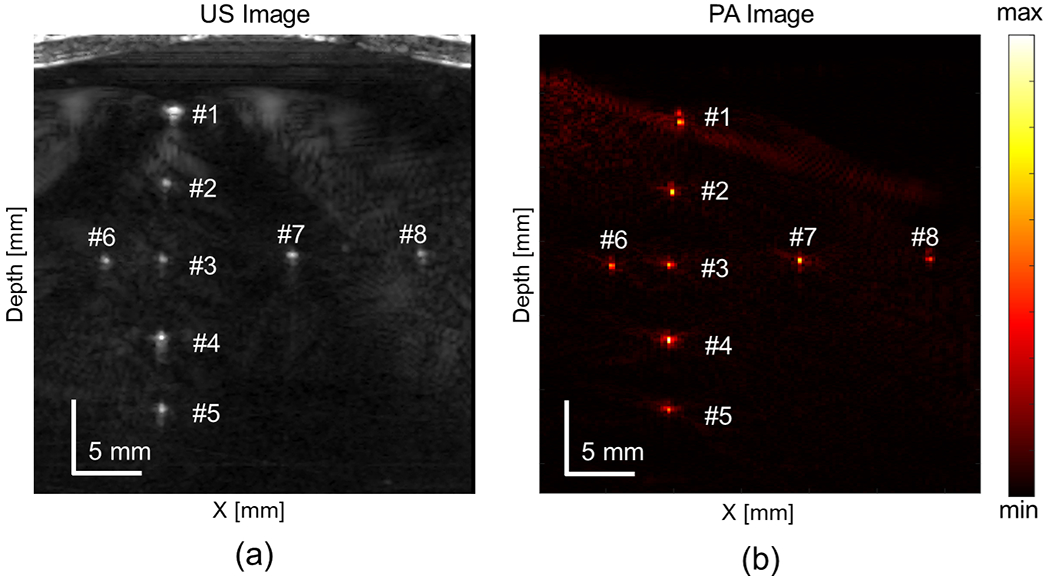
Scanned wire phantom with (a) ultrasound (US) and (b) photoacoustic (PA) imaging
TABLE I.
Quantified Image Resolution and signal-to-noise ratio (SNR) From Phantom Study
| Wire | #1 | #2 | #3 | #4 | #5 | #6 | #7 | #8 |
|---|---|---|---|---|---|---|---|---|
| SNR [dB] | 27.63 | 32.52 | 31.86 | 32.89 | 29.71 | 31.21 | 33.07 | 30.66 |
| Lateral FWHM [mm] | 0.4943 | 0.3009 | 0.4559 | 0.3789 | 0.4552 | 0.5046 | 0.3138 | 0.5542 |
| Axial FWHM [mm] | 0.8596 | 0.3845 | 0.3854 | 0.4298 | 0.3854 | 0.4081 | 0.3741 | 0.2390 |
2). Validation of Neurovascular Anatomy Detection:
The ex vivo functional structure detection results are displayed in Fig.11. The US image obtained at the imaging location is shown in Fig.11 (a), revealing the anatomy of the subject’s thigh. Fig.11 (b) presents the corresponding sPA image of the same location with a selected wavelength of 700 nm. Averaging filter with a sample size of 64 frames per wavelength was implemented to improve the contrast of the sPA images. The PA scanning results were consistent with those of the US scanning. The sample tissue boundary was accurately captured and aligned with the location of the US-scanned sample surface. The PA image captured several subsurface features, such as vessels. The vessel can be clearly visualized at a depth of 13.27 mm from the transducer. The SNR of the deeper region tissue was evaluated, as shown in Table II, where three Rois of the ex vivo tissue R1 to R3 were illustrated, as demonstrated in Fig.11 (b) with the background region selected as R4.
Fig. 11.
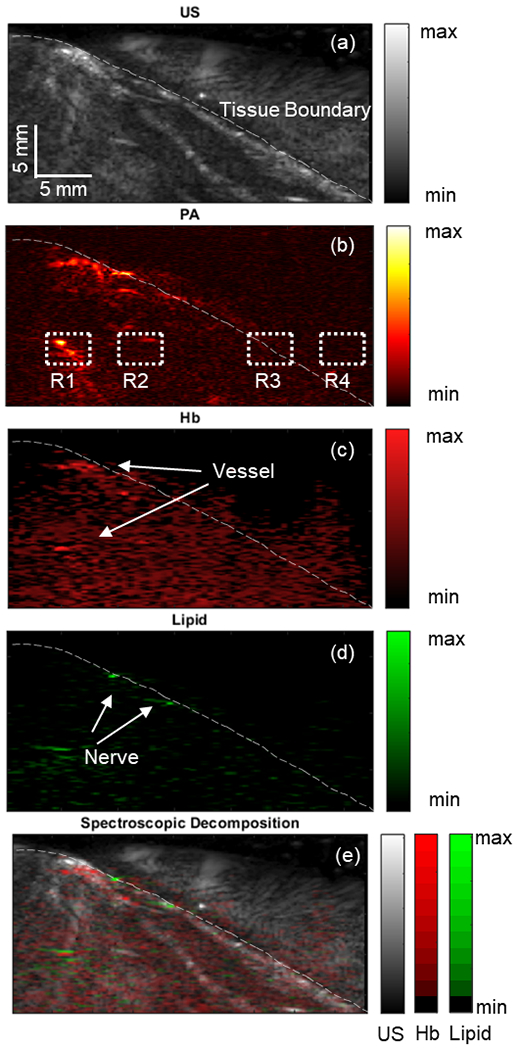
Illustrates the scanned ex vivo rat thigh using (a) ultrasound (US) and (b) spectroscopic photoacoustic (sPA) imaging at 700 nm. The dotted section was selected to measure the signal-to-noise ratio (SNR). The white dashed line marks the tissue boundary. The distribution maps of hemoglobin (Hb) (c) and lipid (d) contrasts are shown. (e) An overlaid image of different contrast distributions mapped onto the US images.
TABLE II.
Quantified Image signal-to-noise ratio (SNR) From Ex Vivo Study
| Region | #1 | #2 | #3 |
|---|---|---|---|
| SNR [dB] | 46.66 | 16.08 | 8.43 |
Spectroscopic decomposition was applied to the acquired sPA images to map the distribution of each contrast source corresponding to the vessels and nerves. Hemoglobin (Hb) was computed as the total decomposed HbO2 and HbR intensity. A significant quantity of Hb was detected within the tissue (Fig.11 (c)). A large vessel was identified 8.69 mm beneath the tissue surface. The lipid distribution map (Fig.11 (d)) highlighted a portion of the tissue surface where the targeted neurovascular bundle was located.
VI. Discussion
The present study introduces an integrated miniaturized laparoscopic PA imaging system for neurovascular detection in surgical guidance, employing side-illumination diffusing fibers. The optical intensity distribution of the customized diffusing fiber was experimentally measured, revealing that the beam intensity attenuates exponentially along the illumination distance. The experimentally measured optical field was accurately represented and replicated in the simulation. The PA simulation subsequently utilized this field profile to comprehend the targets’ light interaction and PA response at varying depths. The simulation study results successfully demonstrated the impact of fiber angular alignment on PA depth penetration. Intuitively, a larger interaction beam angle yields high light illumination in shallow-depth regions, thereby resulting in high PA intensity at shorter depth distances. As the alignment angle decreases, the light beam focuses on deeper regions, providing homogeneous illumination across the axial direction. Based on the simulation results, a 2–3 degree alignment angle was preferred for the proposed system to maximize the PA signal quality within the depth range of 15–20 mm while maintaining high illumination intensity at depth. Although assuming a Gaussian lateral beam intensity in practice may be idealized, the quantified beam profile suggests that the simulated beam profile aligns with the measurement.
The wire phantom study assessed the PA system’s imaging capability and quality. The target within the optically scattered medium was successfully illuminated and imaged, confirming that dual side-illumination diffusing fibers generate adequate illumination for PA imaging excitation. No significant imaging quality degradation was observed for wire #8, located at the tip (far end in the X-axis) of the probe setup when comparing phantom targets at the same depth (wire #3, #6, #7, and #8). This evaluation confirmed that the optical energy does not substantially decrease along the length of the diffusing fiber utilized in this work. Although the target FWHM (0.5542 mm) was larger than wire #3 (0.4559 mm) and #7 (0.3138 mm), the FWHM of wire #6 (0.5046 mm) was comparable. This FWHM degradation resulted from the edge of the image, which impeded the beamforming algorithm from applying the full aperture.
The ex vivo imaging demonstrated the efficacy of the proposed imaging system for surgical guidance in a realistic setting. The tissue surface was captured and aligned with the US image scanned at the same location. The PA image captured the subsurface anatomy, verifying the side-illumination diffusing fibers’ effectiveness and the proposed system’s functionality. Spectroscopic decomposition is an inverse problem, and using multiwavelengths more than the number of absorbers makes it overdetermined. The received PA spectral signals are affected by not only chromophore absorption but also random noises generated by the environment and imaging system. The spectroscopic decomposition assumes the problem to be a linear combination of chromophore absorption [50] and performs linear unmixing of multiple chromophores. The use of a limited number of wavelengths (e.g. the same as the number of chromophores) is prone to be affected by noise-originated estimation errors. Therefore, using more wavelengths than the number of chromophores minimizes the influence of noises by solving the overdetermined inverse problem via least squares optimization [51], [52]. Note that the scanning speed is compromised compared to illuminating less number of wavelengths. Using sPA imaging, we were able to detect and highlight nerves and vessels located several millimeters beneath the tissue surface. The quantitative measurement exhibited a strong signal intensity from subsurface anatomy, with a 46.66 dB SNR compared to the background signal at the same depth. Although the signal intensity at the tissue boundary (R3) was lower than that in the vascular region (R1) in the PA image, the boundary was accentuated in the Hb distribution map. This result demonstrates the potential of this imaging system to be integrated into laparoscopic surgery for image-based guidance, preventing damage to major vascular structures and nerves during procedures.
Fiber integration does not alter the working range of the proposed PA imaging system compared to the original US probe. The modified device operates similarly to the original probe, maintaining its ability to reach all desired angles as originally designed.
Despite successfully demonstrating the proposed laparoscopic PA imaging system, we acknowledge several limitations of the current results and methods. First, the diffusing light beam was experimentally measured based on the scattering effect in air, followed by a simulation that replicated the same optical performance. Optical attenuation is expected to be more pronounced in tissue and less uniformly distributed due to complex anatomical structures. Accurately acquiring the optical distribution profile in the tissue environment poses a challenge. However, the simulation effectively describes the light source parameter of the diffusing fiber, where the simulation would behave similarly to reality in a complex optical scattering environment, given the availability of an accurate optical model. Second, the averaging filter is currently required to improve imaging quality due to the relatively low contrast of single-frame PA images. As a trade-off, the imaging frame rate of the system is limited, hindering its application in the real-time imaging feedback desired for surgical guidance. A laser system with a higher pulse repetition frequency could improve the system in this aspect. Additionally, the fiber’s diffusing energy efficiency is relatively low with the current design, with a portion of the optical energy being lost from the fiber tip, resulting in a decrease in the imaged tissue fluence. Although the ex vivo study successfully imaged the target anatomy with sufficient illumination, it is necessary to investigate the higher diffusing efficiency of the optical fiber to achieve higher local fluence, reducing frame averaging and fastening scanning frame rates. Finally, the current ex vivo study was conducted in a water medium without tissue motion caused by heartbeat and respiration. Acoustic coupling in the clinical laparoscopy environment presents a challenge and should be investigated in future work. Moreover, the current design exhibits a discrepancy in the bending radius between the US transducer and the fiber, leading to a gap between the two components that could potentially entrap tissues during clinical procedures. Consequently, future work should integrate a design that accommodates a more flexible bending fiber to ensure a safe and effective clinical application.
VII. Conclusion
This work introduces a laparoscopic PA imaging system utilizing only two side-illumination diffusing fibers. The system miniaturizes the light-delivery mechanism while maintaining sufficient illumination to penetrate the tissue at the centimeter level. Phantom and ex vivo evaluation results demonstrate the delivery of adequate energy using diffusing fibers, effectively miniaturizing the dimensions of the laparoscopic PA imaging device. With sPA imaging, nerves and blood vessels are reliably detected using this device. These results suggest that the proposed system is viable for laparoscopic surgery guidance. The potential clinical translation of the technology could enhance the preservation of critical vascular structures and nerves, reducing post-operative complications.
Acknowledgments
This work was supported by the Worcester Polytechnic Institute internal fund, the Transformative Research and Innovation, Accelerating Discovery (TRIAD) grant, and the National Institutes of Health funding [grant numbers CA134675, DK133717, and OD028162].
Contributor Information
Shang Gao, Department of Robotics Engineering, Worcester Polytechnic Institute, 100 Institute Rd, Worcester, MA, USA 01609.
Yiwei Jiang, Department of Robotics Engineering, Worcester Polytechnic Institute, 100 Institute Rd, Worcester, MA, USA 01609.
Mucheng Li, Department of Mechanical & Materials Engineering, Worcester Polytechnic Institute, 100 Institute Rd, Worcester, MA, USA 01609.
Yang Wang, Department of Robotics Engineering, Worcester Polytechnic Institute, 100 Institute Rd, Worcester, MA, USA 01609.
Yao Shen, Department of Mechanical & Materials Engineering, Worcester Polytechnic Institute, 100 Institute Rd, Worcester, MA, USA 01609.
Matthew C. Flegal, Department of Biomedical Engineering, Worcester Polytechnic Institute, 100 Institute Rd, Worcester, MA, USA 01609, and also with Charles River Laboratories, 334 South St, Shrewsbury, MA, USA 01545
Benjamin C. Nephew, Department of Biology and Biotechnology, and Neuroscience Program, Worcester Polytechnic Institute, 100 Institute Rd, Worcester, MA, USA 01609
Gregory S. Fischer, Department of Robotics Engineering, Department of Mechanical & Materials Engineering, Department of Biomedical Engineering, and Department of Electrical & Computer Engineering, Worcester Polytechnic Institute, 100 Institute Rd, Worcester, MA, USA 01609.
Yuxiang Liu, Department of Robotics Engineering, Department of Mechanical & Materials Engineering, Department of Biomedical Engineering, and Department of Physics, Worcester Polytechnic Institute, 100 Institute Rd, Worcester, MA, USA 01609.
Loris Fichera, Department of Robotics Engineering and Department of Computer Science, Worcester Polytechnic Institute, 100 Institute Rd, Worcester, MA, USA 01609.
Haichong K. Zhang, Department of Robotics Engineering, Department of Biomedical Engineering, and Department of Computer Science, Worcester Polytechnic Institute, 100 Institute Rd, Worcester, MA, USA 01609.
References
- [1].Du Y, Long Q, Guan B, Mu L, Tian J, Jiang Y, Bai X, and Wu D, “Robot-assisted radical prostatectomy is more beneficial for prostate cancer patients: A system review and meta-analysis,” Medical Science Monitor, vol. 24, pp. 272–287, January 2018. [DOI] [PMC free article] [PubMed] [Google Scholar]
- [2].Palep Jaydeep H. Robotic assisted minimally invasive surgery. Journal of Minimal Access Surgery 5(1):p 1–7, Jan–Mar 2009. | DOI: 10.4103/0972-9941.51313 [DOI] [PMC free article] [PubMed] [Google Scholar]
- [3].Fanfani F, Monterossi G, Fagotti A, Rossitto C, Alletti SG, Costantini B, Gallotta V, Selvaggi L, Restaino S, and Scambia G, “The new robotic telelap alf-x in gynecological surgery: single-center experience,” Surgical Endoscopy, vol. 30, pp. 215–221, January 2016. [DOI] [PubMed] [Google Scholar]
- [4].Gueli Alletti S, Chiantera V, Arcuri G, Gioé A, Oliva R, Monterossi G, Fanfani F, Fagotti A, & Scambia G (2022). Introducing the New Surgical Robot HUGO™ RAS: System Description and Docking Settings for Gynecological Surgery. Frontiers in Oncology, 12, 898060. 10.3389/fonc.2022.898060 [DOI] [PMC free article] [PubMed] [Google Scholar]
- [5].Querleu D, Chapron C, Chevallier L, and Bruhat MA, “Complications of gynecologic laparoscopic surgery – a french multicenter collaborative study,” 10.1056/NEJM1993050632818r7, vol. 328, pp. 1355–1355, May 1993. [DOI] [PubMed] [Google Scholar]
- [6].Querleu D, Leblanc E, Cartron G, Narducci F, Ferron G, and Martel P, “Audit of preoperative and early complications of laparoscopic lymph node dissection in 1000 gynecologic cancer patients,” American Journal of Obstetrics and Gynecology, vol. 195, pp. 1287–1292, November 2006. [DOI] [PubMed] [Google Scholar]
- [7].Nordestgaard AG, Bodily KC, Osborne RW, and Buttorff JD, “Major vascular injuries during laparoscopic procedures,” The American Journal of Surgery, vol. 169, pp. 543–545, May 1995. [DOI] [PubMed] [Google Scholar]
- [8].Hanney RM, Alle KM, and Cregan PC, “Major vascular injury and laparoscopy,” Australian and New Zealand Journal of Surgery, vol. 65, pp. 533–535, July 1995. [DOI] [PubMed] [Google Scholar]
- [9].Brierley G, Arshad I, Shakir F, Visvathanan D, and Arambage K, “Vascular injury during laparoscopic gynaecological surgery: a methodological approach for prevention and management,” The Obstetrician & Gynaecologist, vol. 22, no. 3, pp. 191–198, 2020. [Google Scholar]
- [10].Asfour V, Smythe E, and Attia R, “Vascular injury at laparoscopy: a guide to management,” 10.1080/01443615.2017.1410120, vol. 38, pp. 598–606, July 2018. [DOI] [PubMed] [Google Scholar]
- [11].Zhang L, Ma J, Zang L, Dong F, Lu A, Feng B, He Z, Hong H, and Zheng M, “Prevention and management of hemorrhage during a laparoscopic colorectal surgery,” Annals of Laparoscopic and Endoscopic Surgery, vol. 1, December 2016. [Google Scholar]
- [12].Novellis P, Jadoon M, Cariboni U, Bottoni E, Pardolesi A, and Veronesi G, “Management of robotic bleeding complications,” Annals of Cardiothoracic Surgery, vol. 8, 2019. [DOI] [PMC free article] [PubMed] [Google Scholar]
- [13].Ball CG and Dixon E, Treatment of ongoing hemorrhage: The art and craft of stopping severe bleeding. Springer International Publishing, October 2017. [Google Scholar]
- [14].Cascella M, Quarto G, Grimaldi G, Izzo A, Muscariello R, Castaldo L, Caprio BD, Bimonte S, Prete PD, Cuomo A, and Perdona S, “Neuropathic painful complications due to endopelvic nerve lesions after robot-assisted laparoscopic prostatectomy: Three case reports,” Medicine, vol. 98, 2019. [DOI] [PMC free article] [PubMed] [Google Scholar]
- [15].Sebastian M and Rudnicki J, “Recommendation for laparoscopic ultrasound guided laparoscopic left lateral transabdominal adrenalectomy,” Gland Surgery, vol. 9, pp. 68994–68694, 2020. [DOI] [PMC free article] [PubMed] [Google Scholar]
- [16].Brunt LM, Bennett HF, Teefey SA, Moley JF, and Middleton WD, “Laparoscopic ultrasound imaging of adrenal tumors during laparoscopic adrenalectomy,” The American Journal of Surgery, vol. 178, pp. 490–494, December 1999. [DOI] [PubMed] [Google Scholar]
- [17].van der Steen K, Bosscha K, and Lips DJ, “The value of laparoscopic intraoperative ultrasound of the liver by the surgeon,” Annals of Laparoscopic and Endoscopic Surgery, vol. 6, April 2021. [Google Scholar]
- [18].Bezzi M, Silecchia G, Leo AD, Carbone I, Pepino D, and Rossi P, “Laparoscopic and intraoperative ultrasound,” European Journal of Radiology, vol. 27, pp. S207–S214, May 1998. [DOI] [PubMed] [Google Scholar]
- [19].John TG, Greig JD, Carter DC, and Garden OJ, “Carcinoma of the pancreatic head and periampullary region. tumor staging with laparoscopy and laparoscopic ultrasonography.,” Annals of Surgery, vol. 221, p. 156, 1995. [DOI] [PMC free article] [PubMed] [Google Scholar]
- [20].Beard P, “Biomedical photoacoustic imaging review,” Interface Focus, vol. 1, pp. 602–631, 2011. [DOI] [PMC free article] [PubMed] [Google Scholar]
- [21].Gandhi N, Allard M, Kim S, Kazanzides P, Bell MAL, Bell MAL, Bell MAL, and Bell MAL, “Photoacoustic-based approach to surgical guidance performed with and without a da vinci robot,” 10.1117/1JBO.22.12.121606, vol. 22, p. 121606, August 2017. [DOI] [Google Scholar]
- [22].Yao J and Wang LV, “Photoacoustic microscopy,” Laser and Photonics Reviews, vol. 7, pp. 758–778, 2013. [DOI] [PMC free article] [PubMed] [Google Scholar]
- [23].Matsumoto Y, Asao Y, Sekiguchi H, Yoshikawa A, Ishii T, ichi Nagae K, Kobayashi S, Tsuge I, Saito S, Takada M, Ishida Y, Kataoka M, Sakurai T, Yagi T, Kabashima K, Suzuki S, Togashi K, Shiina T, and Toi M, “Visualising peripheral arterioles and venules through high-resolution and large-area photoacoustic imaging,” Scientific Reports, vol. 8, pp. 1–11, October 2018. [DOI] [PMC free article] [PubMed] [Google Scholar]
- [24].Matsumoto Y, Asao Y, Yoshikawa A, Sekiguchi H, Takada M, Furu M, Saito S, Kataoka M, Abe H, Yagi T, Togashi K, and Toi M, “Label-free photoacoustic imaging of human palmar vessels: a structural morphological analysis,” Scientific Reports 2018 8:1, vol. 8, pp. 1–8, January 2018. [DOI] [PMC free article] [PubMed] [Google Scholar]
- [25].Hu S, “Neurovascular photoacoustic tomography,” Frontiers in Neuroenergetics, 2010. [DOI] [PMC free article] [PubMed] [Google Scholar]
- [26].Hu S and Wang LV, “Photoacoustic imaging and characterization of the microvasculature,” Journal of Biomedical Optics, vol. 15, p. 011101, 2010. [DOI] [PMC free article] [PubMed] [Google Scholar]
- [27].Kim C, Favazza C, and Wang LV, “In vivo photoacoustic tomography of chemicals: High-resolution functional and molecular optical imaging at new depths,” Chemical Reviews, vol. 110, pp. 2756–2782, 2010. [DOI] [PMC free article] [PubMed] [Google Scholar]
- [28].Gao S, Ashikaga H, Mansi T, Halperin HR, and Zhang HK, “Photoacoustic necrotic region mapping for radiofrequency ablation guidance,” pp. 1–4, IEEE, September 2021. [Google Scholar]
- [29].Gao S, Rahaman A, Ashikaga H, Halperin HR, and Zhang HK, “Miniaturized catheter-integrated photoacoustic ablation monitoring system: A feasibility study,” IEEE International Ultrasonics Symposium, IUS, vol. 2022-October, 2022. [Google Scholar]
- [30].Graham M, Assis F, Allman D, Wiacek A, Gonzalez E, Gubbi M, Dong J, Hou H, Beck S, Chrispin J, and Bell MA, “In vivo demonstration of photoacoustic image guidance and robotic visual servoing for cardiac catheter-based interventions,” IEEE Transactions on Medical Imaging, vol. 39, pp. 1015–1029, April 2020. [DOI] [PubMed] [Google Scholar]
- [31].Graham M, Assis F, Allman D, Wiacek A, Gonzalez E, Michelle A, Graham T, Gubbi MR, Dong J, Hou H, Beck S, Chrispin J, and Bell MAL, “Photoacoustic image guidance and robotic visual servoing to mitigate fluoroscopy during cardiac catheter interventions,” 10.1117/12.2546910, vol. 11229, pp. 80–85, February 2020. [DOI] [PubMed] [Google Scholar]
- [32].Zhang HK, Chen Y, Kang J, Lisok A, Minn I, Pomper MG, and Boctor EM, “Prostate-specific membrane antigen-targeted photoacoustic imaging of prostate cancer in vivo,” Journal of Biophotonics, vol. 11, pp. 1–6, September 2018. [DOI] [PMC free article] [PubMed] [Google Scholar]
- [33].Mehrmohammadi M, Yoon SJ, Yeager D, and Emelianov SY, “Photoacoustic imaging for cancer detection and staging,” Curr Mol Imaging, vol. 27, pp. 1–19, May 2013. [DOI] [PMC free article] [PubMed] [Google Scholar]
- [34].Zhang J, Duan F, Liu Y, and Nie L, “High-resolution photoacoustic tomography for early-stage cancer detection and its clinical translation,” Radiology: Imaging Cancer, vol. 2, May 2020. [DOI] [PMC free article] [PubMed] [Google Scholar]
- [35].Gao Shang, Flegal Matthew C., Zhang Haichong K., “Feasibility of laparoscopic photoacoustic imaging system based on diffusing side-illumination fibers,” Proc. SPIE 11960, Photons Plus Ultrasound: Imaging and Sensing 2022, 119601C (3 March 2022); 10.1117/12.2613895 [DOI] [Google Scholar]
- [36].Wiacek A, Wang KC, Wu H, and Bell MA, “Photoacoustic-guided laparoscopic and open hysterectomy procedures demonstrated with human cadavers,” IEEE Transactions on Medical Imaging, vol. 40, pp. 3279–3292, December 2021. [DOI] [PubMed] [Google Scholar]
- [37].Song H, Moradi H, Jiang B, Xu K, Wu Y, Taylor RH, Deguet A, Kang JU, Salcudean SE, and Boctor EM, “Real-time intraoperative surgical guidance system in the da vinci surgical robot based on transrectal ultrasound/photoacoustic imaging with photoacoustic markers: an ex vivo demonstration,” IEEE Robotics and Automation Letters, 2022. [DOI] [PMC free article] [PubMed] [Google Scholar]
- [38].Ai M, Youn J. in, Salcudean SE, Rohling R, Abolmaesumi P, and Tang S, “Photoacoustic tomography for imaging the prostate: a transurethral illumination probe design and application,” Biomedical Optics Express, vol. 10, p. 2588, 2019. [DOI] [PMC free article] [PubMed] [Google Scholar]
- [39].Li M, Lan B, Liu W, Xia J, and Yao J, “Internal-illumination photoacoustic computed tomography,” Journal of Biomedical Optics, vol. 23, p. 1, 2018. [DOI] [PubMed] [Google Scholar]
- [40].Kuo C-H and Dai JS, “Robotics for minimally invasive surgery: A historical review from the perspective of kinematics,” International Symposium on History of Machines and Mechanisms, pp. 337–354, January 2009. [Google Scholar]
- [41].Basij M, Yan Y, Alshahrani SS, Helmi H, Burton TK, Burmeister JW, Dominello MM, Winer IS, and Mehrmohammadi M, “Miniaturized phased-array ultrasound and photoacoustic endoscopic imaging system,” Photoacoustics, vol. 15, p. 100139, 2019. [DOI] [PMC free article] [PubMed] [Google Scholar]
- [42].Choi W-H and Papautsky I, “Fabrication of a needle-type ph sensor by selective electrodeposition,” 10.1117/L3580751, vol. 10, p. 020501, April 2011. [DOI] [Google Scholar]
- [43].Liu Z, Guo C, Yang J, and Yuan L, “Tapered fiber optical tweezers for microscopic particle trapping: fabrication and application,” Optics Express, Vol. 14, Issue 25, pp. 12510–12516, vol. 14, pp. 12510–12516, December 2006. [DOI] [PubMed] [Google Scholar]
- [44].Li M, Tang Y, and Yao J, “Photoacoustic tomography of blood oxygenation: A mini review,” Photoacoustics, vol. 10, pp. 65–73, 2018. [DOI] [PMC free article] [PubMed] [Google Scholar]
- [45].Leino AA, Pulkkinen A, and Tarvainen T, “Valomc: a monte carlo software and matlab toolbox for simulating light transport in biological tissue,” OSA Continuum, vol. 2, p. 957, March 2019. [Google Scholar]
- [46].Treeby BE and Cox BT, “k-wave: Matlab toolbox for the simulation and reconstruction of photoacoustic wave fields,” Journal of Biomedical Optics, vol. 15, p. 021314, 2010. [DOI] [PubMed] [Google Scholar]
- [47].Gao S, Tsumura R, Vang DP, Bisland K, Xu K, Tsunoi Y, and Zhang HK, “Acoustic-resolution photoacoustic microscope based on compact and low-cost delta configuration actuator,” Ultrasonics, vol. 118, p. 106549, January 2021. [DOI] [PMC free article] [PubMed] [Google Scholar]
- [48].Prahl Scott, Optical Absorption of Hemoglobin, [website] https://omlc.org/spectra/hemoglobin/summary.html
- [49].van Veen RLP, Sterenborg Henricus J.C.M., Pifferi Antonio, Torricelli Alessandro, Chikoidze Ekaterine, Cubeddu Rinaldo, “Determination of visible near-IR absorption coefficients of mammalian fat using time- and spatially resolved diffuse reflectance and transmission spectroscopy,” J. Biomed. Opt 10(5) 054004 (1 September 2005) 10.1117/1.2085149 [DOI] [PubMed] [Google Scholar]
- [50].Yun M, You SH, Nguyen VH, Prakash J, Glasl S, Gujrati V, Choy HE, Stiel AC, Min JJ, and Ntziachristos V, “Reporter gene-based optoacoustic imaging of e. coli targeted colon cancer in vivo,” Scientific Reports 2021 11:1, vol. 11, pp. 1–9, December 2021. [DOI] [PMC free article] [PubMed] [Google Scholar]
- [51].Lockwood J, Ringuette D, Zhou X, Yucel Y, and Levi O, “Optoacoustic tomographic imaging of myelinated structures in rodent brains,” Optics in the Life Sciences Congress (2017), paper BrW4B.4, vol. Part F76-BRAIN 2017, p. BrW4B.4, 4 2017. [Google Scholar]
- [52].Gonzalez EA, Graham CA, and Bell MAL, “Acoustic frequency-based approach for identification of photoacoustic surgical biomarkers,” Frontiers in Photonics, vol. 2, p. 6, October 2021. [Google Scholar]


