

SUMMARY
An abundance of research has recently highlighted the susceptibility of cochleovestibular ganglion (CVG) neurons to noise damage and aging in the adult cochlea, resulting in hearing deficits. Furthering our understanding of the transcriptional cascades that contribute to CVG development may provide insight into how these cells can be regenerated to treat inner ear dysfunction. Here we perform a high-depth single-cell RNA sequencing analysis of the E10.5 otic vesicle and its surrounding tissues, including CVG precursor neuroblasts and emerging CVG neurons. Clustering and trajectory analysis of otic-lineage cells reveals otic markers and the changes in gene expression that occur from neuroblast delamination toward the development of the CVG. This dataset provides a valuable resource for further identifying the mechanisms associated with CVG development from neurosensory competent cells within the otic vesicle.
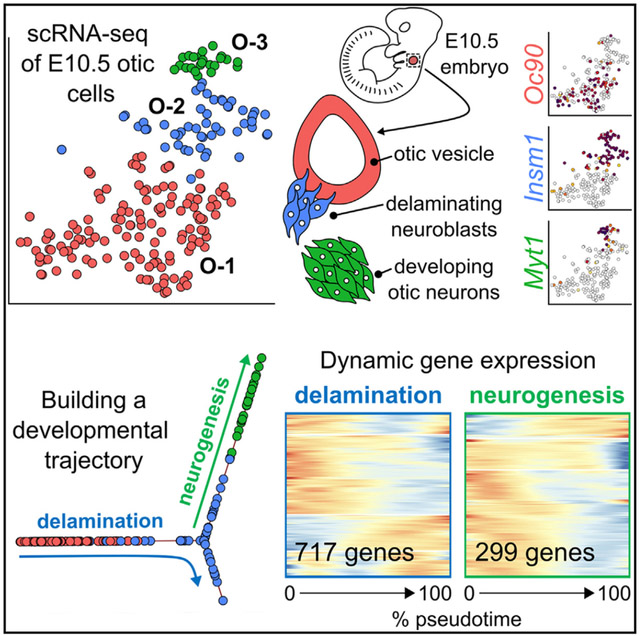
Graphical Abstract
In brief
Matern et al. provide a validated resource of E10.5 otic vesicle, neuroblast, and early otic neuron single-cell profiles. The neuroblast stage is defined by early neuronal and proliferative genes. Integrating published otic-lineage data from bracketing time points indicates neuroblast delamination as a dynamic process.
INTRODUCTION
Hearing impairment is a prevalent and chronic disorder that affects millions of people.1 Primarily caused by sensory hair cell loss and abridged neural transmission between the cochlea and the auditory brainstem, patients’ treatment options are limited to hearing aids and cochlear implants. Advances toward cellular replacement and drug-based regenerative approaches to cure hearing loss are hampered by the scarcity of inner ear cells, a few thousand per organ, and the resulting challenges for molecular analyses.2,3 Single-cell RNA sequencing (scRNA-seq) technology promises to overcome some of the existing challenges in defining the molecular identities of scarce cell populations in various organ systems and has already provided insight into the different cell types of the mammalian inner ear.2 Existing datasets have inventoried gene expression in the varied cell types of the inner ear and have demonstrated distinct gene expression changes during the embryonic and neonatal maturation of cochlear and vestibular cells.4-11
Here we present an scRNA-seq resource of the E10.5 otic vesicle, an early stage of the developing inner ear. The sensory epithelia of the cochlea and the vestibular systems are derived from the otic vesicle, as are the neurons that relay auditory and vestibular information to the brain.12-14 At the otic vesicle stage, the progenitors of the future cochlear and vestibular neurons are born. They delaminate as neuroblasts and migrate toward the cochleovestibular ganglion (CVG), where neuronal cell differentiation happens (Figure 1A). Neuroblast migration in mice is an ongoing process that occurs between embryonic days (E) 9.5 and E17.15-18 Using Pax2-Cre-mediated fate labeling, we flow-cytometrically isolated otic vesicle cells, neuroblasts, and differentiating CVG neurons at E10.5. We then conducted scRNA-seq with high sequencing depth of ≈ 106 reads per cell. We have identified many markers for the developing otic vesicle and found distinct populations of neuroblasts and differentiating neurons. Spatiotemporal trajectory reconstruction revealed gene expression changes linked to the processes of neuroblast delamination, migration, cell proliferation, and differentiation. The trajectory further revealed two phases of increased expression of cell-cycle-associated genes that aligned with known spatial and temporal features; a proliferative phase of otic vesicle cells before the process of delamination, and again during neuroblast migration. Moreover, our data integrated well with existing datasets from E9.5 and E11.519 and revealed that E10.5 otic-lineage cells are well suited for describing the early process of inner ear neuroblast generation, which fills a knowledge gap of existing work. The temporal transitions reflected in our trajectory analysis provide a rich resource for developmental biologists. Moreover, we argue that the gene expression patterns of native otic progenitor cells will be a valuable reference for comparison with stem cell-generated otic prosensory cells as well as replacement inner ear neurons.
Figure 1. Pax2-Cre;Ai14 marks otic vesicle cells and can be used to sort otic-lineage cells for scRNA-seq.

(A) Schematic representation of the E10.5 mouse embryo showing the position of the otic vesicle, delaminating otic neuroblasts, and developing CVG neurons.
(B) Overview image of an E10.5 Pax2Cre/+;Ai14tdTomato/+ embryo showing tdTomato expression in the otic vesicle, the developing mid- (mid) and hindbrain (hind), and the nephric duct (nd). TPMT = transmitted light.
(B′) The inset shows tdTomato expression in delaminating otic neuroblasts and geniculate ganglion (GG) neurons.
(C) Overview schematic of the scRNA-seq processing of dissociated otic vesicles and adjacent tissues from Pax2Cre/+;Ai14tdTomato/+ mice. Enzymatically dissociated tissues were subjected to fluorescence-activated cell sorting (FACS) for isolation of tdTomato+ cells. See also Figure S1 for FACS gate setup. The drawing was generated with BioRender.
RESULTS
scRNA-seq of the otic vesicle and developing inner ear neurons
To assess the transcriptional signatures of otic vesicle and neuroblast cells at E10.5, we used the Pax2-Cre model.20 The PAX2 transcription factor is essential for inner ear development and is expressed within all otic vesicle cells at E9.5. Thus, crossing Pax2-Cre animals to Ai14 (Ai14tdTomato/tdTomato) drives expression of the fluorescent marker tdTomato in otic-lineage cells throughout the development of the inner ear. To confirm the pattern of Pax2-Cre-mediated recombination, we collected Pax2Cre/+;Ai14tdTomato/+ embryos at E10.5 and validated strong tdTomato expression in the otic vesicle as well as neuroblast cell populations (Figures 1B-1B’). Additionally, tdTomato expression was observed in various surrounding tissues, such as the developing geniculate ganglion (GG), mid- and hindbrain, and the nephric duct. This is consistent with the activity of Pax2-Cre in other lineages during embryonic development.20
We collected tdTomato(+) otic vesicle and neuroblast cells using two consecutive methods of cell enrichment: (1) microdissection of the otic vesicle and adjacent tissues, followed by (2) fluorescence-activated cell sorting (FACS) based on tdTomato expression. Dissected otic vesicles were enzymatically digested to a single-cell suspension and exposed to Sytox Red for labeling of dead cells. Then 576 viable tdTomato(+) cells were sorted into individual wells of 96-well plates, and 500 single-cell libraries were processed for sequencing (Figures 1C and S1A; see STAR Methods for further details). Following read alignment, read quantification, and filtering, 491 cells passed quality control and were used for further analysis (see Figures S1B-S1E for scRNA-seq metrics).
The single-cell profiles were next normalized and clustered by similarities in gene expression using CellTrails,21 revealing six distinct cell clusters (1–6; Figure 2A, gEAR Permalink: https://umgear.org/p?l=774752d9). The clusters each contained roughly equal numbers of cells from all sorted plates (representing three independent replicates), suggesting that the clustering reflected biological rather than technical similarities in gene expression (Figure 2B). We next sought to identify which cell types these distinct clusters corresponded to. For this, we investigated the expression of known marker genes within the lists of all differentially enriched genes in each cluster. Differentially enriched genes were defined by a 2-fold greater expression (log2 fold change [LFC] >1) between the cluster of interest compared with all other clusters and an associated adjusted p value (false discovery rate [FDR]) < 0.05.
Figure 2. Clustering analysis reveals the identities of sequenced E10.5 Pax2-Cre;Ai14 otic vesicle and surrounding cells.

(A) Of the 500 cells sequenced, 491 passed quality control and were used for further analysis. Clustering of the 491 cells using CellTrails revealed seven distinct cell clusters. Cluster 7 contained only two cells and was removed from future analyses, leaving 489 cells and six clusters that correspond to otic-lineage cells as well as tissues that surround the otic vesicle based on known marker gene expression (see C). Shown is a 2-dimensional visualization of the cells, represented by dots; t-distributed stochastic neighbor embedding (tSNE) was used for dimension reduction.
(B) Cell clusters do not appear to be biased by 96-well plate, suggesting these clusters reflect biological phenotypes.
(C) Differentially enriched genes (DEGs) were identified by comparing gene expression in each cluster with all other clusters. Significantly DEGs were defined as having a log2 fold change (LFC) ≥1 and false discovery rate (FDR) <0.05 between the compared groups. Select genes with high differential enrichment or known biological significance are shown for each cluster. Maximum expression values are denoted in the top left of each tSNE plot. nd, not detected. Full lists of DEGs for each cluster can be found in Data S1.
Cluster 1 contained 26 differentially enriched genes (see Data S1 for the enriched gene lists of clusters 1–6). This included Hoxb2, a gene involved in the patterning of the developing hindbrain, as well as Nhlh2, a neuronal-specific basic-helix-loop-helix transcription factor.22-24 Therefore, cluster 1 was defined as developing hindbrain neurons (Figure 2C). Cluster 2 contained 177 differentially expressed genes, including the known and robust neuronal marker genes Tubb3 and Dcx, as well as the neuronal fate transcription factor Neurod1,25-27 which are also expressed to some extent in cluster 1. However, this cluster also highly expressed the gene Isl1, the expression of which has been shown to overlap with NEUROD1 in developing otic neuroblasts/neurons, as well as GG neurons, at E10.5.28,29 Additionally, cluster 2 showed enrichment for the GG marker Tlx2 (LFC = 1.06).19 Therefore, cluster 2 was determined to contain developing otic/GG neurons. Forty-two of the 91 differentially enriched genes for cluster 3 overlapped with cluster 2, including Eya2, Six1, and Insm1, three additional transcription factors known to be expressed in developing CVG neurons.30-33 However, cluster 3 showed more robust expression of the pan-otic marker Foxg1 (LFC = 1.37) compared with cluster 2 (LFC = 0.87), suggesting these cells may represent an intermediate identity between neurons and otic vesicle cells.34,35 We therefore determined these cells to be neuroblasts.
Cluster 4 contained 23 differentially enriched genes, including Hoxa2, another gene involved in patterning the developing hindbrain.22,23 Additionally, this cluster expressed high levels of Pax3 and Pax6, which encode two PAX family transcription factors also implicated in neural tube and hindbrain development.36,37 Because this cluster does not express high levels of the neuronal marker Tubb3 (LFC = −0.21) compared with cluster 1 (LFC = 1.17), we presumed cluster 4 to be non-neuronal developing neural tube/hindbrain cells. Cluster 5 contained 58 differentially enriched genes, including otic vesicle markers Oc90, Trpm3, and Lmx1a.12,38 Combined with the observed expression of pan-otic markers Six1 and Foxg1, cluster 5 was identified as the otic vesicle cells. Interestingly, cluster 5, as well as cluster 6 (38 differentially enriched genes), expressed the pan-epithelial marker Epcam.39 However, the enrichment of Epcam in cluster 6 did not reach our cutoff (LFC = 0.74), likely due to high expression in cluster 5 (LFC = 1.93). Additionally, we observed that a small subset of cells in cluster 6 also express Oc90, which we have previously reported as a marker of the dorsal-most region of the otic vesicle at E10.5.12,38 Further investigation of the genes enriched in cluster 6 revealed epidermal markers such as Anxa2 and Krt7 as more broadly expressed throughout cluster 6, as well as a subset of cells expressing the highly specific epidermal marker gene Trp63.40-43 We therefore define cluster 6 as surface ectoderm/epidermis. Interestingly, the subset of cells in cluster 6 that express Oc90 does not appear to overlap with the subset of cells that express Trp63 (Figure 2C). This suggests that some dorsal otic vesicle cells may maintain the transcriptional signature of their ectodermal origins even at E10.5, and therefore cluster more closely with the cells of the surface ectoderm/epidermis compared with the otic vesicle.
Transcriptomic signatures of otic vesicle cells, neuroblasts, and otic neurons
Based on the abundance of pan-otic markers Six1, Eya1, and Foxg1 in clusters 2, 3, and 5 (Figure 3A), we determined these three clusters to contain otic-lineage cells and all other clusters to be “off target.” The inclusion of off-target cells within our dataset is not unexpected due to the broad recombination pattern of Pax2-Cre (Figure 1B)20; however, these cells are not the focus of our analyses. Therefore, we next sought to computationally isolate the otic-lineage cells.
Figure 3. Expression of known markers identifies otic vesicle, delaminating neuroblasts, otic neurons, and GG neurons.

(A) Violin plots showing expression of the otic marker genes Six1, Eya1, and Foxg1 in clusters 2, 3, and 5.
(B) Violin plot showing expression of the GG marker Phoxb2 in clusters 1 and 2.
(C) Separation and reclustering of Six1/Eya1/Foxg1+ neuronal clusters 2 and 3 resulted in four clusters. The fourth cluster contained only two cells and was removed from future analyses.
(D) Violin plots showing expression of the GG marker genes Phox2a, Phox2b, and Tlx3 in cluster N-3, and expression of the otic-lineage genes Foxg1 and Fgf10 in clusters N-1 and N-2. Full list of DEGs between N-3 GG cells vs. N-1 + N-3 otic neuroblasts and neurons is provided in Data S1.
(E) Reclustering of 209 otic-lineage cells from cluster 5, cluster N-1, and cluster N-2 results in three clusters; O-1 represents otic vesicle, O-2 represents delaminating neuroblasts, and O-3 represents developing CVG neurons.
(F) Expression of otic vesicle marker genes Epcam, Oc90, and Trpm3 in cluster O-1, and neuronal marker genes Neurod1, Insm1, and Tubb3 in clusters O-2 and O-3. Maximum expression values are denoted in the bottom right of each tSNE plot. nd, not detected.
We previously noted that, while cluster 2 expressed high levels of otic marker genes, this cluster also showed enrichment for the GG marker Tlx2, and some cells also expressed the GG marker Phox2b (Figure 3B).19 To filter out GG cells from our Six1/Eya1/Foxg1+ neuronal clusters, we isolated and reclustered clusters 2 and 3, resulting in the cells separating into three neuronal (N) clusters (N-1–3, Figure 3C). A differential expression analysis comparing N-3 with N-1 and N-2 showed enrichment of GG marker genes such as Phox2a (LFC = 1.44), Phox2b (LFC = 2.15), and Tlx2 (LFC = 1.92) in cluster N-3 (Figure 3D; Data S1).19 Conversely, clusters N-1 and N-2 showed enrichment for the CVG markers Fgf10 (LFC = −1.73) and Foxg1 (LFC = −1.43), denoting them as the otic-lineage neuroblasts and neurons (Figure 3D).19
Having identified all otic-lineage cells (cluster 5, otic vesicle; cluster N-1, otic neurons; and cluster N-2, otic neuroblasts), we next combined these cells into a single dataset and reclustered them based on similarities in gene expression. This analysis again resulted in the separation of cells into three groups (Figures 3E and S2, gEAR Permalink: https://umgear.org/p?l=774752d9), which we named otic (O) clusters O-1 (133 cells), O-2 (53 cells), and O-3 (23 cells). Cluster O-1 expressed high levels of the otic vesicle marker genes Epcam, Oc90, and Trpm3, and was thus designated otic vesicle cells (Figure 3F). Clusters O-2 and O-3 were presumed to be neuronal populations as they expressed high levels of the neuronal marker genes Neurod1, Insm1, and Tubb3 (Figure 3F).
To discover additional marker genes for clusters O-1 to O-3 without the potentially confounding inclusion of off-target cells, we again used differential gene expression analysis. We first examined differentially expressed genes within O-1 compared with the other clusters (O-2 + O-3) (Figures 4A and 4B; Data S1). This analysis revealed 127 genes differentially enriched in O-1, including additional otic vesicle marker genes Esrp1 (LFC = 1.35), Tbx2 (LFC = 1.26), and Lmx1a (LFC = 1.21).12,38,44-46 Conversely, this comparison revealed 114 genes differentially enriched in the putative neuronal clusters O-2 and O-3, including Neurod1 (LFC = −2.77) and its downstream target St18 (LFC = −1.41), as well as Tubb3 (LFC = −1.70), Dcx (LFC = −1.64), and Insm1 (LFC = −2.19).27,31,47 Additional transcription factors were differentially enriched in each population: Pou4f1 (LFC = −1.62), a known marker of early CVG neurons at E10.5 that later labels the type I spiral ganglion neurons of the cochlea specifically48; Ebf1 (LFC = −2.11), a pioneer transcription factor involved in B cell specification that has also been identified as a potential target of distal-less homeobox 5 (DLX5) in the developing otic vesicle49,50; Rest (LFC = 1.31), a human deafness gene that normally functions to repress neuronal gene expression in non-neuronal cells51; and Yap1 (LFC = 1.06), a downstream regulator of the Hippo signaling pathway that functions to regulate cell proliferation in many organ systems, including the developing inner ear52,53 (Figures 4C and 4D).
Figure 4. Gene expression analysis of otic-lineage cells.

(A and B) Differential gene expression analysis of O-1 cells (otic vesicle cells, red) versus O-2 + O-3 cells (otic neuroblasts + neurons, blue) reveals 114 DEGs in otic neurons/neuroblasts and 127 DEGs in otic vesicle cells. DEGs were defined as LFC > 1 and FDR < 0.05 in the corresponding clusters.
(C and D) tSNE plots of DEGs within clusters O-2 + O-3 (C) or O-1 (D) identified in (B). Maximum expression values are denoted in the bottom right of each plot. nd, not detected.
(E and F) Differential gene expression analysis of O-2 cells (otic neuroblasts, blue) versus O-3 cells (otic neurons, red) reveals 280 DEGs in otic neuroblasts and 145 DEGs in otic neurons.
(G and H) tSNE plots of DEGs within cluster O-3 (G) or O-2 (H) identified in (F). Full lists of DEGs for each comparison can be found in Data S1.
We next assessed the global enrichment of genes and pathways within O-1 versus O-2 + O-3 differentially enriched genes. A Gene Ontology enrichment analysis (GOEA) of the genes differentially enriched in the otic vesicle cells revealed an association with epithelial cell proliferation, differentiation, and morphogenesis. Conversely, genes enriched in the neuroblast and neuronal populations were associated with terms such as axonogenesis, neuron development, and neuron projection development. Ingenuity pathway analysis (IPA)54 of the genes differentially expressed in both groups showed enrichment for the remodeling of epithelial adherens junctions, tight junction signaling, and notch signaling (see Data S2 for all GOEA and IPA results). Additionally, IPA identified an activation of the regulation of the epithelial mesenchymal transition (EMT) by growth factors pathway in the O-2 + O-3 neuronal cells (Z score = −1.134, representing repression in O-1 otic vesicle cells). This pathway activation is partially defined by increased expression of the EMT transcription factor genes Zeb1 and Zeb2 in clusters O-2 + O-3 (LFC = −1.44 and −1.58, respectively, in O-1 vs. O-2 + O-3; see Data S1 and S2).55,56
We next investigated the fundamental differences between the two otic-lineage neuronal clusters (O-2 and O-3). This revealed 145 genes differentially enriched in O-3, including Ncam1 (LFC = 1.81), which encodes for a neural-specific cell adhesion molecule; Nefl (LFC = 1.58) and Nefm (LFC = 1.31), encoding neurofilament light and medium chain, respectively; the axonal outgrowth gene Gap43 (LFC = 1.93); and another downstream NEUROD1 target gene, Myt1 (LFC = 1.51), which was recently identified as a CVG neuron marker at E10.5 (Figures 4E-4G; Data S1).19,47,57-59 We therefore designated O-3 as Tubb3+/Myt1+ CVG neurons. O-2 showed differential enrichment for 280 genes, with a strong representation of cell proliferation markers including Mki67 (LFC = −2.00), Cdk1 (LFC = −1.90), and Ccnb1 (LFC = −1.95) (Figures 4E-4F and 4H).60 Indeed, when we performed GOEA on the genes differentially enriched in O-2, we found an association with terms such as mitotic cell cycle, chromosome segregation, and cell division (Data S2). This contrasts with the GOEA of O-3 enriched genes, which aligned with neurogenesis-related processes such as neuronal projection development and axonogenesis (Data S2). Finally, IPA of the genes enriched in O-2 and O-3 confirmed a strong enrichment of pathways associated with the cell cycle, including the kinetochore metaphase signaling pathway, cell cycle control of chromosomal replication, and cell cycle: G2/M DNA damage checkpoint regulation (Data S2). This suggests that O-2 represents Neurod1+/Insm1+/Myt1 – newly delaminated neuroblasts undergoing a period of robust proliferation before differentiating into more mature neurons, represented in O-3.
Spatiotemporal alignment of the otic lineage suggests spatial differences in gene expression among otic vesicle cells
Having identified the reclustered otic-lineage cells, we next aimed to investigate the dynamic changes in gene expression that occur as otic vesicle cells delaminate as migratory neuroblasts and subsequently differentiate into CVG neurons. For this, we used CellTrails to align the cells along a developmental trajectory. This analysis orders cells along two dimensions based on similarities in gene expression to reflect developmental changes over a calculated pseudotime.21 The resulting trajectory shown in Figure 5A places the otic vesicle cells (O-1) to the left, the otic neurons (O-3) to the right, and the developing neuroblasts (O-2) as an intermediate between the two clusters. Projecting levels of gene expression along the calculated trajectory reveals that the expression of the dorsal otic vesicle marker Oc90 peaks within the farthest left O-1 cells, the ventral otic vesicle marker Lfng peaks at the region where O-1 transitions to O-2, and the neuroblast/neuron marker Neurod1 is robustly expressed throughout O-2 and O-3 (Figure 5B).38
Figure 5. CellTrails trajectory of otic-lineage cells aligns with spatial expression of select otic vesicle marker genes.

(A) Cells from clusters O-1, O-2, and O-3 were aligned along a trajectory based on similarities in gene expression using CellTrails.
(B) The resulting trajectory may reflect a dorsal to ventral to neuroblast to neuron spatio-developmental pattern, based on the position of highest expression of known marker genes. Maximum smoothed expression values are denoted in the bottom left of each plot. nd, not detected.
(C and D) In situ hybridization validation of dorsally (C) and ventrally (D) expressed otic vesicle genes (n ≥ 3). Scale bar, 100 μm; d, dorsal; v, ventral.
This observed pattern of marker gene expression changes led us to the hypothesis that the ordering of the O-1 cells may be reflective of dorsal to ventral positioning within the otic vesicle. We therefore tested this hypothesis in vivo using in situ hybridization. The genes Tbx1, Rspo3, and Rdh10 were predicted to be dorsal markers based on their highest peak of expression being within the further left of the trajectory within the O-1 cells (Figure 5C). Additionally, Rspo3 and Rdh10 showed some level of expression within the Oc90-expressing cluster 6 cells of the original full dataset (Figure S3). Visualization of Tbx1, Rspo3, and Rdh10 in the E10.5 otic vesicle confirms them as markers of dorsal cells. Conversely, Six2, Kremen1, Shisa2, Sfrp1, and Cdo1 were predicted to be markers of ventral otic vesicle cells as they exhibited lower expression levels at the left of the trajectory that then either peaked or increased toward the transition of O-1 cells into the O-2 neuroblasts (Figures 5D, S4). In situ hybridization confirmed this pattern of expression in vivo. However, an investigation into the expression of other dorsally predicted otic vesicle genes Hapln1, Fam46a, Lrrtm1, Tbx3, Brip1, and Spp1 showed an inconsistency, as Hapln1, Fam46a, Lrrtm1, and Tbx3 exhibited the predicted dorsal expression, whereas Brip1 and Spp1 were found to be more ventrally located (Figure S4). This suggests that the two-dimensional alignment of O-1 cells may not be wholly sufficient to reveal the complex patterns of gene expression that exist within a three-dimensional structure such as the otic vesicle. Application of three-dimensional reconstruction algorithms38,61 was limited by the low otic vesicle cell numbers and the tendency of the presumptively most dorsal Oc90-expressing cells to cluster with epidermal cells in cluster 6.
Gene expression dynamics during delamination and neural development reveal a period of ventral otic vesicle and otic neuroblast proliferation
We next assessed the dynamic changes in gene expression that occurred along two developmental paths that we defined within our trajectory. We hypothesized this would reveal more intricate gene expression patterns within the developmental trajectories that would have otherwise been overlooked by our differential gene expression analyses between cell clusters. The first trajectory (trail 1 [Tr1]), spanning from the O-1 otic cells to the branched endpoint within O-2 neuroblasts, we called “delamination.” The second trajectory (trail 2 [Tr2]), which spanned the branchpoint in O-2 to the end of the O-3 otic neurons, we called “neurogenesis” (Figure 6A). This analysis revealed 717 variably expressed genes (FDR < 0.05) across Tr1, which we grouped based on their patterns of gene expression over pseudotime into four clusters (Tr1Cl1–4; Figure 6B; Data S3; see STAR Methods for details).
Figure 6. Gene expression across developmental pseudotime reveals an enrichment of cell cycle genes in neuroblasts.

(A) Spatiotemporal trails (Tr) were defined as delamination (Tr1, cluster O-1 to O-2) and neurogenesis (Tr2, clusters O-2 to O-3).
(B) Significantly changed genes across Tr1 separated into four clusters (Tr1Cl1–4) based on similar expression patterns. Cluster 1 n = 91 genes, cluster 2 n = 356 genes, cluster 3 n = 159 genes, and cluster 4 n = 111 genes.
(C) Significantly changed genes across Tr2 separated into three clusters (Tr2Cl1–3). Cluster 1 n = 45 genes, cluster 2 n = 56 genes, and cluster 3 n = 198 genes. Lists of genes within each cluster can be found in Data S3.
Tr1Cl1 contained 91 genes that initially showed high expression within the O-1 otic vesicle cells, gradually reduced as cells delaminated into O-2 neuroblasts, and then were again upregulated in O-2 neuroblasts. Similarly, Tr1Cl2 contained 356 genes, also initially high in O-1, which decreased in expression as cells transitioned into O-2 neuroblasts. GOEA of Tr1Cl1 genes did not result in any enriched terms; however, GOEA of Tr1Cl2 genes revealed an association with tight junction assembly and epithelium development, among others (see Data S2 for all GOEA results). Tr1Cl3 contained 159 genes that were initially low within the O-1 otic vesicle cells and increased as cells transitioned into O-3 neuroblasts. GOEA revealed that these genes are associated with early neuronal processes such as projection development and neurogenesis. Tr1Cl4 featured 111 genes that showed a more complex gene expression pattern across pseudotime. These genes were initially lowly expressed within the leftmost cells of O-1, increased in expression in the O-1 cells before transitioning to O-2 and being downregulated, but then were upregulated again within the branchpoint at the end of the trajectory. Gene enrichment analyses of Tr1Cl4 genes showed an association with cell division and mitotic cell cycle (Data S2), suggesting that these two waves of gene expression identified in the trajectory may reflect one or more cycles of proliferation in the otic vesicle before delamination, and again in migrating neuroblast cells, respectively. While previous studies have shown robust proliferation using bromodeoxyuridine (BrdU) labeling in the entirety of the otic vesicle and in the otic neuroblasts at E10.5,62 explicit experimentation to assess the exact developmental context of cell cycle gene regulation would be needed to address the significance of this observation in vivo. Generally, we hypothesize that the location of O-1 otic vesicle cells along the delamination trajectory Tr1 may be determined by cell cycle progression in addition to dorsal to ventral spatial location.
Tr2 (neurogenesis) featured 299 variably expressed genes that separated into three clusters based on similar patterns of expression across pseudotime (Data S3; Figure 6C). Tr2 cluster 1 (Tr2Cl1) contained 45 genes that demonstrated low expression within the O-2 neuroblast cells, which increased as cells developed into O-3 otic neurons. Gene enrichment analysis of the Tr2Cl1 genes identified one term, neurofilament bundle assembly, that contained the neurofilament genes Nefm and Nefl (Data S2). This may be reflective of the still early development of CVG neurons at E10.5, which are just beginning to adopt more mature neuronal features. Both Tr2Cl2 (56 genes) and Tr2Cl3 (198 genes) contained genes that were initially highly expressed within O-2 neuroblasts and decreased in expression as cells developed into O-3 neurons. Tr2Cl2 genes decreased at a more gradual rate compared with those of Tr2Cl3, which displayed a steeper drop. The genes of Tr2Cl2 were enriched for terms such as DNA replication initiation, whereas Tr2Cl3 genes were robustly associated with cell cycle progression (Data S2). This too suggests the adoption of more mature neuronal developmental features at the end of Tr2, as these cells are seemingly no longer proliferating.
Cell cycle correction does not reveal additional features of otic-lineage cell development along the trajectory
After observing waves of gene expression associated with cell cycle progression in the delamination trajectory from O-1 to O-3, we hypothesized that cell cycle genes might dominate the alignment of cells. We therefore sought to correct for cell cycle effects in our dataset to enable potential latent factors to direct cell positioning along the spatiotemporal trajectory. To do this, we first investigated the distribution of cell cycle phase in our dataset. Otic cells were binned into G1, G2/M, or S phase using SingleR (see STAR Methods). Visualization of cell cycle phase within each cluster showed an even representation of all phases within the otic vesicle O-1 and neuroblast O-2 populations, with apparent sub-grouping of cells by phase within clusters (Figure S5A). This is consistent with observations that otic vesicle cells and neuroblasts are proliferating at E10.5.62 Furthermore, we observed that the more mature CVG neurons in cluster O-3 were mainly designated as G1, consistent with these cells becoming post-mitotic. We next assessed the distribution of the cell cycle phase along our spatiotemporal trajectory. G1-designated cells grouped at the transition of O-1 to O-2 (Figure S5B), matching of the pattern of cell cycle-related gene downregulation toward the center of the delamination trajectory (Tr1Cl4 genes in Figure 5B). Additionally, G1-labeled cells grouped at the end of the trajectory as O-3 CVG neurons (Figure S5B).
After observing the distribution of cell cycle phase in our existing data, we next performed a cell cycle correction by removing 1,424 genes associated with the Gene Ontology (GO) term GO: 0007049 ("cell cycle") from our dataset. Reanalysis of the corrected otic (CO) data resulted in the identification of three clusters that corresponded to otic vesicle (CO-1), neuroblast (CO-2), and otic neuron cells (CO-3) (Figure S5C). Visualization of the previously assigned phase annotation for each cell showed a loss of sub-grouping by phase within clusters CO-1 and CO-2, as well as a less robust grouping of G1 cells in the center of the delamination trajectory (Figures S5C-S5D). The slight reshuffling of cells confirms that cell cycle-related genes were indeed contributing to the initial alignment of cells along pseudotime. We next investigated the extent to which otic vesicle and neuroblast cells were reshuffled by assessing expression patterns of known marker genes. The dorsal otic vesicle marker gene Oc90 showed its highest expression to the far left of the delamination trajectory, within the CO-1 otic vesicle cells, whereas the ventral marker gene Six2 peaked at the transition of CO-1 to CO-2 neuroblasts (Figure S5E). Additionally, Ebf1, which we previously identified as a marker for neuroblasts and CVG neurons (Figure 4C), as well as the CVG marker gene Myt1, were increasingly expressed as cells transitioned from CO-1 to CO-2 and CO-2 to CO-3, respectively (Figure S5E). Together, these data suggest that the overall dorsal to ventral to neuroblast to CVG neuron alignment of cells is conserved after removing cell cycle genes. Cell cycle genes certainly contributed to the trajectory alignment but did not dominantly determine the cells’ position along the trajectory.
Finally, we sought to identify additional markers that potentially were hidden in the original trajectory by performing a trajectory analysis along the cell cycle-corrected delamination trail (Tr1; Figure S5D). This analysis revealed 617 genes that dynamically changed across the corrected Tr1, which separated into four clusters based on similar patterns of expression (Data S3; Figure S5F). These patterns were almost identical to those shown in Figure 6B; however, GOEA of Tr1Cl1-4 genes revealed a loss of expected relevant GO terms (Data S2). This analysis was also repeated for Tr2 (neurogenesis), with a similar loss of resolution (Figure S5G; Data S2 and S3). Based on these observations, we concluded that cell cycle genes are not necessarily a confounding feature of our data analysis but rather an inherent feature of otic vesicle and neuroblast cells that is tightly coupled to their spatiotemporal placement along the trajectory.
Integration of E10.5 otic-lineage cells with published E9.5 and E11.5 scRNA-seq data
Recently, Sun and colleagues generated single-cell profiles using 10X Genomics technology for developing otic vesicle, neuroblast, and CVG neuron cells at E9.5 and E11.5.19 We next expanded our analysis by integrating these annotated E9.5 and E11.5 otic-lineage cells with our non-overlapping E10.5 data. After isolating otic-lineage cells from the E9.5 and E11.5 datasets, cell profiles from all three time points were combined, scaled, and normalized using batchelor63 before reclustering and trajectory analysis using CellTrails. This resulted in six clusters, which we named combined (C) 1–6 (Figure 7A; Data S7). Cluster C-1 (270 cells) contained Tubb3+/Myt1+ developing CVG neurons, C-2 (348 cells) contained Insm1+/Neurod1+/Myt1 – otic neuroblasts, and clusters C-3 to C-6 (1,005 cells) contained subsets of Epcam+/Tbx2+ otic vesicle cells (Figure 7B; full lists of differentially enriched genes provided in Data S4). We observed that the E9.5 cells mainly integrated into the C-3 otic vesicle cluster, which is in accordance with the published annotation of these cells as mainly otic vesicle,19 while E11.5 cells populated all clusters (Figure S6A and S6B). E10.5 cells clustered together with the 10X data only in clusters C-1 to C-3, suggesting that (1) C-4 to C-6 cells may represent later stages of E11.5 otic vesicle development, and (2) the E10.5 time point alone provides a sufficient developmental snapshot to encompass the process of neuroblast delamination from the otic vesicle and their subsequent development into early CVG neurons. To assess potential differences between technologies, we also performed differential gene expression analyses between 10X and Smart-seq-generated cell profiles within clusters C-1 to C-3. This analysis is presented in Figure S6C, and lists of genes are available in Data S4. As expected, we found that more enriched genes were identified with deeper sequencing using Smart-seq technology compared with the shallower sequenced 10X-generated profiles.
Figure 7. Integrated analysis of E10.5 otic-lineage cells with published E9.5 and E11.5 scream-seq data.

(A) Otic-lineage cells from E9.5 and E11.5 mice 10X Genomics experiments (10X) were combined with the E10.5 Smart-seq otic-lineage cells (SS) using batchelor and grouped into six clusters (combined [C-]1–6) using CellTrails. Lists of differentially expressed genes for each cluster can be found in Data S4.
(B) tSNE plots showing clusters C-3 through C-6 represent otic vesicle cells based on high Epcam+Tbx2 expression, cluster C-2 represents delaminating neuroblasts based on high Neurod1+Insm1 expression but low Tubb3+Myt1 expression, and cluster C-1 represents developing CVG based on high Tubb3+Myt1 expression. Maximum expression values are denoted in the bottom left of each plot. nd, not detected.
(C and D) Cells from C-1-6 were aligned along a trajectory based on similarities in gene expression using CellTrails.
(E) Trajectory analysis reveals potential substructural information of otic vesicle cells based on expression of known marker genes. A, anterior; P, posterior; D, dorsal; V, ventral; M, medial; L, lateral.
(F) Significantly changed genes across Tr1 separated into four clusters (Tr1Cl1–4) based on similar expression patterns. Cluster 1 n = 431 genes, cluster 2 n = 827 genes, cluster 3 n = 605 genes, and cluster 4 n = 328 genes.
(G) Significantly changed genes across Tr2 separated into three clusters (Tr2Cl1–3). Cluster 1 n = 982 genes, cluster 2 n = 130 genes, and cluster 3 n = 1,012 genes. Lists of genes within each cluster can be found in Data S3.
We next generated a spatiotemporal trajectory for the combined E9.5-E10.5-E11.5 data. Reminiscent of the trajectory of E10.5 cells alone, C-3 otic vesicle cells preceded C-2 neuroblasts, which then transitioned into C-1 neurons at the end of the trajectory (Figure 7C). Additionally, C-4 to C-6 otic vesicle cells (primarily from E11.5; Figure 7D) aligned into two branching trails to the left of the C-3 cells. We hypothesized that this arrangement along the trajectory might reveal spatial gene expression information, and, thus, we projected known marker genes for the otic vesicle anterior/posterior (A/P), dorsal/ventral (D/V), and medial/lateral (M/L) axes. We observed that the terminus of the C-6 trajectory branch contained cells that expressed higher levels of the DM marker Msx1, whereas the terminus of the C-5 trajectory branch contained cells that expressed higher levels of the DL marker Hmx3 (Figure 7E).64 Additionally, cells within C-4, which link C-5 and C-6 to C-3, expressed higher levels of the PVL marker Otx1.64 Finally, cells at the transition point between C-3 otic vesicle cells and C-2 neuroblasts express higher levels of the VM/AVL marker Lfng, which precedes increasing Neurod1 expression (Figure 7E).64 Thus, we conclude that spatial as well as developmental information is represented in the trajectory, as otic vesicle cells are seemingly branching based on vesicle axes.
We next probed for dynamic changes in gene expression along two trails within the combined E9.5-E10.5-E11.5 trajectory; Tr1 (delamination) was defined from the central split point of C-3 otic vesicle cells to the branched endpoint within C-2 neuroblasts, and Tr2 (neurogenesis) spanned the branchpoint in C-2 to the end of the C-3 otic neurons (Figure 7C). This analysis revealed 2,192 and 2,125 dynamically expressed genes along Tr1 and Tr2, respectively (Data S3). Grouping of these genes based on similar patterns of expression along pseudotime resulted in four Tr1 clusters (Tr1Cl1–4) and three Tr2 clusters (Tr2Cl1–3) (Figures 7F and 7G). This more comprehensive analysis revealed a significantly higher number of dynamically expressed genes per trail compared with the analysis of E10.5 cells alone, many of which were found by GOEA to be involved in relevant processes already discussed (see Data S2). We conclude that the integration of different datasets obtained independently with different technologies provides a rich source of gene expression information that can be further used to study the dynamic process of neuroblast delamination.
DISCUSSION
Here we describe a high-sequencing-depth scRNA-seq dataset of the E10.5 otic vesicle, delaminating neuroblasts, and early developing CVG neurons, as well as surrounding tissues. This dataset represents a valuable resource for studying the mechanisms of neuroblast delamination and early neuronal maturation in the developing inner ear. We identified and validated several markers of the E10.5 otic vesicle and defined the cascading changes in gene expression that occur through the delamination of otic neuroblasts and the transition of neuroblasts to early differentiating CVG neurons. Our results suggest that the otic neuroblast stage represents a transitional state of delaminating otic vesicle cells defined by repression of epithelial genes, the onset of expression of neuronal development genes such as Neurod1 and Insm1, as well as subsequent robust proliferation. Additionally, we have identified and highlighted transcriptional regulators along our defined trajectories that may play a role in controlling these varied developmental processes.
Regulators of neuroblast delamination
An interesting finding of our study was the enrichment of the EMT pathway in delaminating neuroblasts, and particularly the high expression of the EMT transcription factors Zeb1 and Zeb2, encoding zinc finger E-box-binding homeobox (ZEB) proteins. Both genes are enriched in clusters O-2 + O-3 compared with O-1 (LFC = −1.44 and −1.58, respectively; see Data S1), Zeb1 is included in Tr1Cl3 as shown in Figure 6B, both are enriched in the combined neuroblast cluster C-2 (LFC = 1.29 and 1.37 for Zeb1 and Zeb2, respectively; see Data S4), and both are included in the E9.5-E11.5 combined trajectory Tr1Cl1 as shown in Figure 7F.55,56 Overexpression of ZEB? transcription factors in cancer cells results in rapid cell proliferation, repression of epithelial genes such as Epcam and Cdh1, and metastasis.9,56,65-67 Concordantly, within our dataset, the upregulation of Zeb1/2 in the E10.5 otic neuroblasts also coincides with Epcam and Cdh1 repression (LFC = 1.76 and 1.07, respectively, in cluster O-1 vs. O-2 + S3), as well as upregulation of mesenchymal markers Cdh2 and Vim (LFC = −0.57 and −0.54, respectively, in cluster O-1 vs. O-2 + O-3).68,69
Zeb1 has been of interest to the inner ear field as the causative gene for the auditory and vestibular phenotypes in the Twirler (Tw) mouse.70,71 Twirler mice possess a non-coding point mutation in the first exon of Zeb1 that interferes with protein binding. In addition to other systemic defects, this mutation results in gene-dose-dependent inner ear malformations, including absence of the lateral semicircular canal, a truncated posterior semicircular canal, and a shortened cochlea in Tw/Tw mice.70 In 2011, Hertzano et al. characterized the expression of Zeb1 in non-epithelial cells of the neonatal mouse cochlea and determined that ZEB1-mediated repression of epithelial genes is responsible for maintaining mesenchymal cell identity in the inner ear.72 Additionally, in the neonatal Tw/Tw cochlea, they observed that mesenchymal cells adopt inner ear epithelial features such as expression of EPCAM and OC90, two markers also of the otic vesicle. However, compared with the Zeb1 point mutation in Twirler mice, which does not result in a loss of ZEB1 function, Zeb1-null mice were noted to have no apparent inner ear defects.72 This was hypothesized to be a result of compensation by Zeb2, which our dataset also reveals is highly expressed along with Zeb1 at least as early as E10.5. Taken together, we argue that further investigation of the Twirler mice, or a conditional Zeb1/2 knockout, may reveal inner ear developmental defects at the stage of otic neuroblast delamination from the otic vesicle.
Comparison with and integration of published datasets
The E10.5 data presented here contribute to a growing body of literature focused on characterizing early otic neurons at a single-cell resolution. Sun and colleagues recently used a lower-depth scRNA-seq method (10X Genomics) to analyze gene expression in the otic vesicle, neuroblasts, and developing CVG neurons at three non-overlapping time points with our dataset: E9.5, E11.5, and E13.519. Generation of these datasets used a Foxg1-Cre;Ai9 model to label all otic-lineage cells and then relied on computational filtering after sequencing rather than FACS to enrich for tdTomato-expressing otic-lineage cells. Using this method, they identified not only otic cells but also similar populations of surrounding “periotic” tissues that we have identified in our dataset, including Insm1+ hindbrain neurons and Trp63+ epidermal cells. The E9.5 time point revealed only a few otic-lineage cells (107 out of 9,458 total cells sequenced), with only 10 of these cells being identified as otic neuroblasts. However, even with those relatively low cell numbers, they were able to identify the neuroblasts based on the expression of early neuronal development genes such as Insm1 and Neurod1.19
Interestingly, Sun et al. did not note high levels of proliferative gene expression in the E9.5 neuroblast population, which may be reflective of either the low number of neuroblasts identified or the early developmental time point.19 However, the E11.5 “undifferentiated CVG” neuronal population described in their study exhibited high expression of proliferative markers, including Top2a and Mki67, although this was not a focus of their analysis. Our data further show that robust proliferation of neuroblasts is detectable at the transcript level as early as E10.5. Additionally, the co-clustering of E10.5 and E11.5 neuroblasts within our integrated analysis, as well as Sun et al.’s observation of undifferentiated CVG neurons that express high levels of Top2a and Mki67 at E13.5, suggest that proliferation and transition of neuroblasts into more mature neurons is an ongoing developmental process.19 Despite being generated by different methods, we have successfully integrated the otic-lineage cells from Sun et al.’s E9.5 and E11.5 time points with our E10.5data. We found that the early neuroblast lineage is well represented in our dataset and closes an important gap in these analyses. Utilizing the existing data that bracket the E10.5 time point not only extended but also validated our interpretation of the spatio-developmental trajectory of the isolated otic-lineage cells.
Conclusion
CVG neurons are essential for relaying information from the hearing and balance organs of the inner ear to the brain. A large body of research to date has been dedicated to classifying inner ear neuronal subtypes and their functions at various ages6,7,48; however, there is still much to learn about how CVG neurons are generated from the otic vesicle stage. The E10.5 dataset presented here provides a valuable resource to the research community. It supplements existing descriptive datasets from non-overlapping time points of the otic vesicle, delaminating neuroblasts, and early developing CVG neurons. The similarities in gene expression of the identified cell types between our dataset and existing datasets further provide independent validation of our observations. Finally, our use of a lower-throughput but higher-sequencing-depth scRNA-seq method further augments existing datasets by encompassing lower-expressed genes that may be of functional significance.
Limitations of the study
A high-depth sequencing approach limits the feasible number of cells that can be profiled by scRNA-seq. Here we have used FACS to enrich for tdTomato+ otic cell types of interest from E10.5 Pax2Cre/+;Ai14tdTomato/+ embryos in an effort to compensate for this constraint. A potential limitation of this approach is therefore the loss of non-Pax2-Cre-derived cells of the otic vesicle and CVG, such as those potentially derived from the neural tube.73,74 Compared with a shallower per-cell sequencing approach using more cells but without FACS enrichment,19 we could identify and analyze a comparable number of otic neuroblasts (Figure S6B). The method used for integration of higher- and lower-sequencing-depth cells presented here restricts the analysis to genes that are annotated in both data groups. Data integration, therefore, is constrained by the data group with the lowest complexity of features. Despite this limitation, and because all datasets used were of high quality, we could bracket our E10.5 data with the existing E9.5 and E11.5 datasets. Trajectory reconstruction of the integrated dataset revealed a limitation where otic vesicle cell groups isolated at more mature states (E11.5) were positioned at branching endpoints of the trajectory, reflecting their spatiotemporally mature features. Additionally, transitions, such as dorsal to ventral otic vesicle position and delamination/migration of proliferative neuroblasts, are not as easily resolvable due to spatial as well as developmental driven expression patterns. This is a logical limitation caused by combining developmental time points from an organ that undergoes complex morphogenetic three-dimensional shape changes, such as the inner ear does.13 We argue, however, that the trajectory reconstructed from a single but well-selected E10.5 time point still provides an unprecedented resolution of the transitional processes that dominate the early stages of otic neuroblast development.
STAR★METHODS
RESOURCE AVAILABILITY
Lead contact
Further information and requests for reagents may be directed to the lead contact, Stefan Heller (hellers@stanford.edu).
Materials availability
The study did not generate new unique reagents.
Data and code availability
The RNA sequencing data generated in this paper are stored in two SingleCellExperiment containers that are provided as Datas S5 and S6.
The data are also available at gEAR, a gene Expression Analysis Resource (https://umgear.org),75 via Permalink https://umgear.org/p?l=774752d9, and at the Gene Expression Omnibus (GEO), via accession number GSE231513.
The combined E9.5, E10.5 and E11.5 dataset is provided as Data S7.
No original code was developed.
Any additional information required to reanalyze the data reported in this work paper is available from the lead contact upon request.
EXPERIMENTAL MODEL AND SUBJECT DETAILS
Pax2-Cre females were bred with Ai14 males and monitored daily for the presence of vaginal plugs. Ten days after confirming a vaginal plug (E0.5), females were euthanized, and E10.5 embryos were isolated. Gestational age was verified using morphological features including overall embryo size, complete otic vesicle closure, and the clear presence of the endolymphatic duct. The otic vesicle and directly adjacent tissues were dissected. Tissues were then dissociated to a single cell suspension by incubating in 0.5 mg/mL thermolysin (Sigma) for 20 min at 37°C, washing once in ice-cold HBSS, and incubating in Accutase (eBioscience) for 30 min at 37°C with three intermittent mechanical trituration steps. Finally, cells were washed twice in ice-cold HBSS and passed through a 35μm strainer (BD Biosciences) to remove cell clumps. In total, 576 cells from 26 embryos and three independent litters were sorted and used in this study (two 96-well plates per litter, plates 1–6). All mouse handling was performed following approved Institutional Animal Care and Use Committee protocols.
METHOD DETAILS
Fluorescence-activated cell sorting
Dissociated cells were stained with Sytox Red (Life Technologies) for dead cell exclusion and sorted with a FACSAria II instrument (BD Biosciences). Cells were loaded at a concentration of 1 million cells/mL. After debris removal, doublets and multiplets were excluded on two consecutive gating steps based on forward and side scatter. Dead cells were identified via Sytox Red uptake and excluded. Cells were sorted at a rate of 200 cells/s using a 100μM nozzle with ‘precision’ mode set to ‘single cell’. Solitary tdTomato+ cells were sorted directly into individual wells of 96-well PCR plates (USA Scientific). Each well contained 5μL of cell lysis buffer (supplied with the Clontech SMARTer Ultra Low Input RNA kit V3) supplemented with ERCC (External RNA Controls Consortium) RNA spike-in Mix (Ambion, Thermo Fisher). 96-well plates were immediately sealed, quickly centrifuged, and stored at −80°C for subsequent RNA processing.
scRNA-seq and data processing
cDNA was generated using the Clontech SMARTer Ultra Low Input RNA kit V3 following manufacturer instructions. Single-cell cDNA size distribution and concentration were assessed using a capillary electrophoresis-based fragment analyzer (Advanced Analytical). Illumina libraries were constructed using the Nextera XT DNA Sample Preparation kit (Illumina) following manufacturer instructions. Libraries were then assessed with the High Sensitivity DNA analysis kit (Agilent Bioanalyzer). Based on quantity and electrophoresis quality measures, we selected 500 cells for sequencing. Single-cell libraries of the 500 cells were pooled and sequenced on an Illumina HiSeq 2500 sequencer using 75 base pair (bp) paired-end reads.
Raw reads were pre-processed using FASTQC, Cutadapt, and PRINSEQ, followed by sequence alignment with the Tuxedo suite (Bowtie, Bowtie2, TopHat) and SAMtools, using default settings (reference genome mm10). Transcript counts were quantified as fragments per kilobase of transcript per million mapped reads (FPKM) generated by TopHat/Cufflinks. Reads for ERCC spike-in mRNA were used as an internal control for successful sequencing and were removed prior to normalization and data analysis. Cells not expressing either of the two housekeeping genes Actb and Gapdh or expressing them at less than three standard deviations below the mean, were scored as unhealthy and removed from the analysis. After applying this filter, 491 cells remained for subsequent analysis (6 cells failed to be sequenced, 3 cells were removed following the above-described criteria, Figure S1). FPKM values for the remaining 491 cells were normalized using SCnorm, and log2 transformed before being processed with CellTrails.21 Cell clusters were identified by the expression of known marker genes. False discovery rate (FDR) values of differentially expressed genes were calculated using the Wilcoxon rank-sum test, with significantly differentially expressed genes being defined as having a log2 fold change expression value >1 between cell groups of interest and FDR <0.05. A dynamic change in gene expression across CellTrails trajectories was defined by an FDR <0.05 among an analyzed list of filtered genes (within the top 5,000 highly variable genes as defined by scran GetTopHVGs and sum of log2 counts >50 in the E10.5 alone dataset or >250 in the combined dataset). Gene ontology and pathway enrichment analyses were performed using ShinyGO76 and Qiagen Ingenuity Pathway Analysis tools (QIAGEN Inc.).54
In situ hybridization probe synthesis
Primer sets for each candidate gene were selected to target a 500–700bp DNA fragment in a single exon of each gene for screen. AT7 RNA polymerase sequence (5′-GGATCCTAATACGACTCACTATAGGGAG-3′) was added to the 5′ end of each reverse primer. Mouse genomic DNA was used as the template for PCR. The PCR product of the correct size was purified with a PCR Purification Kit (Qiagen). Purified DNA was used as the template for RNA probe synthesis with T7 polymerase (Promega) using standard protocols.77 Primer sequences for each probe are provided in Table S1.
In situ hybridization
Digoxygenin-labeled RNA probes were synthesized from cDNA clones and in situ hybridization was performed on whole mount specimens as previously described.78 Mouse embryos were fixed in 4% paraformaldehyde in PBS, pH 7.2 overnight at 4°C or for 2h at room temperature. Embryos were then washed in PBS and hydrated and rehydrated in a series from methanol to phosphate-buffered saline (PBS, pH 7.4) containing 0.1% Tween 20 (PBST). Embryos were treated with 10 mg/ml proteinase K for 10–30 min (depending on the stage of the embryo), washed gently and re-fixed in 4% paraformaldehyde/0.1% glutaraldehyde. After further washing in PBST, the embryos were pre-hybridized at 65°C in 50% formamide containing 1.3xSSC (buffered to pH 4.5 with citric acid), 50 mg/ml yeast tRNA, 100 mg/ml heparin, 0.2% Tween 20, 0.5% CHAPS and 5mM EDTA. After 1h, probe was added to the embryos to a final concentration of 1 mg/mL and incubated overnight. The embryos were washed three times with hybridization buffer for 1h each at 65°C and then washed three times for 1h each at room temperature in MABT buffer (100mM maleic acid pH 7.5, 150 mM NaCl, 0.1% Tween 20). The embryos were then incubated for 1h in MABT containing 20% sheep serum and 2% Sigma Blocking Reagent. Sheep anti-digoxygenin antibody coupled to alkaline phosphatase (Sigma) was added at a concentration of 1:2000 and the embryos incubated overnight. After washing, color development was carried out in alkaline phosphatase buffer (100mM Tris pH 9.5, 50mM MgCl2, 100mM NaCl, 0.1% Tween 20) with NBT (338 mg/ml) and BCIP (175 mg/ml). After color development, stained embryos were re-fixed, washed for 10min in methanol, 30min in 0.1% Tween 20 in PBS, embedded in 7.5% gelatin (300 Bloom) and 15% sucrose in PBS, and sectioned at 14μm. Slides were then dried overnight and mounted in glycerol before being visualized and photographed using an upright microscope.
Cell cycle phase annotation
Cell cycle genes were defined by association with the gene ontology (GO) term GO:0007049 and obtained using the select function of org.Mm.eg.db.79 Phase assignments for the E10.5 otic lineage cells were made using SingleR,80 with the phase annotation from an embryonic stem cell dataset from Buettner et al.81 used as reference and the analysis restricted to the defined cell cycle genes.
Integration with E9.5 and E11.5 10X datasets
AnnData files for the E9.5 and E11.5 datasets were downloaded from the gene Expression Analysis Resource (gEAR, umgear.org) and converted to Seurat objects using SeuratDisk. Otic lineage cells from each time point were then extracted using cluster annotation from Sun et al., 2022; "otic vesicle cells-C12" for the E9.5 dataset, "otic vesicle epithelial cells-C4" and "otic and geniculate ganglion cells-C5" for the E11.5 dataset. The E9.5 and E11.5 datasets were then converted to SingleCellExperiment objects using the Seurat function as.SingleCellExperiment. The datasets were next trimmed to only include genes detected in all three datasets before being renormalized and integrated using the batchelor functions multiBatchNorm and correctExperiments with PARAM = FastMnnParam().63 Principal component analysis (PCA) was performed on the integrated data using the scater runPCA function with dimred = "corrected", which is calculated by batchelor. The PCA results were then manually inserted into the CellTrails latent-Space slot for tSNE calculation, clustering, and trajectory analyses. A cluster of E11.5 geniculate ganglion cells was identified based on expression of Phox2a, Phox2b and Tlx3 and was removed.
QUANTIFICATION AND STATISTICAL ANALYSIS
For single-cell RNA-seq data analysis, we used the following R packages: FASTQC, cutadapt, PRINSEQ, Tuxedo suite, SAMtools, TopHat, Cufflinks, SCnorm, CellTrails, ggplot2, scater, org.Mm.eg.db, SingleR, scran, batchelor, SeuratDisk, Seurat, and SingleCellExperiment. For ranking differential gene expression, we utilized the Mann-Whitney U test, also known as the Wilcoxon rank-sum test in R (wilcox.test). Additional details on statistical analysis are provided in the method details and figure legends.
Supplementary Material
KEY RESOURCES TABLE
| REAGENT or RESOURCE | SOURCE | IDENTIFIER |
|---|---|---|
| Antibodies | ||
| Anti-Digoxigenin-AP | Sigma | Cat#11093274910, RRID:AB2734716 |
| Chemicals, peptides, and recombinant proteins | ||
| Paraformaldehyde | EMS | Cat#15710 |
| DAPI (1:5000) | Thermo Fisher Scientific | Cat#D1306 |
| Accutase | Innovative Cell Technologies, Inc | Cat#AT104 |
| Thermolysin | Sigma | Cat#P1512 |
| SYTOX Red Dead Cell Stain | Thermo Fisher Scientific | Cat#S34859 |
| ERCC RNA Spike-In Mix | Thermo Fisher Scientific | Cat#4456740 |
| Blocking Reagent | Sigma | Cat#11096176001 |
| Digoxigenin-11-UTP | Sigma | Cat#11209256910 |
| BCIP | Sigma | Cat#11383221001 |
| NBT | Sigma | Cat#N6639-1G |
| Deposited data | ||
| scRNA-seq of the E10.5 otic vesicle and surrounding tissues | Orvis et al.75, https://umgEAR.org | https://umgear.org/p?l=774752d9; GEO: GSE231513 |
| Experimental models: Organisms/strains | ||
| Pax2-Cre (Tg(Pax2-cre)1Akg) | Ohyama and Groves20 | IMSR_RBRC09434 |
| Ai14 (B6.Cg-Gt(ROSA)26Sortm14 (CAG-tdTomato)Hze/J) | The Jackson Laboratory | RRID:IMSR_JAX:007914 |
| Oligonucleotides | ||
| Primers for in situ hybridization | Supplementary information | Table S1 |
| Software and algorithms | ||
| R | R Project for Statistical Computing | RRID:SCR_001905 |
| RStudio | https://www.rstudio.com/ | Version 1.4.1717 |
| FASTQC | http://www.bioinformatics.babraham.ac.uk/projects/fastqc/ | RRID:SCR_014583 |
| cutadapt | http://code.google.com/p/cutadapt/ | RRID:SCR_011841 |
| PRINSEQ | http://edwards.sdsu.edu/cgi-bin/prinseq/prinseq.cgi | RRID:SCR_005454 |
| Tuxedo suite | http://sourceforge.net/projects/tuxe/ | RRID:SCR_013194 |
| SAMtools | http://htslib.org/ | RRID:SCR_002105 |
| TopHat | http://ccb.jhu.edu/software/tophat/index.shtml | RRID:SCR_013035 |
| Cufflinks | http://cole-trapnell-lab.github.io/cufflinks/cuffmerge/ | RRID:SCR_014597 |
| SingleCellExperiment | https://bioconductor.org/packages/release/bioc/html/SingleCellExperiment.html | Version 1.14.1 |
| SCnorm | https://bioconductor.org/packages/release/bioc/html/SCnorm.html | Version 1.14.0 |
| CellTrails | https://www.bioconductor.org/packages/devel/bioc/html/CellTrails.html | Version 1.10.1 |
| ggplot2 | https://cran.r-project.org/web/packages/ggplot2/index.html | RRID:SCR_014601 |
| scater | https://bioconductor.org/packages/release/bioc/html/scater.html | RRID:SCR_015954 |
| org.Mm.eg.db | https://bioconductor.org/packages/release/data/annotation/html/org.Mm.eg.db.html | Version 3.13.0 |
| SingleR | https://bioconductor.org/packages/release/bioc/html/SingleR.html | RRID:SCR_023120 |
| scran | https://bioconductor.org/packages/release/bioc/html/scran.html | RRID:SCR_016944 |
| batchelor | https://bioconductor.org/packages/release/bioc/html/batchelor.html | Version 1.8.1 |
| SeuratDisk | https://github.com/mojaveazure/seurat-disk | Version 0.0.0.9020 |
| Seurat | https://cran.r-project.org/web/packages/Seurat/ | RRID:SCR_016341 |
| yEd Graph Editor Software | https://www.yworks.com/ | Version 3.20 |
| Inkscape | https://inkscape.org/ | RRID:SCR_014479 |
| Biorender | https://biorender.com/ | RRID:SCR_018361 |
| Fiji/ImageJ | https://fiji.sc | RRID:SCR_002285 |
| ShinyGO | http://bioinformatics.sdstate.edu/go/ | RRID:SCR_019213 |
| Ingenuity Pathway Analysis (IPA) | http://www.ingenuity.com/products/pathways_analysis.html | RRID:SCR_008653 |
| Other | ||
| SingleCellExperiment container for clusters 1-6. | supplemental information | Data S5 |
| SingleCellExperiment container for otic lineage cells O-1 – O-3. | supplemental information | Data S6 |
| SingleCellExperiment container for combined E9.5, E10.5 and E11.5 otic lineage clusters C-1 – C-6. | supplemental information | Data S7 |
| Raw sequencing data | Gene Expression Omnibus (GEO) | Accession number: GSE231513 |
| AnimalTFDB | http://bioinfo.life.hust.edu.cn/AnimalTFDB | RRID:SCR_001624 |
Highlights.
scRNA-seq of micro-dissected otic vesicles identifies three otic populations at E10.5
Otic neuroblasts express early neuronal, EMT, and proliferation markers
Expression dynamics analysis suggests potential regulators of neuroblast delamination
Integration with published E9.5 and E11.5 data results in a comprehensive resource
ACKNOWLEDGMENTS
We thank members of the Heller and Groves laboratory for helpful discussions during the preparation of this manuscript. The FACS performed for this study was done at the Stanford Shared FACS Facility, and the Stanford Functional Genomics Facility was used for sequencing. Data are deposited online for viewing and analysis through the gEAR (umgear.org, supported by NIH R01 DC019370). Funding was provided by the Stanford School of Medicine OHNS Clinician-Scientist Training Program in Otolaryngology T32 DC015209 (to M.S.M.), the School of Medicine Dean’s Postdoctoral Fellowship (to M.S.M.), the Stanford Initiative to Cure Hearing Loss, and NIH R01 DC017689 (to A.G. and S.H.).
INCLUSION AND DIVERSITY
One or more of the authors of this paper self-identifies as an underrepresented ethnic minority in their field of research or within their geographical location. One or more of the authors of this paper self-identifies as a gender minority in their field of research.
Footnotes
DECLARATION OF INTERESTS
S.H. is a paid consultant of Pipeline Therapeutics.
SUPPLEMENTAL INFORMATION
Supplemental information can be found online at https://doi.org/10.1016/j.celrep.2023.112545.
REFERENCES
- 1.World Health Organization (2021). Deafness and Hearing Loss (World Health Organization; ). http://www.who.int/mediacentre/factsheets/fs300/en/. [Google Scholar]
- 2.Hertzano R, Gwilliam K, Rose K, Milon B, and Matern MS (2021). Cell type–specific expression analysis of the inner ear: a technical report. Laryngoscope 131, S1–S16. 10.1002/lary.28765. [DOI] [PMC free article] [PubMed] [Google Scholar]
- 3.He Z, Ding Y, Mu Y, Xu X, Kong W, Chai R, and Chen X (2021). Stem cell-based therapies in hearing loss. Front. Cell Dev. Biol 9, 2986. 10.3389/FCELL.2021.730042/BIBTEX. [DOI] [PMC free article] [PubMed] [Google Scholar]
- 4.Burns JC, Kelly MC, Hoa M, Morell RJ, and Kelley MW (2015). Single-cell RNA-Seq resolves cellular complexity in sensory organs from the neonatal inner ear. Nat. Commun 6, 8557. 10.1038/ncomms9557. [DOI] [PMC free article] [PubMed] [Google Scholar]
- 5.McInturff S, Burns JC, and Kelley MW (2018). Characterization of spatial and temporal development of Type I and Type II hair cells in the mouse utricle using new cell-type-specific markers. Biol. Open 7, bio038083. 10.1242/bio.038083. [DOI] [PMC free article] [PubMed] [Google Scholar]
- 6.Sun S, Babola T, Pregernig G, So KS, Nguyen M, Su SSM, Palermo AT, Bergles DE, Burns JC, and Müller U (2018). Hair cell mechanotransduction regulates spontaneous activity and spiral ganglion subtype specification in the auditory system. Cell 174, 1247–1263.e15. 10.1016/j.cell.2018.07.008. [DOI] [PMC free article] [PubMed] [Google Scholar]
- 7.Shrestha BR, Chia C, Wu L, Kujawa SG, Liberman MC, and Goodrich LV (2018). Sensory neuron diversity in the inner ear is shaped by activity. Cell 174, 1229–1246.e17. 10.1016/J.CELL.2018.07.007. [DOI] [PMC free article] [PubMed] [Google Scholar]
- 8.Petitpré C, Wu H, Sharma A, Tokarska A, Fontanet P, Wang Y, Helmbacher F, Yackle K, Silberberg G, Hadjab S, and Lallemend F (2018). Neuronal heterogeneity and stereotyped connectivity in the auditory afferent system. Nat. Commun 9, 3691. 10.1038/s41467-018-06033-3. [DOI] [PMC free article] [PubMed] [Google Scholar]
- 9.Kolla L, Kelly MC, Mann ZF, Anaya-Rocha A, Ellis K, Lemons A, Palermo AT, So KS, Mays JC, Orvis J, et al. (2020). Characterization of the development of the mouse cochlear epithelium at the single cell level. Nat. Commun 11, 2389. 10.1038/S41467-020-16113-Y. [DOI] [PMC free article] [PubMed] [Google Scholar]
- 10.Kubota M, Scheibinger M, Jan TA, and Heller S (2021). Greater epithelial ridge cells are the principal organoid-forming progenitors of the mouse cochlea. Cell Rep. 34,108646. 10.1016/J.CEL-REP.2020.108646. [DOI] [PMC free article] [PubMed] [Google Scholar]
- 11.Jan TA, Eltawil Y, Ling AH, Chen L, Ellwanger DC, Heller S, and Cheng AG (2021). Spatiotemporal dynamics of inner ear sensory and non-sensory cells revealed by single-cell transcriptomics. Cell Rep. 36, 109358. 10.1016/J.CELREP.2021.109358. [DOI] [PMC free article] [PubMed] [Google Scholar]
- 12.Hartman BH, Durruthy-Durruthy R, Laske RD, Losorelli S, and Heller S (2015). Identification and characterization of mouse otic sensory lineage genes. Front. Cell. Neurosci 9, 79. 10.3389/FNCEL.2015.00079/ABSTRACT. [DOI] [PMC free article] [PubMed] [Google Scholar]
- 13.Wu DK, and Kelley MW (2012). Molecular mechanisms of inner ear development. Cold Spring Harbor Perspect. Biol 4, a008409. 10.1101/CSHPERSPECT.A008409. [DOI] [PMC free article] [PubMed] [Google Scholar]
- 14.Morsli H, Choo D, Ryan A, Johnson R, and Wu DK (1998). Development of the mouse inner ear and origin of its sensory organs. J. Neurosci 18, 3327–3335. [DOI] [PMC free article] [PubMed] [Google Scholar]
- 15.Carney PR, and Silver J (1983). Studies on cell migration and axon guidance in the developing distal auditory system of the mouse. J. Comp. Neurol 215, 359–369. 10.1002/CNE.902150402. [DOI] [PubMed] [Google Scholar]
- 16.Appler JM, and Goodrich LV (2011). Connecting the ear to the brain: molecular mechanisms of auditory circuit assembly. Prog. Neurobiol 93, 488–508. 10.1016/JPNEUROBIO.2011.01.004. [DOI] [PMC free article] [PubMed] [Google Scholar]
- 17.Bell D, Streit A, Gorospe I, Varela-Nieto I, Alsina B, and Giraldez F (2008). Spatial and temporal segregation of auditory and vestibular neurons in the otic placode. Dev. Biol 322, 109–120. 10.1016/J.YDBIO.2008.07.011. [DOI] [PubMed] [Google Scholar]
- 18.Raft S, Koundakjian EJ, Quinones H, Jayasena CS, Goodrich LV, Johnson JE, Segil N, and Groves AK (2007). Cross-regulation of Ngn1 and Math1 coordinates the production of neurons and sensory hair cells during inner ear development. Development 134, 4405–4415. 10.1242/DEV.009118. [DOI] [PubMed] [Google Scholar]
- 19.Sun Y, Wang L, Zhu T, Wu B, Wang G, Luo Z, Li C, Wei W, and Liu Z (2022). Single-cell transcriptomic landscapes of the otic neuronal lineage at multiple early embryonic ages. Cell Rep. 38. 10.1016/J.CELREP.2022.110542/ATTACHMENT/BC5BFFE2-530C-407E-A776-C9195799D506/MMC6.XLSX. [DOI] [PubMed] [Google Scholar]
- 20.Ohyama T, and Groves AK (2004). Generation of pax2-cre mice by modification of a Pax2 bacterial artificial chromosome. Genesis 38, 195–199. 10.1002/GENE.20017. [DOI] [PubMed] [Google Scholar]
- 21.Ellwanger DC, Scheibinger M, Dumont RA, Barr-gillespie PG, Heller S, Surgery N, and Health O (2018). Transcriptional dynamics of hair-bundle morphogenesis revealed with Celltrace. Cell Rep. 23, 2901–2914.e13. 10.1016/j.celrep.2018.05.002.Transcriptional. [DOI] [PMC free article] [PubMed] [Google Scholar]
- 22.Miguez A, Ducret S, Di Meglio T, Parras C, Hmidan H, Haton C, Sekizar S, Mannioui A, Vidal M, Kerever A, et al. (2012). Opposing roles for Hoxa2 and Hoxb2 in hindbrain oligodendrocyte patterning. J. Neurosci 32, 17172–17185. 10.1523/JNEUROSCI.0885-12.2012. [DOI] [PMC free article] [PubMed] [Google Scholar]
- 23.Davenne M, Maconochie MK, Neun R, Pattyn A, Chambon P, Krumlauf R, and Rijli FM (1999). Hoxa2 and Hoxb2 control dorsoventral patterns of neuronal development in the rostral hindbrain. Neuron 22, 677–691. 10.1016/S0896-6273(00)80728-X. [DOI] [PubMed] [Google Scholar]
- 24.Göbel V, Lipkowitz S, Kozak CA, and Kirsch IR (1992). NSCL-2: a basic domain helix-loop-helix gene expressed in early neurogenesis. Cell growth Differ. Mol. Biol. J. Am. Assoc. Cancer Res 3, 143–148. [PubMed] [Google Scholar]
- 25.Latremoliere A, Cheng L, DeLisle M, Wu C, Chew S, Hutchinson EB, Sheridan A, Alexandre C, Latremoliere F, Sheu SH, et al. (2018). Neuronal-specific TUBB3 is not required for normal neuronal functionbut is essential for timely axon regeneration. Cell Rep. 24, 1865–1879.e9. 10.1016/J.CELREP.2018.07.029. [DOI] [PMC free article] [PubMed] [Google Scholar]
- 26.Gleeson JG, Lin PT, Flanagan LA, and Walsh CA (1999). Double-cortin is a microtubule-associated protein and is expressed widely by migrating neurons. Neuron 23, 257–271. 10.1016/S0896-6273(00)80778-3. [DOI] [PubMed] [Google Scholar]
- 27.Jahan I, Kersigo J, Pan N, and Fritzsch B (2010). Neurod1 regulates survival and formation of connections in mouse ear and brain. Cell Tissue Res. 341, 95–110. 10.1007/S00441-010-0984-6. [DOI] [PMC free article] [PubMed] [Google Scholar]
- 28.Radde-Gallwitz K, Pan L, Gan L, Lin X, Segil N, and Chen P (2004). Expression of Islet1 marks the sensory and neuronal lineages in the mammalian inner ear. J. Comp. Neurol 477, 412–421. 10.1002/CNE.20257. [DOI] [PMC free article] [PubMed] [Google Scholar]
- 29.Filova I, Bohuslavova R, Tavakoli M, Yamoah EN, Fritzsch B, and Pavlinkova G (2022). Early deletion of Neurod1 alters neuronal lineage potential and diminishes neurogenesis in the inner ear. Front. Cell Dev. Biol 10, 845461. 10.3389/FCELL.2022.845461/FULL. [DOI] [PMC free article] [PubMed] [Google Scholar]
- 30.Zheng W, Huang L, Wei Z-B, Silvius D, Tang B, and Xu P-X (2003). The role of Six1 in mammalian auditory system development. Development 130, 3989–4000. [DOI] [PMC free article] [PubMed] [Google Scholar]
- 31.Lorenzen SM, Duggan A, Osipovich AB, Magnuson MA, and García-Añoveros J (2015). Insm1 promotes neurogenic proliferation in delaminated otic progenitors. Mech. Dev 138 Pt 3, 233–245. 10.1016/j.mod.2015.11.001. [DOI] [PMC free article] [PubMed] [Google Scholar]
- 32.Zhang T, Xu J, and Xu PX (2021). Eya2 expression during mouse embryonic development revealed by Eya2lacZ knockin reporter and homozygous mice show mild hearing loss. Dev. Dynam 250, 1450–1462. 10.1002/DVDY.326. [DOI] [PMC free article] [PubMed] [Google Scholar]
- 33.Elliott KL, Pavlínková G, Chizhikov VV, Yamoah EN, and Fritzsch B (2021). Development in the mammalian auditory system depends on transcription factors. Int. J. Mol. Sci 22, 4189. 10.3390/IJMS22084189. [DOI] [PMC free article] [PubMed] [Google Scholar]
- 34.Hébert JM, and McConnell SK (2000). Targeting of cre to the Foxg1 (BF-1) locus mediates loxP recombination in the telencephalon and other developing head structures. Dev. Biol 222, 296–306. 10.1006/DBIO.2000.9732. [DOI] [PubMed] [Google Scholar]
- 35.Pauley S, Lai E, and Fritzsch B (2006). Foxg1 is required for morphogenesis and histogenesis of the mammalian inner ear. Dev. Dynam 235, 2470–2482. 10.1002/DVDY.20839. [DOI] [PMC free article] [PubMed] [Google Scholar]
- 36.Osumi N, Hirota A, Ohuchi H, Nakafuku M, Iimura T, Kuratani S, Fujiwara M, Noji S, and Eto K (1997). Pax-6 is involved in the specification of hindbrain motor neuron subtype. Development 124,2961–2972. 10.1242/dev.124.15.2961. [DOI] [PubMed] [Google Scholar]
- 37.Boudjadi S, Chatterjee B, Sun W, Vemu P, and Barr FG (2018). The expression and function of PAX3 in development and disease. Gene 666, 145–157. 10.1016/J.GENE.2018.04.087. [DOI] [PMC free article] [PubMed] [Google Scholar]
- 38.Durruthy-Durruthy R, Gottlieb A, Hartman BH, Waldhaus J, Laske RD, Altman R, and Heller S (2014). Reconstruction of the mouse otocyst and early neuroblast lineage at single cell resolution. Cell 157, 964–978. 10.1016/J.CELL.2014.03.036. [DOI] [PMC free article] [PubMed] [Google Scholar]
- 39.Huang L, Yang Y, Yang F, Liu S, Zhu Z, Lei Z, and Guo J (2018). Functions of EpCAM in physiological processes and diseases. Int. J. Mol. Med 42, 1771–1785. 10.3892/IJMM.2018.3764/HTML. [DOI] [PMC free article] [PubMed] [Google Scholar]
- 40.Chung B-M, Murray CI, Van Eyk JE, and Coulombe PA (2012). Identification of novel interaction between annexin A2 and keratin 17 evidence for reciprocal regulation. J. Biol. Chem 287, 7573–7581. 10.1074/jbc.M111.301549. [DOI] [PMC free article] [PubMed] [Google Scholar]
- 41.Munz B, Gerke V, Gillitzer R, and Werner S (1997). Differential expression of the calpactin I subunits annexin II and p11 in cultured keratinocytes and during wound repair. J. Invest. Dermatol 108, 307–312. 10.1111/1523-1747.EP12286470. [DOI] [PubMed] [Google Scholar]
- 42.Bazzi H, Fantauzzo KA, Richardson GD, Jahoda CAB, and Christiano AM (2007). Transcriptional profiling of developing mouse epidermis reveals novel patterns of coordinated gene expression. Dev. Dynam 236, 961–970. 10.1002/DVDY.21099. [DOI] [PubMed] [Google Scholar]
- 43.Soares E, and Zhou H (2018). Master regulatory role of p63 in epidermal development and disease. Cell. Mol. Life Sci 75, 1179–1190. 10.1007/s00018-017-2701-z. [DOI] [PMC free article] [PubMed] [Google Scholar]
- 44.Kaiser M, Wojahn I, Rudat C, Lüdtke TH, Christoffels VM, Moon A, Kispert A, and Trowe MO (2021). Regulation of otocyst patterning by Tbx2 and Tbx3 is required for inner ear morphogenesis in the mouse. Development 148, dev195651. 10.1242/DEV.195651. [DOI] [PubMed] [Google Scholar]
- 45.Rohacek AM, Bebee TW, Tilton RK, Radens CM, McDermott-Roe C, Peart N, Kaur M, Zaykaner M, Cieply B, Musunuru K, et al. (2017). ESRP1 mutations cause hearing loss due to defects in alternative splicing that disrupt cochlear development. Dev. Cell 43, 318–331.e5. 10.1016/j.devcel.2017.09.026. [DOI] [PMC free article] [PubMed] [Google Scholar]
- 46.Revil T, and Jerome-Majewska LA (2013). During embryogenesis, Esrp1 expression is restricted to a subset of epithelial cells and is associated with splicing of a number of developmentally important genes. Dev. Dynam 242, 281–290. 10.1002/DVDY.23918. [DOI] [PubMed] [Google Scholar]
- 47.Kameyama T, Matsushita F, Kadokawa Y, and Marunouchi T (2011). Myth/NZF family transcription factors regulate neuronal differentiation of P19 cells. Neurosci. Lett 497, 74–79. 10.1016/j.neulet.2011.04.033. [DOI] [PubMed] [Google Scholar]
- 48.Sherrill HE, Jean P, Driver EC, Sanders TR, Fitzgerald TS, Moser T, and Kelley MW (2019). Pou4f1 defines a subgroup of type I spiral ganglion neurons and is necessary for normal inner hair cell presynaptic Ca 2+ signaling. J. Neurosci 39, 5284–5298. 10.1523/JNEUROSCI.2728-18.2019. [DOI] [PMC free article] [PubMed] [Google Scholar]
- 49.Sajan SA, Rubenstein JLR, Warchol ME, and Lovett M (2011). Identification of direct downstream targets of Dlx5 during early inner ear development. Hum. Mol. Genet 20, 1262–1273. 10.1093/HMG/DDQ567. [DOI] [PMC free article] [PubMed] [Google Scholar]
- 50.Yang CY, Ramamoorthy S, Boller S, Rosenbaum M, Rodriguez Gil A, Mittler G, Imai Y, Kuba K, and Grosschedl R (2016). Interaction of CCR4-NOT with EBF1 regulates gene-specific transcription and mRNA stability in B lymphopoiesis. Genes Dev. 30, 2310–2324. 10.1101/GAD.285452.116. [DOI] [PMC free article] [PubMed] [Google Scholar]
- 51.Nakano Y, Kelly MC, Rehman AU, Boger ET, Morell RJ, Kelley MW, Friedman TB, and Bánfi B (2018). Defects in the alternative splicing-dependent regulation of REST cause deafness. Cell 174, 536–548.e21. 10.1016/J.CELL.2018.06.004. [DOI] [PMC free article] [PubMed] [Google Scholar]
- 52.Gnedeva K, Jacobo A, Salvi JD, Petelski AA, and Hudspeth AJ (2017). Elastic force restricts growth of the murine utricle. Elife 6, e25681. 10.7554/ELIFE.25681. [DOI] [PMC free article] [PubMed] [Google Scholar]
- 53.Gnedeva K, Wang X, McGovern MM, Barton M, Tao L, Trecek T, Monroe TO, Llamas J, Makmura W, Martin JF, et al. (2020). Organ of Corti size is governed by yap/tead-mediated progenitor self-renewal. Proc. Natl. Acad. Sci. USA 117, 13552–13561. 10.1073/PNAS.2000175117/SUPPL_FILE/PNAS.2000175117.SD02.XLSX. [DOI] [PMC free article] [PubMed] [Google Scholar]
- 54.Krämer A, Green J, Pollard J, and Tugendreich S (2014). Causal analysis approaches in ingenuity pathway analysis. Bioinformatics 30, 523–530. 10.1093/BIOINFORMATICS/BTT703. [DOI] [PMC free article] [PubMed] [Google Scholar]
- 55.Zhang P, Sun Y, and Ma L (2015). ZEB1: at the crossroads of epithelial-mesenchymal transition, metastasis and therapy resistance. Cell Cycle 14, 481–487. 10.1080/15384101.2015.1006048. [DOI] [PMC free article] [PubMed] [Google Scholar]
- 56.Chu PY, Hu FW, Yu CC, Tsai LL, Yu CH, Wu BC, Chen YW, Huang PI, and Lo WL (2013). Epithelial-mesenchymal transition transcription factor ZEB1/ZEB2 co-expression predicts poor prognosis and maintains tumor-initiating properties in head and neck cancer. Oral Oncol. 49, 34–41. 10.1016/J.ORALONCOLOGY.2012.07.012. [DOI] [PubMed] [Google Scholar]
- 57.Togashi H, Sakisaka T, and Takai Y (2009). Cell adhesion molecules in the central nervous system. Cell Adh. Migr 3, 29–35. 10.4161/CAM.3.1.6773. [DOI] [PMC free article] [PubMed] [Google Scholar]
- 58.Sainio MT, Rasila T, Molchanova SM, Järvilehto J, Torregrosa-Muñumer R, Harjuhaahto S, Pennonen J, Huber N, Herukka SK, Haapasalo A, et al. (2022). Neurofilament light regulates axon caliber, synaptic activity, and organelle trafficking in cultured human motor neurons. Front. Cell Dev. Biol 9, 3938. 10.3389/FCELL.2021.820105/BIBTEX. [DOI] [PMC free article] [PubMed] [Google Scholar]
- 59.Chung D, Shum A, and Caraveo G (2020). GAP-43 and BASP1 in axon regeneration: implications for the treatment of neurodegenerative diseases. Front. Cell Dev. Biol 8, 890. 10.3389/FCELL.2020.567537/BIBTEX. [DOI] [PMC free article] [PubMed] [Google Scholar]
- 60.Whitfield ML, George LK, Grant GD, and Perou CM (2006). Common markers of proliferation. Nat. Rev. Cancer 6, 99–106. 10.1038/nrc1802. [DOI] [PubMed] [Google Scholar]
- 61.Durruthy-Durruthy R, Gottlieb A, and Heller S (2015). 3D computational reconstruction of tissues with hollow spherical morphologies using single-cell gene expression data. Nat. Protoc 10, 459–474. 10.1038/nprot.2015.022. [DOI] [PMC free article] [PubMed] [Google Scholar]
- 62.Cecconi F, Roth KA, Dolgov O, Munarriz E, Anokhin K, Gruss P, and Salminen M (2004). Apaf1-dependent programmed cell death is required for inner ear morphogenesis and growth. Development 131, 2125–2135. 10.1242/DEV.01082. [DOI] [PubMed] [Google Scholar]
- 63.Haghverdi L, Lun ATL, Morgan MD, and Marioni JC (2018). Batch effects in single-cell RNA sequencing data are corrected by matching mutual nearest neighbours. Nat. Biotechnol 36, 421–427. 10.1038/NBT.4091. [DOI] [PMC free article] [PubMed] [Google Scholar]
- 64.Fekete DM, and Wu DK (2002). Revisiting cell fate specification in the inner ear. Curr. Opin. Neurobiol 12, 35–42. 10.1016/S0959-4388(02)00287-8. [DOI] [PubMed] [Google Scholar]
- 65.Soleymani L, Zarrabi A, Hashemi F, Hashemi F, Zabolian A, Banihashemi SM, Moghadam SS, Hushmandi K, Samarghandian S, Ashrafizadeh M, and Khan H (2021). Role of ZEB family members in proliferation, metastasis, and chemoresistance of prostate cancer cells: revealing signaling networks. Curr. Cancer Drug Targets 21, 749–767. 10.2174/1568009621666210601114631. [DOI] [PubMed] [Google Scholar]
- 66.Gemmill RM, Roche J, Potiron VA, Nasarre P, Mitas M, Coldren CD, Helfrich BA, Garrett-Mayer E, Bunn PA, and Drabkin HA (2011). ZEB1-Responsive genes in non-small cell lung cancer. Cancer Lett. 300, 66–78. 10.1016/J.CANLET.2010.09.007. [DOI] [PMC free article] [PubMed] [Google Scholar]
- 67.Korpal M, Lee ES, Hu G, and Kang Y (2008). The miR-200 family inhibits epithelial-mesenchymal transition and cancer cell migration by direct targeting of E-cadherin transcriptional repressors ZEB1 and ZEB2. J. Biol. Chem 283, 14910–14914. 10.1074/JBC.C800074200. [DOI] [PMC free article] [PubMed] [Google Scholar]
- 68.Serrano-Gomez SJ, Maziveyi M, and Alahari SK (2016). Regulation of epithelial-mesenchymal transition through epigenetic and post-translational modifications. Mol. Cancer 15, 18. 10.1186/s12943-016-0502-x. [DOI] [PMC free article] [PubMed] [Google Scholar]
- 69.Loh CY, Chai JY, Tang TF, Wong WF, Sethi G, Shanmugam MK, Chong PP, and Looi CY (2019). The E-cadherin and N-cadherin switch in epithelial-to-mesenchymal transition: signaling, therapeutic implications, and challenges. Cells 8. 10.3390/CELLS8101118. [DOI] [PMC free article] [PubMed] [Google Scholar]
- 70.Kurima K, Hertzano R, Gavrilova O, Monahan K, Shpargel KB, Nadaraja G, Kawashima Y, Lee KY, Ito T, Higashi Y, et al. (2011). A noncoding point mutation of Zeb1 causes multiple developmental malformations and obesity in twirler mice. PLoS Genet. 7, 1002307. 10.1371/journal.pgen.1002307. [DOI] [PMC free article] [PubMed] [Google Scholar]
- 71.Lyon MF (1958). Twirler: a mutant affecting the inner ear of the house mouse. Development 6, 105–116. 10.1242/DEV.6.1.105. [DOI] [PubMed] [Google Scholar]
- 72.Hertzano R, Elkon R, Kurima K, Morrisson A, Chan SL, Sallin M, Biedlingmaier A, Darling DS, Griffith AJ, Eisenman DJ, and Strome SE (2011). Cell type – specific transcriptome analysis reveals a major role for Zeb1 and miR-200b in mouse inner ear morphogenesis. PLoS Genet. 7, e1002309. 10.1371/journal.pgen.1002309. [DOI] [PMC free article] [PubMed] [Google Scholar]
- 73.Freyer L, Aggarwal V, and Morrow BE (2011). Dual embryonic origin of the mammalian otic vesicle forming the inner ear. Development 138, 5403–5414. 10.1242/dev.069849. [DOI] [PMC free article] [PubMed] [Google Scholar]
- 74.Sandell LL, Butler Tjaden NE, Barlow AJ, and Trainor PA (2014). Cochleovestibular nerve development is integrated with migratory neural crest cells. Dev. Biol 385, 200–210. 10.1016/J.YDBIO.2013.11.009. [DOI] [PMC free article] [PubMed] [Google Scholar]
- 75.Orvis J, Gottfried B, Kancherla J, Adkins RS, Song Y, Dror AA, Olley D, Rose K, Chrysostomou E, Kelly MC, et al. (2020). gEAR: gene Expression Analysis Resource portal for community-driven, multi-omic data exploration. Preprint at bioRxiv. 10.1101/2020.08.28.272039. [DOI] [PMC free article] [PubMed] [Google Scholar]
- 76.Ge SX, Yao R, Jung D, and Yao R (2020). ShinyGO: a graphical geneset enrichment tool for animals and plants. Bioinformatics 36, 2628–2629. 10.1093/BIOINFORMATICS/BTZ931. [DOI] [PMC free article] [PubMed] [Google Scholar]
- 77.Stern CD (1998). Detection of multiple gene products simultaneously by in situ hybridization and immunohistochemistry in whole mounts of avian embryos. Curr. Top. Dev. Biol 36, 223–243. 10.1016/S0070-2153(08)60505-0. [DOI] [PubMed] [Google Scholar]
- 78.Khatri SB, Edlund RK, and Groves AK (2014). Foxi3 is necessary for the induction of the chick otic placode in response to FGF signaling. Dev. Biol 391, 158–169. 10.1016/J.YDBIO.2014.04.014. [DOI] [PMC free article] [PubMed] [Google Scholar]
- 79.Carlson M. (2021). org.Mm.eg.db: Genome Wide Annotation for Mouse (R package), version 3.13.0. 10.18129/B9.bioc.org.Mm.eg.db. [DOI] [Google Scholar]
- 80.Aran D, Looney AP, Liu L, Wu E, Fong V, Hsu A, Chak S, Naikawadi RP, Wolters PJ, Abate AR, et al. (2019). Reference-based analysis of lung single-cell sequencing reveals a transitional profibrotic macrophage. Nat. Immunol 20, 163–172. 10.1038/s41590-018-0276-y. [DOI] [PMC free article] [PubMed] [Google Scholar]
- 81.Buettner F, Natarajan KN, Casale FP, Proserpio V, Scialdone A, Theis FJ, Teichmann SA, Marioni JC, and Stegle O (2015). Computational analysis of cell-to-cell heterogeneity in single-cell RNA-sequencing data reveals hidden subpopulations of cells. Nat. Biotechnol 33, 155–160. 10.1038/nbt.3102. [DOI] [PubMed] [Google Scholar]
Associated Data
This section collects any data citations, data availability statements, or supplementary materials included in this article.
Supplementary Materials
Data Availability Statement
The RNA sequencing data generated in this paper are stored in two SingleCellExperiment containers that are provided as Datas S5 and S6.
The data are also available at gEAR, a gene Expression Analysis Resource (https://umgear.org),75 via Permalink https://umgear.org/p?l=774752d9, and at the Gene Expression Omnibus (GEO), via accession number GSE231513.
The combined E9.5, E10.5 and E11.5 dataset is provided as Data S7.
No original code was developed.
Any additional information required to reanalyze the data reported in this work paper is available from the lead contact upon request.