

SUMMARY
Despite its pivotal roles in biology, how the transcriptional activity of c-MYC is tuned quantitatively remains poorly defined. Here, we show that heat shock factor 1 (HSF1), the master transcriptional regulator of the heat shock response, acts as a prime modifier of the c-MYC-mediated transcription. HSF1 deficiency diminishes c-MYC DNA binding and dampens its transcriptional activity genome wide. Mechanistically, c-MYC, MAX, and HSF1 assemble into a transcription factor complex on genomic DNAs, and surprisingly, the DNA binding of HSF1 is dispensable. Instead, HSF1 physically recruits the histone acetyltransferase general control non-derepressible 5 (GCN5), promoting histone acetylation and augmenting c-MYC transcriptional activity. Thus, we find that HSF1 specifically potentiates the c-MYC-mediated transcription, discrete from its canonical role in countering proteotoxic stress. Importantly, this mechanism of action engenders two distinct c-MYC activation states, primary and advanced, which may be important to accommodate diverse physiological and pathological conditions.
Graphical Abstract
In brief
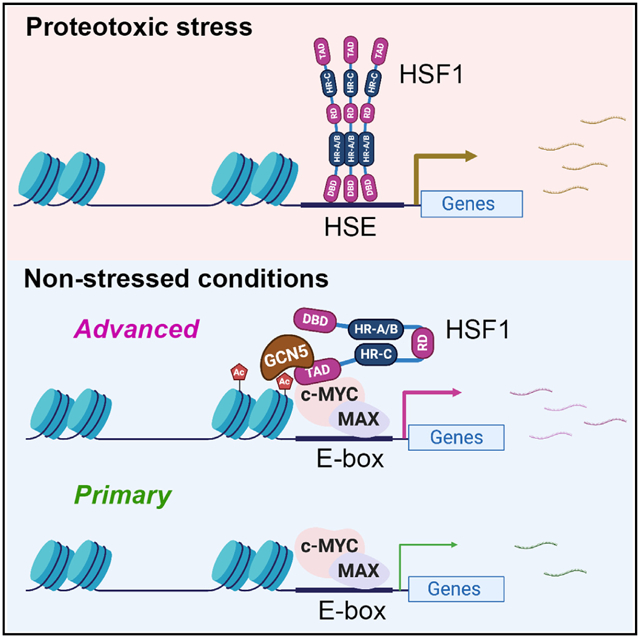
Xu et al. find that, under non-stressed conditions, HSF1, c-MYC, and MAX constitute a transcription factor complex, in sharp contrast with the assembly of HSF1 homotrimers during the heat shock response. HSF1 exerts a non-canonical transcriptional action in the absence of proteotoxic stress, amplifying c-MYC-mediated transcription genome wide.
INTRODUCTION
The MYC proto-oncogene family encodes a class of basic-helix-loop-helix-leucine zipper (bHLH/ZIP) transcription factors consisting of C-, L-, and N-MYC, which govern a wide variety of cellular functions.1,2 The most prominent member of this family is c-MYC. Dysregulation of c-MYC, occurring in over 70% of all human cancers, is associated with poor patient outcomes.3,4 Moreover, c-MYC is a key player in pluripotency reprogramming.5 Following heterodimerization with MYC-associated factor X (MAX), c-MYC binds to the E-box (5ˊ-CACGTG-3ˊ) element or its variants and regulates the transcription of up to 15% of all human genes.1–4,6 To achieve effective DNA binding and transcription, cofactors are recruited to remodel the chromatin architecture, among which is the STAGA (SPT3-TAF(II)31-GCN5L acetylase) complex.7,8 Within this complex, GCN5/KAT2A is a histone acetyltransferase modifying histone H3 at lysine 9 (H3K9), lysine 14 (H3K14), and other lysine residues.9,10 Histone acetylation facilitates the rearrangement of chromatins from a condensed state to a transcriptionally accessible state, permitting transcription factors to access DNA.11
Heat shock factor 1 (HSF1) is the master regulator of the heat shock, or proteotoxic stress, response (HSR/PSR), an ancient cytoprotective transcriptional program helping cells adapt to a diversity of environmental and pathological challenges.12–14 On proteotoxic stress, monomeric HSF1 is unleashed from the repressive state. Following trimerization, nuclear translocation, posttranslational modifications, and recognition of the heat shock element (HSE), which is canonically composed of 5ˊ-GAANNTTC-3ˊ nucleotide sequence motif,12–14 HSF1 prompts the release of promoter-proximal paused RNA polymerase II15,16 and induces the transcription of genes involved in protein folding and degradation, particularly molecular chaperones or heat shock proteins (HSPs). Contrasting with its acclaimed role in maintaining proteomic stability and promoting survival under stress, HSF1 enables malignancy.17,18 The pro-oncogenic mechanisms of HSF1 appear to be multifaceted, including suppressing proteomic instability, impeding senescence and apoptosis, reprogramming metabolism, and even promoting immune evasion.19–24 Whereas deletion of c-Myc in mouse embryos caused severe developmental defects in various organs,25 Hsf1 appears dispensable for embryonic development and cell viability without proteotoxic stress.26 However, in contrast with their non-transformed counterparts, cancerous cells rely on HSF1 for their growth and survival, rendering it essential to malignancy.18 Despite their importance to oncogenesis, whether there is an interplay between the oncogenic driver c-MYC and the oncogenic enabler HSF1 remains ambiguous.
We herein report that HSF1 specifically potentiates the c-MYC-mediated transcriptional program. Mechanistically, HSF1, c-MYC/MAX dimers, and GCN5 constitute a transcription factor complex, the assembly of which is fostered by c-MYC DNA binding. Through physical interactions with both partners, HSF1 recruits GCN5 to c-MYC, heightening histone H3 acetylation, promoting c-MYC/MAX DNA binding, and, ultimately, augmenting transcriptional activity. Thus, we report a mode of regulation through which HSF1 dictates the transcriptional capacity of c-MYC.
RESULTS
HSF1 is required for robust c-MYC transcriptional activity
Both c-MYC and HSF1 are located on human chromosome 8q24.21–24.3, a common amplicon in human cancers.27,28 According to The Cancer Genome Atlas (TCGA) PanCancer studies, amplification of c-MYC and HSF1 occurs at 8% and 6% of patients, respectively. Among those patients with c-MYC amplification, approximately 59% display HSF1 co-duplication (co-occurrence, p < 0.001, Fisher’s exact test) (Figure 1A). Moreover, in human cancers, the mRNA levels of both genes are positively correlated (Figure 1B). Hence we reasoned that the co-amplification and co-expression of c-MYC and HSF1 might be attributed to their functional interplays, which would be selected for oncogenesis.
Figure 1. HSF1 is required for robust c-MYC transcriptional activity.
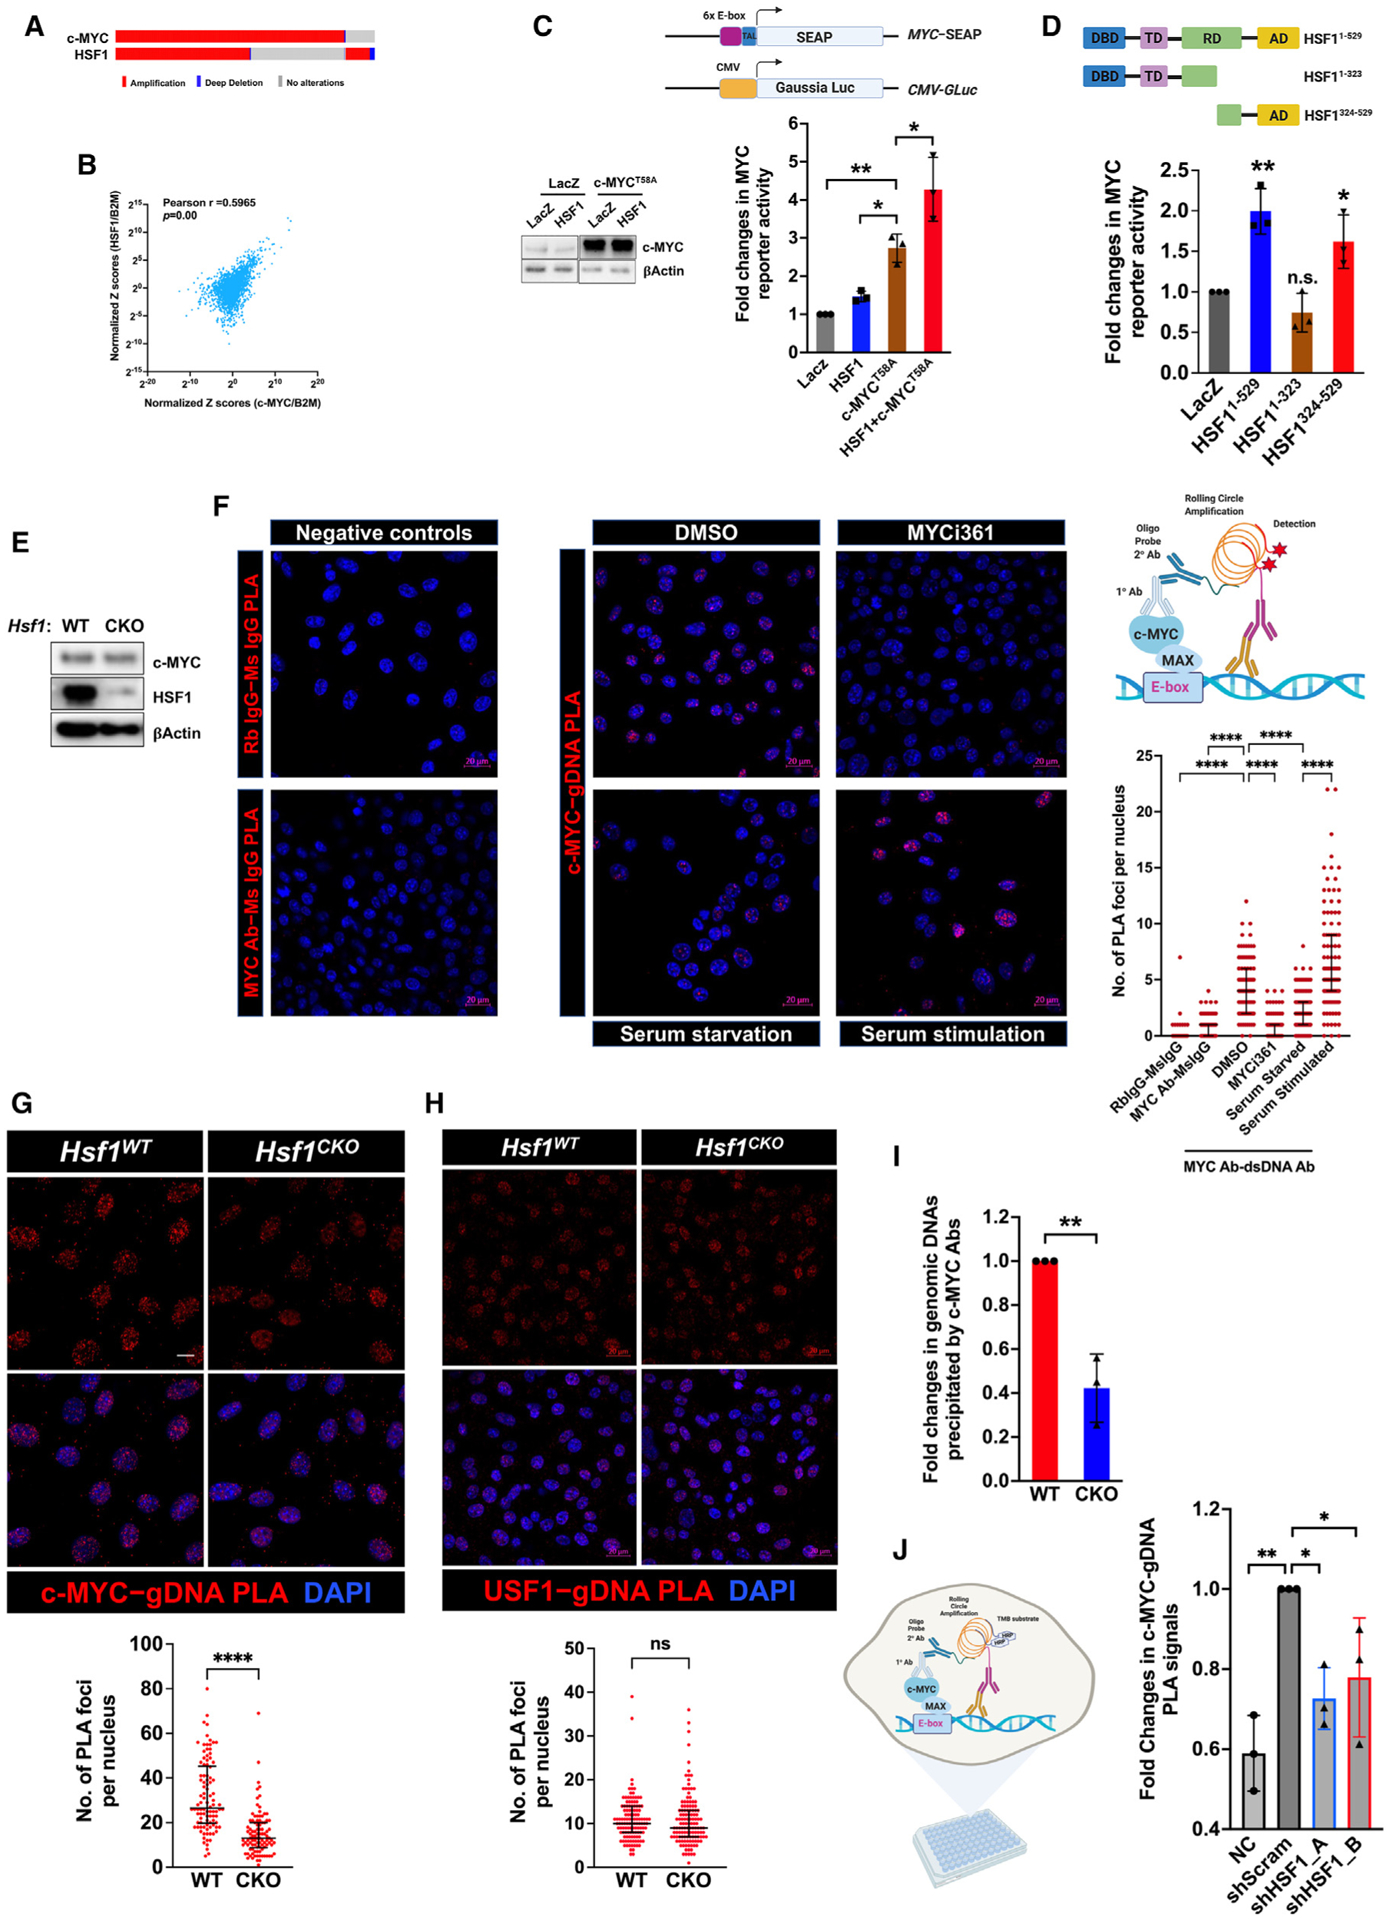
(A) Co-amplification of c-MYC and HSF1 in human cancers. Data are generated by the TGCA Research Network (https://www.cancer.gov/tcga).
(B) Positive correlation between c-MYC and HSF1 mRNA levels in human cancers. Analyses were performed using the GEPIA2 web server.29
(C) The dual MYC reporter system, comprising an E-box element-driven SEAP plasmid and a CMV-driven Gaussia luciferase (GLuc) plasmid, were co-transfected with indicated plasmids into HEK293T cells for 48 h (mean ± SD, n = 3 independent experiments, one-way ANOVA).
(D) Endogenous c-MYC activities were measured by the dual-reporter system in HEK293T cells co-transfected with indicated plasmids (mean ± SD, n = 3 independent experiments, one-way ANOVA).
(E) Hsf1 was deleted in immortalized Rosa26-CreERT2; Hsf1fl/fl MEFs treated with and without 4-OHT for 7 days.
(F) Left panel: normal IgG negative controls for PLA. Middle panel: visualization of endogenous c-MYC binding to genomic DNAs by PLA (red) in Hsf1WT MEFs either treated with 20 μM MYCi361 for 24 h or starved for 12 h and stimulated with 20% serum for 24 h. Scale bars: 20 μm. Right upper panel: schematic depiction of c-MYC-gDNA PLA technique. Right lower panel: quantitation of c-MYC-gDNA binding by counting the numbers of PLA foci per nucleus (median ± interquartile range [IQR], n = 63 [Rb IgG–Ms IgG] or >100 nuclei, one-way ANOVA).
(G) Visualization of endogenous c-MYC binding to genomic DNAs by PLA (red) in both Hsf1WT and Hsf1CKO MEFs (median ± IQR, n = 98 nuclei, Mann-Whitney test). Scale bar: 10 μm.
(H) Visualization of endogenous USF1 binding to genomic DNAs by PLA (red) in MEFs (median ± IQR, n = 122 or 127 nuclei, Mann-Whitney test). Scale bars: 20 μm.
(I) Quantitation of c-MYC-bound genomic DNA fragments following ChIP in MEFs (mean ± SD, n = 3 independent experiments, two-tailed Student’s t test).
(J) In-cell PLA ELISA quantitation of endogenous c-MYC DNA binding in HeLa cells following HSF1 knockdown for 72 h (mean ± SD, n = 3 independent experiments, one-way ANOVA). Of note, HSF1 knockdown caused evident cytotoxicity in HeLa cells, leading to strong autofluorescence that interferes with the fluorescence-based PLA.
B2M, β-2-microglobulin; Ms, mouse; NC, negative control (normal mouse IgG + rabbit anti-c-MYC Abs); Rb, rabbit. *p < 0.05, **p < 0.01; ****p < 0.0001; n.s.: not significant. See also Figure S1.
First, we explored whether HSF1 impacts c-MYC transcriptional activity using a dual-reporter assay, where the expression of secreted alkaline phosphatase (SEAP) is controlled by binding of c-MYC/MAX to the E-box elements fused to the minimal TATA-like promoter. A second reporter, constitutively expressed and highly secreted Gaussia luciferase, served as the normalization control. Transient overexpression of c-MYCT58A, a degradation mutant,30 activated the reporter, which was enhanced by co-expression of HSF1 (Figure 1C). HSF1 neither elevated the levels of c-MYC proteins nor promoted the secretion of SEAP (Figures 1C and S1A), pinpointing a specific effect on c-MYC transcriptional activation. Next, we asked whether this c-MYC activation requires the HSF1-dependent transcription. To address this, we utilized two mutants, HSF11–323 lacking the C-terminal transactivation domain (AD) and HSF1324–529 lacking the N-terminal DNA-binding domain (DBD). Both mutants are deficient for transcriptional activity.23 HSF1324–529, but not HSF11–323, was sufficient to activate the c-MYC reporter (Figure 1D), strongly suggesting a transcription-independent mechanism.
To determine the necessity of HSF1, we examined the expression of c-MYC target genes in immortalized mouse embryonic fibroblasts (MEFs) following transient Hsf1 knockdown (KD). Hsf1 KD diminished the transcripts of these target genes (Figure S1B). This was also true in human cervical cancer HeLa cells (Figure S1C), indicating the generality of this regulation. HSP90AA1/HSP90α, a transcriptional target of HSF1, was previously reported to stabilize c-MYC proteins.31 However, HSP90 overexpression failed to rescue the impaired expression of c-MYC target genes in Hsf1-deficient MEFs, despite increased c-MYC proteins (Figures S1D and S1E), arguing against a direct activation of c-MYC by HSP90. Together, these results illustrate that HSF1 impacts the c-MYC-mediated transcription in both non-transformed and malignant cells. Notably, HSF1 regulates c-MYC independently of its intrinsic transcriptional action.
HSF1 promotes c-MYC binding to genomic DNAs
Unexpectedly, HSF1 affected the DNA-binding capability of c-MYC. This was detected by proximity ligation assay (PLA), a technique previously adapted to visualize interactions between transcription factors and genomic DNAs (gDNAs) in situ.32 The specificities of anti-c-MYC and anti-dsDNA antibodies were both validated (Figures S1F and S1G). First, we confirmed that PLA could faithfully detect the DNA binding of c-MYC. In Hsf1 wild-type (WT; Hsf1WT) MEFs, binding of c-MYC to dsDNA was readily visualized by PLA (Figures 1E and 1F); by contrast, PLA did not detect evident dsRNA binding of c-MYC (Figure S1H). Unsurprisingly, these DNA-binding signals were markedly reduced on treatment with MYCi361, a compound blocking MYC-MAX dimerization33; conversely, serum stimulation, a condition known to activate c-MYC,34 heightened these signals (Figure 1F). Interestingly, compared with Hsf1WT cells, the c-MYC-gDNA interaction was diminished in Hsf1 conditional knockout (Hsf1CKO) MEFs (Figure 1G), wherein Hsf1 deletion was induced by 4-hydroxytamoxifen (4-OHT).35 By contrast, Hsf1 deficiency did not affect the DNA binding of USF1 (Figure 1H), another member of the c-Myc gene family.36 Moreover, this defect in c-MYC DNA binding was confirmed by conventional chromatin immunoprecipitation (ChIP). When using equal amounts of chromatins, c-MYC antibodies precipitated less gDNAs from Hsf1CKO MEFs (Figure 1I). Similarly, in HeLa cells, HSF1 KD impaired c-MYC DNA binding as well (Figure 1J).
To comprehend how broad this impact on DNA binding was, we employed the CUT&RUN sequencing (CUT&RUN-seq) technique,37 an alternative to ChIP sequencing (ChIP-seq), to profile genome-wide c-MYC DNA binding in these MEFs. Again, when using equal numbers of cells, less amounts of nuclease-digested DNA fragments were released from Hsf1CKO MEFs (Figure 2A). To account for this global change, we spiked these released DNA fragments with equal amounts of E. coli DNAs as the normalization control. This spike-in normalization revealed a genome-wide reduction in c-MYC DNA binding in Hsf1CKO MEFs (Figure 2B). Owing to the extremely low background signals, CUT&RUN-seq identified more than 200,000 binding sites in Hsf1WT cells; nonetheless, nearly 91% of these binding sites were located at either intergenic, intronic, or exonic regions (Figure 2C; Table S1). c-MYC has been known to bind to intergenic regions.38 By contrast, approximately 70% of all binding sites in Hsf1CKO MEFs were associated with promoters, despite considerably diminished total binding sites (Figure 2C; Table S1). This finding indicates that Hsf1 deficiency mostly abolished the c-MYC binding to non-promoter regions. Apart from this differential genomic distribution, binding sites in Hsf1WT cells, especially those associated with promoters, displayed higher signals, a measure of c-MYC binding affinity (Figure 2D). Within the same cell types, binding sites located in promoters displayed the highest signals; by contrast, those located at intergenic and intronic regions showed the lowest (Figure S2A).
Figure 2. HSF1 promotes c-MYC DNA binding.
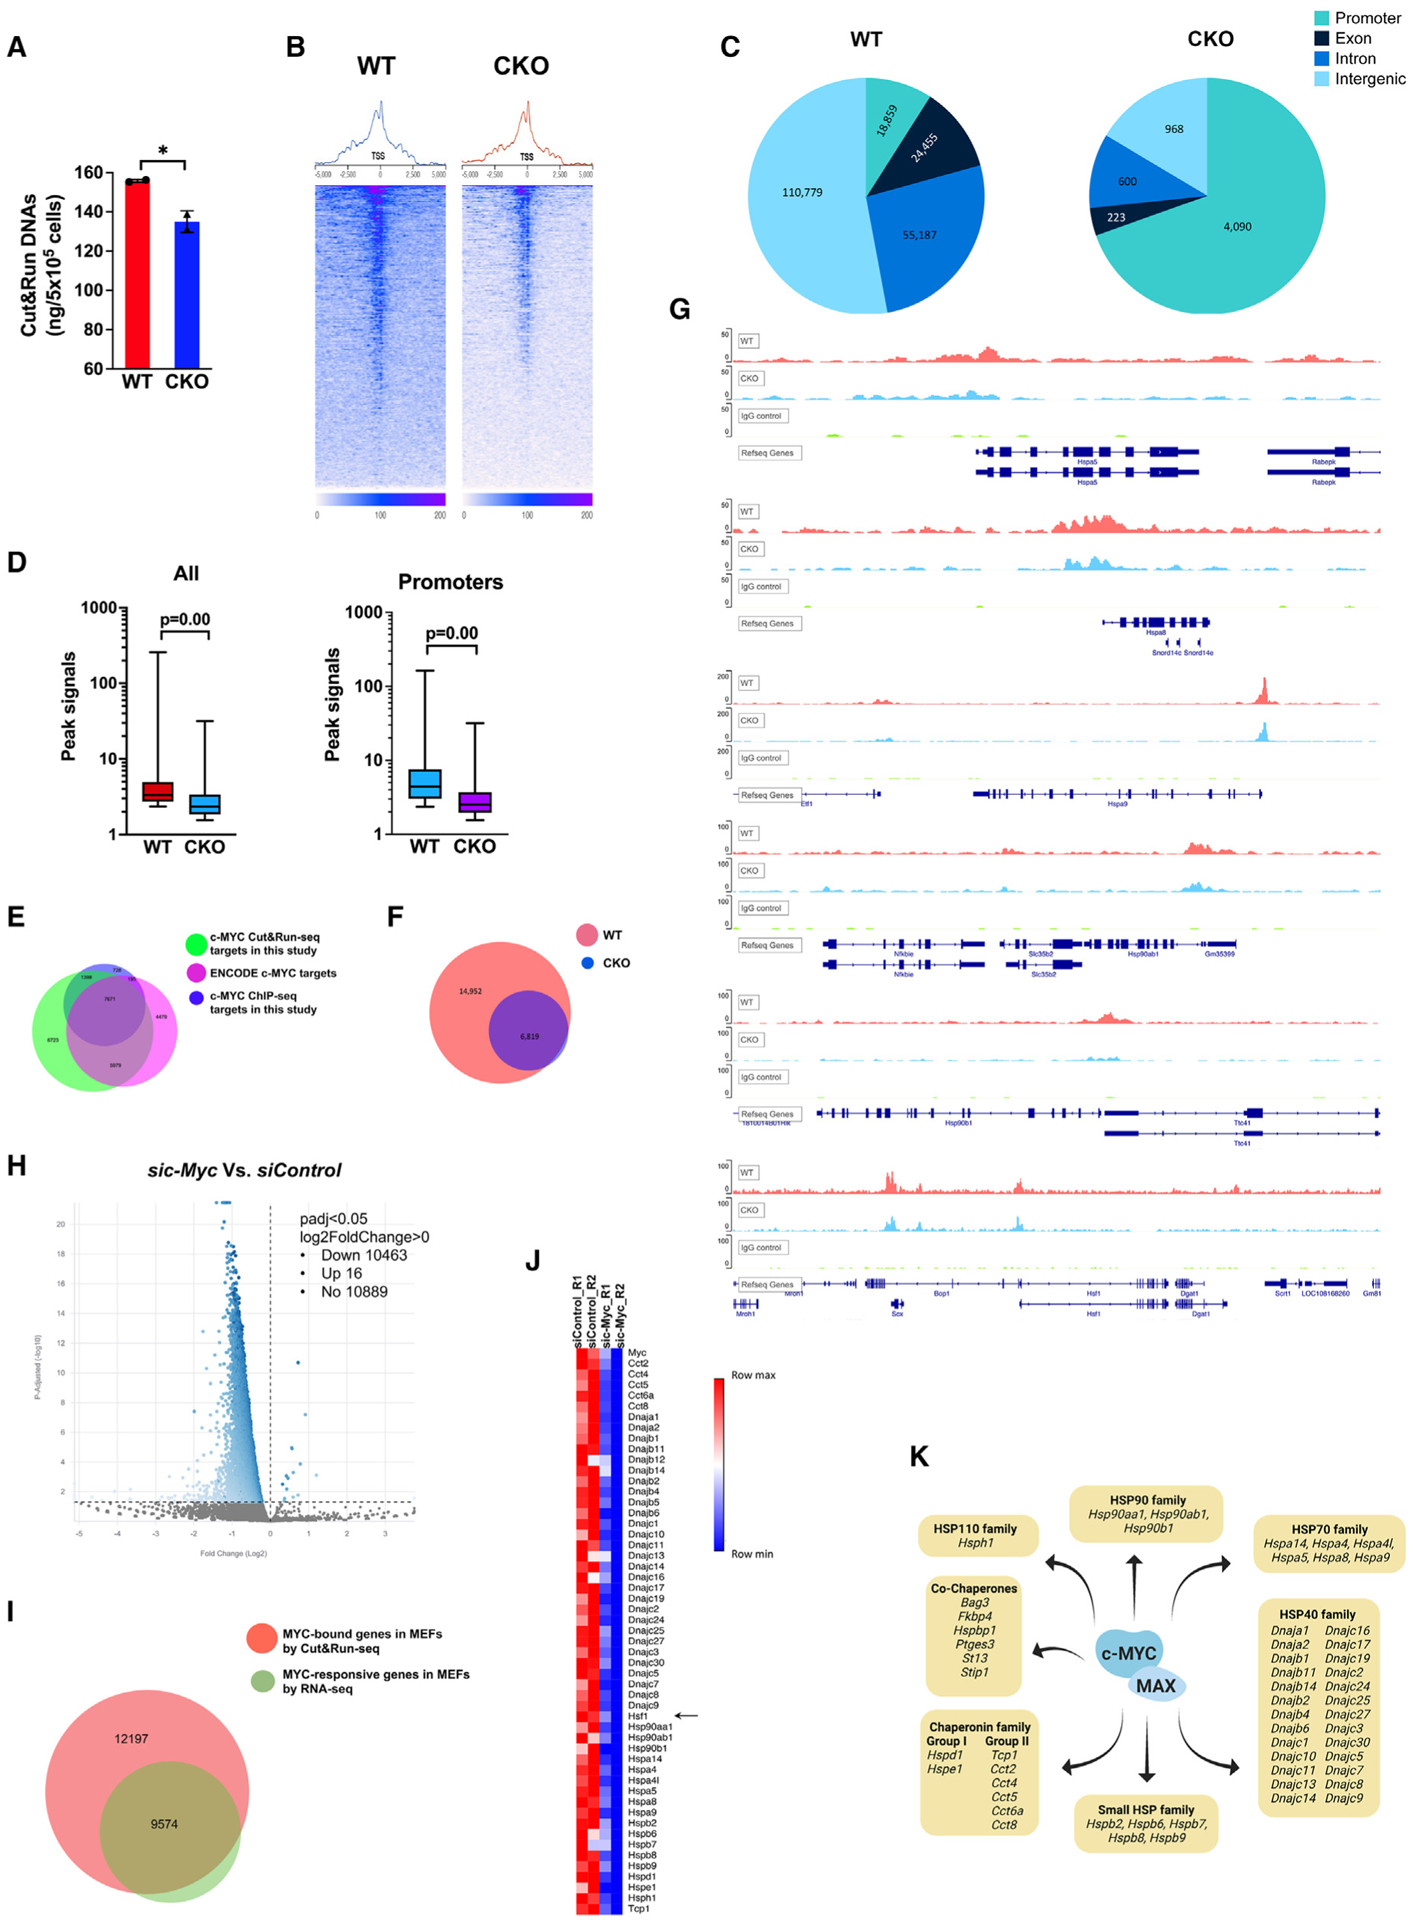
(A) Quantitation of released genomic DNA fragments in the CUT&RUN experiments in MEFs (mean ± SD, n = 2 biological replicates, two-tailed Student’s t test).
(B) Transcription start site (TSS) plots of aligned CUT&RUN-seq reads following spike-in normalization (two biological replicates are combined).
(C) Genomic distributions of CUT&RUN-seq peaks in MEFs.
(D) Boxplots of peak signals in MEFs. The box bounds the IQR divided by the median and the whiskers extend to the minimum and maximum values (Mann-Whitney U test). Left: all peaks (n = 209,466 WT and 5,900 CKO). Right: peaks within promoters (n = 18,859 WT and 4,090 CKO).
(E) Venn diagram showing the overlaps of c-MYC-bound genes among different experiments.
(F) Venn diagram showing the overlaps of c-MYC-bound genes identified by CUT&RUN-seq in MEFs.
(G) Visualization of c-MYC binding to Hsp and Hsf1 genes.
(H) Volcano plot of the differentially expressed genes (DEGs) in Hsf1WT MEFs due to transient c-Myc KD.
(I) Venn diagram showing the overlaps between c-MYC-bound genes identified by CUT&RUN-seq and DEGs due to c-Myc KD identified by RNA-seq.
(J) Heatmap visualization of the DEGs encoding chaperones, co-chaperones, and HSF1 (two biological replicates each group).
(K) Summary of c-MYC target genes encoding chaperones and co-chaperones.
*p < 0.05. See also Figure S2.
To date, only a few transcription factors have been investigated using the CUT&RUN-seq technique. To validate this technique, we also performed the conventional ChIP-seq experiments using the very same antibody and Hsf1WT MEFs. Whereas CUT&RUN-seq identified a total of 21,771 genes bound by c-MYC, ChIP-seq identified only 9,992 (Table S1). Notably, nearly 91% of those 9,992 genes were also detected by CUT&RUN-seq (Figure 2E), demonstrating a high degree of comparability between these two techniques. Our CUT&RUN-seq also identified 74% of ENCODE MYC target genes (18,324) (Figure 2E), despite the distinct experimental conditions. Moreover, CUT&RUN-seq peak sequences were highly enriched for the E-box motif; by contrast, the HSE motif was far less enriched (Figure S2B). In addition, peak visualization confirmed the binding of c-MYC to several classic target genes, including Npm1, Ncl, Odc1, Cdk4, and Hspd1 (Figure S2C). Together, these results validate our CUT&RUN-seq experiments.
The c-MYC target genes in Hsf1WT and Hsf1CKO cells almost completely overlapped, although in Hsf1CKO cells c-MYC bound to only 31.8% of those genomic loci identified in Hsf1WT cells (Figure 2F). Despite weak signals in general, peak visualization confirmed the c-MYC binding to intergenic regions (Figure S2D). Of interest, c-MYC bound to an array of Hsp genes, spanning all HSP families. Among them are several prominent constitutively expressed Hsp genes, including Hspa5/Bip, Hspa8/Hsc70, Hspa9/Grp75, Hsp90ab1/Hsp84, and Hsp90b1/Grp94. Importantly, Hsf1 was also a target of c-MYC (Figure 2G), a finding confirmed by ChIP-seq (Figure S2E). c-MYC DNA binding, albeit necessary, is insufficient to regulate gene expression. To define the target genes of c-MYC in our MEFs, we next performed RNA sequencing (RNA-seq) experiments using the Hsf1WT MEFs with and without c-Myc KD. A total of 10,479 genes displayed any degree of differential expression in responding to c-Myc KD (Figure 2H; Table S2), 9,574 of which were bound by c-MYC (Figure 2I). Thus, we define these 9,574 genes as c-MYC target genes in our MEFs (Table S3), including Hsf1 and many Hsp genes (Figures 2J and 2K). The regulation of Hsf1 by c-MYC was further confirmed by qRT-PCR (Figure S2F). These results support a key role of c-MYC in controlling cellular chaperoning capacity, both constitutive and inducible. Collectively, our findings indicate that HSF1 promotes c-MYC DNA binding genome-wide, a step essential to its transcriptional activity.
HSF1 physically interacts with c-MYC/MAX dimers
Prompted by the observation that HSF1 DNA binding is dispensable for c-MYC regulation, we next explored their potential physical interactions. Co-immunoprecipitation (coIP) experiments in HEK293T cells revealed that exogenously expressed FLAG-HSF1 interacted with both HA-c-MYC and V5-MAX (Figure 3A). Importantly, PLA detected the interaction between endogenous HSF1 and c-MYC in situ, predominantly localized within the nucleus, in both MEFs and human HeLa cells (Figures S3A and 3B). In addition, we were able to coIP endogenous c-MYC and HSF1 (Figures 3C and S3B). To validate direct c-MYC-HSF1 interactions in vitro, we performed Lumit immunoassays using recombinant proteins, wherein protein-protein interactions are indicated by the successful complementation of split NanoLuc luciferases that are conjugated with two distinct antibodies.39 Consistent with the coIP and PLA results, glutathione S-transferase-tagged HSF1 (GST-HSF1) did interact with c-MYC/MAX heterodimers in vitro, evidenced by markedly elevated luminescence signals (Figure 3D). These results were consistent with in vitro pull-down assays. Recombinant His-HSF1 proteins were pulled down by GST-tagged c-MYC proteins (Figure S3C); vice versa was also true (Figure S3D).
Figure 3. HSF1 physically interacts with c-MYC.
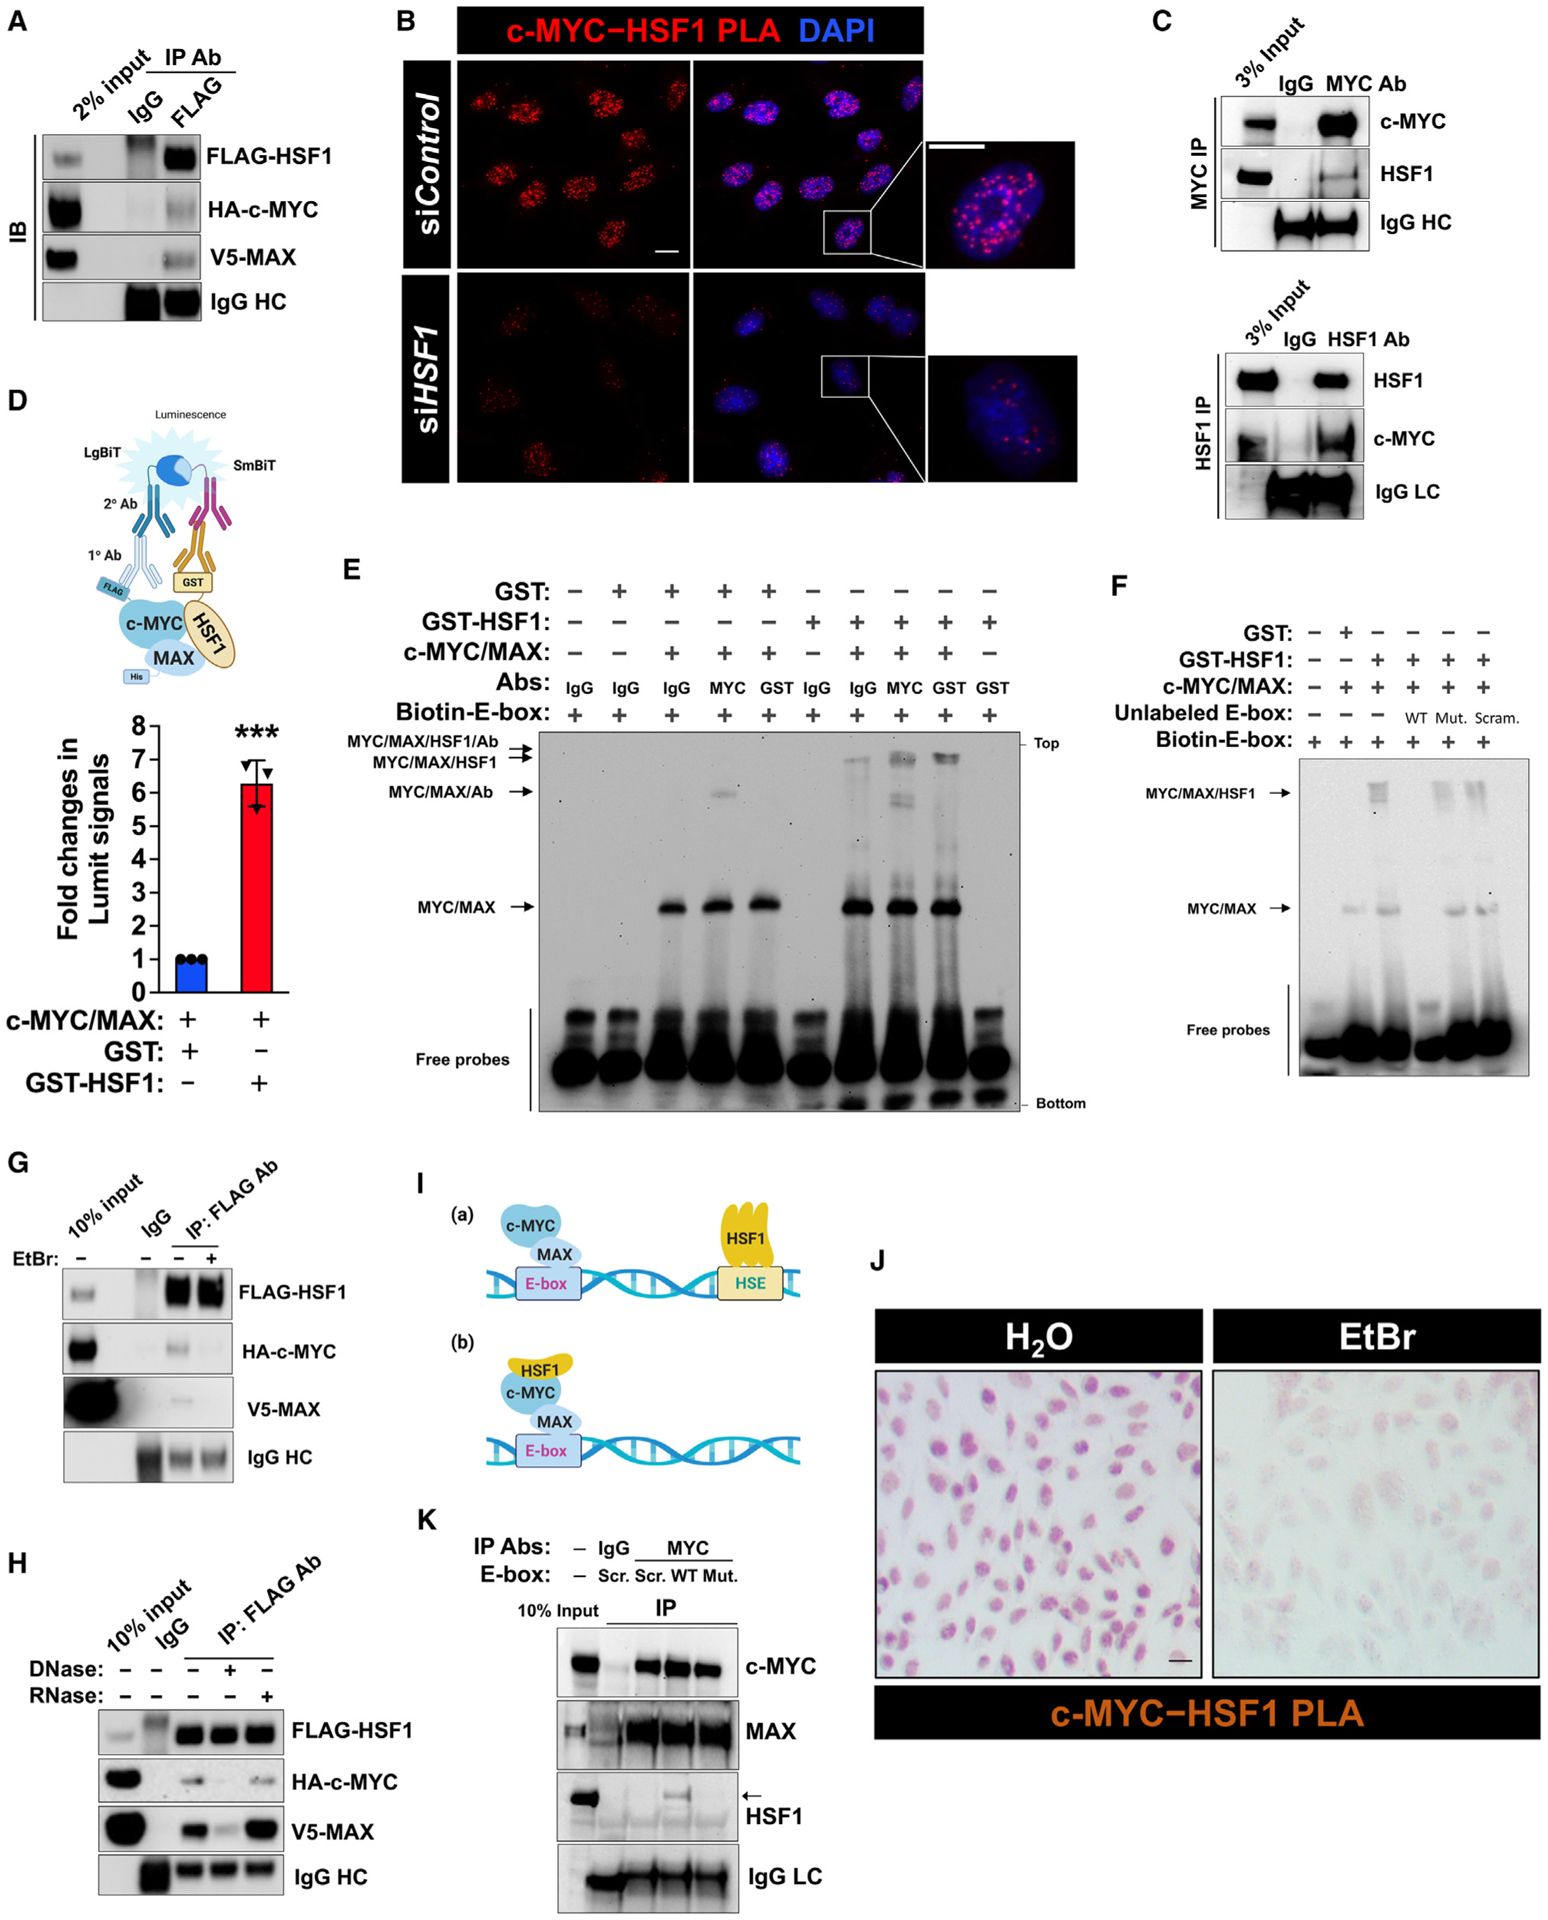
(A) CoIP of FLAG-HSF1, HA-c-MYC, and V5-MAX from transfected HEK293T cells (representative images of three independent experiments).
(B) Endogenous c-MYC-HSF1 interactions were detected by PLA in HeLa cells using a rabbit anti-c-MYC (D3N8F) antibody and a mouse monoclonal anti-HSF1 (E–4) antibody. Scale bars, 10 μm.
(C) CoIP of endogenous c-MYC and HSF1 from 8 mg HeLa cell lysates (representative images of two independent experiments). LC: light chain.
(D) In vitro direct interactions between recombinant HSF1 and c-MYC/MAX dimers were detected by the Lumit immunoassay. The reactions without primary antibodies were set up as the blanks, which were subtracted (mean ± SD, n = 3 independent experiments, two-tailed Student’s t test).
(E and F) EMSA using recombinant proteins and 10 nM biotin-labeled consensus E-box probes. Recombinant c-MYC/MAX dimers (200 ng) were incubated with GST or GST-HSF1 at 1:1 M ratio (representative images of three independent experiments).
(G) Lysates of HEK293T cells co-transfected with indicated plasmids for 3 days were treated with EtBr (400 μg/mL) on ice for 30 min. The interaction of FLAG-HSF1 with HA-c-MYC/V5-MAX was detected by coIP (representative images of three independent experiments).
(H) Lysates of HEK293T cells co-transfected with indicated plasmids for 3 days were treated with either 10 U of DNase I or RNase at 37°C for 20 min, followed by coIP (representative images of three independent experiments).
(I) Schematic depiction of two possible models of DNA-dependent protein-protein interactions.
(J) Endogenous c-MYC-HSF1 interactions were detected by bright-field PLA in HeLa cells, following treatment with or without EtBr (100 μg/mL) for 1 h. Scale bars: 10 μm.
(K) CoIP of endogenous c-MYC and HSF1 from 5 mg HeLa cell lysates incubated with various E-box dsDNA oligos (representative images of three independent experiments).
HC, heavy chain; Mut., mutant E-box; Scr., scrambled E-box; WT: wild-type E-box. ***p < 0.001. See also Figure S3.
To address whether this c-MYC-MAX-HSF1 complex binds DNA, we employed the classic electrophoretic mobility shift assay (EMSA) using recombinant proteins. Unlike GST or GST-HSF1, c-MYC/MAX dimers readily bound the biotin-labeled consensus E-box probes; importantly, co-incubation with GST-HSF1, but not GST, caused a marked mobility shift of c-MYC/MAX dimers (Figure 3E). Moreover, this mobility shift, owing to HSF1 interactions, was further enhanced by either anti-MYC or anti-GST antibodies (Figure 3E), indicating the DNA-binding capability of c-MYC-MAX-HSF1 complexes. Demonstrating the specificity, the binding of this complex to consensus E-box probes was largely blocked by excessive unlabeled WT, but not mutant or scrambled, E-box oligos (Figure 3F). Of note, compared with GST controls, GST-HSF1 enhanced the binding of c-MYC/MAX dimers to consensus E-box probes (Figures 3E and 3F), which was further corroborated by the AlphaLISA assay (Figure S3E). This finding concurs with our cellular studies (Figures 1G and 1I). Moreover, sequential ChIP experiments captured both c-MYC and HSF1 from the same chromatin fragments (Figure S3F), in support of the assembly of endogenous DNA-binding c-MYC-MAX-HSF1 complexes in vivo.
The c-MYC-MAX-HSF1 complex assembles on DNAs
Whereas PLA could readily detect endogenous c-MYC-HSF1 interactions in the nucleus, coIP of both was technically challenging, requiring large quantities of cell lysates. Thus, we reasoned that the c-MYC-MAX-HSF1 complex might preferentially assemble on gDNAs. Regular cell lysis conditions would largely disrupt their associations.
First, we asked whether DNA binding is required for their interactions. To test this, we treated HEK293T cell lysates overex-pressing FLAG-HSF1, HA-c-MYC, and V5-MAX with ethidium bromide (EtBr). EtBr is known to disrupt DNA-dependent protein associations.40 Of note, the whole-cell lysates were prepared by sonication, under which gDNA fragments were present. EtBr treatment markedly diminished the interaction between HSF1 and c-MYC/MAX (Figure 3G), suggesting the dependency on gDNA binding. To exclude the possible contribution of cellular RNAs, RNase and DNase were applied to digest relevant substrates in these cell lysates, respectively. Treatment with DNase, but not RNase, disrupted this complex assembly (Figure 3H), demonstrating the necessity of gDNA binding. Notably, coIP experiments cannot exclude the possibility that c-MYC and HSF1 may be brought together via their co-occupancy of adjacent gDNAs (Figure 3I). However, this scenario would predict: (1) HSF1 DNA binding is required for c-MYC transcriptional activity, and (2) HSF1 and c-MYC lack physical interactions. Apparently, both predictions have already been refuted (Figures 1D and 3B). To further demonstrate the dependency on DNA binding under physiological conditions, bright-field PLA was performed in situ to avert potential interference from EtBr fluorescence. The results confirmed a direct interaction between endogenous c-MYC and HSF1, which was largely disrupted by EtBr treatment (Figure 3J). Conversely, addition of WT, but not mutant or scrambled, E-box oligos to cell lysates facilitated the coIP of endogenous c-MYC/MAX and HSF1 (Figure 3K). Similarly, transfection of the pMYC-SEAP reporter plasmid into cells promoted the interaction between endogenous c-MYC and HSF1, compared with five control plasmids that are not directly bound by c-MYC (Figures S3G and S3H). In aggregate, these findings support nuclear assembly of c-MYC-MAX-HSF1 complexes, a physiological event facilitated by DNA binding.
HSF1 activates c-MYC transcriptional activity via GCN5
Chromatin structure/topography affects the accessibility of gDNAs to transcription factors.11 It was reported that c-MYC can recruit chromatin-modifying complexes, such as the STAGA co-activator complex containing the histone acetyltransferase GCN5, to remodel chromatin structures.8,41
First, we asked whether GCN5 is important to c-MYC transcriptional activity. Resembling Hsf1 deficiency, in MEFs, Gcn5 KD diminished the expression of c-MYC target genes (Figure 4A). A similar result was also obtained from the c-MYC reporter assay (Figure S4A), indicating that GCN5 is crucial to c-MYC transcriptional activity. Next, we asked whether HSF1 activates c-MYC via GCN5. As demonstrated above (Figure 1D), both the full-length HSF11–529 and transcription-deficient HSF1324–529 mutants enhanced c-MYC activity; however, this activation was largely blocked by GCN5 KD (Figure 4B), indicating a requirement for GCN5. Conversely, GCN5 overexpression activated c-MYC (Figure S4B). GCN5 overexpression, remarkably, rescued the diminished DNA binding of c-MYC in Hsf1CKO MEFs (Figure 4C).
Figure 4. HSF1 activates c-MYC via GCN5.
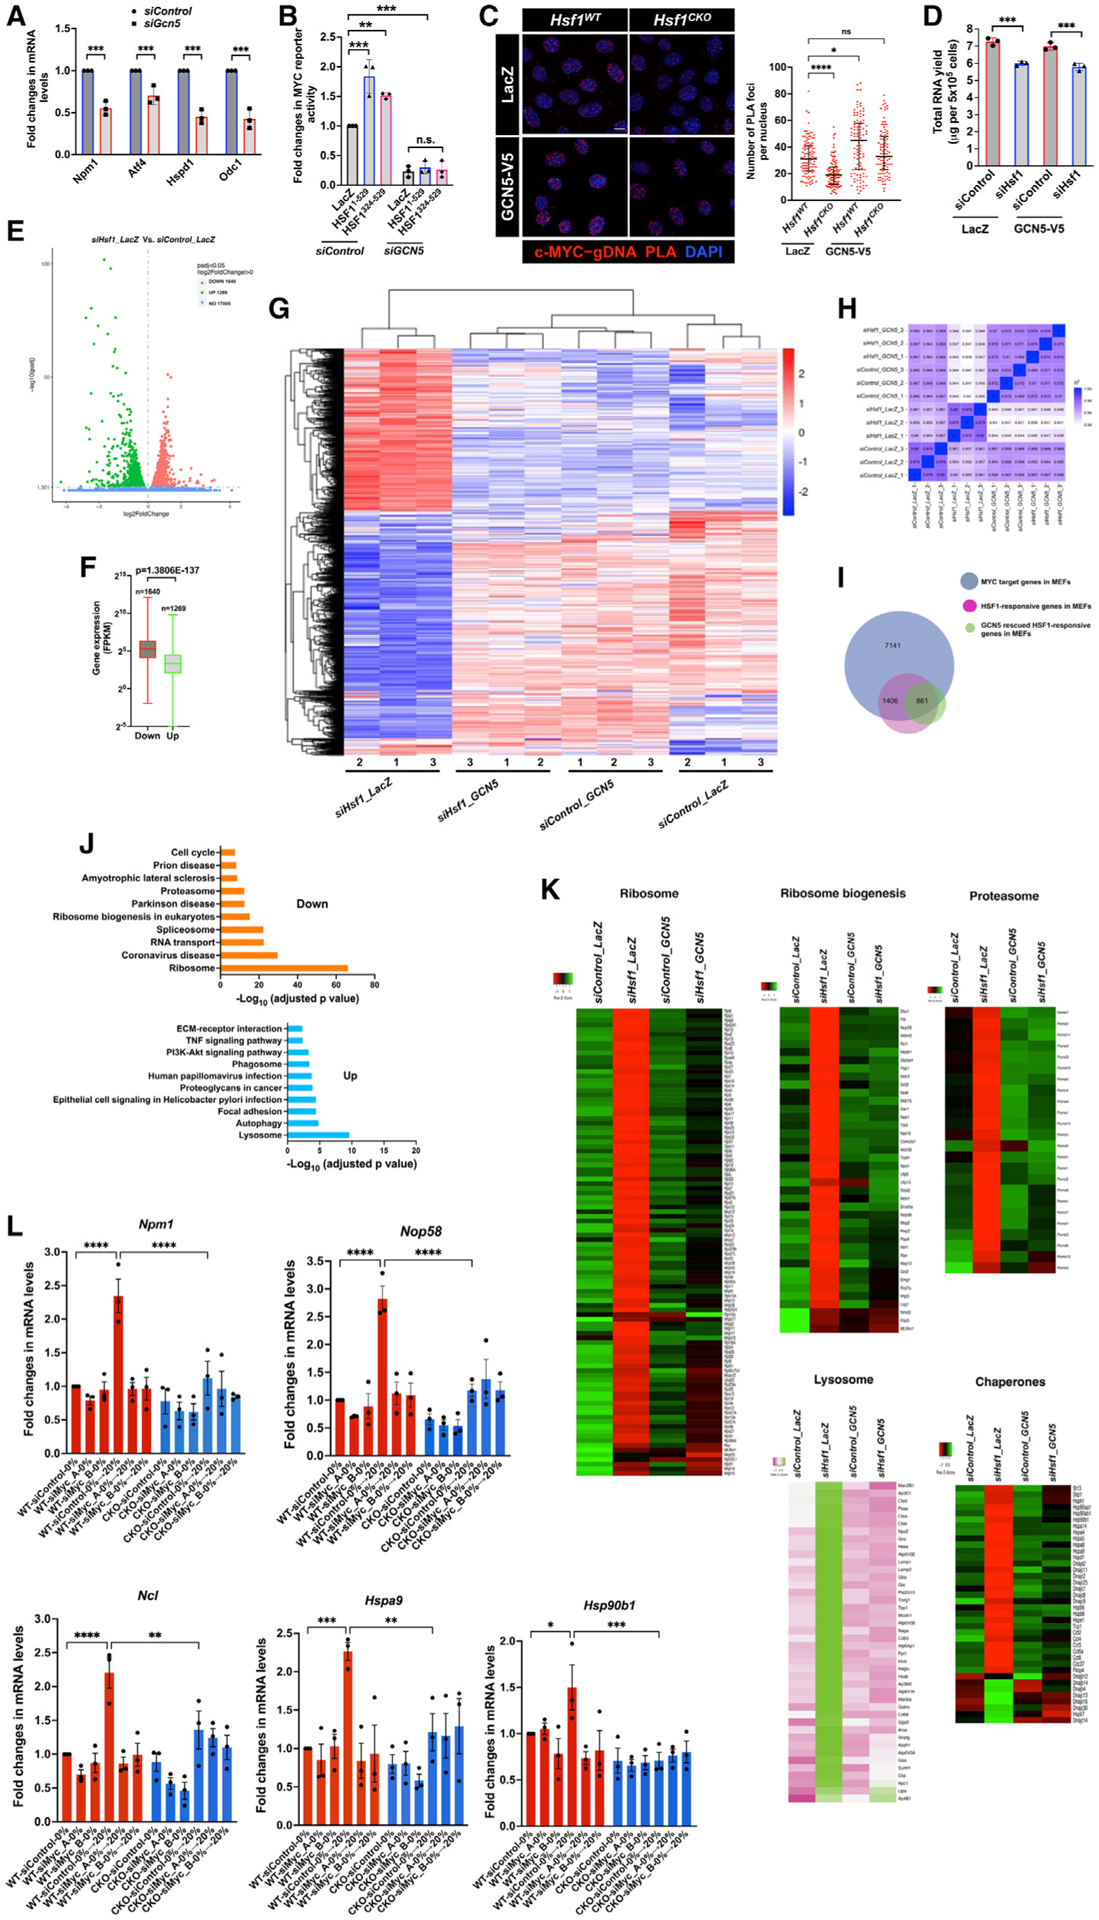
(A) The expression of c-MYC target genes was quantitated by qRT-PCR, following Gcn5 KD for 48 h in MEFs (mean ± SD, n = 3 independent experiments, twoway ANOVA).
(B) Endogenous c-MYC transcriptional activities were measured by the dual-reporter system in HEK293T cells transfected with indicated plasmids and small interfering RNAs (siRNAs; mean ± SD, n = 3 independent experiments, one-way ANOVA).
(C) Left panel: endogenous c-MYC binding to gDNA was detected by PLA in MEFs stably expressing LacZ or GCN5. Scale bars, 10 μm. Right panel: quantitation of these PLA foci per nucleus (median ± IQR, n R 100 nuclei, one-way ANOVA).
(D) Quantitation of total RNAs extracted from MEFs stably expressing LacZ or GCN5 (mean ± SD, n = 3 biological replicates, one-way ANOVA).
(E) Volcano plot of the DEGs due to Hsf1 KD.
(F) Box-and-whisker plots of the abundance of DEGs in the control cells (n = 1,640 or 1,269, Mann-Whitney U test). The box bounds the IQR divided by the median and the whiskers extend to the minimum and maximum values.
(G) Visualization of DEGs in MEFs expressing different genes and siRNAs by clustering heatmaps (three biological replicates per each group).
(H) Seaborn correlation heatmap of gene expression among different experimental groups.
(I) Venn diagram showing the overlaps among the defined c-MYC target genes, the DEGs following Hsf1 KD, and the DEGs rescued by GCN5 overexpression in MEFs.
(J) Pathway enrichment analyses of the differentially expressed c-MYC target genes in MEFs following Hsf1 KD.
(K) Heatmap visualization of the DEGs involved in the ribosome, proteasome, lysosome, and chaperone pathways (each data point represents the average of three biological replicates).
(L) Quantitation of c-MYC target gene expression by qRT-PCR. MEFs transfected with either control or two independent c-Myc-targeting siRNAs were serum starved for 20 h, followed by 20% serum stimulation for 17 h (mean ± SEM, n = 3 independent experiments, one-way ANOVA).
*p < 0.05, **p < 0.01; ***p < 0.001; ****p < 0.0001; n.s.: not significant. See also Figure S4.
To assess how HSF1 affects the c-MYC-mediated transcription, we conducted RNA-seq experiments. We resorted to acute Hsf1 KD in MEFs to avoid potential interference of 4-OHT with transcription and compensatory effects caused by chronic Hsf1 deletion42 (Figure S4C). Extraction of total RNAs from equal numbers of MEFs, intriguingly, indicated that Hsf1 KD resulted in an 18% reduction in RNA levels (Figure 4D). To account for this difference, we incorporated External RNA Controls Consortium (ERCC) RNA spike-in controls during RNA extraction. This spike-in normalization showed that total 2,909 genes were differentially expressed, both up-regulated and down-regulated, between the control and Hsf1-KD groups (Figure 4E; Table S4). In line with the overall reduction in total RNAs following Hsf1 KD, those down-regulated genes displayed considerably higher abundance than those up-regulated genes (Figure 4F; Table S4). These changes in gene expression were illustrated by clustering heatmaps; interestingly, GCN5 overexpression markedly reversed these changes (Figure 4G; Table S4). Congruently, the cells with both Hsf1 KD and GCN5 overexpression more resemble the control cells than the Hsf1-KD cells, in terms of gene expression (Figure 4H). In agreement with its regulation of c-MYC, these differentially expressed genes (DEGs) caused by Hsf1 KD are enriched for known c-MYC target genes,43 which was reversed by GCN5 overexpression (Figures S4D and S4E). Notably, these RNA-seq findings were further validated by qRT-PCR (Figure S4F).
Approximately 78% (2,267 of 2,909) of those DEGs are c-MYC target genes defined in MEFs (Table S5); moreover, GCN5 over-expression rescued the expression of nearly 38% of those c-MYC target genes to varying degrees (Figure 4I), highlighting an important role of GCN5 in the specific regulation of c-MYC by HSF1. Of interest, the differentially expressed c-MYC target genes following Hsf1 KD play key roles in proteome homeostasis. In particular, genes involved in the ribosome, ribosome biogenesis, proteasome, and chaperone pathways are down-regulated; by contrast, genes involved in the lysosome and auto-phagy pathways are up-regulated (Figures 4J and 4K). Whereas Hsf1 KD altered the expression of chaperones that are constitutively expressed, these changes were reversed by GCN5 over-expression (Figure 4K), consistent with a c-MYC-dependent mechanism. By contrast, c-MYC exhibited no or only a low occupancy at the promoters of classic stress-inducible Hsp genes, including Hspb1/Hsp25 and Hspa1a/Hsp72 (Figure S4G). Compared with their constitutive cognates, their own expression is either low or undetectable under non-stressed conditions (Figure S4G), as expected. Importantly, the diminished Hspb1 expression, because of Hsf1 KD, could not be rescued by GCN5 overexpression (Figure S4G), suggesting a c-MYC-independent, HSF1-dependent mechanism. Aside from sustaining its constitutive transcriptional activity under normal growth conditions, HSF1 is also required for stimuli-induced c-MYC activation. In Hsf1WT MEFs, serum stimulation induced expression of c-MYC target genes, which was blocked by c-Myc KD, indicating the c-MYC dependency; importantly, Hsf1 deletion markedly impaired their induction (Figure 4L). Collectively, these findings indicate a genome-wide impact of HSF1 on the c-MYC-mediated transcriptional program.
HSF1 directly recruits GCN5 to c-MYC
Given the critical role of GCN5 in this HSF1-mediated c-MYC regulation, we asked whether HSF1 influences the GCN5 recruitment to c-MYC. When overexpressed in HEK293T cells, FLAG-HSF1 was coIPed with V5-GCN5 (Figure 5A). Although this finding suggests a direct recruitment of GCN5 by HSF1, it remains possible that HSF1 promotes c-MYC-GCN5 interactions indirectly. To distinguish these two possibilities, we performed in vitro pull-down assays using recombinant proteins. Compared with EHMT2 controls, a histone methyltransferase,44 HSF1 directly pulled down GCN5 (Figure S5A). This finding predicts that HSF1 deficiency would diminish the GCN5 association with c-MYC. Congruently, PLA indicated a reduced interaction between endogenous c-MYC and GCN5 in HeLa cells following HSF1 KD (Figure 5B). Moreover, in MEFs, Hsf1 KD also diminished c-MYC-GCN5 association (Figure 5C). Conversely, HSF1 overexpression heightened their association (Figure S5B). Thus, these findings support a direct recruitment of GCN5 by HSF1 to c-MYC.
Figure 5. HSF1 recruits GCN5 to c-MYC.
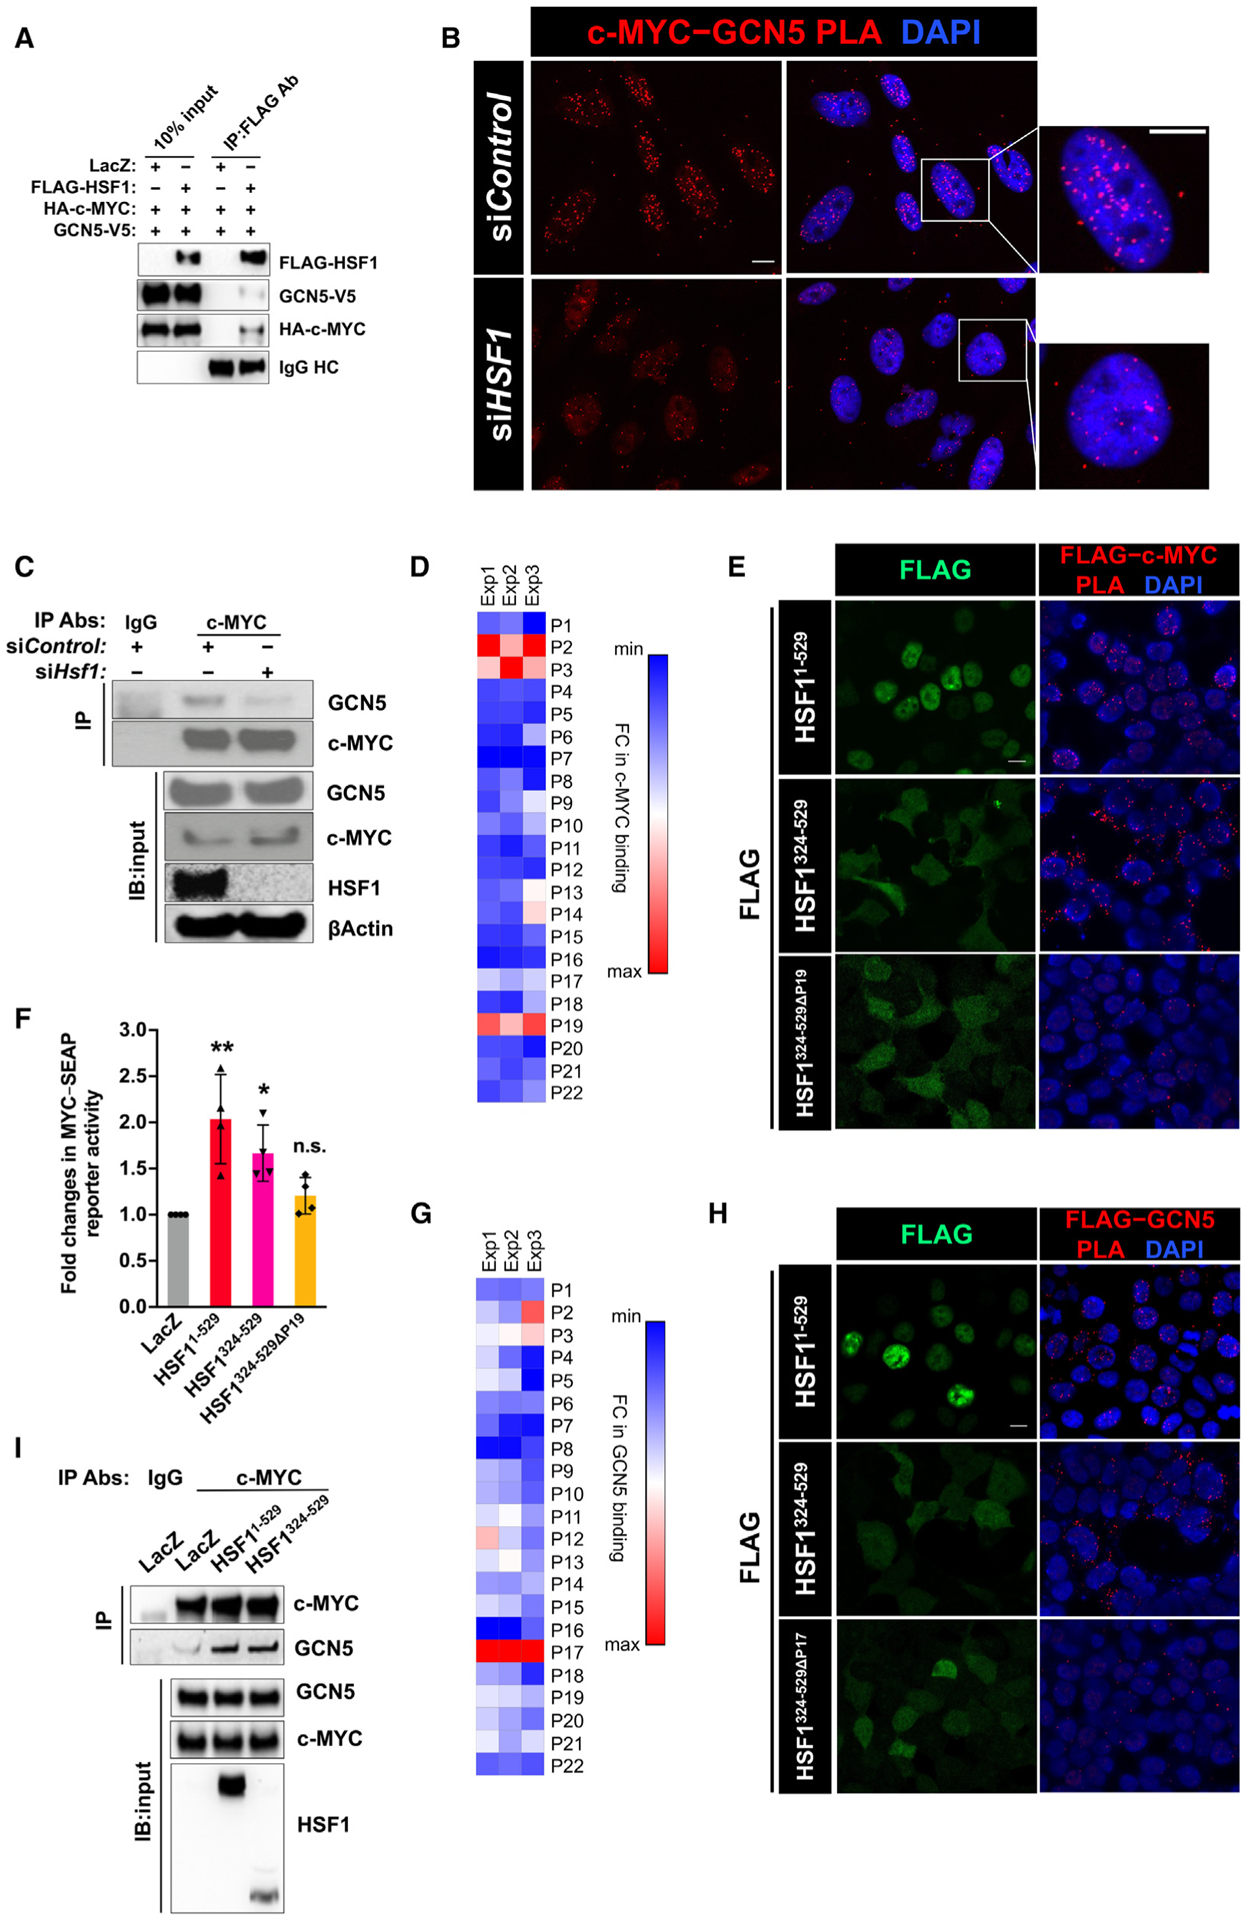
(A) CoIP of FLAG-HSF1, HA-c-MYC, and V5-GCN5 in transfected HEK293T cells (representative images of three independent experiments).
(B) Endogenous c-MYC-GCN5 interactions were detected by PLA in HeLa cells. Scale bars, 10 μm.
(C) CoIP of endogenous c-MYC and GCN5, following transient Hsf1 KD in MEFs (representative images of three independent experiments).
(D) In vitro binding of recombinant c-MYC proteins to individual HSF1 peptides immobilized on ELISA plates. Fold changes in binding are presented as a heatmap (n = 3 independent experiments).
(E) Visualization of interactions between transfected FLAG-HSF1 and endogenous c-MYC by PLA in HEK293T cells using a mouse monoclonal anti-FLAG antibody and a rabbit anti-c-MYC antibody. Scale bars, 10 μm.
(F) c-MYC transcriptional activities were measured by the dual-reporter system in HEK293T cells co-transfected with indicated plasmids (mean ± SD, n = 4 independent experiments, one-way ANOVA).
(G) In vitro binding of recombinant GCN5 proteins to individual HSF1 peptides immobilized on ELISA plates. Fold changes in binding are presented as a heatmap (n = 3 independent experiments).
(H) Visualization of interactions between transfected FLAG-HSF1 and endogenous GCN5 by PLA in HEK293T cells. Scale bars, 10 μm.
(I) CoIP of endogenous c-MYC and GCN5 in HEK293T cells transfected with LacZ or FLAG-HSF1 (representative images of three independent experiments).
*p < 0.05, **p < 0.01; n.s.: not significant. See also Figure S5.
HSF1 couples c-MYC and GCN5 via its C-terminal AD
Next, we embarked on elucidating the interactions among HSF1, c-MYC, and GCN5. To delineate the c-MYC binding sites on HSF1, we utilized a synthetic HSF1 peptide library, comprising 22 non-overlapping peptides (24 amino acids each), as described previously.23 After screening for the binding of recombinant c-MYC proteins in vitro, three HSF1 peptides, located at the N-terminal DBD (P2, P3) and C-terminal AD (P19), respectively, displayed evident binding capability (Figure 5D). Considering that HSF11–323 was incapable of activating c-MYC (Figure 1D), we then focused on P19. Revealed by PLA, deletion of the P19 sequence largely abolished the interaction between FLAG-HSF1324–529 and endogenous c-MYC, supporting this region as an interacting interface with c-MYC (Figure 5E). Accompanied with this loss of interaction, P19 deletion abolished the HSF1-mediated c-MYC activation, indicating the necessity of their physical interaction (Figure 5F).
A similar screen was performed to delineate the GCN5 binding sites on HSF1. P17, another region located within the AD, was identified (Figure 5G). In situ PLA indicated that the P17 region was required for GCN5 binding, because its deletion markedly diminished FLAG-HSF1324–529-GCN5 interactions (Figure 5H). Furthermore, overexpression of HSF1324–529, just like HSF11–529, heightened the coIP of endogenous c-MYC and GCN5 (Figure 5I). Together, our findings support that HSF1, through discrete interactions, couples GCN5 and c-MYC.
HSF1 regulates histone acetylation at c-MYC target loci
Chromatin remodeling is important to transcriptional regulation in eukaryotes. Given the diminished GCN5 recruitment to c-MYC, we predicted that histone acetylation mediated by GCN5 would be impaired in Hsf1-deficient cells. Flow cytometry indicated a reduction in global acetylation of H3K9/14, hallmarks of active gene promoters,45,46 in Hsf1CKO MEFs (Figure 6A). Of note, this reduction occurred specifically at c-MYC target loci, but not at non-target loci (Figure 6B). In light of the importance of recruiting GCN5 to c-MYC, we further predicted that fusion of the HSF1 C-terminal AD, containing the GCN5 binding site, to c-MYC would create a “superactive” c-MYC mutant. Interestingly, this HSF1AD-c-MYC fusion consistently resulted in elevated protein expression, likely caused by protein stabilization, compared with the c-MYC wild type. To accurately compare their transcriptional activities, less amounts of this fusion plasmid were transfected into HEK293T cells. Despite its lower protein expression, this HSF1AD-c-MYC fusion still demonstrated markedly heightened transcriptional activity (Figure 6C).
Figure 6. Hsf1 deficiency impairs acetylation of histone H3 at c-MYC target loci.
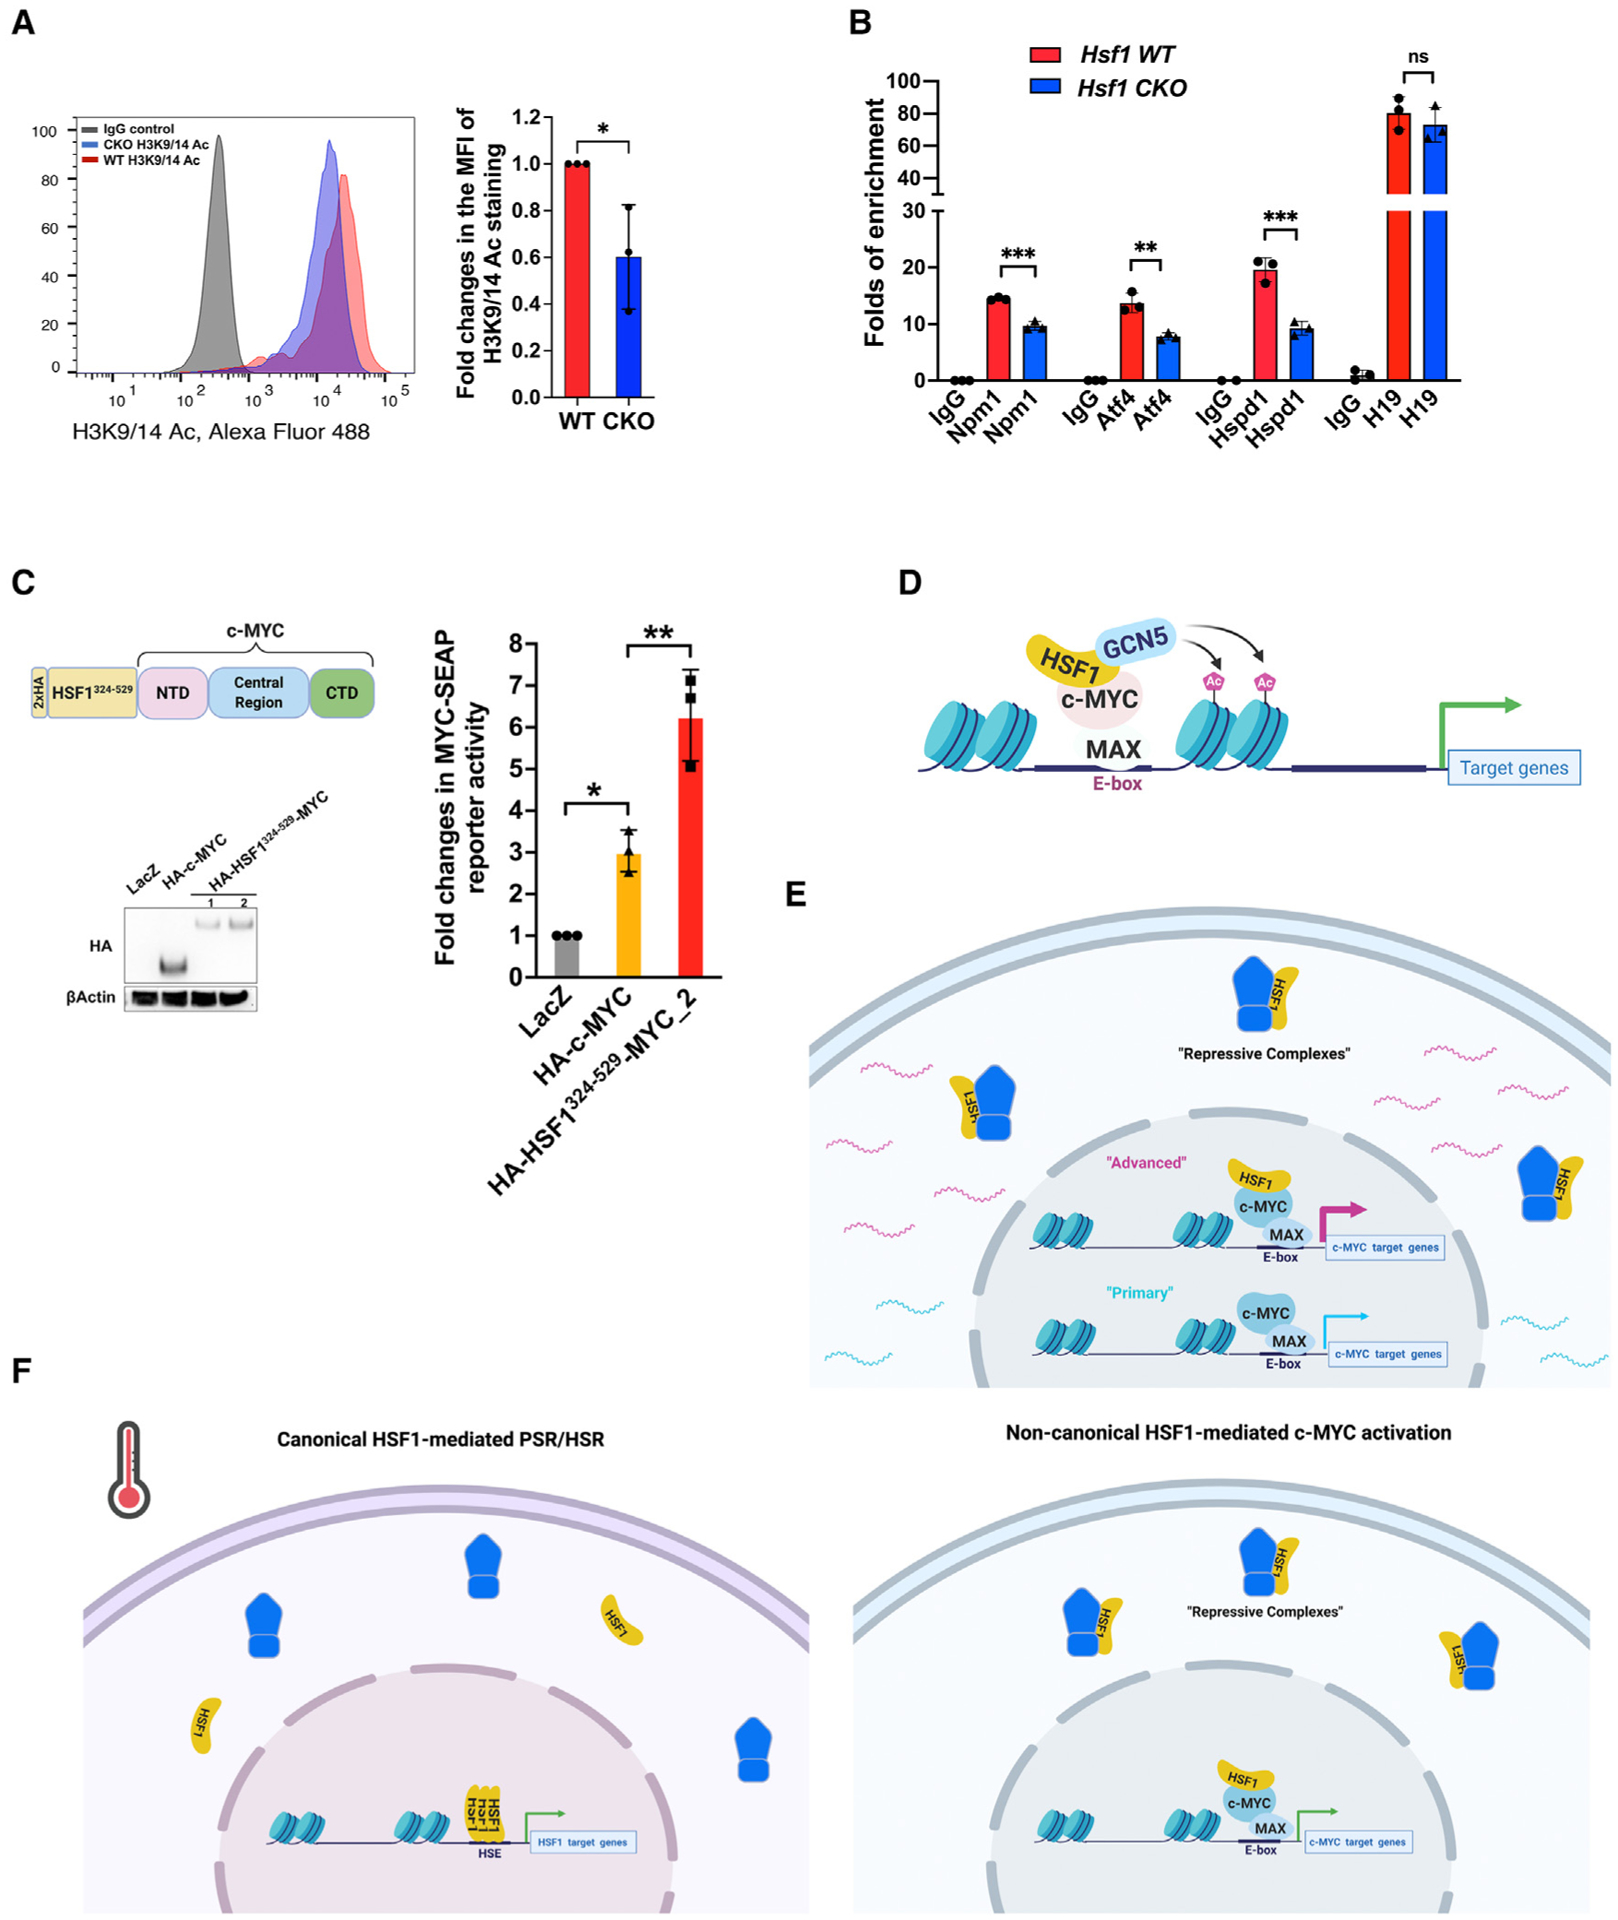
(A) Detection of global acetylation of H3K9/14 in MEFs by FACS. Left panel: representative histogram of three independent experiments. Right panel: quantitation of H3K9/14Ac staining using median fluorescence intensities (mean ± SD, n = 3 independent experiments, two-tailed Student’s t test).
(B) ChIP-qPCR assays were performed to detect H3K9/14Ac on c-MYC target or non-c-MYC target loci in MEFs (mean ± SD, n = 3 biological replicates, one-way ANOVA).
(C) Left panel: the protein expression of fusion between HA-HSF1324–529 and c-MYC was detected by immunoblotting. Right panel: the transcriptional activity of fusion proteins was measured by the dual-reporter system (mean ± SD, n = 3 independent experiments, one-way ANOVA).
(D) The proposed model of HSF1-mediated c-MYC activation. HSF1 helps recruit GCN5 to c-MYC, thereby promoting chromatin remodeling and potentiating the c-MYC-mediated transcription.
(E) HSF1 regulates two distinct activation states of c-MYC. Without HSF1 association, the transcriptional activity of c-MYC remains low, sustaining at a primary state; however, HSF1 association renders c-MYC highly active, transiting to an advanced state.
(F) HSF1 governs at least two discrete transcriptional programs. Upon its activation, either in the face of environmental stress or within malignant cells, HSF1 initiates the canonical PSR/HSR, a mechanism of action depending on HSE binding. By contrast, without environmental stress, most cellular HSF1 remains repressed; nevertheless, some HSF1 associates with c-MYC and potentiates its mediated transcription, a mechanism of action independent of HSE binding.
*p < 0.05, **p < 0.01; ***p < 0.001; n.s.: not significant. See also Figure S6.
In aggregate, these findings support a molecular model, wherein HSF1, by directly strengthening c-MYC DNA binding and recruiting GCN5 to promote histone acetylation, magnifies the transcriptional activity of c-MYC (Figure 6D).
DISCUSSION
Our studies identify a transcription factor complex comprising both HSF1 and c-MYC/MAX heterodimers. Instead of binding to HSEs, unexpectedly, within this complex HSF1 directly recruits the histone acetyltransferase GCN5 to c-MYC via physical interactions. GCN5, in turn, remodels chromatin architecture to stimulate c-MYC transcriptional activity. Thereby HSF1 renders c-MYC transcriptionally competent.
A conditional, DNA-binding-dependent transcription factor complex
Distinct from “constitutive” protein complexes, the assembly of c-MYC-MAX-HSF1 complexes is “conditional,” contingent on DNA binding. Our data suggest that monomeric HSF1 can associate with c-MYC/MAX, because HSF1324–529 mutants, also lacking the trimerization domain, still interact with c-MYC. Nevertheless, we cannot exclude the interaction of trimeric HSF1 with c-MYC.
Furthermore, this complex differs from the previously described “enhanceosome,”47 where individual transcription factors cooperatively bind to their respective DNA elements. By contrast, although within this complex only c-MYC/MAX dictate the specificity of DNA binding, HSF1 behaves like an adaptor devoid of DNA binding. Ina sense,this transcription factorcomplex operates in a “hybrid” mode, fusing the DNA binding capability of c-MYC/ MAX with the transcription coregulatory function of HSF1. Unlike its reliance on DNA binding at the cellular context, this c-MYCHSF1 interaction can be readily detected in vitro using recombinant proteins without DNA binding. This is likely due to excessive proteins under in vitro conditions, bypassing the requirement for DNA binding. Under physiological conditions, however, cellular HSF1 and c-MYC proteins are either limited or unavailable for interaction, making DNA binding a prerequisite for complex assembly.
It appears that under physiological conditions only part of cellular c-MYC/MAX dimers associate with HSF1. Congruent with the biological functions of HSF1, those HSF1-regulated MYC targets are enriched for genes engaging in protein metabolism (Figure S6A). Consistent with a role of HSF1 in promoting c-MYC DNA binding, those CUT&RUN-seq binding sites located within the HSF1-regulated MYC target genes display higher peak signals (Figure S6B). In support of active transcription, these HSF1-regulated c-MYC target genes are expressed at significantly higher levels (Figure S6C). To date, two distinct models of c-MYC-mediated transcription have been proposed: a gene selective activator (initiation) or a universal amplifier (elongation).48,49 However, our findings do not distinguish these two models; rather, they collectively support a scenario wherein cellular c-MYC/MAX dimers bind to genomic loci possessing more open chromatin structures, ensued by the recruitment of HSF1 and GCN5 that strengthens DNA binding and promotes histone acetylation. It is noteworthy that following an association with open chromatins, c-MYC actively scans local genomic sequences, which produces widespread non-specific DNA binding and, importantly, is required for the subsequent specific E-box recognition.50 Hence the stabilized DNA binding, owing to HSF1 and GCN5 association, likely enables c-MYC to undertake genome scanning proficiently. This non-specific act may underlie the pervasive low-affinity chromatin binding, captured by the CUT&RUN-seq, and engender efficient E-box recognition, ultimately instigating transcriptional initiation or elongation. By forming this transcription factor complex, HSF1 not only empowers the c-MYC-mediated transcription but also expands its own biological impacts, far beyond protein quality control.
HSF1 dictates two distinct c-MYC activation states
Depending on the context, HSF1 engages distinct acetyltransferase complexes. Although within this HSF1-c-MYC complex GCN5 is employed, under heat shock HSF1 trimers recruit the TRRAP-TIP60 complex.51 Interestingly, the ability of HSF1324–529 to recruit GCN5 may account for the effectiveness of HSF1 AD in CRISPR activation systems.52 Of note, some GCN5 still associates with c-MYC even in the absence of Hsf1. GCN5 was reported to directly interact with c-MYC.53 Thus, HSF1 only amplifies the GCN5 association. This is crucial, considering that c-MYC is an essential gene. Hsf1-deficient cells would retain a diminished c-MYC activity that is still sufficient to sustain viability. Conceptually, at the cellular level, c-MYC activity could be retained at two distinct states, primary and advanced (Figure 6E). HSF1 controls the switch between these two. By engaging extra GCN5, HSF1 empowers c-MYC to function at its full capacity, which may be required for certain physiological and pathological conditions beyond simple viability maintenance.
HSF1 is dispensable for the viability of non-transformed cells, suggesting that the primary state of c-MYC activation is sufficient for viability. It further implies that the c-MYC target genes in Hsf1CKO cells may represent the core targets critical for life. Congruently, these target genes not only are highly enriched for previously identified consensus MYC targets but also display higher probabilities of dependency in general, defined by Project Achilles (Figures S6D and S6E). Unsurprisingly, these target genes engage in essential biological processes, including gene expression, ribosome biogenesis, and mRNA processing (Figure S6F).
HSF1 is a guardian of cellular proteome
Under stressed conditions, HSF1 is pivotal to the preservation of proteomic stability by directly inducing HSP gene transcription. This action mainly protects protein quality. Now, we find that HSF1 can control protein quantity as well at both the synthesis and the degradation phase. Through c-MYC, HSF1 transcriptionally regulates ribosomes, proteasomes, and lysosomes. Intriguingly, HSF1 governs not only translation capacity via ribosomes, indicated in this study, but also translation efficiency via the mechanistic target of rapamycin complex 1 (mTORC1).35
Another noteworthy finding is the regulation of constitutively expressed HSPs by HSF1. Apart from its vital role in determining the expression of stress-inducible Hsp genes, namely, the HSR/ PSR, HSF1 augments the expression of constitutively expressed Hsp genes via c-MYC. Thus, by overseeing every major aspect of proteome homeostasis, HSF1 acts as a guardian of cellular proteome.
Implications in stress, cancer, and stem cell biology
Canonically, the HSR/PSR is characterized by the specific binding of HSF1 trimers to HSEs and subsequent transcriptional induction of these target genes, many of which encode HSPs. Although HSF1 can regulate non-HSP genes, including the target genes of E2F and DNA damage-inducible genes,54–56 this regulation is still reliant on its HSE binding. Apparently, the HSF1-c-MYC complex defies this classic definition. Independently of DNA binding, HSF1 can activate the much broader c-MYC-mediated transcriptional program (Figure 6E). Under non-stressed conditions, most HSF1 remains repressed and inactive; however, some HSF1 appears to escape this repression and potentiate the c-MYC-mediated transcription (Figure 6F). The ability of HSF1 to direct distinct transcriptional programs, hinging on discrete complex assembly, attests its versatility in transcriptional regulation.
Ample evidence has pinpointed HSF1 as a generic pro-oncogenic factor.19–24 In non-transformed MEFs, Hsf1 deficiency affected the expression of roughly 24% of the c-MYC target genes, suggesting that only part of cellular c-MYC is associated with HSF1. Likely, in non-transformed cells, HSF1 is largely inaccessible, partly due to its repressive mechanisms, to c-MYC. However, in human cancers, HSF1 is frequently overex-pressed.57 This increased quantity would render a considerable portion of cellular c-MYC transcriptionally competent, thereby promoting malignancy. In support of this notion, approximately 80% of HSF1-bound genes, defined by HSF1 ChIP-seq in human cancers,57 are also bound by c-MYC (Figure S6G). Given that in cancerous cells HSF1 becomes constitutively active,58 the remaining 20% likely comprise canonical HSF1 targets. Conversely, without HSF1, cells possess only basic c-MYC activity that is sufficient for viability but inadequate for malignant transformation, thus adopting a “tumor-resistant” cellular state. This concept may have clinical implications. Owing to its essentiality, directly targeting c-MYC likely inflicts undesirable side effects. Instead, targeting HSF1 may abate c-MYC activity to a level that is adequate to sustain the viability of primary cells but unable to support malignancy. Excitingly, HSF1 inhibitors showing potent anti-cancer effects have been developed in recent years.59,60
Lastly, it is tantalizing to postulate that this HSF1-mediated c-MYC activation may impact stemness. Although HSF1 has been implicated in maintaining cancer stem cells,61,62 its role in normal stem cell biology remains to be determined.
Limitations of the study
HSF1 regulates nearly 24% of c-MYC target genes in MEFs, likely underestimated because of incomplete Hsf1 deletion. Our studies suggest that not all cellular c-MYC/MAX associate with HSF1; nonetheless, the exact proportion remains undefined. Although the GCN5 recruitment by HSF1 stimulates transcription in part through histone acetylation, other mechanisms may also be involved. Moreover, it remains elusive how DNA binding facilitates the assembly of c-MYC-MAX-HSF1 complexes. Lastly, under non-stressed conditions, HSF1 activates c-MYC without the HSR/PSR initiation; however, it becomes imperative for HSF1 to undergo trimerization, bind to HSEs, and trigger the HSR/PSR on proteotoxic stress. Conceptually, under proteotoxic stress these two discrete transcriptional actions could compete. Thus, it remains to be elucidated how proteotoxic stress impacts this HSF1-mediated c-MYC activation.
STAR★METHODS
RESOURCE AVAILABILITY
Lead contact
Further information and requests for resources and reagents should be directed to and will be fulfilled by the lead contact, Chengkai Dai (chengkai.dai@nih.gov).
Materials availability
This study did not generate new unique reagents.
Data and code availability
The CUT&RUN-seq and RNA-seq data generated in this study have been deposited at GEO and are publicly available as of the date of publication. Accession number is listed in the key resources table. The original western blotting and microscopy images reported in this study have been deposited at Mendeley and are publicly available as of the date of publication. The DOI is listed in the key resources table.
This study does not report original code.
Any additional information required to reanalyze the data reported in this paper is available from the lead contact upon request.
KEY RESOURCES TABLE
| REAGENT or RESOURCE | SOURCE | IDENTIFIER |
|---|---|---|
| Antibodies | ||
| Rabbit anti-FLAG antibody | Cell Signaling Technology | Cat#14793S; RRID: AB_2572291 |
| Mouse anti-GST (26H1) antibody | Cell Signaling Technology | Cat# 2624S; RRID: AB_2189875 |
| Mouse anti-FLAG (9A3) antibody | Cell Signaling Technology | Cat#8146S; RRID: AB_10950495 |
| Rabbit anti-His tag (D3I1O) antibody | Cell Signaling Technology | Cat#12698S; RRID: AB_2744546 |
| Rabbit anti-c-MYC (D3N8F) antibody | Cell Signaling Technology | Cat#13987S; RRID: AB_2631168 |
| Rabbit anti-GCN5 (C26A10) antibody | Cell Signaling Technology | Cat#3305S; RRID: AB_2128281 |
| Rabbit anti-Acetyl-Histone H3(Lys9/Lys14) | Cell Signaling Technology | Cat#9677S; RRID: AB_1147653 |
| Rabbit anti-HSF1 (D3L8I) antibody | Cell Signaling Technology | Cat#12972S; RRID: AB_2798072 |
| Rabbit anti-c-MYC (E5Q6W) antibody | Cell Signaling Technology | Cat#18583S; RRID: AB_2895543 |
| Mouse anti-dsRNA (J2) antibody | Cell Signaling Technology | Cat#76651L; RRID: N/A |
| Rabbit anti-Acetylated-Lysine (Ac-K2-100) | Cell Signaling Technology | Cat#9814S; RRID: AB_10544700 |
| Rabbit (DA1E) IgG isotype control | Cell Signaling Technology | Cat#3900S; RRID: AB_1550038 |
| Mouse (E5Y6Q) IgG2a isotype control | Cell Signaling Technology | Cat#61656S; RRID: AB_2799613 |
| Mouse anti-rabbit IgG (light-chain specific) (D4W3E) HRP conjugate | Cell Signaling Technology | Cat#93702S; RRID: AB_2800208 |
| Goat anti-c-MYC antibody | R&D Systems | Cat#AF3696; RRID: AB_2282405 |
| Rabbit anti-USF1 antibody | United States Biological | Cat#214066; RRID: N/A |
| Goat anti-MAX C-term antibody | GeneTex Inc. | Cat#GTX89997; RRID: AB_10733434 |
| Mouse Anti-Beta Actin (GT5512) antibody | GeneTex Inc. | Cat#GTX629630; RRID: AB_2728646 |
| Rabbit anti-HSF1 (H-311) | Santa Cruz Biotechnology | Cat#sc-9144; RRID: AB_2120276 |
| Mouse anti-dsDNA (HYB331–01) antibody | Santa Cruz Biotechnology | Cat#sc-58749; RRID: AB_783088 |
| Mouse anti-HSF1 (E–4) antibody | Santa Cruz Biotechnology | Cat#sc-17757; RRID: AB_627753 |
| ChromPure goat IgG | Jackson Immunoresearch Laboratories | Cat#005–000-003; RRID: AB_2336985 |
| ChromPure rabbit IgG | Jackson Immunoresearch Laboratories | Cat#011–000-003; RRID: AB_2337118 |
| ChromPure mouse IgG | Jackson Immunoresearch Laboratories | Cat#015–000-003; RRID: AB_2337188 |
| Peroxidase-AffiniPure goat anti-mouse IgG (H + L) antibody | Jackson Immunoresearch Laboratories | Cat# 115–035-003; RRID: AB_10015289 |
| Peroxidase-AffiniPure goat anti-rabbit IgG (H + L) antibody | Jackson Immunoresearch Laboratories | Cat# 111–035-003; RRID: AB_2313567 |
| Peroxidase AffiniPure Bovine Anti-Goat IgG (H + L) antibody | Jackson Immunoresearch Laboratories | Cat#805–035-180; RRID: AB_2340874 |
| Goat anti-rabbit IgG (H + L) secondary antibody, Alexa Fluor 488 | ThermoFisher Scientific | Cat#A11034; RRID: AB_2576217 |
| Goat anti-mouse IgG (H + L) secondary antibody, Alexa Fluor 488 | ThermoFisher Scientific | Cat#A11029; RRID: AB_2534088 |
| Duolink® In Situ PLA anti-mouse Minus probes | Sigma-Aldrich | Cat# DUO92004; RRID: AB_2713942 |
| Duolink® In Situ PLA anti-rabbit Plus probes | Sigma-Aldrich | Cat# DUO92002; RRID: AB_2810940 |
| Duolink® In Situ PLA anti-goat Minus probes | Sigma-Aldrich | Cat# DUO92006; RRID: N/A |
| Bacterial and virus strains | ||
| NEB® 5-α Competent E. coli (High Efficiency) | New England Biolabs | Cat# C2987 |
| Chemicals, peptides, and recombinant proteins | ||
| InSolution (Z)-4-Hydroxytamoxifen | Sigma-Aldrich | Cat#5082250001 |
| MYCi361 | TargetMol Chemicals | Cat#T12132 |
| Halt™ Protease Inhibitor Cocktail | Thermo Fisher Scientific | Cat# 78430 |
| Hoechst 33342 | Thermo Fisher Scientific | Cat# H1399 |
| Janus Green B | Thermo Fisher Scientific | Cat#AC191680050 |
| TurboFect transfection reagent | ThermoFisher Scientific | Cat#R0531 |
| JetPRIME® transfection reagents | PolyPlus-transfection® SA | Cat# 101000015 |
| HSF1 peptides | Su et al.23 | Custom order |
| Recombinant GST proteins | SignalChem Lifesciences | Cat# G52–30U |
| Recombinant GST-HSF1 proteins | SignalChem Lifesciences | Cat# H25–30G |
| Recombinant c-MYC/MAX complex | Active Motif | Cat#81087 |
| Recombinant FLAG-GCN5 proteins | Active Motif | Cat#31591 |
| Recombinant FLAG-EHMT2 proteins | Active Motif | Cat#31410 |
| Recombinant His-HSF1 proteins | Enzo Life Sciences | Cat#ADI-SPP-900 |
| Recombinant GST-MYC proteins | Abnova | Cat#H00004609-P01 |
| Recombinant His-c-MYC proteins | RayBiotech | Cat#230–00580-100 |
| Recombinant His-GST proteins | Millipore Sigma | Cat#12–523 |
| Critical commercial assays | ||
| Verso cDNA Synthesis Kit | Thermo Fisher Scientific | Cat#AB1453B |
| iTaq™ Universal SYBR® Green Supermix | Bio-Rad Laboratories | Cat#1725122 |
| Duolink® In Situ PLA Detection Reagents Green | Sigma-Aldrich | Cat# DUO92014 |
| Duolink® In Situ PLA Detection Reagents Red | Sigma-Aldrich | Cat# DUO92008 |
| Duolink® In Situ PLA Detection Reagents Brightfield | Sigma-Aldrich | Cat# DUO92012 |
| NovaBright™ Phospha-Light™ EXP Assay Kit for SEAP | Thermo Fisher Scientific | Cat# N10577 |
| Pierce™ Gaussia Luciferase Glow Assay Kit | Thermo Fisher Scientific | Cat# 16160 |
| Lumit™ Immunoassay Cellular Systems | Promega | Cat#W1220 |
| ERCC ExFold RNA spike-in mixes | Thermo Fisher Scientific | Cat#4456739 |
| Direct-Zol RNA miniprep plus kit | Zymo Research | Cat#R2073 |
| Quick-RNA Miniprep plus kit | Zymo Research | Cat#R1058 |
| SimpleChIP® Enzymatic Chromatin IP Kit | Cell Signaling Technology | Cat#9003 |
| Re-ChIP-IT® kit | Active Motif | Cat#53016 |
| CUTANA™ ChIC/CUT&RUN kit | EpiCypher | Cat#14–1048 |
| AccuClear® Ultra High Sensitivity dsDNA Quantitation Kit with DNA Standards | Biotium | Cat#31028 |
| Lightshift™ Chemiluminescence EMSA kit | Thermo Fisher Scientific | Cat#20148 |
| Deposited data | ||
| CUT&RUN-seq and RNA-seq raw and analyzed data | This paper | GEO: GSE199462, Tables S1–S5 |
| Unprocessed immunoblotting and microscopy images | This paper | Mendeley Data: https://doi.org/10.17632/yt79bs23tx.1 |
| Experimental models: Cell lines | ||
| A2058 | ATCC | Cat# CRL-11147 |
| HeLa | ATCC | Cat# CCL-2 |
| HEK293T | GE Dharmacon | Cat# HCL4517 |
| Immortalized Rosa26-CreERT2; Hsf1fl,fl MEFs | Su et al.35 | N/A |
| Oligonucleotides | ||
| Biotin-labeled consensus E-box dsDNA oligos 5′ -Biotin-GGAAGCAGACCACGTGGTC TGCT TCC-3′ |
Integrated DNA Technologies | N/A |
| WT consensus E-box dsDNA oligos 5′ -GGAAGCAGACCACGTGGTCTGCTTCC-3′ |
Integrated DNA Technologies | N/A |
| Mutant E-box dsDNA oligos 5′-GGAAGCAGACCACGGAGTCTGCTTCC-3′ |
Integrated DNA Technologies | N/A |
| Scrambled E-box dsDNA oligos 5′-ACGGCTCTGATCGAGCCGATCGACTG-3′ |
Integrated DNA Technologies | N/A |
| Non-targeting control siRNAs | Horizon Discovery Ltd. | Cat#D-001210–02-05 |
| Hsf1-targeting siRNAs | Sigma-Aldrich | Cat#SASI_Mm01_00023056 and _00023057 |
| c-Myc-targeting siRNAs | Sigma-Aldrich | Cat# SASI_Mm01_00157474 and _00157475 |
| Gcn5-targeting siRNAs | Sigma-Aldrich | Cat# SASI_Mm01_00159517 and Mm02_00289578 |
| HSF1-targeting siRNAs | Sigma-Aldrich | Cat# SASI_Hs01_00067735 and _Hs02_00339745 |
| c-MYC-targeting siRNAs | Sigma-Aldrich | Cat#SASI_Mm01_00157474 and _00157475 |
| GCN5-targeting siRNAs | Sigma-Aldrich | Cat# SASI_Hs01_00050954 and _00050955 |
| pLKO-scramble shRNA | Tang et al.19 | N/A |
| pLKO-HSF1-targeting shRNA | Tang et al.19 | N/A |
| Primers for qRT-PCR and ChIP-qPCR, see Table S6 for sequences | This paper | N/A |
| Recombinant DNA | ||
| pMYC-SEAP | Takara Bio USA | Cat#631910 |
| pTAL-SEAP | Takara Bio USA | Cat#631910 |
| pCRE-SEAP | Takara Bio USA | Cat#631910 |
| pSRE-SEAP | Takara Bio USA | Cat#631910 |
| pNFAT-SEAP | Takara Bio USA | Cat#631910 |
| pNFkB-SEAP | Takara Bio USA | Cat#631910 |
| pCMV-SEAP | A gift from Alan Cochrane | Addgene plasmid#24595 |
| pEF1α-SEAP | A gift from John Schiller | Addgene plasmid#37326 |
| pCMV-GLuc | Thermo Fisher Scientific | Cat#16147 |
| pBabe-HSF1-FLAG | A gift from Robert Kingston | Addgene plasmid#1948 |
| pMSCV-HA-cMYCT58A | A gift from Scott Lowe | Addgene plasmid#18773 |
| pCherry-HSP90alpha | A gift from Didier Picard | Addgene plasmid#108222 |
| pcDNA3–2xHA-c-MYC | A gift from Martine Roussel | Addgene plasmid#74161 |
| pLX304-LacZ-V5 | A gift from William Hahn | Addgene plasmid#42560 |
| pBabe-LacZ | Su et al.23 | N/A |
| pBabe-HSF11–323 | Su et al.23 | N/A |
| pBabe-HSF1324–529 | Su et al.23 | N/A |
| pLX304-MAX-V5 | DNASU | Cat# HsCD00440967 |
| pDONR221-GCN5 | DNASU | Cat# HsCD00829789 |
| Software and algorithms | ||
| FlowJo | FlowJo, LCC | https://www.flowjo.com/ |
| Fiji (ImageJ) | National Institutes of Health | https://ImageJ.nih.gov/ij/ |
| Prism 9 | GraphPad Software | https://www.graphpad.com/scientific-software/prism/ |
| EpiCypher Cut&Run SEACR pipeline | Basepair Inc. | https://www.basepairtech.com/ |
| RNA-seq Differential Expression (DESeq2) pipeline | Basepair Inc. | https://www.basepairtech.com/ |
| HISAT2 | Kim et al.63 | https://daehwankimlab.github.io/hisat2/ |
| Bowtie2 | Langmead and Salzberg64 | https://partekflow.cit.nih.gov/ |
| MACS2 | Feng et al.65 | https://partekflow.cit.nih.gov/ |
| Enrichr | Chen et al.66 | https://maayanlab.doud/Enrichr/ |
| AME | McLeay and Bailey67 | https://meme-suite.org/meme/doc/ame.html |
| Other | ||
| DMEM 4.5 g/L Glucose w/L-Glutamine | Lonza | Cat# 12–604Q |
| HyClone™ bovine growth serum | HyClone Laboratories | Cat# SH30541.03IR |
| SuperSignal West Pico Plus chemiluminescent substrates | Thermo Fisher Scientific | Cat# 34580 |
| SuperSignal™ West Femto Maximum Sensitivity Substrate | Thermo Fisher Scientific | Cat# 34096 |
| Protein G magnetic beads | Thermo Fisher Scientific | Cat#88847 |
| Glutathione magnetic beads | Thermo Fisher Scientific | Cat#78601 |
| Zeba™ Spin desalting columns, 7K MWCO | Thermo Fisher Scientific | Cat#89883 |
| BLOXALL® endogenous blocking solution | Vector Laboratories | Cat#SP-6000–100 |
| 1-Step™ Ultra TMB-ELISA Substrate Solution | Thermo Fisher Scientific | Cat# 34029 |
| Anti-FLAG Alpha Donor beads | PerkinElmer | Cat#AS103D |
| Streptavidin AlphaLISA® Acceptor beads | PerkinElmer | Cat#AL125C |
| UltraCruz® nitrocellulose pure transfer membrane | Santa Cruz Biotechnology | Cat#sc-3724 |
| Nytran SuperCharge nylon blotting membrane | Cytiva | Cat#10416230 |
EXPERIMENTAL MODELS AND STUDY PARTICIPANT DETAILS
HeLa (female) and A2058 (male) cells were purchased from ATCC; and HEK293T (female) cells were purchased from GE Dharmacon. They were authenticated by ATCC by STR profiling. Immortalized Rosa26-CreERT2; Hsf1fl/fl MEFs (male) were described previously.35 To delete Hsf1, these MEFs were pre-treated with ethanol or 1 mM (Z)-4-Hydroxytamoxifen (4-OHT) for 7 days. A2058 cells stably expressing LacZ or FLAG-HSF1 were described previously.19 All cell cultures were maintained in DMEM supplemented with 10% HyClone bovine growth serum and 1% penicillin–streptomycin. Cells were maintained in an incubator with 5% CO2 at 37°C. All cell lines were routinely tested for mycoplasma contamination using MycoAlert Mycoplasm Detection kits.
METHOD DETAILS
Recombinant proteins
Recombinant proteins were all purchased commercially, including c-MYC/MAX complexes, GST, GST-HSF1, His-HSF1, GST-c-MYC, His-c-MYC, His-GST, FLAG-EHMT2, and FLAG-GCN5.
Transfection and c-MYC dual reporter assays
All plasmids were transfected with TurboFect transfection reagents. HEK293T cells were co-transfected with pMYC-SEAP and pCMV-Gaussia luciferase (GLuc) reporter plasmids, along with various indicated plasmids. After 48 h, reporter activities in culture media were measured. SEAP and GLuc activities in culture supernatants were quantitated using a NovaBright Phospha-Light EXP Assay Kit for SEAP and a Pierce Gaussia Luciferase Glow Assay Kit, respectively. Luminescence signals were measured by a CLARIOstar microplate reader (BMG LABTECH). SEAP activities were normalized against GLuc activities.
siRNA and shRNA knockdown
siRNAs were transfected at 10 nM, except c-Myc siRNAs (100 nM), final concentration using jetPRIME transfection reagents.
Quantitative real-time PCR
Total RNAs were isolated using either Direct-Zol miniprep plus kits or Quick-RNA miniprep plus kits. 1 μg RNAs were used for reverse transcription using Verso cDNA Synthesis Kits. Equal amounts of cDNA were used for quantitative RCR reaction using iTaq Universal SYBR Green supermix. Signals were detected by an Agilent Mx3000P qPCR System (Agilent Genomics). ACTB was used as the internal control. The sequences of individual primers are listed in Table S6.
Immunoblotting and immunoprecipitation
Whole-cell protein extracts were prepared in cold cell-lysis buffer (100 mM NaCl, 30 mM Tris-HCl pH 7.6, 1% Triton X-100, 20 mM sodium fluoride, 1mM EDTA, 1mM sodium orthovanadate, and 1x Halt protease inhibitor cocktail). Proteins were transferred to nitrocellulose membranes. Following incubation with the blocking buffer (5% non-fat milk in 1x TBS-T) for 1 h at RT, membranes were incubated with primary antibodies (1:1,000 dilution in the blocking buffer) overnight at 4°C. After washing with 1xTBS-T for 3 times, membranes were incubated with peroxidase-conjugated secondary antibodies (1: 5000 diluted in the blocking buffer) at RT for 1 h. Signals were detected using SuperSignal West chemiluminescent substrates. For normal Co-IP, 1 mg whole cell lysates were incubated with primary antibodies at 4°C overnight. Either normal rabbit IgG were used as the negative controls. Protein G magnetic beads were used to precipitate primary Abs. After washing with the lysis buffer for 3 times, beads were boiled in 1x loading buffer for 5 min before loading on SDS-PAGE. Chemiluminescent signals were captured by an iBright FL1000 imaging system (ThermoFisher Scientific).
For co-IP of endogenous c-MYC and HSF1, proteins were extracted using a QSonica Q125 sonicator (total process time: 15S, pulse-on time: 5S, pulse-off time: 10S, output intensity: 30%) in 1x sonication buffer (20 mM Tris, 20 mM NaCl, 1 mM EDTA, 20 mM β-glycerol-phosphate, 20 mM sodium fluoride, 4 mM sodium orthovanadate, and 1 mM DTT pH7.4, supplemented with Halt protease inhibitor cocktail). Total 5–8 mg of lysates were used for co-IP using either rabbit anti-MYC (E5Q6W) or anti-HSF1 (D3L8I) antibodies. Mouse anti-rabbit IgG light-chain specific (D4W3E) HRP conjugates were used for immunoblotting detection. To detect MAX, a goat anti-MAX antibody was used. For the co-IP with E-box oligos, 5 mg of lysates were incubated with 6μM various unlabeled E-box oligos with rotation at RT for 1 h. IgG or anti-MYC (E5Q6W) antibodies (1 μg) were added to the lysates and incubated at 4°C overnight with rotation.
In vitro Lumit immunoassays
The storage buffers of recombinant proteins were first changed to 1x Lumit Immunoassay buffer C using Zeba Spin desalting columns (7K MWCO). For each reaction, 10 ng recombinant c-MYC/MAX complexes were incubated at 1:1 M ratio with either recombinant GST or GST-HSF1 proteins in 50 μL 1x Lumit Immunoassay buffer C at RT for 1 h with 200rpm shaking. hen, 50 μL 1x Lumit Immunoassay buffer C containing 150 ng primary antibodies, including a rabbit anti-FLAG antibody in combination with a mouse anti-GST (26H1) antibody for c-MYC-HSF1 interactions, or a mouse anti-FLAG (9A3) antibody in combination with a rabbit anti-His tag (D3I1O) antibody for c-MYC-MAX interactions, and 150 ng Lumit secondary antibodies was added to each well and incubated at RT for 90 min. Following the incubation, 25 μL 1x Lumit Immunoassay buffer C containing Lumit substrate C (1:12.5 dilution) in was added to each well and incubated for 2 min with 400 rpm shaking. The luminescence signals were measured by a SpectraMax iD5 microplate reader (Molecular Device, Inc.).
EMSA
Recombinant proteins first went through buffer exchange to 1xDNA binding buffer (16.7 mM HEPES-NaOH pH7.6, 50 mM NaCl, 0.17 mM MgCl2) using Zeba micro spin desalting columns (7K MWCO). For each 10 μL reaction, 200 ng c-MYC/MAX dimers were incubated with GST or GST-HSF1 proteins at a 1:1 M ratio at 22°C for 30 min. Following incubation with biotin-labeled E-box oligos (final 10 nM) for another 30 min at 22°C, reaction mixtures were mixed with 5xloading buffer and loaded onto 5% TBE gels for electrophoresis using pre-cooled 0.5x TBE running buffer. For the supershift experiments, 1μL of normal rabbit and mouse IgG mix, rabbit anti-MYC (D3N8F) or mouse anti-GST (26H1) antibodies were incubated with recombinant proteins together. For the competition experiments, unlabeled oligos (final 1μM) were added immediately before the biotin-labeled E-box probes. Electrophoresed oligos were then transferred to Nytran SPC nylon blotting membranes using 1xTBE buffer. Following UV crosslinking, the mobility shift of biotin-labeled E-box probes was detected using a LightShift Chemiluminescent EMSA kit, according to the manufacturer’ instructions.
AlphaLISA assay
Following buffer exchange to 1x reaction buffer (10 mM Tris, 50 mM KCl, 1 mM EDTA, 5% glycerol, pH 7.5) using Zeba micro spin desalting columns (7K MWCO), For a 50 μL reaction, 20 ng recombinant c-MYC/MAX complexes were incubated with either GST or GST-HSF1 proteins at a 1:1 M ratio in 1X reaction buffer at RT for 45 min. Biotin-labeled E-box dsDNA oligos (10 nM final) were added to the mixtures. After incubation at RT for 30 min, 12.5 μL of Streptavidin AlphaLISA Acceptor beads were added and incubated at RT for 1 h. Finally, 12.5 μL of anti-FLAG Alpha Donor beads were added and incubated at RT for 1 h. The AlphaLISA signals were measured using a BioTek Synergy Neo2 microplate reader (Agilent Technologies, Inc.).
In vitro recombinant protein pull-down assay
400ng recombinant His-HSF1, FLAG-GCN5, FLAG-EHMT2, GST-MYC or His-GST were diluted in 400 μL reaction buffer (25mM Tris-HCL 100mM NaCl, 0.5% Triton X-100, pH7.5), followed by incubation for 3 h at 4°C. For the GST pulldown, glutathione magnetic beads were added and incubated at RT for 2 h. For the other pulldowns, either rabbit anti-HSF1 (H-311) or rabbit anti-FLAG antibodies were added to the mixtures and incubated for 3 h at 4°C, followed by incubation with protein G magnetic beads for 2 h at 4°C. Magnetic beads were collected and washed with reaction buffer, followed by protein elution (boiled in 1x sample buffer) and western blotting.
Proximity ligation assay
Cells were fixed with 4% formaldehyde in PBS for 15 min at RT. After blocking with 5% goat or horse serum in PBS with 0.3% Triton X-100, cells were incubated with a pair of indicated rabbit, mouse, or goat primary antibodies (1:100 diluted in the blocking buffer) overnight at 4°C. Following incubation with Duolink PLA anti-rabbit Plus, anti-mouse Minus, or anti-goat Minus probes at 37°C for 1 h, ligation, rolling circle amplification, and detection were performed using Duolink In Situ Detection Reagents Red. Nuclei were stained with Hoechst 33342. Signals were visualized using a Zeiss LSM780 confocal microscope. For brightfield PLA, detection was performed using Duolink In Situ Detection Reagents Brightfield.
For the c-MYC-gDNA PLA, a rabbit anti-c-MYC (D3N8F) antibody was combined with a mouse anti-dsDNA (HYB331–01) antibody. For the c-MYC-HSF1 PLA, either a rabbit anti-c-MYC (D3N8F) antibody was combined with a mouse anti-HSF1 (E–4) antibody or a goat anti-c-MYC was combined with a rabbit anti-HSF1 (D3L8I) antibody. For the c-MYC-GCN5 PLA, a goat anti-c-MYC antibody was combined with a rabbit anti-GCN5 (C26A10) antibody. For the FLAG-HSF1-c-MYC PLA, a mouse anti-FLAG (9A3) antibody (was combined with a rabbit anti-c-MYC (D3N8F) antibody. For the FLAG-HSF1-GCN5 PLA, a rabbit anti-GCN5 (C26A10) antibody was combined with a mouse a mouse anti-FLAG (9A3) antibody.
In-cell PLA ELISA
To circumvent the autofluorescence owing to cell death following HSF1 knockdown, PLA was performed in the ELISA format using the Duolink In Situ Detection Reagent Brightfield. In brief, HeLa cells were seeded in 96-well culture plates at 5000–7000 cells/well and allowed to grow for 24 h. Cells were transfected in triplicates with Scramble or HSF1-targeting shRNA plasmids using jetPRIME in vitro DNA and siRNA transfection reagents. After 72 h of transfection, cells were fixed in 4% formaldehyde at RT for 10 min, followed by permeabilization with 0.3% Triton X-100 in PBS at RT for 10 min. Following quenching endogenous peroxidase activities with BLOXALL endogenous blocking solution at RT for 10 min, wells were washed with 1x washing buffer A and incubated with Duolink blocking solution at 37°C for 1 h. The subsequent procedures followed the standard Duolink PLA brightfield protocol. After the detection step, wells were washed with 1x washing buffer A and incubated with 1-Step Ultra TMB-ELISA Substrate Solution. The ODs were measured at 650 nm in the kinetic mode using a microplate reader. After washing wells with 1x washing buffer A, 0.3% Janus Green B in PBS was added to each well for 5 min at RT to quantitate cell numbers. Following washing with ultrapure water, 0.5M HCl was added and incubated for 10 min at RT. The ODs were measured at 595 nm using a microplate reader. For each well, the OD650nm was normalized by the OD595nm to represent the PLA signals.
Chromatin immunoprecipitation assay
The ChIP assay was performed using a SimpleChIP Enzymatic Chromatin IP Kit following the manufacturer’s instruction. Briefly, ~4x10⁶ cells were fixed with 1% formaldehyde and quenched in glycine. Cells were lysed in extraction buffer to obtain nuclear pellet, followed by incubation with micrococcal nuclease to fragment genomic DNAs. Further sonication is performed to completely lyse the nuclei. Sheared DNAs were immunoprecipitated by normal rabbit IgG, rabbit anti-c-MYC (D3N8F) Abs, or rabbit anti-Acetyl-Histone H3(Lys9/Lys14) Abs, followed by quantitative real-time PCR analysis. The total genomic DNAs immunoprecipitated by c-MYC Abs were measured using an AccuClear Ultra High Sensitivity dsDNA Quantitation Kit, following the manufacturer’s instruction. The sequences of oligos used for ChIP-qPCR are listed in Table S6. For the sequential ChIP, a Re-ChIP-IT kit was used, according to the manufacturer’s instruction.
Detection of MYC/GCN5 binding by ELISA
The HSF1 peptide library was synthesized by GenScript Custom Peptide Synthesis Service. The amino acid sequences of individual peptides are listed in our previous publication.23 Peptides were dissolved in 0.01N NaOH to make 1mM stocks. For detection of c-MYC/GCN5 binding sites, 20 mM HSF1 peptides in 100 μL PBS were coated on an ELISA microplate at 4°C overnight. The plates were blocked with 1% BSA in PBS at RT for 30 min, followed by incubation with 20 ng recombinant c-MYC/MAX complexes or GCN5 proteins in 100 μL PBS-T buffer per well at 4°C overnight. After washing with PBST for 3 times, each well was incubated with Rabbit anti-c-MYC (D3N8F) Abs or Rabbit anti-GCN5 Abs (1:1000 diluted in the blocking buffer) at RT for 3 h. Following washing, each well was incubated with anti-Rabbit IgG (H + L)-HRP conjugates (1:5000 diluted in the blocking buffer) at RT for 1 h. Signals were developed using the 1-Step Ultra TMB-ELISA Substrate Solution.
RNA-seq and data analysis
MEFs were transfected with control or c-Myc-targeting siRNAs for 2 days. MEFs stably expressing LacZ or V5-GCN5 were transfected with control or Hsf1-targeting siRNAs for 2 days. Total RNAs were extracted from equal numbers of cells (3.13x10⁵ or 5x10⁵) using a Direct-zol RNA miniprep plus kit or Quick-RNA miniprep plus kit. 1.5 μL of ERCC ExFold RNA spike-in mix 1 (1: 100 dilution) was added to each siControl RNA sample and 1.5 μL of mix 2 (1:100 dilution) was added to each siHsf1 or siMyc RNA sample. Libraries were prepared with rRNA depletion and sequenced with an Illumina HiSeq 2500 system. Filtered raw data were mapped to the reference genome using HISAT2.63 RUVseq package was used to normalize the data.68 DESeq2 was used to analyze the DEG (padj<=0.05 |log2FoldChange|≥0.0 are set as threshold).69 Hierarchical clustering was performed using the FPKMs of transcripts. Pathway enrichment analyses were performed using Enrichr.66
CUT&RUN-seq and ChIP-seq
Cut&Run experiments were performed using a CUTANA ChIC/CUT&RUN kit according to the manufacturer’s instructions. Briefly, proliferating MEFs were crosslinked with 1% formaldehyde in PBS for 1 min on culture plates. After quenching with glycine, cells were scraped off the plates and counted. 5x10⁵ crosslinked cells were used for each sample. For the IgG control, both Hsf1WT and Hsf1CKO MEFs were mixed at a 1:1 ratio and incubated with rabbit IgG negative control antibodies. For the experimental groups, either Hsf1WT or Hsf1CKO MEFs (two biological replicates each group) were incubated with rabbit anti-c-MYC (D3N8F) Abs. Of note, wash, cell permeabilization, and antibody buffers were all supplemented with 1% Triton X-100 and 0.05% SDS. Reversing cross-links was achieved by adding 0.8 μL of 10% SDS and 1 μL of 20 μg/μL Proteinase K to each sample and incubated at 55°C overnight. Following purification, 0.5 ng E. coli spike-in DNAs were added to each eluted DNA sample. Total 10 ng DNAs each sample were used to generate sequencing libraries using a NEBNext Ultra II DNA Library Prep Kit for Illumina. The clustering of indexed samples was performed using a TruSeq PE Cluster kit v3-cBot-HS. The library preparations were sequenced on an Illumina HiSeq 2500 system to generate 150 bp paired-end reads. The sequencing data were analyzed using the EpiCypher Cut&Run SEACR pipeline (Basepair Inc.). Briefly, following trimming, the raw sequencing reads were aligned to the mouse (GRCm38/mm10) and E. coli (strain K-12 MG1655) reference genomes respectively using Bowtie2.64 Subsequently, CUT&RUN peaks were called using SEACR with the stringent and spike-in normalization settings.70 As a comparison, CUT&RUN peaks were also called using MACS2,65 which results in much fewer peaks (5075 for WT and 2198 for CKO). The motif enrichment analyses were performed using AME.67
The ChIP-seq experiments and data analyses were done through a contract with the Active Motif Epigenetic Services (Active Motif, Inc.). Briefly, equal amounts of sonicated chromatins from two biological replicates were used for ChIP using the same anti-c-MYC antibodies. Input chromatins were sequenced as the control. Paired-end reads were aligned to the mouse (GRCm38/mm10) reference genome using Bowtie2 and ChIP-seq peaks were called using MACS2.
QUANTIFICATION AND STATISTICAL ANALYSIS
Statistical analyses were performed using Prism GraphPad 8.0 (GraphPad Software). The detailed statistical methods and sample sizes are provided in the figure legends. All results are expressed as mean ± SD, mean ± SEM, or median ± IQR. The statistical significance is defined as: *p < 0.05, **p < 0.01; ***p < 0.001; ****p < 0.0001; n.s.: not significant. For in vitro experiments, sample size required was not determined a priori. The experiments were not randomized.
Supplementary Material
Highlights.
c-MYC and HSF1 comprise a transcription factor complex without heat stress
HSF1 physically couples c-MYC and GCN5 to promote histone acetylation
HSF1 association strengthens the genome-wide DNA binding of c-MYC
HSF1 augments the c-MYC-mediated transcriptional program
ACKNOWLEDGMENTS
We would like to thank the Optical Microscopy and Image Analysis lab (OMAL) for their assistance with the confocal microscopy studies. Schematic illustrations are created with BioRender.com. This work was supported by the National Institutes of Health (NIH) (1DP2OD007070 to C.D.) and by the Intramural Research Program of the NIH, National Cancer Institute, Center for Cancer Research (1ZIABC011767). The content of this publication does not necessarily reflect the views or policies of the Department of Health and Human Services, nor does mention of trade names, commercial products, or organizations imply endorsement by the US government.
Footnotes
SUPPLEMENTAL INFORMATION
Supplemental information can be found online at https://doi.org/10.1016/j.celrep.2023.112557.
DECLARATION OF INTERESTS
The authors declare no competing interests.
REFERENCES
- 1.Dang CV (2012). MYC on the path to cancer. Cell 149, 22–35. 10.1016/j.cell.2012.03.003. [DOI] [PMC free article] [PubMed] [Google Scholar]
- 2.Eilers M, and Eisenman RN (2008). Myc’s broad reach. Genes Dev. 22, 2755–2766. 10.1101/gad.1712408. [DOI] [PMC free article] [PubMed] [Google Scholar]
- 3.Kuzyk A, and Mai S (2014). c-MYC-induced genomic instability. Cold Spring Harb. Perspect. Med 4, a014373. 10.1101/cshperspect.a014373. [DOI] [PMC free article] [PubMed] [Google Scholar]
- 4.Vita M, and Henriksson M (2006). The Myc oncoprotein as a therapeutic target for human cancer. Semin. Cancer Biol 16, 318–330. 10.1016/j.semcancer.2006.07.015. [DOI] [PubMed] [Google Scholar]
- 5.Okita K, and Yamanaka S (2011). Induced pluripotent stem cells: opportunities and challenges. Philos. Trans. R. Soc. Lond. B Biol. Sci 366, 2198–2207. 10.1098/rstb.2011.0016. [DOI] [PMC free article] [PubMed] [Google Scholar]
- 6.Blackwood EM, and Eisenman RN (1991). Max: a helix-loop-helix zipper protein that forms a sequence-specific DNA-binding complex with Myc. Science 251, 1211–1217. 10.1126/science.2006410. [DOI] [PubMed] [Google Scholar]
- 7.McMahon SB, Wood MA, and Cole MD (2000). The essential cofactor TRRAP recruits the histone acetyltransferase hGCN5 to c-Myc. Mol. Cell Biol 20, 556–562. 10.1128/MCB.20.2.556-562.2000. [DOI] [PMC free article] [PubMed] [Google Scholar]
- 8.Liu X, Tesfai J, Evrard YA, Dent SYR, and Martinez E (2003). c-Myc transformation domain recruits the human STAGA complex and requires TRRAP and GCN5 acetylase activity for transcription activation. J. Biol. Chem 278, 20405–20412. 10.1074/jbc.M211795200. [DOI] [PMC free article] [PubMed] [Google Scholar]
- 9.Jin Q, Yu LR, Wang L, Zhang Z, Kasper LH, Lee JE, Wang C, Brindle PK, Dent SYR, and Ge K (2011). Distinct roles of GCN5/PCAF-mediated H3K9ac and CBP/p300-mediated H3K18/27ac in nuclear receptor transactivation. EMBO J. 30, 249–262. 10.1038/emboj.2010.318. [DOI] [PMC free article] [PubMed] [Google Scholar]
- 10.Cieniewicz AM, Moreland L, Ringel AE, Mackintosh SG, Raman A, Gilbert TM, Wolberger C, Tackett AJ, and Taverna SD (2014). The bromodomain of Gcn5 regulates site specificity of lysine acetylation on histone H3. Mol. Cell. Proteomics 13, 2896–2910. 10.1074/mcp.M114.038174. [DOI] [PMC free article] [PubMed] [Google Scholar]
- 11.Eberharter A, and Becker PB (2002). Histone acetylation: a switch between repressive and permissive chromatin. Second in review series on chromatin dynamics. EMBO Rep. 3, 224–229. 10.1093/embo-reports/kvf053. [DOI] [PMC free article] [PubMed] [Google Scholar]
- 12.Morimoto RI (2011). The heat shock response: systems biology of proteotoxic stress in aging and disease. Cold Spring Harbor Symp. Quant. Biol 76, 91–99. 10.1101/sqb.2012.76.010637. [DOI] [PubMed] [Google Scholar]
- 13.Gomez-Pastor R, Burchfiel ET, and Thiele DJ (2018). Regulation of heat shock transcription factors and their roles in physiology and disease. Nat. Rev. Mol. Cell Biol 19, 4–19. 10.1038/nrm.2017.73. [DOI] [PMC free article] [PubMed] [Google Scholar]
- 14.Anckar J, and Sistonen L (2011). Regulation of HSF1 function in the heat stress response: implications in aging and disease. Annu. Rev. Biochem 80, 1089–1115. 10.1146/annurev-biochem-060809-095203. [DOI] [PubMed] [Google Scholar]
- 15.Mahat DB, Salamanca HH, Duarte FM, Danko CG, and Lis JT (2016). Mammalian heat shock response and mechanisms underlying its genome-wide transcriptional regulation. Mol. Cell 62, 63–78. 10.1016/j.molcel.2016.02.025. [DOI] [PMC free article] [PubMed] [Google Scholar]
- 16.Vihervaara A, Mahat DB, Guertin MJ, Chu T, Danko CG, Lis JT, and Sistonen L (2017). Transcriptional response to stress is pre-wired by promoter and enhancer architecture. Nat. Commun 8, 255. 10.1038/s41467-017-00151-0. [DOI] [PMC free article] [PubMed] [Google Scholar]
- 17.Min JN, Huang L, Zimonjic DB, Moskophidis D, and Mivechi NF (2007). Selective suppression of lymphomas by functional loss of Hsf1 in a p53-deficient mouse model for spontaneous tumors. Oncogene 26, 5086–5097. 10.1038/sj.onc.1210317. [DOI] [PubMed] [Google Scholar]
- 18.Dai C, Whitesell L, Rogers AB, and Lindquist S (2007). Heat shock factor 1 is a powerful multifaceted modifier of carcinogenesis. Cell 130, 1005–1018. 10.1016/j.cell.2007.07.020. [DOI] [PMC free article] [PubMed] [Google Scholar]
- 19.Tang Z, Dai S, He Y, Doty RA, Shultz LD, Sampson SB, and Dai C (2015). MEK guards proteome stability and inhibits tumor-suppressive amyloidogenesis via HSF1. Cell 160, 729–744. 10.1016/j.cell.2015.01.028. [DOI] [PMC free article] [PubMed] [Google Scholar]
- 20.Meng L, Gabai VL, and Sherman MY (2010). Heat-shock transcription factor HSF1 has a critical role in human epidermal growth factor receptor-2-induced cellular transformation and tumorigenesis. Oncogene 29, 5204–5213. 10.1038/onc.2010.277. [DOI] [PMC free article] [PubMed] [Google Scholar]
- 21.Khaleque MA, Bharti A, Sawyer D, Gong J, Benjamin IJ, Stevenson MA, and Calderwood SK (2005). Induction of heat shock proteins by heregulin beta1 leads to protection from apoptosis and anchorage-independent growth. Oncogene 24, 6564–6573. 10.1038/sj.onc.1208798. [DOI] [PubMed] [Google Scholar]
- 22.Jin X, Moskophidis D, and Mivechi NF (2011). Heat shock transcription factor 1 is a key determinant of HCC development by regulating hepatic steatosis and metabolic syndrome. Cell Metabol. 14, 91–103. 10.1016/j.cmet.2011.03.025. [DOI] [PMC free article] [PubMed] [Google Scholar]
- 23.Su KH, Dai S, Tang Z, Xu M, and Dai C (2019). Heat shock factor 1 is a direct antagonist of AMP-activated protein kinase. Mol. Cell 76, 546–561.e8. 10.1016/j.molcel.2019.08.021. [DOI] [PMC free article] [PubMed] [Google Scholar]
- 24.Yang T, Ren C, Lu C, Qiao P, Han X, Wang L, Wang D, Lv S, Sun Y, and Yu Z (2019). Phosphorylation of HSF1 by PIM2 induces PD-L1 expression and promotes tumor growth in breast cancer. Cancer Res. 79, 5233–5244. 10.1158/0008-5472.CAN-19-0063. [DOI] [PubMed] [Google Scholar]
- 25.Davis AC, Wims M, Spotts GD, Hann SR, and Bradley A (1993). A null c-myc mutation causes lethality before 10.5 days of gestation in homozygotes and reduced fertility in heterozygous female mice. Genes Dev. 7, 671–682. 10.1101/gad.7.4.671. [DOI] [PubMed] [Google Scholar]
- 26.Xiao X, Zuo X, Davis AA, McMillan DR, Curry BB, Richardson JA, and Benjamin IJ (1999). HSF1 is required for extra-embryonic development, postnatal growth and protection during inflammatory responses in mice. EMBO J. 18, 5943–5952. 10.1093/emboj/18.21.5943. [DOI] [PMC free article] [PubMed] [Google Scholar]
- 27.Yao J, Weremowicz S, Feng B, Gentleman RC, Marks JR, Gelman R, Brennan C, and Polyak K (2006). Combined cDNA array comparative genomic hybridization and serial analysis of gene expression analysis of breast tumor progression. Cancer Res. 66, 4065–4078. 10.1158/0008-5472.CAN-05-4083. [DOI] [PubMed] [Google Scholar]
- 28.Brusselaers N, Ekwall K, and Durand-Dubief M (2019). Copy number of 8q24.3 drives HSF1 expression and patient outcome in cancer: an individual patient data meta-analysis. Hum. Genom 13, 54. 10.1186/s40246-019-0241-3. [DOI] [PMC free article] [PubMed] [Google Scholar]
- 29.Tang Z, Kang B, Li C, Chen T, and Zhang Z (2019). GEPIA2: an enhanced web server for large-scale expression profiling and interactive analysis. Nucleic Acids Res. 47, W556–W560. 10.1093/nar/gkz430. [DOI] [PMC free article] [PubMed] [Google Scholar]
- 30.Bahram F, von der Lehr N, Cetinkaya C, and Larsson LG (2000). c-Myc hot spot mutations in lymphomas result in inefficient ubiquitination and decreased proteasome-mediated turnover. Blood 95, 2104–2110. 10.1182/blood.V95.6.2104. [DOI] [PubMed] [Google Scholar]
- 31.Lee J, Zhang LL, Wu W, Guo H, Li Y, Sukhanova M, Venkataraman G, Huang S, Zhang H, Alikhan M, et al. (2018). Activation of MYC, a bona fide client of HSP90, contributes to intrinsic ibrutinib resistance in mantle cell lymphoma. Blood Adv. 2, 2039–2051. 10.1182/bloodadvances.2018016048. [DOI] [PMC free article] [PubMed] [Google Scholar]
- 32.Dai S, Tang Z, Cao J, Zhou W, Li H, Sampson S, and Dai C (2015). Suppression of the HSF1-mediated proteotoxic stress response by the metabolic stress sensor AMPK. EMBO J. 34, 275–293. 10.15252/embj.201489062. [DOI] [PMC free article] [PubMed] [Google Scholar]
- 33.Han H, Jain AD, Truica MI, Izquierdo-Ferrer J, Anker JF, Lysy B, Sagar V, Luan Y, Chalmers ZR, Unno K, et al. (2019). Small-molecule MYC inhibitors suppress tumor growth and enhance immunotherapy. Cancer Cell 36, 483–497.e15. 10.1016/j.ccell.2019.10.001. [DOI] [PMC free article] [PubMed] [Google Scholar]
- 34.Dang CV (1999). c-Myc target genes involved in cell growth, apoptosis, and metabolism. Mol. Cell Biol 19, 1–11. 10.1128/MCB.19.1.1. [DOI] [PMC free article] [PubMed] [Google Scholar]
- 35.Su KH, Cao J, Tang Z, Dai S, He Y, Sampson SB, Benjamin IJ, and Dai C (2016). HSF1 critically attunes proteotoxic stress sensing by mTORC1 to combat stress and promote growth. Nat. Cell Biol 18, 527–539. 10.1038/ncb3335. [DOI] [PMC free article] [PubMed] [Google Scholar]
- 36.Henrion AA, Vaulont S, Raymondjean M, and Kahn A (1996). Mouse USF1 gene cloning: comparative organization within the c-myc gene family. Mamm. Genome 7, 803–809. 10.1007/s003359900241. [DOI] [PubMed] [Google Scholar]
- 37.Skene PJ, and Henikoff S (2017). An efficient targeted nuclease strategy for high-resolution mapping of DNA binding sites. Elife 6, e21856. 10.7554/eLife.21856. [DOI] [PMC free article] [PubMed] [Google Scholar]
- 38.Varlakhanova NV, and Knoepfler PS (2009). Acting locally and globally: myc’s ever-expanding roles on chromatin. Cancer Res. 69, 7487–7490. 10.1158/0008-5472.CAN-08-4832. [DOI] [PubMed] [Google Scholar]
- 39.Hwang BB, Engel L, Goueli SA, and Zegzouti H (2020). A homogeneous bioluminescent immunoassay to probe cellular signaling pathway regulation. Commun. Biol 3, 8. 10.1038/s42003-019-0723-9. [DOI] [PMC free article] [PubMed] [Google Scholar]
- 40.Lai JS, and Herr W (1992). Ethidium bromide provides a simple tool for identifying genuine DNA-independent protein associations. Proc. Natl. Acad. Sci. USA 89, 6958–6962. 10.1073/pnas.89.15.6958. [DOI] [PMC free article] [PubMed] [Google Scholar]
- 41.Wang L, Koutelou E, Hirsch C, McCarthy R, Schibler A, Lin K, Lu Y, Jeter C, Shen J, Barton MC, and Dent SYR (2018). GCN5 regulates FGF signaling and activates selective MYC target genes during early embryoid body differentiation. Stem Cell Rep. 10, 287–299. 10.1016/j.stemcr.2017.11.009. [DOI] [PMC free article] [PubMed] [Google Scholar]
- 42.Lonard DM, Tsai SY, and O’Malley BW (2004). Selective estrogen receptor modulators 4-hydroxytamoxifen and raloxifene impact the stability and function of SRC-1 and SRC-3 coactivator proteins. Mol. Cell Biol 24, 14–24. 10.1128/MCB.24.1.14-24.2004. [DOI] [PMC free article] [PubMed] [Google Scholar]
- 43.Haggerty TJ, Zeller KI, Osthus RC, Wonsey DR, and Dang CV (2003). A strategy for identifying transcription factor binding sites reveals two classes of genomic c-Myc target sites. Proc. Natl. Acad. Sci. USA 100, 5313–5318. 10.1073/pnas.0931346100. [DOI] [PMC free article] [PubMed] [Google Scholar]
- 44.Tachibana M, Sugimoto K, Nozaki M, Ueda J, Ohta T, Ohki M, Fukuda M, Takeda N, Niida H, Kato H, and Shinkai Y (2002). G9a histone methyltransferase plays a dominant role in euchromatic histone H3 lysine 9 methylation and is essential for early embryogenesis. Genes Dev. 16, 1779–1791. 10.1101/gad.989402. [DOI] [PMC free article] [PubMed] [Google Scholar]
- 45.Guenther MG, Levine SS, Boyer LA, Jaenisch R, and Young RA (2007). A chromatin landmark and transcription initiation at most promoters in human cells. Cell 130, 77–88. 10.1016/j.cell.2007.05.042. [DOI] [PMC free article] [PubMed] [Google Scholar]
- 46.Karmodiya K, Krebs AR, Oulad-Abdelghani M, Kimura H, and Tora L (2012). H3K9 and H3K14 acetylation co-occur at many gene regulatory elements, while H3K14ac marks a subset of inactive inducible promoters in mouse embryonic stem cells. BMC Genom. 13, 424. 10.1186/1471-2164-13-424. [DOI] [PMC free article] [PubMed] [Google Scholar]
- 47.Panne D (2008). The enhanceosome. Curr. Opin. Struct. Biol 18, 236–242. 10.1016/j.sbi.2007.12.002. [DOI] [PubMed] [Google Scholar]
- 48.Rahl PB, and Young RA (2014). MYC and transcription elongation. Cold Spring Harb. Perspect. Med 4, a020990. 10.1101/cshperspect.a020990. [DOI] [PMC free article] [PubMed] [Google Scholar]
- 49.Kress TR, Sabò A, and Amati B (2015). MYC: connecting selective transcriptional control to global RNA production. Nat. Rev. Cancer 15, 593–607. 10.1038/nrc3984. [DOI] [PubMed] [Google Scholar]
- 50.Pellanda P, Dalsass M, Filipuzzi M, Loffreda A, Verrecchia A, Castillo Cano V, Thabussot H, Doni M, Morelli MJ, Soucek L, et al. (2021). Integrated requirement of non-specific and sequence-specific DNA binding in Myc-driven transcription. EMBO J. 40, e105464. 10.15252/embj.2020105464. [DOI] [PMC free article] [PubMed] [Google Scholar]
- 51.Fujimoto M, Takii R, Matsumoto M, Okada M, Nakayama KI, Nakato R, Fujiki K, Shirahige K, and Nakai A (2022). HSF1 phosphorylation establishes an active chromatin state via the TRRAP-TIP60 complex and promotes tumorigenesis. Nat. Commun 13, 4355. 10.1038/s41467-022-32034-4. [DOI] [PMC free article] [PubMed] [Google Scholar]
- 52.Konermann S, Brigham MD, Trevino AE, Joung J, Abudayyeh OO, Barcena C, Hsu PD, Habib N, Gootenberg JS, Nishimasu H, et al. (2015). Genome-scale transcriptional activation by an engineered CRISPR-Cas9 complex. Nature 517, 583–588. 10.1038/nature14136. [DOI] [PMC free article] [PubMed] [Google Scholar]
- 53.Zhang N, Ichikawa W, Faiola F, Lo SY, Liu X, and Martinez E (2014). MYC interacts with the human STAGA coactivator complex via multivalent contacts with the GCN5 and TRRAP subunits. Biochim. Biophys. Acta 1839, 395–405. 10.1016/j.bbagrm.2014.03.017. [DOI] [PMC free article] [PubMed] [Google Scholar]
- 54.Li J, Chauve L, Phelps G, Brielmann RM, and Morimoto RI (2016). E2F coregulates an essential HSF developmental program that is distinct from the heat-shock response. Genes Dev. 30, 2062–2075. 10.1101/gad.283317.116. [DOI] [PMC free article] [PubMed] [Google Scholar]
- 55.Hoj JP, Mayro B, and Pendergast AM (2020). The ABL2 kinase regulates an HSF1-dependent transcriptional program required for lung adenocarcinoma brain metastasis. Proc. Natl. Acad. Sci. USA 117, 33486–33495. 10.1073/pnas.2007991117. [DOI] [PMC free article] [PubMed] [Google Scholar]
- 56.Fujimoto M, Takii R, Takaki E, Katiyar A, Nakato R, Shirahige K, and Nakai A (2017). The HSF1-PARP13-PARP1 complex facilitates DNA repair and promotes mammary tumorigenesis. Nat. Commun 8, 1638. 10.1038/s41467-017-01807-7. [DOI] [PMC free article] [PubMed] [Google Scholar]
- 57.Mendillo ML, Santagata S, Koeva M, Bell GW, Hu R, Tamimi RM, Fraenkel E, Ince TA, Whitesell L, and Lindquist S (2012). HSF1 drives a transcriptional program distinct from heat shock to support highly malignant human cancers. Cell 150, 549–562. 10.1016/j.cell.2012.06.031. [DOI] [PMC free article] [PubMed] [Google Scholar]
- 58.Dai C, Santagata S, Tang Z, Shi J, Cao J, Kwon H, Bronson RT, Whitesell L, and Lindquist S (2012). Loss of tumor suppressor NF1 activates HSF1 to promote carcinogenesis. J. Clin. Invest 122, 3742–3754. 10.1172/JCI62727. [DOI] [PMC free article] [PubMed] [Google Scholar]
- 59.Fok JHL, Hedayat S, Zhang L, Aronson LI, Mirabella F, Pawlyn C, Bright MD, Wardell CP, Keats JJ, De Billy E, et al. (2018). HSF1 is essential for myeloma cell survival and A promising therapeutic target. Clin. Cancer Res 24, 2395–2407. 10.1158/1078-0432.CCR-17-1594. [DOI] [PMC free article] [PubMed] [Google Scholar]
- 60.Dong B, Jaeger AM, Hughes PF, Loiselle DR, Hauck JS, Fu Y, Haystead TA, Huang J, and Thiele DJ (2020). Targeting therapy-resistant prostate cancer via a direct inhibitor of the human heat shock transcription factor 1. Sci. Transl. Med 12, eabb5647. 10.1126/scitranslmed.abb5647. [DOI] [PMC free article] [PubMed] [Google Scholar]
- 61.Wang B, Lee CW, Witt A, Thakkar A, and Ince TA (2015). Heat shock factor 1 induces cancer stem cell phenotype in breast cancer cell lines. Breast Cancer Res. Treat 153, 57–66. 10.1007/s10549-015-3521-1. [DOI] [PMC free article] [PubMed] [Google Scholar]
- 62.Carpenter RL, Sirkisoon S, Zhu D, Rimkus T, Harrison A, Anderson A, Paw I, Qasem S, Xing F, Liu Y, et al. (2017). Combined inhibition of AKT and HSF1 suppresses breast cancer stem cells and tumor growth. Oncotarget 8, 73947–73963. 10.18632/oncotarget.18166. [DOI] [PMC free article] [PubMed] [Google Scholar]
- 63.Kim D, Langmead B, and Salzberg SL (2015). HISAT: a fast spliced aligner with low memory requirements. Nat. Methods 12, 357–360. 10.1038/nmeth.3317. [DOI] [PMC free article] [PubMed] [Google Scholar]
- 64.Langmead B, and Salzberg SL (2012). Fast gapped-read alignment with Bowtie 2. Nat. Methods 9, 357–359. 10.1038/nmeth.1923. [DOI] [PMC free article] [PubMed] [Google Scholar]
- 65.Feng J, Liu T, Qin B, Zhang Y, and Liu XS (2012). Identifying ChIP-seq enrichment using MACS. Nat. Protoc 7, 1728–1740. 10.1038/nprot.2012.101. [DOI] [PMC free article] [PubMed] [Google Scholar]
- 66.Chen EY, Tan CM, Kou Y, Duan Q, Wang Z, Meirelles GV, Clark NR, and Ma’ayan A (2013). Enrichr: interactive and collaborative HTML5 gene list enrichment analysis tool. BMC Bioinf. 14, 128. 10.1186/1471-2105-14-128. [DOI] [PMC free article] [PubMed] [Google Scholar]
- 67.McLeay RC, and Bailey TL (2010). Motif Enrichment Analysis: a unified framework and an evaluation on ChIP data. BMC Bioinf. 11, 165. 10.1186/1471-2105-11-165. [DOI] [PMC free article] [PubMed] [Google Scholar]
- 68.Risso D, Ngai J, Speed TP, and Dudoit S (2014). Normalization of RNA-seq data using factor analysis of control genes or samples. Nat. Biotechnol 32, 896–902. 10.1038/nbt.2931. [DOI] [PMC free article] [PubMed] [Google Scholar]
- 69.Love MI, Huber W, and Anders S (2014). Moderated estimation of fold change and dispersion for RNA-seq data with DESeq2. Genome Biol. 15, 550. 10.1186/s13059-014-0550-8. [DOI] [PMC free article] [PubMed] [Google Scholar]
- 70.Meers MP, Tenenbaum D, and Henikoff S (2019). Peak calling by sparse enrichment analysis for CUT&RUN chromatin profiling. Epigenet. Chromatin 12, 42. 10.1186/s13072-019-0287-4. [DOI] [PMC free article] [PubMed] [Google Scholar]
Associated Data
This section collects any data citations, data availability statements, or supplementary materials included in this article.
Supplementary Materials
Data Availability Statement
The CUT&RUN-seq and RNA-seq data generated in this study have been deposited at GEO and are publicly available as of the date of publication. Accession number is listed in the key resources table. The original western blotting and microscopy images reported in this study have been deposited at Mendeley and are publicly available as of the date of publication. The DOI is listed in the key resources table.
This study does not report original code.
Any additional information required to reanalyze the data reported in this paper is available from the lead contact upon request.
KEY RESOURCES TABLE
| REAGENT or RESOURCE | SOURCE | IDENTIFIER |
|---|---|---|
| Antibodies | ||
| Rabbit anti-FLAG antibody | Cell Signaling Technology | Cat#14793S; RRID: AB_2572291 |
| Mouse anti-GST (26H1) antibody | Cell Signaling Technology | Cat# 2624S; RRID: AB_2189875 |
| Mouse anti-FLAG (9A3) antibody | Cell Signaling Technology | Cat#8146S; RRID: AB_10950495 |
| Rabbit anti-His tag (D3I1O) antibody | Cell Signaling Technology | Cat#12698S; RRID: AB_2744546 |
| Rabbit anti-c-MYC (D3N8F) antibody | Cell Signaling Technology | Cat#13987S; RRID: AB_2631168 |
| Rabbit anti-GCN5 (C26A10) antibody | Cell Signaling Technology | Cat#3305S; RRID: AB_2128281 |
| Rabbit anti-Acetyl-Histone H3(Lys9/Lys14) | Cell Signaling Technology | Cat#9677S; RRID: AB_1147653 |
| Rabbit anti-HSF1 (D3L8I) antibody | Cell Signaling Technology | Cat#12972S; RRID: AB_2798072 |
| Rabbit anti-c-MYC (E5Q6W) antibody | Cell Signaling Technology | Cat#18583S; RRID: AB_2895543 |
| Mouse anti-dsRNA (J2) antibody | Cell Signaling Technology | Cat#76651L; RRID: N/A |
| Rabbit anti-Acetylated-Lysine (Ac-K2-100) | Cell Signaling Technology | Cat#9814S; RRID: AB_10544700 |
| Rabbit (DA1E) IgG isotype control | Cell Signaling Technology | Cat#3900S; RRID: AB_1550038 |
| Mouse (E5Y6Q) IgG2a isotype control | Cell Signaling Technology | Cat#61656S; RRID: AB_2799613 |
| Mouse anti-rabbit IgG (light-chain specific) (D4W3E) HRP conjugate | Cell Signaling Technology | Cat#93702S; RRID: AB_2800208 |
| Goat anti-c-MYC antibody | R&D Systems | Cat#AF3696; RRID: AB_2282405 |
| Rabbit anti-USF1 antibody | United States Biological | Cat#214066; RRID: N/A |
| Goat anti-MAX C-term antibody | GeneTex Inc. | Cat#GTX89997; RRID: AB_10733434 |
| Mouse Anti-Beta Actin (GT5512) antibody | GeneTex Inc. | Cat#GTX629630; RRID: AB_2728646 |
| Rabbit anti-HSF1 (H-311) | Santa Cruz Biotechnology | Cat#sc-9144; RRID: AB_2120276 |
| Mouse anti-dsDNA (HYB331–01) antibody | Santa Cruz Biotechnology | Cat#sc-58749; RRID: AB_783088 |
| Mouse anti-HSF1 (E–4) antibody | Santa Cruz Biotechnology | Cat#sc-17757; RRID: AB_627753 |
| ChromPure goat IgG | Jackson Immunoresearch Laboratories | Cat#005–000-003; RRID: AB_2336985 |
| ChromPure rabbit IgG | Jackson Immunoresearch Laboratories | Cat#011–000-003; RRID: AB_2337118 |
| ChromPure mouse IgG | Jackson Immunoresearch Laboratories | Cat#015–000-003; RRID: AB_2337188 |
| Peroxidase-AffiniPure goat anti-mouse IgG (H + L) antibody | Jackson Immunoresearch Laboratories | Cat# 115–035-003; RRID: AB_10015289 |
| Peroxidase-AffiniPure goat anti-rabbit IgG (H + L) antibody | Jackson Immunoresearch Laboratories | Cat# 111–035-003; RRID: AB_2313567 |
| Peroxidase AffiniPure Bovine Anti-Goat IgG (H + L) antibody | Jackson Immunoresearch Laboratories | Cat#805–035-180; RRID: AB_2340874 |
| Goat anti-rabbit IgG (H + L) secondary antibody, Alexa Fluor 488 | ThermoFisher Scientific | Cat#A11034; RRID: AB_2576217 |
| Goat anti-mouse IgG (H + L) secondary antibody, Alexa Fluor 488 | ThermoFisher Scientific | Cat#A11029; RRID: AB_2534088 |
| Duolink® In Situ PLA anti-mouse Minus probes | Sigma-Aldrich | Cat# DUO92004; RRID: AB_2713942 |
| Duolink® In Situ PLA anti-rabbit Plus probes | Sigma-Aldrich | Cat# DUO92002; RRID: AB_2810940 |
| Duolink® In Situ PLA anti-goat Minus probes | Sigma-Aldrich | Cat# DUO92006; RRID: N/A |
| Bacterial and virus strains | ||
| NEB® 5-α Competent E. coli (High Efficiency) | New England Biolabs | Cat# C2987 |
| Chemicals, peptides, and recombinant proteins | ||
| InSolution (Z)-4-Hydroxytamoxifen | Sigma-Aldrich | Cat#5082250001 |
| MYCi361 | TargetMol Chemicals | Cat#T12132 |
| Halt™ Protease Inhibitor Cocktail | Thermo Fisher Scientific | Cat# 78430 |
| Hoechst 33342 | Thermo Fisher Scientific | Cat# H1399 |
| Janus Green B | Thermo Fisher Scientific | Cat#AC191680050 |
| TurboFect transfection reagent | ThermoFisher Scientific | Cat#R0531 |
| JetPRIME® transfection reagents | PolyPlus-transfection® SA | Cat# 101000015 |
| HSF1 peptides | Su et al.23 | Custom order |
| Recombinant GST proteins | SignalChem Lifesciences | Cat# G52–30U |
| Recombinant GST-HSF1 proteins | SignalChem Lifesciences | Cat# H25–30G |
| Recombinant c-MYC/MAX complex | Active Motif | Cat#81087 |
| Recombinant FLAG-GCN5 proteins | Active Motif | Cat#31591 |
| Recombinant FLAG-EHMT2 proteins | Active Motif | Cat#31410 |
| Recombinant His-HSF1 proteins | Enzo Life Sciences | Cat#ADI-SPP-900 |
| Recombinant GST-MYC proteins | Abnova | Cat#H00004609-P01 |
| Recombinant His-c-MYC proteins | RayBiotech | Cat#230–00580-100 |
| Recombinant His-GST proteins | Millipore Sigma | Cat#12–523 |
| Critical commercial assays | ||
| Verso cDNA Synthesis Kit | Thermo Fisher Scientific | Cat#AB1453B |
| iTaq™ Universal SYBR® Green Supermix | Bio-Rad Laboratories | Cat#1725122 |
| Duolink® In Situ PLA Detection Reagents Green | Sigma-Aldrich | Cat# DUO92014 |
| Duolink® In Situ PLA Detection Reagents Red | Sigma-Aldrich | Cat# DUO92008 |
| Duolink® In Situ PLA Detection Reagents Brightfield | Sigma-Aldrich | Cat# DUO92012 |
| NovaBright™ Phospha-Light™ EXP Assay Kit for SEAP | Thermo Fisher Scientific | Cat# N10577 |
| Pierce™ Gaussia Luciferase Glow Assay Kit | Thermo Fisher Scientific | Cat# 16160 |
| Lumit™ Immunoassay Cellular Systems | Promega | Cat#W1220 |
| ERCC ExFold RNA spike-in mixes | Thermo Fisher Scientific | Cat#4456739 |
| Direct-Zol RNA miniprep plus kit | Zymo Research | Cat#R2073 |
| Quick-RNA Miniprep plus kit | Zymo Research | Cat#R1058 |
| SimpleChIP® Enzymatic Chromatin IP Kit | Cell Signaling Technology | Cat#9003 |
| Re-ChIP-IT® kit | Active Motif | Cat#53016 |
| CUTANA™ ChIC/CUT&RUN kit | EpiCypher | Cat#14–1048 |
| AccuClear® Ultra High Sensitivity dsDNA Quantitation Kit with DNA Standards | Biotium | Cat#31028 |
| Lightshift™ Chemiluminescence EMSA kit | Thermo Fisher Scientific | Cat#20148 |
| Deposited data | ||
| CUT&RUN-seq and RNA-seq raw and analyzed data | This paper | GEO: GSE199462, Tables S1–S5 |
| Unprocessed immunoblotting and microscopy images | This paper | Mendeley Data: https://doi.org/10.17632/yt79bs23tx.1 |
| Experimental models: Cell lines | ||
| A2058 | ATCC | Cat# CRL-11147 |
| HeLa | ATCC | Cat# CCL-2 |
| HEK293T | GE Dharmacon | Cat# HCL4517 |
| Immortalized Rosa26-CreERT2; Hsf1fl,fl MEFs | Su et al.35 | N/A |
| Oligonucleotides | ||
| Biotin-labeled consensus E-box dsDNA oligos 5′ -Biotin-GGAAGCAGACCACGTGGTC TGCT TCC-3′ |
Integrated DNA Technologies | N/A |
| WT consensus E-box dsDNA oligos 5′ -GGAAGCAGACCACGTGGTCTGCTTCC-3′ |
Integrated DNA Technologies | N/A |
| Mutant E-box dsDNA oligos 5′-GGAAGCAGACCACGGAGTCTGCTTCC-3′ |
Integrated DNA Technologies | N/A |
| Scrambled E-box dsDNA oligos 5′-ACGGCTCTGATCGAGCCGATCGACTG-3′ |
Integrated DNA Technologies | N/A |
| Non-targeting control siRNAs | Horizon Discovery Ltd. | Cat#D-001210–02-05 |
| Hsf1-targeting siRNAs | Sigma-Aldrich | Cat#SASI_Mm01_00023056 and _00023057 |
| c-Myc-targeting siRNAs | Sigma-Aldrich | Cat# SASI_Mm01_00157474 and _00157475 |
| Gcn5-targeting siRNAs | Sigma-Aldrich | Cat# SASI_Mm01_00159517 and Mm02_00289578 |
| HSF1-targeting siRNAs | Sigma-Aldrich | Cat# SASI_Hs01_00067735 and _Hs02_00339745 |
| c-MYC-targeting siRNAs | Sigma-Aldrich | Cat#SASI_Mm01_00157474 and _00157475 |
| GCN5-targeting siRNAs | Sigma-Aldrich | Cat# SASI_Hs01_00050954 and _00050955 |
| pLKO-scramble shRNA | Tang et al.19 | N/A |
| pLKO-HSF1-targeting shRNA | Tang et al.19 | N/A |
| Primers for qRT-PCR and ChIP-qPCR, see Table S6 for sequences | This paper | N/A |
| Recombinant DNA | ||
| pMYC-SEAP | Takara Bio USA | Cat#631910 |
| pTAL-SEAP | Takara Bio USA | Cat#631910 |
| pCRE-SEAP | Takara Bio USA | Cat#631910 |
| pSRE-SEAP | Takara Bio USA | Cat#631910 |
| pNFAT-SEAP | Takara Bio USA | Cat#631910 |
| pNFkB-SEAP | Takara Bio USA | Cat#631910 |
| pCMV-SEAP | A gift from Alan Cochrane | Addgene plasmid#24595 |
| pEF1α-SEAP | A gift from John Schiller | Addgene plasmid#37326 |
| pCMV-GLuc | Thermo Fisher Scientific | Cat#16147 |
| pBabe-HSF1-FLAG | A gift from Robert Kingston | Addgene plasmid#1948 |
| pMSCV-HA-cMYCT58A | A gift from Scott Lowe | Addgene plasmid#18773 |
| pCherry-HSP90alpha | A gift from Didier Picard | Addgene plasmid#108222 |
| pcDNA3–2xHA-c-MYC | A gift from Martine Roussel | Addgene plasmid#74161 |
| pLX304-LacZ-V5 | A gift from William Hahn | Addgene plasmid#42560 |
| pBabe-LacZ | Su et al.23 | N/A |
| pBabe-HSF11–323 | Su et al.23 | N/A |
| pBabe-HSF1324–529 | Su et al.23 | N/A |
| pLX304-MAX-V5 | DNASU | Cat# HsCD00440967 |
| pDONR221-GCN5 | DNASU | Cat# HsCD00829789 |
| Software and algorithms | ||
| FlowJo | FlowJo, LCC | https://www.flowjo.com/ |
| Fiji (ImageJ) | National Institutes of Health | https://ImageJ.nih.gov/ij/ |
| Prism 9 | GraphPad Software | https://www.graphpad.com/scientific-software/prism/ |
| EpiCypher Cut&Run SEACR pipeline | Basepair Inc. | https://www.basepairtech.com/ |
| RNA-seq Differential Expression (DESeq2) pipeline | Basepair Inc. | https://www.basepairtech.com/ |
| HISAT2 | Kim et al.63 | https://daehwankimlab.github.io/hisat2/ |
| Bowtie2 | Langmead and Salzberg64 | https://partekflow.cit.nih.gov/ |
| MACS2 | Feng et al.65 | https://partekflow.cit.nih.gov/ |
| Enrichr | Chen et al.66 | https://maayanlab.doud/Enrichr/ |
| AME | McLeay and Bailey67 | https://meme-suite.org/meme/doc/ame.html |
| Other | ||
| DMEM 4.5 g/L Glucose w/L-Glutamine | Lonza | Cat# 12–604Q |
| HyClone™ bovine growth serum | HyClone Laboratories | Cat# SH30541.03IR |
| SuperSignal West Pico Plus chemiluminescent substrates | Thermo Fisher Scientific | Cat# 34580 |
| SuperSignal™ West Femto Maximum Sensitivity Substrate | Thermo Fisher Scientific | Cat# 34096 |
| Protein G magnetic beads | Thermo Fisher Scientific | Cat#88847 |
| Glutathione magnetic beads | Thermo Fisher Scientific | Cat#78601 |
| Zeba™ Spin desalting columns, 7K MWCO | Thermo Fisher Scientific | Cat#89883 |
| BLOXALL® endogenous blocking solution | Vector Laboratories | Cat#SP-6000–100 |
| 1-Step™ Ultra TMB-ELISA Substrate Solution | Thermo Fisher Scientific | Cat# 34029 |
| Anti-FLAG Alpha Donor beads | PerkinElmer | Cat#AS103D |
| Streptavidin AlphaLISA® Acceptor beads | PerkinElmer | Cat#AL125C |
| UltraCruz® nitrocellulose pure transfer membrane | Santa Cruz Biotechnology | Cat#sc-3724 |
| Nytran SuperCharge nylon blotting membrane | Cytiva | Cat#10416230 |