

Abstract
Aim:
We investigated neuropsychiatric outcomes in children with Noonan syndrome and addressed limitations in previous research with a focus on prepubertal children, comparison to typically developing children, comprehensive neuropsychiatric evaluation, and controlling for overall cognitive abilities.
Method:
Forty-five children with Noonan syndrome (mean = 8 years 6 months, SD = 2 years 2 months; 29 females) and 40 typically developing children (mean = 8 years 9 months, SD = 2 years; 22 females) were evaluated with objective, parent-report, and psychiatric interview measures.
Results:
Children with Noonan syndrome demonstrated elevated symptoms across attention-deficit/hyperactivity disorder (ADHD) (attention, hyperactivity, and inhibition), autism spectrum disorder (ASD) (maintaining social relationships, behavioral rigidity, and sensory sensitivity), and oppositional defiant disorder (ODD) (aggression) symptom clusters relative to typically developing children (all p < 0.05). Group differences in nearly all parent-report measures were significant after accounting for variations in intellectual functioning, suggesting that increased neurodevelopmental symptoms are not simply driven by overall intelligence. Twenty out of 42 children with Noonan syndrome met criteria for ADHD, eight out of 42 for ODD, and 11 out of 43 demonstrated clinically significant symptoms seen in children with ASD.
Interpretation:
Children with Noonan syndrome are at increased risk for a range of ADHD, ASD, and ODD associated symptoms. A dimensional approach reveals significant ASD symptoms in Noonan syndrome that do not emerge when using the currently accepted categorical diagnostic approach.
The Ras-mitogen-activated protein kinase (MAPK) pathway is central to neurodevelopment and is associated with deviation from typical development.1,2 Examining neuropsychiatric disorders associated with germline mutations affecting the Ras-MAPK pathway offers a unique opportunity for understanding how upregulation of this pathway affects neuropsychological and behavioral development. The Ras-MAPK pathway consists of three kinases (MAPKKK, MAPKK, and MAPK), which form a signal transduction cascade that receives input from G-proteins and produces different biological outputs. In Figure 1, the Ras/MAPK/ERK pathway is illustrated in detail, reflecting the two studied genes (PTPN11 and SOS1) and encoded proteins (SHP-2 and SOS1). Two associated pathways (JNK and P38) are also illustrated. Noonan syndrome (prevalent in 1:2000), the most common disorder associated with Ras-MAPK pathway pathogenic variants, is a complex multi-systemic genetic disorder.3 Approximately 50% of individuals with Noonan syndrome are diagnosed with gain-of-function pathogenic variants in the PTPN11 gene.4 In addition, 13% of individuals with Noonan syndrome are diagnosed with a gain-of-function pathogenic variants in the SOS1 gene,5 making PTPN11 and SOS1 pathogenic variants the most common cause for Noonan syndrome.
Figure 1:
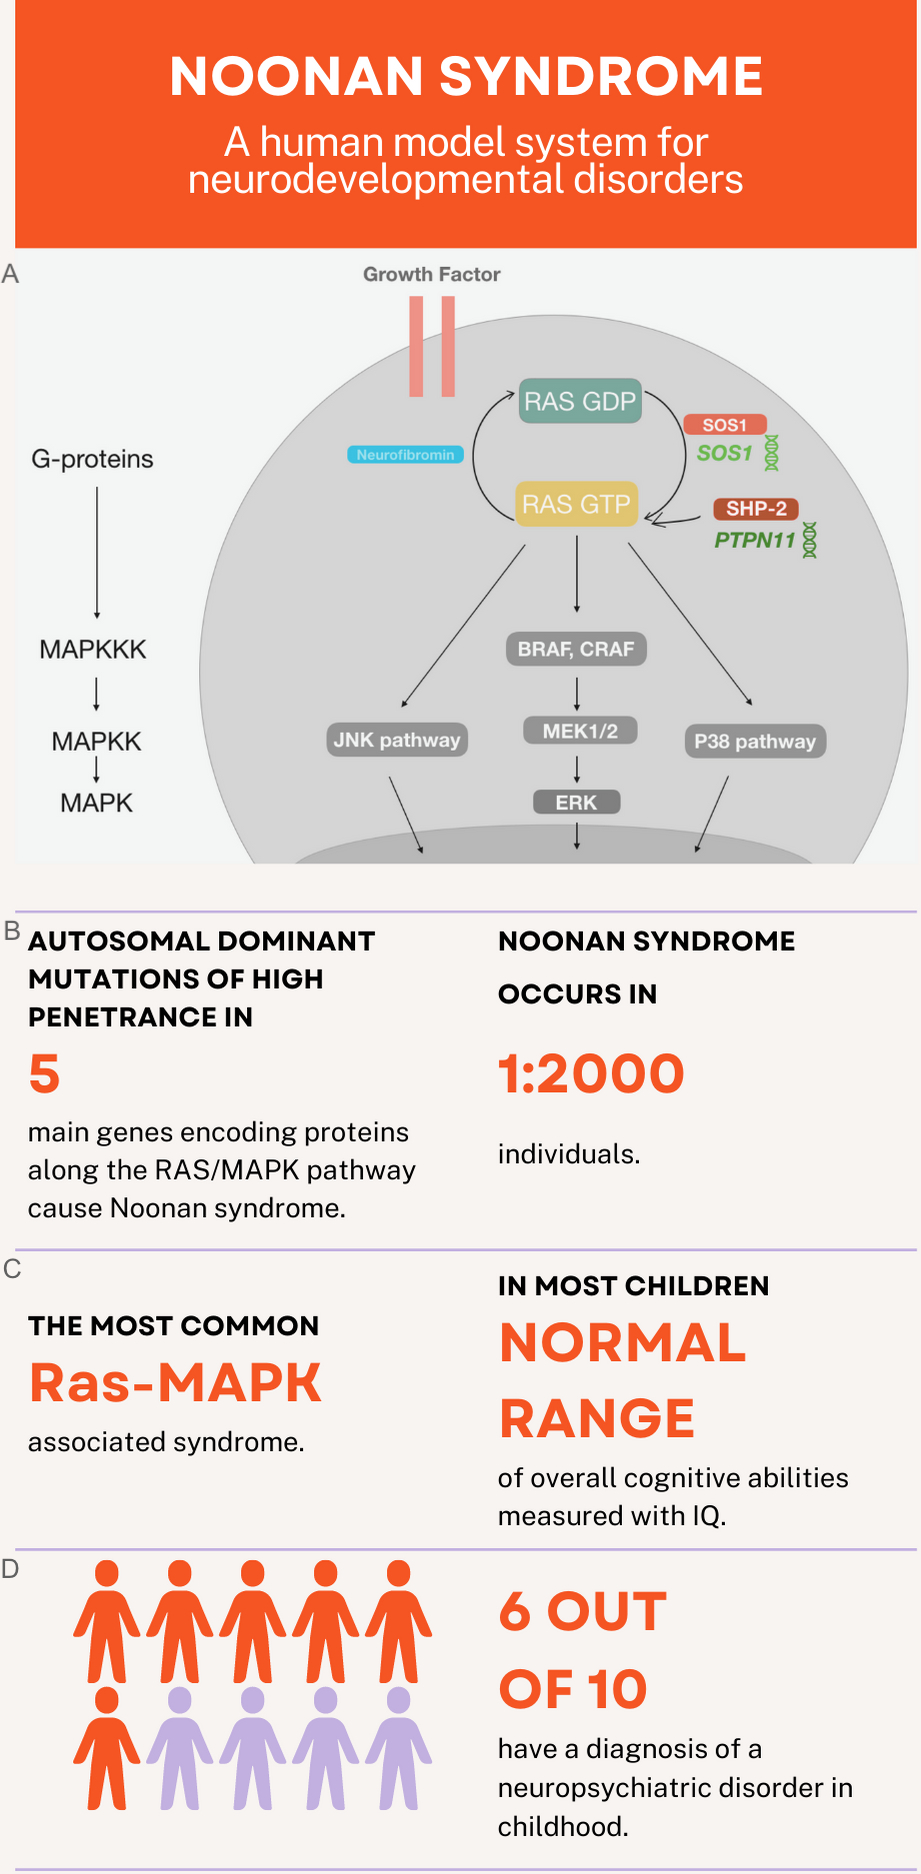
Noonan syndrome can be considered a human model system for understanding the Ras-mitogen-activated protein kinase (MAPK) pathway’s role in neurodevelopmental disorders. (a) Visualization of key components within the Ras-MAPK pathway. SOS1 and SHP-2 proteins are displayed in warm colors, reflecting their activation of RAS phosphorylation and Neurofibromin in a cold colors reflecting loss of inhibition—that also results in pathway activation. (b) Noonan syndrome is caused by autosomal dominant mutations of high penetrance in five main genes: PTPN11 (50% of cases), SOS1 (10–13% of cases), RAF1 (5% of cases), RIT1 (5% of cases), and KRAS (< 5% of cases).44 (c) Noonan syndrome is the most common syndrome associated with Ras-MAP K pathway pathogenic variants (RASopathy)3 and most children have intelligence in the normal range.8 (d) Noonan syndrome is strongly associated with increased risk for neurodevelopmental disorders and 6 out of 10 children present with a neuropsychiatric disorder in childhood.8,12,34
Evidence from initial studies indicate that children with Noonan syndrome are at risk for neurodevelopmental disorders.6 Affected children experience higher rates of attention-deficit/hyperactivity disorder (ADHD) (38–49%)7,8 than what is observed in the general population (11%).9,10 Social deficits have been reported in Noonan syndrome, although rates of autism spectrum disorder (ASD) vary greatly across studies (12–30%). Children with Noonan syndrome are also generally described as immature and stubborn, with higher rates of externalizing behaviors in comparison to siblings.11 Thus there is a potential risk for oppositional defiant disorder (ODD), yet, to the best of our knowledge, no study to date has reported ODD rates in children with Noonan syndrome. Systematic evaluations of the neurodevelopmental phenotype associated with Noonan syndrome are limited. In addition, the majority of previous studies did not include typically developing individuals for comparison,9 reported only symptoms pertaining to either ADHD or ASD,9,12 have relied solely on parent evaluation,11 and were highly heterogenous in regards to pathogenic variant and age.6,11–13
To address these limitations, we collected a large cohort of prepubertal children with Noonan syndrome and included a group of typically developing children matched to the Noonan syndrome group for age and sex. We completed comprehensive neuropsychiatric evaluation including standardized behavioral and cognitive assessments, and semi-structured psychiatric interview. Noonan syndrome is characterized by intellectual function within the normal range (mean Full-Scale IQ [FSIQ] = 92.9, SD = 14.6), yet scores of affected children are significantly lower than unaffected siblings.8 Lower levels of intellectual functioning are associated with higher rates of behavioral and psychiatric symptoms in children with neurogenetic disorders.14 Therefore, we included objective cognitive testing to control for the impact of cognition on behavioral functioning across groups and reduce bias associated with parental report measures. Another unique facet of the present study is the organization of assessment and results around three specific, hypothesis-driven neurodevelopmental symptom clusters: attention and executive function, social skills, and aggression. These specific neurodevelopmental symptoms generally correspond with neurodevelopmental diagnosis of ADHD, ASD, and ODD respectively, yet they may occur across diagnoses (e.g. children with ASD have executive functioning deficits). We report the number of children meeting diagnostic criteria for ADHD, ASD, and ODD based on psychiatric interview: the Kiddie Schedule for Affective Disorders and Schizophrenia—Present Version (KSADS). Then, we report levels of attention/executive function, social skill, and aggression symptom clusters organized as such to enhance readability and clinical utility. We hypothesized that children with Noonan syndrome would have higher levels of symptoms across attention/executive function, social skill, and aggression clusters compared to their typically developing counterparts. We also hypothesized that parent-reported levels across neuropsychological symptom clusters would remain significant after accounting for differences in general intelligence. This investigation contributes critical knowledge regarding clinically significant behavioral issues in children with Noonan syndrome and describes how pathogenic mutations in the Ras-MAPK pathway are associated with behavior profiles.
METHOD
Participants
The current study includes 45 children with Noonan syndrome (PTPN11 n = 35; SOS1 n = 10), and 40 typically developing children, aged 4 years 5 months to 11 years 11 months. Children were group-matched in terms of age and sex. Informed consent was provided by the parent or guardian of all participants, with assent given by participants over age 7 years, as approved by the institutional review board of Stanford University (IRB #3192). A subset of the 45 children with Noonan syndrome described in the present paper were also included in previous work from our group (n = 39 in Bruno et al.,15 n = 17 in Fattah et al.,16 n = 12 in Johnson et al.17). Detailed recruitment and exclusion criteria are presented in Appendix S1.
Assessment
Comprehensive neuropsychological assessment was organized around three symptom clusters: attention/executive function, social skills, and aggression (Figure 2, Table 1). Parent-reported behavioral measures included the Behavior Assessment System for Children, Second Edition (BASC-2),18 Behavior Rating Inventory of Executive Function (BRIEF),19 and Social Responsiveness Scales (SRS).20 Objective measures of cognition include age-appropriate Wechsler IQ tests21,22 and the Developmental NEuroPSYchological Assessment, Second Edition (NEPSY-II).23 Children with Noonan syndrome and their parents also completed a structured psychiatric interview, the neurodevelopmental module of the KSADS.24 Detailed description of standardized assessments is presented in Appendix S1.
Figure 2:
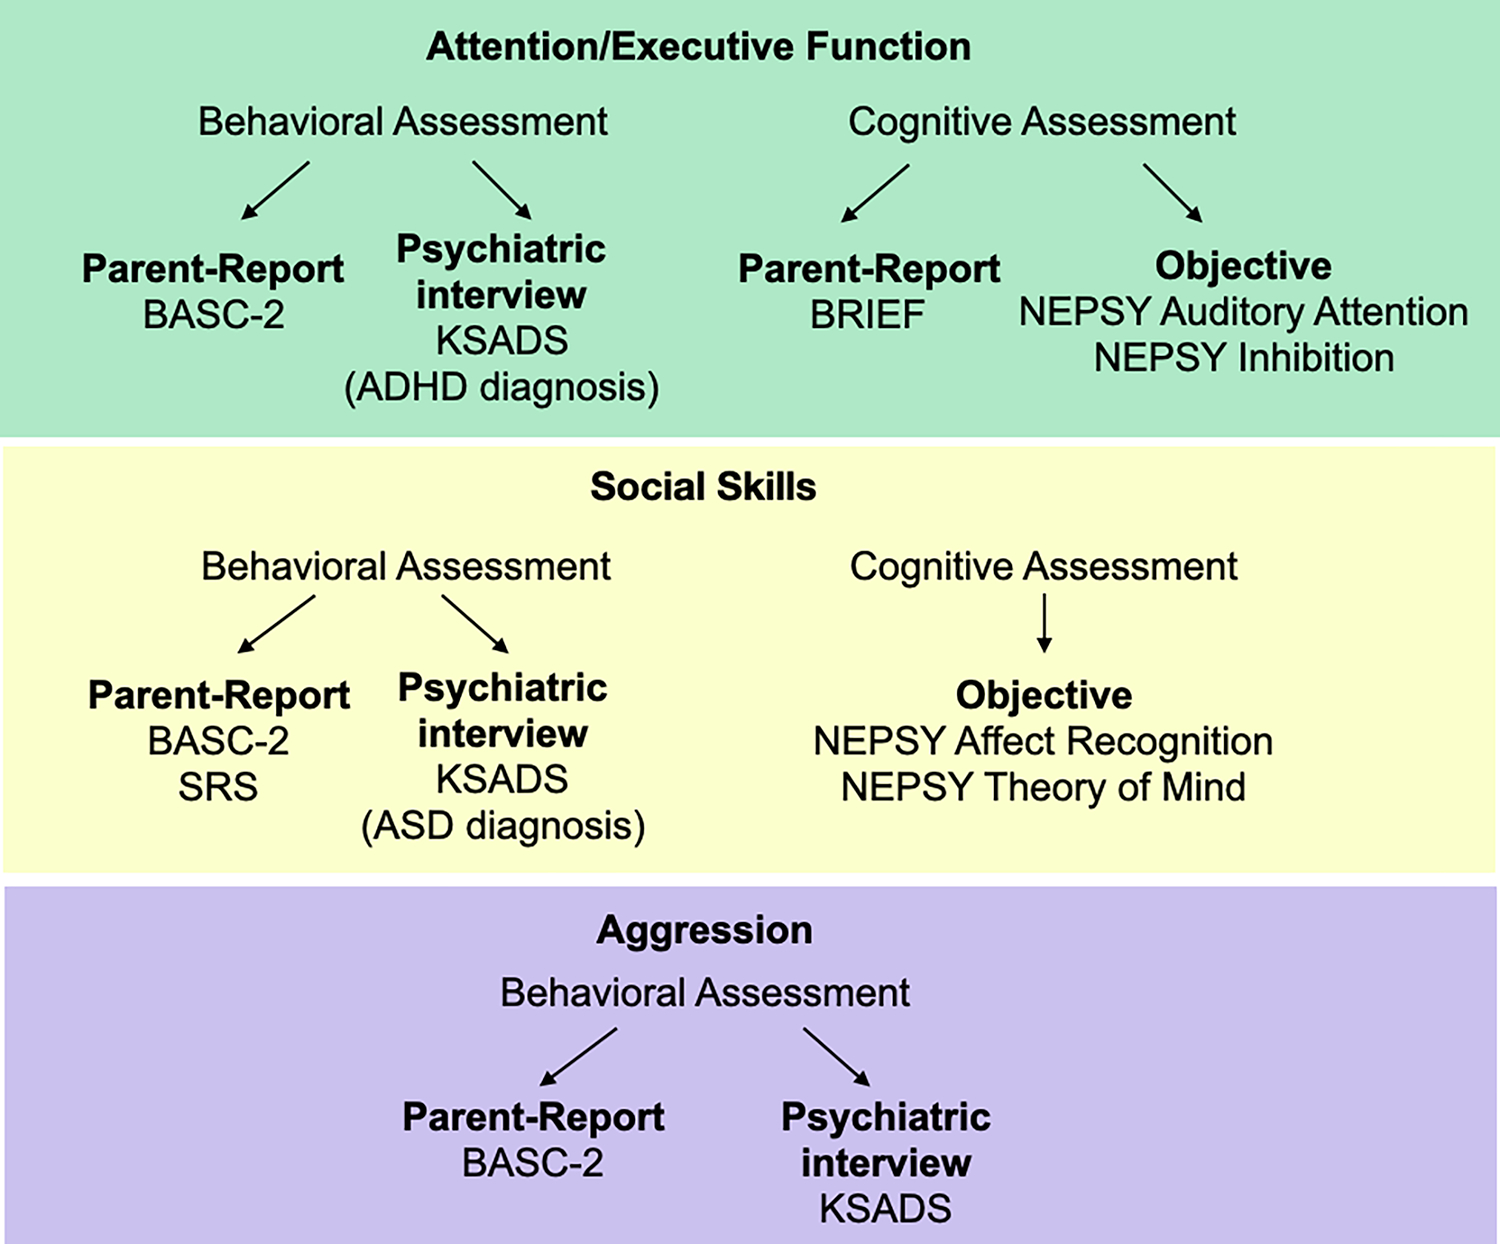
Study assessments were organized around three neurodevelopmental symptom clusters—green: attention/executive function; yellow: social skills; purple: aggression.
Abbreviations: ADHD, attention-deficit/hyperactivity disorder; ASD, autism spectrum disorder BASC-2, Behavior Assessment System for Children, Second Edition; BRIEF, Behavior Rating Inventory of Executive Function; KSADS, Neurodevelopmental Module of the Kiddie Schedule for Affective Disorders and Schizophrenia—Present Version; NEPSY, Developmental NEuroPSYchological Assessment, Second Edition; SRS, Social Responsiveness Scales.
Table 1:
Group differences for all symptom clusters
| Symptom cluster | Measurement source | Measure | Noonan syndrome group | Typically developing group | Effect size | Effect size with IQ covariate | ||
|---|---|---|---|---|---|---|---|---|
|
| ||||||||
| Attention and executive function | Parent report | BASC attention | 59.43 | 10.95 | 52.33 | 8.76 | 0.14a | 0.04 |
| BASC hyperactivity | 61.75 | 14.57 | 49.10 | 10.11 | 0.24a | 0.10a | ||
| BRIEF composite | 65.83 | 13.77 | 48.55 | 9.94 | 0.36a | 0.15a | ||
| BRIEF inhibit | 63.33 | 14.36 | 49.26 | 9.08 | 0.28a | 0.15a | ||
| BRIEF shift | 62.36 | 15.22 | 46.76 | 15.40 | 0.22a | 0.19a | ||
| BRIEF emotional control | 61.81 | 15.28 | 47.63 | 9.65 | 0.24a | 0.17a | ||
| BRIEF working memory | 66.17 | 13.90 | 49.03 | 11.10 | 0.34a | 0.12a | ||
| BRIEF plan/organize | 63.83 | 13.24 | 49.79 | 11.24 | 0.28a | 0.09a | ||
|
| ||||||||
| Objective | NEPSY auditory attention | 8.60 | 3.25 | 10.42 | 3.08 | 0.08a | <0.01 | |
| NEPSY response set | 7.70 | 3.37 | 10.97 | 2.43 | 0.15a | 0.03 | ||
| NEPSY inhibitionb | 7.70 | 3.37 | 10.49 | 3.62 | 0.15a | 0.02 | ||
|
| ||||||||
| Social skills | Parent report | BASC atypicality | 59.48 | 15.34 | 46.54 | 7.39 | 0.23a | 0.11a |
| BASC withdrawal | 59.02 | 11.99 | 49.10 | 9.20 | 0.17a | 0.07a | ||
| SRS total | 65.72 | 17.50 | 47.29 | 7.66 | 0.17a | 0.10a | ||
| SRS awareness | 63.30 | 13.13 | 50.06 | 9.79 | 0.13a | 0.10a | ||
| SRS communication | 62.98 | 17.11 | 47.29 | 7.02 | 0.12a | 0.09a | ||
| SRS cognition | 63.93 | 17.31 | 46.03 | 9.01 | 0.16a | 0.08a | ||
| SRS motivation | 60.30 | 14.22 | 49.66 | 8.11 | 0.05a | 0.02 | ||
| SRS ASD mannerisms | 67.98 | 19.65 | 46.21 | 10.44 | 0.17a | 0.11a | ||
|
| ||||||||
| Objective | NEPSY affect recognition | 9.07 | 3.70 | 10.90 | 2.85 | 0.08a | <0.01 | |
| NEPSY theory of mind | 19.20 | 5.41 | 22.28 | 4.88 | 0.17a | 0.02 | ||
|
| ||||||||
| Aggression | Parent report | BASC aggression | 54.41 | 10.85 | 48.62 | 7.11 | 0.11a | 0.06a |
Subtest p < 0.05. Effect size is ηp2, 0.01 = small effect, 0.06 = medium effect, 0.14 or higher = large effect.
The naming versus inhibition contrast score.
Abbreviations: ASD, autism spectrum disorder; BASC, Behavior Assessment System for Children; BRIEF, Behavior Rating Inventory of Executive Function; Composite, Global Executive Composite; NEPSY, NEuroPSYchological Assessment; SRS, Social Responsiveness Scales.
Group means and statistics are presented by symptom cluster. BASC-2, T scores are reported. BRIEF Global Executive Composite, T scores are reported. SRS, T scores are reported. NEPSY, standard scores are reported. For the theory of mind subtest we report raw scores as no standardized scores are available for this measure.
Statistical analysis
Age and sex distributions were compared using one-way analysis of variance and χ2 tests respectively. To address our primary hypothesis, we examined between-group differences (Noonan syndrome vs typically developing) for each measure within attention/executive function, social skills, and aggression symptom clusters using univariate analysis of covariance while controlling for age and sex. To address our secondary hypothesis (parent-report symptoms are higher in children with Noonan syndrome after accounting for FSIQ) we performed an additional set of analysis of covariance covarying for age, sex, and FSIQ. As objective, cognitive measures are known to be closely related to certain aspects of FSIQ,25 we did not expect significant group effects for the NEPSY-II measures after accounting for FSIQ; we include these results for completeness. Statistical analyses were performed in R version 4.2.2 (R Foundation for Statistical Computing, Vienna, Austria) using the analysis of variance function from the car package with type-III sum of squares.26 We report partial eta squared (ηp2) effect sizes for each measure.27 When a participant was missing data from a given subtest, they were removed only from that subtest’s analysis. Three participants with Noonan syndrome were missing KSADS data. For the BASC-2, data were missing from one Noonan syndrome and one typically developing participant. For the BRIEF, data were missing from three Noonan syndrome and two typically developing participants. For the NEPSY, auditory attention, response set, and inhibition subtests data were missing from two Noonan syndrome and two typically developing participants. For the NEPSY theory of mind subtest, data were missing from four Noonan syndrome and two typically developing participants. For the SRS, data were missing from two Noonan syndrome and five typically developing participants except for the ASD mannerisms SRS subscale for which data were missing from one additional typically developing participant. We also report percentages of children with Noonan syndrome who met criteria for each neuropsychiatric condition according to KSADS.
RESULTS
The Noonan syndrome and the typically developing groups were comparable in age (Noonan syndrome: median age = 8 years 7 months, interquartile range [IQR] = 3 years 2 months; typically developing median age = 8 years 11 months, IQR = 2 years 9 months; F(1,83) = 0.39, p > 0.10) and sex (Noonan syndrome: 29 female; typically developing: 22 female; χ2[1,85] = 0.79, p > 0.10) distributions. As expected, mean FSIQ was significantly lower for the Noonan syndrome group (range = 63–122, mean = 92.73, SD = 14.1) relative to the typically developing group (range = 87–120, mean = 108.43, SD = 7.66; F(1,83) = 39.2, p < 0.001).
Diagnostic rates for children with Noonan syndrome
KSADS results confirmed ADHD diagnoses in 20 out of 42 children with Noonan syndrome (Figure 3, Table S1). An additional seven children demonstrated subthreshold symptoms of ADHD (i.e. four or more symptoms of attention/hyperactivity endorsed with accompanying clinical impairment). Children most commonly met criteria for predominantly inattentive type (n = 9), followed by combined type (n = 8), and predominantly hyperactive type (n = 3).
Figure 3:
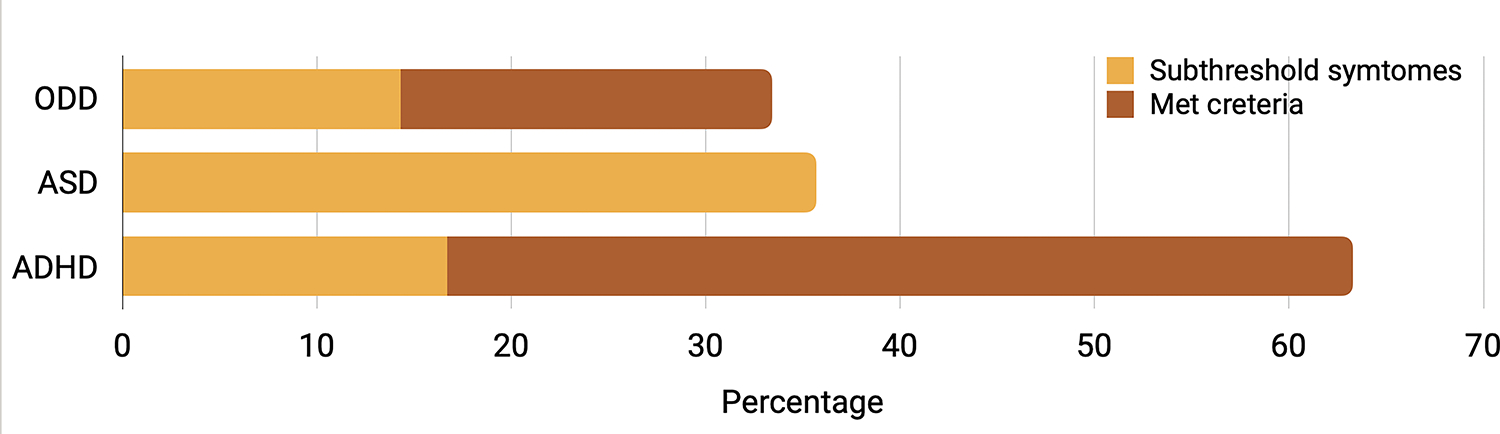
Percentage of children with Noonan syndrome who met full and subthreshold criteria for attention deficit/hyperactivity disorder (ADHD), autism spectrum disorder (ASD), and oppositional defiant disorder (ODD) based on results from structured psychiatric interview, the Kiddie Schedule for Affective Disorders and Schizophrenia—Present Version. ADHD subthreshold criteria are defined as four or more symptoms of attention/hyperactivity endorsed with accompanying clinical impairment. ASD subthreshold criteria are defined by meeting criteria for one full category (in the case of our children it was criteria for the restricted or repetitive behaviors domain [criterion B] that was met), or showing functional impairment in both A and B but not meeting full symptom counts for diagnosis (e.g. met 2 out of 3 criteria in A and 2 in B). ODD subthreshold criteria are defined by three or more symptoms with accompanying impairment in at least one setting.
No children in the current sample met full criteria for ASD based on the KSADS. No children fulfilled the ASD criteria regarding social communication (criterion A). Yet, parents frequently reported deficits in developing and maintaining friendships, characterized by incessant pursuit of others (15/42). Four out of 42 children with Noonan syndrome met criteria for the restricted or repetitive behaviors domain (criterion B). The most frequently reported restricted or repetitive behavior category symptoms included ‘Insistence on sameness’ (15/42) and ‘Hyper- or hyporeactivity to sensory input’ (12/42).
Structured psychiatric interview (KSADS) found that eight children with Noonan syndrome met criteria for ODD, with an additional six showing subthreshold symptoms (e.g. three or more symptoms with accompanying impairment in at least one setting). Over half of children with Noonan syndrome were reported to frequently lose their temper (22/42), while nearly half were described as easily annoyed (19/42) or argumentative (18/42). Notably, parents less frequently reported concerns regarding children deliberately annoying others (6/42) or being vindictive (7/42).
Children with Noonan syndrome demonstrate lower levels of attention/executive function skill
We found a significant between-group effect indicating higher scores (i.e. higher symptom levels) for the Noonan syndrome group on all measures within the attention/executive function symptom cluster. These results include higher scores for the Noonan syndrome group on BASC-2 attention problems (F(1,79) = 12.37, p < 0.001) and hyperactivity (BASC-2; F(1,79) = 24.27, p < 0.001) subscales (Table 1, Figure 4, Table S2). On parent-reported executive function (BRIEF), we found a significant between-group effect indicating higher scores for the Noonan syndrome group on global executive functioning (F(1,76) = 43.01, p < 0.001) as well as individual subscales (inhibit, shift, emotional control, working memory, plan/organize). Group differences remained significant after controlling for FSIQ for the BASC-2 hyperactivity scale, BRIEF global executive functioning, and all BRIEF subscales with the exception of the shift scale (Figure 4, Table 1).
Figure 4:
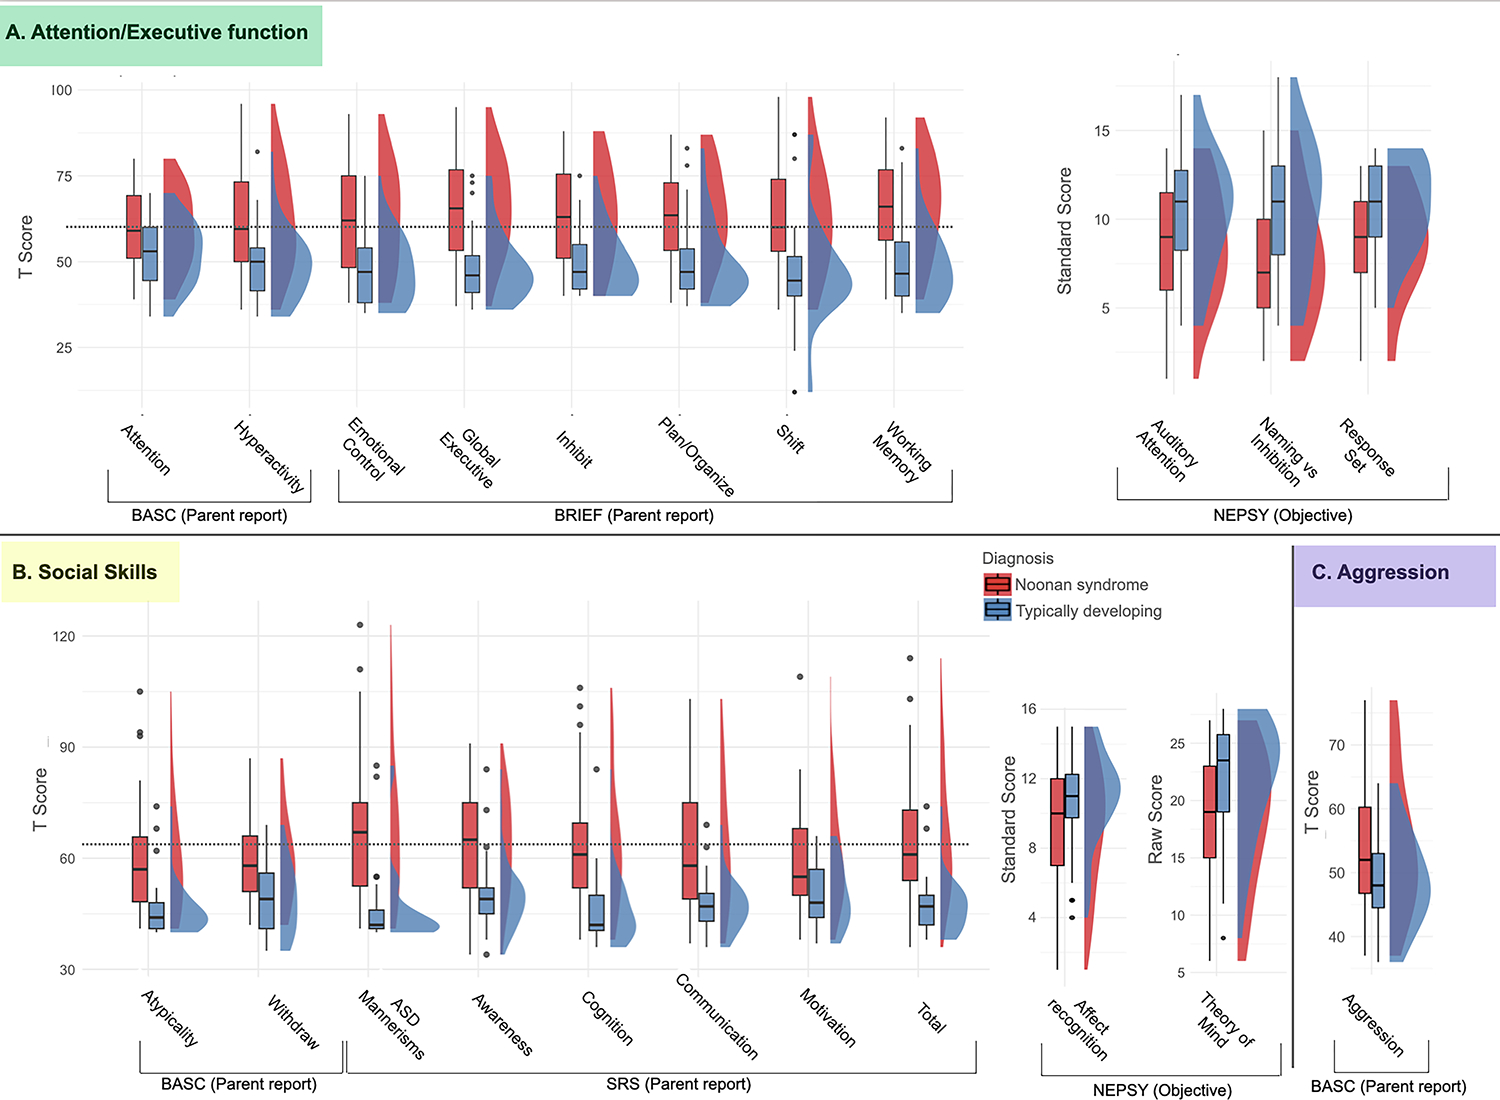
Boxplots and probability density estimates for Noonan syndrome (red) and typically developing (blue) groups. Visualizations were made using the R package ggplot2.45,46 Background is colored according to symptom clusters (consistent with Figure 2). (a) (green) attention/executive functioning; (b) (yellow) social skills; (c) (purple) aggression. Dashed horizontal line indicates a T value of 60 which corresponds to symptom levels in the ‘at risk’ (BASC), ‘mildly elevated’ (BRIEF), or ‘mild difficulty’ (SRS) range. Abbreviations: BASC, Behavior Assessment System for Children; BRIEF, Behavior Rating Inventory of Executive Function; NEPSY, Developmental NEuroPSYchological Assessment; SRS, Social Responsiveness Scales.
We also found significantly lower levels of objective neuropsychological performance for children with Noonan syndrome across NEPSY-II measures. Specifically, the Noonan syndrome group demonstrated lower scores on (1) a test of auditory attention (F(1,55) = 6.30, p = 0.014, auditory attention), (2) a test in which children were required to inhibit initial responses to visually presented stimuli (response set; F(1,55) = 11.25, p = 0.002) and on a visual inhibition task measuring a child’s ability to inhibit their initial response naming a shape or an arrow direction (naming vs inhibition contrast; F(1,55) = 13.38, p < 0.001). After accounting for FSIQ, we did not find differences between the groups on these NEPSY-II measures (Table 1).
Children with Noonan syndrome demonstrated lower levels of social skills
We found significant between-group effects for all measures within the social skills symptom cluster (Figure 4) indicating higher levels of symptoms in the Noonan syndrome group. On the BASC-2 we found higher scores for the Noonan syndrome group on atypicality (F(1,79) = 24.01, p < 0.001) and withdrawal (F(1,79) = 16.49, p < 0.001) subscales. On the SRS we found higher scores for the Noonan syndrome group on the total scale (F(1,73) = 32.35, p < 0.001) as well as on each of the subscales (Table 1, Figure 4). The results for BASC-2 atypicality, SRS total scale, and SRS ASD mannerisms scale remained significant after correcting for FSIQ (Table 1). Within the Noonan syndrome group, 11 children obtained SRS scores indicating severe difficulties (T score ≥ 76), eight scored in the moderate difficulty range (T score 66–75), and three scored in the mild difficulty range (T score 60–65). The remaining 21 children in the Noonan syndrome group scored in the normal range (T score ≤ 59). In contrast, of 35 children for whom SRS was completed in the typically developing group, 33 children had SRS scores in the normal range; one child scored in the mild difficult range, and one in the moderate difficulty range.
We also identified a significant between-group difference for objective measures including affect recognition (NEPSY-II affect recognition: F(1, 75) = 7.00, p = 0.01) and theory of mind (F(1,76) = 15.29, p < 0.001). These results did not remain significant after accounting for FSIQ (Table 1).
Children with Noonan syndrome demonstrated higher rates of aggression
We examined ODD symptomology using parent-reported assessments of behavior. We found a significant between-group effect indicating higher scores for the Noonan syndrome group on parent-reported aggression (BASC-2; F(1,78) = 8.44, p = 0.005).
While not the focus of the present study, we present post hoc analyses including all BASC-2 scales and comparisons for all measures within the PTPN11 and SOS1 subgroups (Table S3 and Table S4) and correlations among all measures (Table S5 and Figure S1).
DISCUSSION
In this study, we used cognitive, behavioral, and psychiatric evaluations in a relatively large cohort of prepubertal children with the two most common pathogenic variants causing Noonan syndrome (PTPN11 and SOS1). Children with Noonan syndrome demonstrated increased rates of symptoms associated with ADHD, ASD, and ODD relative to their typically developing comparators. Group differences in nearly all parent-report measures were significant after accounting for variations in intellectual functioning level, suggesting that increased neurodevelopmental symptoms are not simply driven by overall intelligence. Psychiatric evaluation indicated that children with Noonan syndrome have high rates of ADHD (~48%), and ODD (~18%), as well as repetitive and rigid behaviors often associated with ASD. This novel, multidimensional report of symptom rates and neurodevelopmental profiles in prepubertal children with Noonan syndrome can be used to inform and guide clinicians and families in assessments and management of neurodevelopmental outcomes.
Children with Noonan syndrome demonstrated higher rates of ADHD symptomology relative to typically developing children across both attention and hyperactivity subscales of the BASC-2. We also observed higher rates of executive dysfunction across subscales of the BRIEF. Congruent with these findings, KSADS results indicated 47.6% of children (n = 20) with Noonan syndrome met full criteria for ADHD, with an additional 16.67% (n = 7) demonstrating subthreshold symptoms, indicating difficulties with attention or hyperactivity-impulsivity that did not meet full criteria for a diagnosis of ADHD. While aligned with previous findings, our results indicated higher rates of ADHD symptoms relative to what has been previously reported: 22% of children met full criteria (48% subthreshold)9,24 and 31% reported previous ADHD diagnosis.8 The higher rates in our study might be related to development; we included only prepubertal children in contrast to previous work which included participants up to age 18 years.9,28
Our findings suggest that prepubertal children with Noonan syndrome demonstrate high rates of ADHD symptoms across attention and hyperactivity scales. More work is required to understand if ADHD rates are higher in prepubertal children relative to adolescents, as in idiopathic ADHD. We also present novel information from the psychiatric interview pertaining to specific symptoms of ADHD in children with Noonan syndrome given that genetic disorders can contribute to unique presentations of ADHD symptoms,7 which has not been previously reported in children with Noonan syndrome. Notably, in the current sample, children with Noonan syndrome most frequently met criteria for predominantly inattentive (21%, n = 9) or combined type (19%, n = 8) ADHD. Rates of combined type ADHD in children with Noonan syndrome were twice the rates observed in idiopathic ADHD, with higher rates of hyperactive symptoms including fidgeting (83%, n =35), interrupting often (74%, n = 31), and talking excessively (64%, n = 27) in the majority of children.29 The elevated level of ADHD symptoms in children with Noonan syndrome suggests that the upregulation of the Ras-MAPK pathway in Noonan syndrome may contribute to general difficulties with attention.
Over 25% (n = 11) of children with Noonan syndrome demonstrated deficits in social responsiveness (SRS) in the severe range, with specific symptoms including an increase in highly restricted interests and stereotypic behaviors (SRS ASD mannerisms). Scores in this range indicate clinically significant deficits which are strongly associated with an ASD diagnosis. Children with Noonan syndrome experienced difficulties with maintaining friendships, behavioral rigidity, and difficulties with sensory sensitivity. Difficulties in sensory sensitivity have been previously reported in another RASopathy, cardiofaciocutaneous syndrome.30 Rodent models have also implicated the Ras-MAPK pathway in the modulation of sensory neurons, suggesting that difficulties with sensitivity to sensory stimuli in RASopathies may be attributed to underlying genetic factors.31 Previous work in children with Noonan syndrome reported elevated rates of social responsiveness deficits using the SRS and Social Communication Questionnaire.12 Further, one study reported 30% of children with Noonan syndrome met diagnostic criteria for ASD, and an additional 30% demonstrated subthreshold symptoms based on the Autism Diagnostic Observation Schedule32 and the Autism Diagnostic Interview-Revised.33 Consistent with previous findings,34 the most common ASD-like features we observed were deficits in maintaining social relationships as well as specific difficulties with restrictive and repetitive behaviors, including difficulties with transitions. Children with Noonan syndrome also demonstrated difficulties with maintaining age-appropriate friendships, behavioral rigidity, and idiopathic deficits in sensory processing. This phenotypic pattern is largely consistent with that observed in children with other RASopathy syndromes like neurofibromatosis type 1 who meet criteria for ASD.35 While no children in the present study met criteria for ASD diagnosis based on the KSADS, our study did not include criterion standard ASD assessments such as the Autism Diagnostic Interview or the Autism Diagnostic Observation Schedule. Future investigation of the ASD-like social symptoms is warranted, and treatments targeting social skills and ASD-like behaviors are important for children with Noonan syndrome. Similar interventions are currently being trialed in adults with Noonan syndrome.36 Findings of the current study further contribute to the growing understanding of social impairments in children with Noonan syndrome, in that many children in the current sample were described as having social difficulties in the absence of severe impairment. Previous research suggests that social impairment in children with Noonan syndrome may be related to a number of factors, such as impairments in pragmatic language and attention as is observed in children with idiopathic ADHD.13 Social impairment is also described in children with other RASopathy disorders such as neurofibromatosis type 1, with previous research suggestive of higher rates of ASD diagnoses as well as social impairments observed in children who do not meet criteria for ASD.37
To the best of our knowledge, we present the first evidence indicating that children with Noonan syndrome demonstrate higher rates of ODD symptomology. Levels of aggression were elevated in children with Noonan syndrome relative to typically developing children (BASC-2). Using a psychiatric interview, 19% (n = 8) of children with Noonan syndrome met criteria for ODD, which is twice the estimated lifetime prevalence in the general population.38 Notably, most children with Noonan syndrome were described as having difficulties with emotion regulation, including being short-tempered and easily annoyed. While ODD symptomology has never been formally studied in children with Noonan syndrome, our present findings were foreshadowed by earlier reports that children with Noonan syndrome demonstrate higher of externalizing behaviors in comparison to siblings.11 Symptoms of emotion dysregulation may represent a predisposition for mood and anxiety problems that emerge in older children/adolescents with Noonan syndrome.39 Post hoc analyses indicated that aggression symptom levels correlated significantly with depression symptom levels (BASC-2), and that children with Noonan syndrome had higher levels of both anxiety and depression relative to typically developing children (BASC-2). We interpret these findings tentatively because our study was not designed or powered to look at interrelationships among symptoms and we did not administer the anxiety/depression modules of the KSADS. We will use these data to guide our hypothesis in future studies. Further, aggression levels also correlated significantly with parent-reported attention/executive function but not with objectively measured executive function suggesting that attention issues (at least as reported by parents) could also play an underlying role in aggression. Interestingly, deficits in emotion regulation processing in children with idiopathic ADHD have been linked to altered development of the striato-amygdalo-medial prefrontal cortical network,40 which is known to be impacted in children with Noonan syndrome and PTPN11 pathogenic variants.17 Children with Noonan syndrome also demonstrate hyperconnectivity within striatal-frontal networks in comparison with typically developing children,15 indicating that children with Noonan syndrome may be at increased risk for dysfunction within these pathways that contribute to difficulties with emotion regulation.
Clinical care for children with Noonan syndrome should include regular screening for behavioral and emotional difficulties. The increased rates of clinically concerning behavioral and emotional difficulties reported here indicate that all children with Noonan syndrome should be rigorously screened for neuropsychiatric disorders consistent with guidelines from the American Academy of Pediatrics to allow for early clinical identification and intervention.41 Given the high rates of ADHD symptomology and subthreshold difficulties with attention reported in children with Noonan syndrome, we recommend that ADHD be actively addressed through psychotherapeutic and/or pharmacological interventions to decrease the impact of ADHD symptoms on children’s behavioral, social, school, and emotional functioning. Children with Noonan syndrome and their families may also benefit from early intervention to address difficulties with emotion regulation and to enhance parental efficacy (e.g. parent behavioral training) in responding to difficulties in behavior in early childhood. Given reported difficulties with social skills, children with Noonan syndrome may also benefit from social skills training programs, which have previously been studied in children with idiopathic ADHD.42
This study is primarily limited because of its sample size of 35 children with PTPN11 and 10 children with SOS1, although it represents the largest sample of each pathogenic variant reported to date.9,28 Families volunteered to participate in this study leading to the potential for self-selection bias, in which the sample of children with Noonan syndrome may include children with increased ADHD symptomology. However, we excluded children with comorbid medical conditions impacting cognition or brain morphology. Future research identifying patients via medical records and community-based sampling will be important to enhance the generalizability of our results and better understand neuropsychiatric disorder prevalence and symptom profiles. The group differences in objective measures of ADHD and ASD symptoms (NEPSY-II) were not significant after accounting for FSIQ. This result was expected as performance on cognitive measures such as the NEPSY-II are strongly related to FSIQ scores.25 Additionally, we used the parent-report SRS and did not include a criterion standard or observational measure of ASD symptoms. Previous research in children with neurofibromatosis type 1 indicates that the SRS may have a stronger negative than positive predictive value of a future diagnosis of ASD.43
Overall, we identified significantly increased levels of ADHD, ASD, and ODD symptoms in prepubertal children with Noonan syndrome compared to typically developing children. Further, nearly all parent-reported symptom levels were significantly elevated in children with Noonan syndrome after accounting for variability in overall cognitive level. These findings strongly implicate the Ras-MAPK pathway in the pathophysiology of neuropsychiatric disorders. Future studies in adolescents and longitudinal work will be important for further specifying the varying trajectories of neuropsychiatric disorder symptom levels. Nonetheless, our work provides clinically relevant rates and symptoms profiles rated to common neuropsychiatric disorders (ADHD, ASD, and ODD) in a large, homogenic cohort of children affected by Noonan syndrome.
Supplementary Material
Appendix S1: Detailed recruitment and exclusion criteria
Table S1: Psychiatric interview results using the KSADS for the Noonan syndrome group
Table S2: Statistical values for primary comparisons
Figure S1: Correlation heat map among all variables
Table S3: Group comparisons for additional BASC-2 measures
Table S4: Group means and statistics by symptom cluster
Table S5: Effect sizes compared between models with age and sex covariates and models with no covariates
What this paper adds.
Neuropsychiatric disorders occur in more than half of children with Noonan syndrome.
Children with Noonan syndrome demonstrate highly variable neurodevelopmental symptom profiles.
Children with Noonan syndrome display variable impairments in attention, hyperactivity, and inhibition.
Specific social concerns include behavioral rigidity, transitions, and difficulties maintaining social relationships.
Children with Noonan syndrome display variably elevated levels of aggression and emotional dysregulation.
Acknowledgements
This work was supported by the National Institute of Child Health and Human Development (#HD090209 K23). The typically developing participants in this study were recruited through work that was supported by a grant from the National Institute of Mental Health (#MH099630). TG was also supported by The Francis S. Collins Scholar in Neurofibromatosis Clinical and Translational Research.
We would like to extend our heartfelt thanks to all the children and families who volunteered to participate in this study. We are also grateful to the Noonan Syndrome Foundation and RASopathies Network for their help in recruitment and promotion of the study.
ABBREVIATIONS
- ADHD
attention-deficit/hyperactivity disorder
- ASD
autism spectrum disorde
- BASC-2
Behavior Assessment System for Children, Second Edition
- BRIEF
Behavior Rating Inventory of Executive Function
- FSIQ
Full-Scale IQ
- KSADS
Kiddie Schedule for Affective Disorders and Schizophrenia—Present Version
- MAPK
Mitogen-activated protein kinase
- NEPSY-II
NEuroPSYchological Assessment, Second Edition
- ODD
oppositional defiant disorder
- SRS
Social Responsiveness Scales
REFERENCES
- 1.Moyses-Oliveira M, Yadav R, Erdin S, Talkowski ME. New gene discoveries highlight functional convergence in autism and related neurodevelopmental disorders. Curr Opin Genet Dev 2020; 65: 195–206. [DOI] [PubMed] [Google Scholar]
- 2.Gandal MJ, Haney JR, Parikshak NN, et al. Shared Molecular Neuropathology Across Major Psychiatric Disorders Parallels Polygenic Overlap. Focus 2019; 17: 66–72. [DOI] [PMC free article] [PubMed] [Google Scholar]
- 3.Tartaglia M, Gelb BD, Zenker M. Noonan syndrome and clinically related disorders. Best Pract Res Clin Endocrinol Metab 2011; 25: 161–79. [DOI] [PMC free article] [PubMed] [Google Scholar]
- 4.Tartaglia M, Kalidas K, Shaw A, et al. PTPN11 mutations in Noonan syndrome: molecular spectrum, genotype-phenotype correlation, and phenotypic heterogeneity. Am J Hum Genet 2002; 70: 1555–63. [DOI] [PMC free article] [PubMed] [Google Scholar]
- 5.Roberts AE, Araki T, Swanson KD, et al. Germline gain-of-function mutations in SOS1 cause Noonan syndrome. Nat Genet 2007; 39: 70–4. [DOI] [PubMed] [Google Scholar]
- 6.Alfieri P, Piccini G, Caciolo C, et al. Behavioral profile in RASopathies. Am J Med Genet A 2014; 164A: 934–42. [DOI] [PubMed] [Google Scholar]
- 7.Green T, Naylor PE, Davies W. Attention deficit hyperactivity disorder (ADHD) in phenotypically similar neurogenetic conditions: Turner syndrome and the RASopathies. J Neurodev Disord 2017; 9: 25. [DOI] [PMC free article] [PubMed] [Google Scholar]
- 8.Pierpont EI, Tworog-Dube E, Roberts AE. Attention skills and executive functioning in children with Noonan syndrome and their unaffected siblings. Dev Med Child Neurol 2015; 57: 385–92. [DOI] [PMC free article] [PubMed] [Google Scholar]
- 9.Perrino F, Licchelli S, Serra G, et al. Psychopathological features in Noonan syndrome. Eur J Paediatr Neurol 2018; 22: 170–7. [DOI] [PubMed] [Google Scholar]
- 10.National Institute of Mental Health. Attention-Deficit/Hyperactivity Disorder (ADHD) Statistics. https://www.nimh.nih.gov/health/statistics/attention-deficit-hyperactivity-disorder-adhd. [Google Scholar]
- 11.McNeill AM, Hudock RL, Foy AMH, et al. Emotional functioning among children with neurofibromatosis type 1 or Noonan syndrome. Am J Med Genet A 2019; 179: 2433–46. [DOI] [PubMed] [Google Scholar]
- 12.Adviento B, Corbin IL, Widjaja F, et al. Autism traits in the RASopathies. J Med Genet 2014; 51: 10–20. [DOI] [PMC free article] [PubMed] [Google Scholar]
- 13.Pierpont EI, Hudock RL, Foy AM, et al. Social skills in children with RASopathies: a comparison of Noonan syndrome and neurofibromatosis type 1. J Neurodev Disord 2018; 10: 21. [DOI] [PMC free article] [PubMed] [Google Scholar]
- 14.Glasson EJ, Buckley N, Chen W, et al. Systematic Review and Meta-analysis: Mental Health in Children With Neurogenetic Disorders Associated With Intellectual Disability. J Am Acad Child Adolesc Psychiatry 2020; 59: 1036–48. [DOI] [PubMed] [Google Scholar]
- 15.Bruno JL, Shrestha SB, Reiss AL, Saggar M, Green T. Altered canonical and striatal-frontal resting state functional connectivity in children with pathogenic variants in the Ras/mitogen-activated protein kinase pathway. Mol Psychiatry 2022. DOI: 10.1038/s41380-021-01422-5. [DOI] [PMC free article] [PubMed] [Google Scholar]
- 16.Fattah M, Raman MM, Reiss AL, Green T. PTPN11 Mutations in the Ras-MAPK Signaling Pathway Affect Human White Matter Microstructure. Cereb Cortex 2021; 31: 1489–99. [DOI] [PMC free article] [PubMed] [Google Scholar]
- 17.Johnson EM, Ishak AD, Naylor PE, Stevenson DA, Reiss AL, Green T. PTPN11 Gain-of-Function Mutations Affect the Developing Human Brain, Memory, and Attention. Cereb Cortex 2019; 29: 2915–23. [DOI] [PMC free article] [PubMed] [Google Scholar]
- 18.Reynolds CR, Kamphaus RW. BASC: Behavior Assessment System for Children Manual. American Guidance Service. Inc, Circle Pines, MN 1992. [Google Scholar]
- 19.Gioia GA, Isquith PK, Guy SC, & Kenworthy L Behavior rating inventory of executive function: BRIEF. Psychological Assessment Resources Odessa, FL., 2000. [Google Scholar]
- 20.Constantino JN, Davis SA, Todd RD, et al. Validation of a brief quantitative measure of autistic traits: comparison of the social responsiveness scale with the autism diagnostic interview-revised. J Autism Dev Disord 2003; 33: 427–33. [DOI] [PubMed] [Google Scholar]
- 21.Wechsler D Wechsler intelligence scale for children--Fourth Edition (WISC-IV). San Antonio, TX: The Psychological Corporation; 2003; 3. [Google Scholar]
- 22.Wechsler preschool and primary scale of intelligence - third edition (WPPSI-III). PsycEXTRA Dataset. 2013. DOI: 10.1037/e313642005-011. [DOI] [Google Scholar]
- 23.Brooks BL, Sherman EMS, Strauss E. NEPSY-II: A Developmental Neuropsychological Assessment, Second Edition. Child Neuropsychology. 2009; 16: 80–101. [Google Scholar]
- 24.Kaufman J, Birmaher B, Brent D, et al. Schedule for Affective Disorders and Schizophrenia for School-Age Children-Present and Lifetime Version (K-SADS-PL): initial reliability and validity data. J Am Acad Child Adolesc Psychiatry 1997; 36: 980–8. [DOI] [PubMed] [Google Scholar]
- 25.Gansler DA, Varvaris M, Schretlen DJ. The use of neuropsychological tests to assess intelligence. Clin Neuropsychol 2017; 31: 1073–86. [DOI] [PubMed] [Google Scholar]
- 26.Package ‘car.’ 2022. https://cran.r-project.org/web/packages/car/car.pdf (accessed 6 March 2023).
- 27.Fritz CO, Morris PE, Richler JJ. Effect size estimates: current use, calculations, and interpretation. J Exp Psychol Gen 2012; 141: 2–18. [DOI] [PubMed] [Google Scholar]
- 28.Pierpont EI, Pierpont ME, Mendelsohn NJ, Roberts AE, Tworog-Dube E, Seidenberg MS. Genotype differences in cognitive functioning in Noonan syndrome. Genes Brain Behav 2009; 8: 275–82. [DOI] [PMC free article] [PubMed] [Google Scholar]
- 29.Froehlich TE, Lanphear BP, Epstein JN, Barbaresi WJ, Katusic SK, Kahn RS. Prevalence, recognition, and treatment of attention-deficit/hyperactivity disorder in a national sample of US children. Arch Pediatr Adolesc Med 2007; 161: 857–64. [DOI] [PubMed] [Google Scholar]
- 30.Pierpont EI, Wolford M. Behavioral functioning in cardiofaciocutaneous syndrome: Risk factors and impact on parenting experience. Am J Med Genet A 2016; 170: 1974–88. [DOI] [PubMed] [Google Scholar]
- 31.Fitzgerald EM. Regulation of voltage-dependent calcium channels in rat sensory neurones involves a Ras-mitogen-activated protein kinase pathway. J Physiol 2000; 527 Pt 3: 433–44. [DOI] [PMC free article] [PubMed] [Google Scholar]
- 32.Lord C, Rutter M, DiLavore PC, Risi S. Autism Diagnostic Observation Schedule--Generic. PsycTESTS Dataset. 2016. DOI: 10.1037/t17256-000. [DOI] [Google Scholar]
- 33.Rutter M ADI-R: Autism Diagnostic Interview Revised : Manual. Western Psychological Services, 2008. [Google Scholar]
- 34.Garg S, Brooks A, Burns A, et al. Autism spectrum disorder and other neurobehavioural comorbidities in rare disorders of the Ras/MAPK pathway. Dev Med Child Neurol 2017; 59: 544–9. [DOI] [PubMed] [Google Scholar]
- 35.Chisholm AK, Haebich KM, Pride NA, et al. Delineating the autistic phenotype in children with neurofibromatosis type 1. Mol Autism 2022; 13: 3. [DOI] [PMC free article] [PubMed] [Google Scholar]
- 36.Roelofs RL, Wingbermühle E, Kessels RPC, Egger JIM. Social cognitive training for adults with Noonan syndrome: a feasibility study. Neuropsychiatr Dis Treat 2019; 15: 611–26. [DOI] [PMC free article] [PubMed] [Google Scholar]
- 37.Chisholm AK, Anderson VA, Pride NA, Malarbi S, North KN, Payne JM. Social Function and Autism Spectrum Disorder in Children and Adults with Neurofibromatosis Type 1: a Systematic Review and Meta-Analysis. Neuropsychol Rev 2018; 28: 317–40. [DOI] [PubMed] [Google Scholar]
- 38.Nock MK, Kazdin AE, Hiripi E, Kessler RC. Lifetime prevalence, correlates, and persistence of oppositional defiant disorder: results from the National Comorbidity Survey Replication. J Child Psychol Psychiatry 2007; 48: 703–13. [DOI] [PubMed] [Google Scholar]
- 39.Burke JD, Hipwell AE, Loeber R. Dimensions of oppositional defiant disorder as predictors of depression and conduct disorder in preadolescent girls. J Am Acad Child Adolesc Psychiatry 2010; 49: 484–92. [DOI] [PMC free article] [PubMed] [Google Scholar]
- 40.Shaw P, De Rossi P, Watson B, et al. Mapping the development of the basal ganglia in children with attention-deficit/hyperactivity disorder. J Am Acad Child Adolesc Psychiatry 2014; 53: 780–9.e11. [DOI] [PMC free article] [PubMed] [Google Scholar]
- 41.Hyman SL, Levy SE, Myers SM, COUNCIL ON CHILDREN WITH DISABILITIES, SECTION ON DEVELOPMENTAL AND BEHAVIORAL PEDIATRICS. Identification, Evaluation, and Management of Children With Autism Spectrum Disorder. Pediatrics 2020; 145. DOI: 10.1542/peds.2019-3447. [DOI] [PubMed] [Google Scholar]
- 42.Chaudhari VS. Social functioning, interpersonal difficulties, social deficits, and social skills training in ADHD. In: New Developments in Diagnosing, Assessing, and Treating ADHD. IGI Global, 2021: 196–210. [Google Scholar]
- 43.Eijk S, Mous SE, Dieleman GC, et al. Autism Spectrum Disorder in an Unselected Cohort of Children with Neurofibromatosis Type 1 (NF1). J Autism Dev Disord 2018; 48: 2278–85. [DOI] [PMC free article] [PubMed] [Google Scholar]
- 44.Tartaglia M, Zampino G, Gelb BD. Noonan syndrome: Clinical aspects and molecular pathogenesis. Mol Syndromol 2010; 1: 2–26. [DOI] [PMC free article] [PubMed] [Google Scholar]
- 45.Allen M, Poggiali D, Whitaker K, Marshall TR, van Langen J, Kievit RA. Raincloud plots: a multi-platform tool for robust data visualization. Wellcome Open Res 2021; 4: 63. [DOI] [PMC free article] [PubMed] [Google Scholar]
- 46.Wickham H Ggplot2. New York, NY: Springer, 2011. [Google Scholar]
Associated Data
This section collects any data citations, data availability statements, or supplementary materials included in this article.
Supplementary Materials
Appendix S1: Detailed recruitment and exclusion criteria
Table S1: Psychiatric interview results using the KSADS for the Noonan syndrome group
Table S2: Statistical values for primary comparisons
Figure S1: Correlation heat map among all variables
Table S3: Group comparisons for additional BASC-2 measures
Table S4: Group means and statistics by symptom cluster
Table S5: Effect sizes compared between models with age and sex covariates and models with no covariates