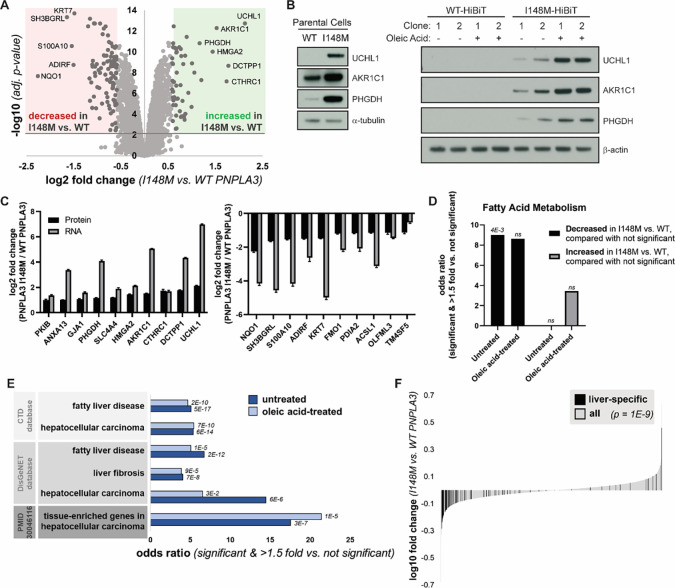
Figure 3. PNPLA3-I148M causes proteomic changes consistent with liver disease.
(A) Volcano plot of proteins quantified by mass spectrometry in untreated cells expressing WT or PNPLA3-I148M. Red and green compartments contain proteins significantly (adj. p-value < 0.01) decreased or increased, respectively, by >1.5 fold in the I148M vs. WT cell lines. (B) Confirmation of top proteomic hit proteins in parental Hep3B cells and additional HiBiT clones, with and without incubation with 200 μM oleic acid overnight. (C) Log2 fold changes of top ten significantly upregulated (left) and significantly downregulated (right) proteins in untreated mass spectrometry, compared with gene expression from RNA-seq. (D) Enrichment of the biological process keyword in proteins significantly (adj. p-value < 0.01) decreased or increased by >1.5 fold in the I148M vs. WT PNPLA3 cell lines versus those not significantly changing. Fatty acid metabolism is the only term that is significant after multiple testing correction in at least one comparison. p-values indicated above the bars. (E) Proteins significantly (adj. p-value < 0.01) decreased or increased by >1.5 fold in the I148M vs. WT PNPLA3 cell lines were compared with those not significantly changed. Enrichment of liver disease-related terms was determined; adjusted p-value by Fisher’s exact test is shown. (F) Plot showing the log10 fold change for proteins quantified in the I148M vs. WT PNPLA3 untreated cell lines. Those reported (TiGER database) to be liver-specific genes are shown in black. Kolmogorov-Smirnov p-value testing for a difference in fold change distribution between the two protein sets is reported.

