

Abstract
The plasma membrane is a well-organized structure of lipids and proteins, segmented into lipid compartments under 200 nm in size. This specific spatial patterning is crucial for the function of proteins and necessitates super-resolution imaging for its elucidation. Here, we establish that the genetically encoded enhanced green fluorescent protein (EGFP), when combined with direct optical reconstruction microscopy (dSTORM), tracks shear- and cholesterol-induced nanoscopic patterning of potassium channels overexpressed in HEK293T cells. Leveraging EGFP in dSTORM (EGFP-STORM), our findings indicate that cholesterol directs the C-terminus of TWIK-related potassium channel (TREK-1) to ceramide-enriched lipid ganglioside (GM1) clusters. In the absence of the C-terminus, the channel associates with phosphatidylinositol 4,5-bisphosphate (PIP2) cluster. Similarly, cholesterol derived from astrocytes repositions EGFP-tagged inward-rectifying potassium (Kir) channels into GM1 clusters. Without cholesterol, the channel aligns with PIP2 lipids. We deduce that cholesterol’s interaction with Kir sequesters the channel, separating it from its activating lipid PIP2. Fundamentally, a genetically encoded EGFP tag should make any protein amenable to dSTORM analysis.
INTRODUCTION
Super-resolution imaging is a technique that employs single molecule localization (SML) to enhance the resolution of optical microscopy beyond the diffraction limit of light, which is approximately 250 nm. For this technique to be effective, a fluorophore must enter dark state with no fluorescence referred to as “blinking”. In 2008, it was discovered that this blinking property existed in common fluorophores, such as Cy3b, leading to the development of an SML adaptation to stochastic reconstruction microscopy (STORM) termed direct STORM (dSTORM) 1. dSTORM significantly streamlined the reagents required for SML since organic dyes suitable for this purpose were already accessible and frequently conjugated to commercially available antibodies.
Recently, dSTORM has been instrumental in discerning the association of proteins with distinct lipid compartments including, for example, in exploring membrane-mediated mechanisms underlying general anesthesia and mechanosensation. The anesthetic and mechanosensitive ion channel, TWIK-related potassium channel-1 (TREK-1), associates with ordered clusters of saturated lipids capable of binding palmitate – a 16-carbon saturated lipid covalently attached to proteins. Notably, anesthetics compete with palmitate at the anesthetic/palmitate (AP) site, as detailed in supplemental Figure 12.
Many contemporary biological imaging techniques employ genetically encoded fluorophores, especially the enhanced green fluorescent protein (EGFP). EGFP is ideal for both live and fixed imaging as it negates the need for membrane permeabilization and antibodies, allowing access to intracellular molecules (as seen in Fig. 1A). Early developments led to the creation of a photoactivatable variant of EGFP, subsequently incorporated into a SML method termed photo-activated localization microscopy (PALM)3. Although these genetically encoded proteins excel in SML, they remain rarer than EGFP, and preparing samples for super-resolution imaging using them demands significant effort. Furthermore, recent advancements have adapted PALM techniques for dSTORM buffers, allowing the integration of photoactivatable encoded proteins with organic dyes. This development has been pivotal, as we’ve recently utilized dSTORM buffers in live cell imaging4.
Figure 1. Characterization of genetically encoded EGFP as a dSTORM Fluorophore.

(A) (Top) Cartoon depicting the differences in labeling techniques between labeling with enhanced green fluorescent protein (EGFP, green, left) and protein antibodies (Ab, blue, right) for direct stochastic reconstruction microscopy (dSTORM). Antibody labeling can require permeabilization (depicted with white lines). (Bottom) Experimental setup comparing a genetically encoded PIP2 sensor with EGFP (left) and anti-PIP2 antibody (right). The antibody typically requires permeabilization. (B) Ion channels TWIK-related potassium channel 1 (TREK-1) and inward rectifying potassium channel 2.1 (Kir2.1) were overexpressed in HEK293T cells with a genetically encoded EGFP tag. The resolution from dSTORM using EGFP tagged protein (green) is compared to the resolution using traditional Cy3B antibody-labeled TREK-1 (TREK-1_Cy3b, blue). When directly compared in side-by-side experiments, the resolutions were similar for both techniques (40–55 nm). (C) Fixation with 3 dynes/cm2 rotary shear marginally reduced the resolution, although the reduction was not statistically significant. (D) Cluster analysis of Atto647-conjugated anti-PIP2 antibody (Ab) and a EGFP tagged PIP2 sensor. (E) Cartoon depicting the experimental setup for treating a culture with astrocytes conditioned media (ACM). First ACM is generated by placing media on primary cortical astrocytes (purple cells, left) from mouse. The ACM is then removed, centrifuged, and placed on the treated culture. The treated cells are then fixed and imaged by direct stochastic reconstruction microscopy (dSTORM). (F) Determination of PIP2 lipid cluster sizes using EGFP encoded PIP2 sensor. The cluster size of PIP2 in HEK293T cells was unaffected by a 2-hour treatment with astrocyte-conditioned media.
Merging EGFP with dSTORM presents a promising avenue for SML. In theory, EGFP can be a formidable tool for ascertaining the nanoscopic spatial patterning of a protein. Proteins typically segregate into compartments of cholesterol and ganglioside lipids (GM1) or charged unsaturated lipids like PIP2 and PIP3 (as illustrated in Fig. S1A)4–7. To visualize the spatial organization of proteins alongside lipids, these lipids must also be fluorescently labeled. However, lipids cannot be genetically tagged - or at least not directly. This limitation underscores the need to incorporate organic dyes characteristic of dSTORM. A super-resolution technique that’s compatible with EGFP could significantly broaden the uptake of super-resolution imaging, particularly for elucidating nanoscopic protein patterning in intact cells. In this work, we employ EGFP-tagged TREK-1 and inward rectifying potassium channel 2.1 (Kir2.1) to showcase nanoscopic patterning alterations in response to fluid shear and increased membrane cholesterol levels.
RESULTS
To demonstrate the capability of the genetically encoded EGFP for dSTORM, we tagged TREK-1 and the inward rectifying potassium channel 2.1 (Kir2.1) at their C-terminus with EGFP and overexpressed these proteins in HEK293T cells. Figure 1B presents a comparative analysis of the resolution achieved using dSTORM with EGFP-tagged proteins against the resolution from the traditionally labeled TREK-1 using a Cy3B antibody (referred to as TREK-1_Cy3b). When examined under identical conditions, both methodologies offered comparable resolutions, ranging from 40 to 55 nm for all tested proteins. This highlights the potential of EGFP as a reliable substitute for super-resolution imaging.
Notably, dSTORM excels in revealing shear-induced shifts in spatial patterning2,4,8–11. We discovered that EGFP provides a convenient means of quantifying shear-induced alterations in lipid localization. Introducing a 3 dynes/cm2 rotary shear during the fixation phase resulted in only a negligible, statistically non-significant drop in the resolution achieved through EGFP (refer to Fig. 1C). This supports the durability of EGFP across different experimental setups.
Furthermore, we employed a PIP2 sensor to measure the diameter of PIP2 clusters in HEK293T cells, and subsequently compared these measurements to sizes determined using a PIP2 antibody. This PIP2 sensor consists of the pleckstrin homology (PH) domain from delta phospholipase C tagged with EGFP. Cluster analysis using either the anti-PIP2 Ab or EGFP showed PIP2 cluster diameters of 205±6 nm and 228±42 nm, respectively (see Fig. 1D). These results suggest that the multivalent clustering of the PIP2 antibody does not alter the cluster diameter.
EGFP dSTORM of Truncated TREK-1:
The C-terminus of TREK-1 plays a pivotal role in many of the channel’s functional attributes. Notably, TREK-1 attaches to GM1 lipids via its C-terminus and forms a complex with phospholipase D2 (PLD2)12. This palmitoylated enzyme, PLD2, adheres to GM1 lipids and redirects TREK-1 away from PIP213. Cholesterol amplifies PLD2’s interaction with GM1 lipids4, which consequently inhibits the channel. Notably, in the brain, cholesterol is supplied by astrocytes and transported to neurons to modulate protein function via GM1 lipids14.
The C-terminus of TREK-1 is also the target for most commercial antibodies. Excising the C-terminus for functional examination removes the epitope, thereby complicating dSTORM analysis. To circumvent this challenge, we opted for EGFP as the dSTORM fluorophore and overexpressed both the full length (TREK-FL) and a truncated yet functionally active version of TREK-1 (TREKtrunc) in HEK293T cells.
Figure 2A outlines the experimental protocol for the 3-color dSTORM used in our investigation. ACM, as described in Figure 1E, was introduced to cultured cells. Following fixation, permeabilization, and staining for GM1 and PIP2 clusters with CTxB and antiPIP2 antibody respectively, we gauged the proximity of the two fluorophores using a pair correlation function5. Molecules in close proximity yielded a curve with a high pair correlation (as shown in Fig. 1B). The closest obtainable distance containing significant data (typically spanning 5–25 nm) was then compared.
Figure 2: Tracking TREK-1 spatial patterning using EGFP-STORM.
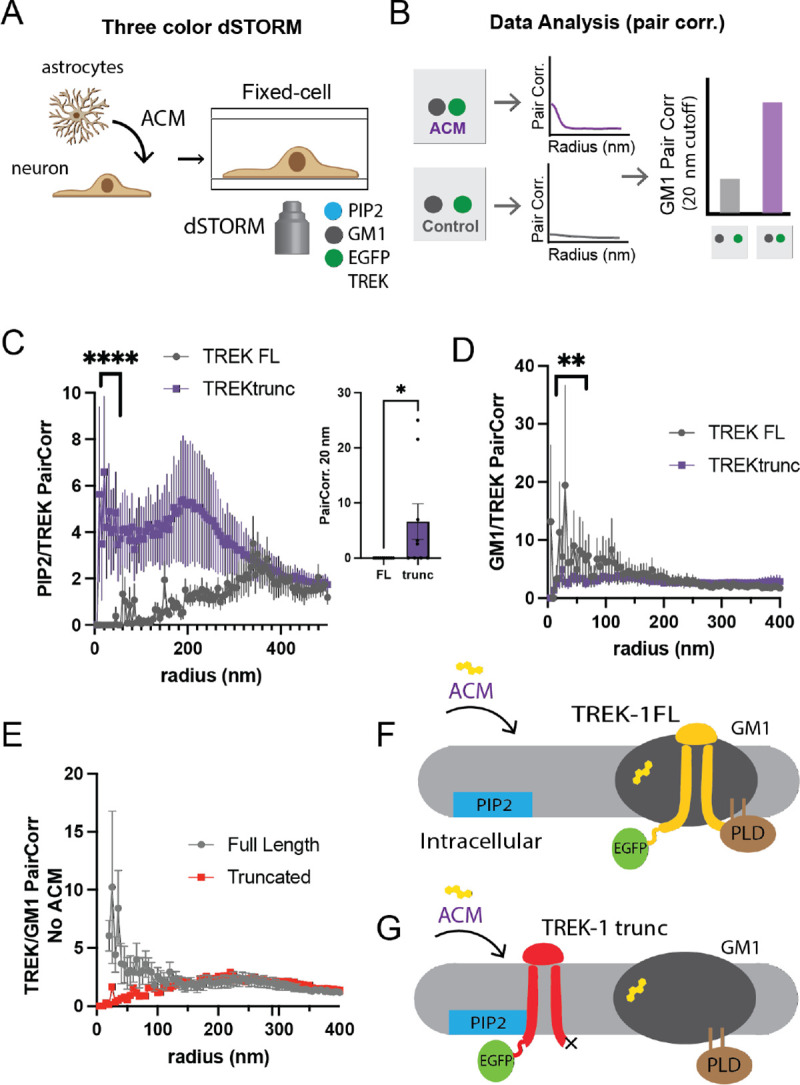
(A) An illustration demonstrates three-color direct stochastic optical reconstruction microscopy (dSTORM) technique employed in this study to determine the spatial patterning of human TWIK-related potassium channels (TREK-1) into lipid domains at nanoscopic distances (<250 nm). The proteins are genetically encoded with a C-terminal enhanced green fluorescent protein (EGFP) and over expressed in HEK293T cells. The cells are fixed, and the lipids are stained with fluorescent anti-PIP2 antibody (atto-647) and fluorescent cholesterol toxin B (cy3b-555). (B) The localization of a protein with a lipid is determined by pairwise correlation analysis (Pair corr.) of the GFP with each lipid (see hypothetical curve). A statistical comparison between two treatments is made at the shortest radius with sufficient data (see hypothetical bar graph). (C-D) Three-color dSTORM images of both the full-length TREK-1 (FL) and its C-terminally truncated variant (TREKtrunc). After treatments both with and without astrocyte-conditioned media (ACM), a cholesterol source in the brain, the cells were fixed and stained as shown in panel A. Panel C shows TREKtrunc maintained high pair correlation with PIP2 after ACM treatment (purple line), but not TREK FL. The inset shows statistical significance (n=9) at a single radius of 20 nm. Panel D shows that after ACM treatment, TREK FL correlated with GM1 lipids, but not TREKtrunc. (E) GM1 TREK-1 Pair corr. prior to cholesterol loading. In overexpressed cells TREK-1 associates with GM1 lipids in moderate cholesterol. (F-G) A summary cartoon illustrates the spatial patterning of TREK-1 using an EGFP tag. PIP2 clusters (blue) are shown separated from GM1 clusters (dark gray). Panel F shows when the concentration of membrane cholesterol (yellow) increases, the GFP signal associated with TREK-1 correlates with the GM1 lipids, but not PIP2. Panel G shows when TREK-1 is truncated, prior to its phospholipase d2 (PLD2) binding site (TREKtrunc, red shading), the channel associates strongly with PIP2, but not GM1 lipids.
Figure 2C juxtaposes TREKtrunc with TREK-FL. In the context of high cholesterol (i.e., ACM), TREK-1 exhibited a robust association with PIP2 (as seen in Fig. 2C) but not with GM1 lipids (Fig. 2D). Statistical assessment of PIP2/TREK-1 at 20 nm revealed a significant upsurge in the PIP2/TREKtrunc pair correlation as opposed to Wt. Conversely, TREK-FL displayed the opposite trend.
Monitoring shear-induced changes in spatial patterning with EGFP.
Previously, we demonstrated that shear forces prompt TREK-1 to shift from GM1 clusters to PIP2 clusters in permeabilized cells. However, due to the lack of a suitable antibody for the extracellular domain, direct comparisons between permeabilized and non-permeabilized cells were elusive. While photoactivatable fluorescent proteins are typically employed for such investigations, we evaluated this measurement using an EGFP tag and compared our findings with those from permeabilized cells.
Figure 3A presents TREK-1 under both shear and non-shear conditions in non-permeabilized cells. Notably, shear application significantly diminished the association of TREK-1 with GM1 clusters. For comparison, a similar experiment employing anti-TREK Cy3b in permeabilized cells is depicted in Figure 3C. A mouse phospholipase D2 (mPLD2), an enzyme known to activate TREK-1, showed a similar decrease in TREK-1 pair correlation with GM1 clusters upon shear application in HEK293T cells co-expressing TREK-1 and mPLD2.
Figure 3. The use of EGFP to track shear-induced changes in Spatial Patterning of TREK-1.

This figure demonstrates how an EGFP tag is used to monitor the trafficking of full-length human TREK-1 between PIP2 and GM1 lipids in response to shear and cholesterol in HEK293T cells. (A) Pairwise correlation (Pair corr.) of TREK_EGFP with GM1 lipids in non-permeabilized conditions. Prior to a 3 dynes/cm^2 fluid shear (red curve), there’s a correlation between overexpressed TREK-1 and GM1 lipids, which disappears post-shear. (B) An analogous experiment to (A), but employing cy3b-antiTREK-1 antibodies (cy3b_TREK) instead of EGFP encoding. (C) A variation of (B) where TREK-1 was co-expressed with mouse PLD2 (mPLD2), an activator of TREK-1. (D-E) Correlation analyses of EGFP-labeled TREK-1 in the presence of Fetal Bovine Serum (FBS, 10%) and apolipoprotein E (apoE, 4 ng/mL). (D) Reveals decreased TREK-EGFP correlation with PIP2 lipids in FBS (purple curve), hinting at TREK-1’s migration from PIP2 to GM1 clusters. (E) Confirms the GM1-TREK-1 correlation in FBS-treated cells. However, upon shear stress, this association breaks despite FBS presence, underscoring EGFP’s reliability in tracking TREK-1 spatial dynamics. (F) Cholesterol quantification via a cholesterol oxidase fluorescence assay shows a decline in cholesterol content in HEK293T cells post mechanical shear. (G) A schematic depicting TREK-1’s shift from GM1 (top) to PIP2 lipids (bottom) following mechanical shear (denoted by a red arrow). It also visualizes cholesterol’s role in TREK-1’s placement, either its removal through delipidated apoE (top left) or its addition via FBS (top right) in the absence of shear.
In line with the shear tests, EGFP proved effective for gauging cholesterol-induced relocations of TREK-1. Figure 3D reveals that cholesterol reduces PIP2/TREK-1 correlation while amplifying GM1/TREK-1 correlation. Intriguingly, shear application counteracted the effects of elevated cholesterol, as evidenced by EGFP-dSTORM. A subsequent cholesterol assay on the sheared samples displayed a reduction in free cholesterol, suggesting that the pair correlation decrease observed in Figure 3E might be attributable to a cholesterol concentration reversal.
Spatial patterning of Kir2.1 with EGFP and mOrange fluorescent proteins
Kir2.1, a member of the inwardly rectifying potassium channel family, is instrumental in upholding the resting membrane potential and the repolarization phase of cardiac action potentials. Dysfunctions in Kir2.1 have been linked to several cardiac diseases15.
Kir2.1 activation requires the signaling lipid phosphatidylinositol 4,5-bisphosphate (PIP2)16. PIP2 not only binds to but directly regulates the channel. Without PIP2, the channel remains inactive17. Conversely, the content of cell membrane cholesterol has an inhibitory effect on Kir2, either directly or indirectly18–20. The exact molecular mechanisms behind cholesterol’s regulatory role remain elusive.
We hypothesized Kir2.1 inhibition occurs due to cholesterol-induced spatial patterning. Specifically, we hypothesized Kir2.1 undergoes nanoscopic clustering with cholesterol-rich ganglioside (GM1) lipids, distinct from its activating lipid, PIP2. As mentioned PIP2 clusters are typically separated from GM1 clusters. If Kir2.1 is associated to GM1 domains, it would be distanced from its agonist PIP2, thereby remaining inactive.
To test our hypothesis, we over expressed EGFP-Kir2.1 in HEK293T cells both with and without ACM. Using 3-color dSTORM imaging in HEK293T cells, we observed Kir2.1 movement after incubation with astrocyte conditioned media (ACM). Elevated cholesterol levels notably increased Kir2.1’s correlation with GM1 clusters (Fig. 4B, purple curve) while decreasing its correlation with PIP2 clusters (Fig. 4A, purple curve). This suggests cholesterol loading prompts Kir2.1 to shift away from PIP2 and toward GM1 clusters.
Figure 4: Effects of astrocyte cholesterol on inward rectifying K+ channel 2.1 (Kir2.1) spatial patterning.

(A) Kir2.1’s pairwise correlation (PairCorr) with PIP2 was studied using dSTORM. Localization was assessed both in the presence and absence of astrocyte-conditioned media (ACM). Kir2.1 was tagged with EGFP, and the anti-PIP2 antibody was labeled with Atto647. (B) Correlation between GM1 and Kir2.1 extracted from the same samples as in (A). (C) Kir2.1’s correlation with PIP2, where Kir2.1 used an mOrange fluorescent tag and the anti-PIP2 antibody was conjugated with the atto-647 dye. (D) A proposed model illustrates Kir2.1’s cholesterol-driven inhibition due to its nanoscopic association with GM1 organized lipid clusters. The PIP2 clusters are set apart from GM1 clusters by a distance ranging from 150 to 200 nm. PIP2’s concentration is at its nadir within saturated GM1 clusters. Cholesterol induces TREK-1’s shift from the PIP2 cluster, aligning it with GM1 clusters instead. This localized dip in PIP2 concentration subsequently inhibits the channel.
Tagging Kir2.1 with mOrange, also allowed for Kir2.1/PIP2 pair correlations analysis (Fig. 4C) using a PIP2 antibody. The genetically endoded mOrange strongly correlated with an atto 488 conjugated PIP2 antibody. In theory the longer wavelength of mOrange, should allow for the colocalization of Kir2.1 with PIP2 using the EGFP-PIP2 sensor characterized in Figure 1. The two sensors did colocalize but not nearly to the same degree as with PIP2 antibody applied after fixing the cells. The overexpressed PIP2 sensory likely competes for Kir2.1 for PIP2 displacing some of it from PIP2 clusters and decreasing the correlation with of the two proteins.
DISCUSSION
Our data collectively suggest that EGFP serves as an apt fluorophore for dSTORM in the context of shear and cholesterol-related experiments. The conclusions drawn from our shear experiments using EGFP are consistent with our previous findings. Furthermore, the technique’s applicability appears to be broad, as evidenced by the suitability of EGFP-Kir2.1 for dSTORM pair correlation analysis.
The most straightforward application is the two-color GM1/GFP pair correlation. Given that GM1 is extracellular, tracking a protein’s movement in and out of GM1 clusters with EGFP is likely to become a routine approach for palmitoylated proteins as well as other integral raft proteins. Our data show that EGFP-tagged TREK-1 yielded results comparable to those obtained using anti-TREK-1 antibodies.
Enhanced green fluorescent protein (EGFP) was engineered to augment the photostability of the original green fluorescent protein (GFP). EGFP boasts a quantum yield of 0.6 and an extinction coefficient of 55,000 M-1 cm-1. In contrast, the widely-used dye Alexa 647 (A647) has a quantum yield of 0.33 and an extinction coefficient of 239,000 M-1 cm-1. In addition to mOrange other fluorescent proteins likely have some utility in dSTORM.
Previous studies using PALM imaged PIP2 domains by utilizing the mEOS-tagged PH domain. The measured cluster diameters in these studies were notably similar to our observations with EGFP21. However, minimal pair correlation was observed when the PIP2 sensor co-expressed with mOrange TREK-1. This diminished correlation might stem from competition between the sensor and TREK-1, suggesting a need for further experiments to adjust for expression levels.
In N2a cells, which naturally express TREK-1, we observed only a minor association with GM1 lipids. It’s noteworthy that TREK-1 is innately present in N2a cells.
With advancements in camera sensitivity, the requisite light intensity may decrease, potentially alleviating bleaching issues. In theory, this could pave the way for using EGFP in live cell imaging, further expanding the potential of dSTORM imaging techniques.
METHODS
Cell Culture and Gene Expression
HEK293T cells (ATCC Cat# CRL-3216, RRID:CVCL_0063) were maintained in DMEM (Corning cellgro) supplemented with 10% FBS, 100 units/mL penicillin, and 100 μg/mL streptomycin. For imaging experiments, cells were seeded onto poly-D-lysine-coated ibidi 8-well chamber microscope slides or 96-well plates. 24 hours post-seeding, transfections were performed using Turbofect (Thermo Scientific). The full-length human TREK-1 with a C-terminus GFP tag in a pCEH vector was a kind gift from Dr. Stephen Long. Mouse PLD2 constructs (mPLD2) and the inactive mutant (K758R, xPLD2) without a GFP tag in a pCGN vector were provided by Dr. Michael Frohman. For co-transfection experiments, TREK-1 was combined with mPLD2 or xPLD2 at a ratio of 1:4 (0.5μg of TREK-1 to 2μg of PLD DNA) 12.
Antibody dye conjugation
Dye was reconstituted in 10 μL of DMSO. To prepare the dye-antibody mixture, 1.5 μL of the dye was combined with 50 μL of the respective antibody (TREK-1, Santa Cruz #sc-398449; PIP2, Echelon Biosciences #z-P045) and 6 μL of 1M NaHCO3 (pH 8.3). The mixture was incubated for 1.5 hours at room temperature in the dark. Post-incubation, a NAP-5 column was equilibrated with PBS. The antibody reaction was adjusted to a final volume of 200 μL with 140 μL PBS (pH 7.2) and loaded onto the NAP-5 column. After full absorption, the column was washed with 550 μL of PBS. The eluted fraction was collected post-wash and used for cell staining.
Fixed cell preparation
80% confluent HEK293T cells were fixed with 3% paraformaldehyde and 0.1% glutaraldehyde for 10 minutes. Residual glutaraldehyde was neutralized using 0.1% NaBH4 for 7 minutes. Cells were washed thrice with PBS for 10 minutes per wash, followed by permeabilization using 0.2% Triton X-100 for 15 minutes. Blocking was done with 10% BSA/0.05% Triton/PBS at room temperature for 90 minutes. Fluorescent primary antibodies were added at a 1:100 dilution in 5% BSA/0.05% Triton/PBS and incubated for 60 minutes at room temperature. This was followed by five washes with 1% BSA/0.05% Triton/PBS for 15 minutes each. Subsequently, cells were post-fixed using the same fixing mixture for 10 minutes without agitation. Cells were then washed thrice with PBS for 5 minutes per wash and twice with dH2O for 3 minutes per wash.
ACM treatment of cells
Primary mouse astrocytes from the cortex were cultivated in 10 cm plates using DMEM supplemented with 10% FBS. Upon reaching confluence, cells were sub-cultured. The spent media, termed astrocyte-conditioned media (ACM), was harvested every 3–4 days. Neuronal cells were treated with ACM for 1–2 hours prior to any additional procedures.
Three-color Super-resolution dSTORM
Imaging was conducted on a Vutara VXL super-resolution microscope (Bruker Nano Surfaces, Salt Lake City, UT) that employs the 3D Biplane technique. The imaging setup utilized a Hamamatsu Orca Fusion BT sCMOS camera, paired with a 60x water-immersion objective (NA 1.2). Data analysis was performed using Vutara SRX software (version 7.0.07). Particles were localized in 3D using the software, which used a model function derived from previously recorded bead data sets. Imaging conditions included the use of 488, 561, and 647 nm lasers in a photoswitching buffer containing cysteamine, betamercaptoethanol, glucose oxidase (GLOX), catalase, Tris, and NaCl. The pH was maintained at 8.0. Direct antibody-dye conjugation was employed to avoid the need for fluorescent secondary antibodies. Image analysis was performed using the Statistical Analysis package in the Vutara SRX software (v7.0.07).
The pair correlation function g(r), cluster analysis, resolution analysis were performed using the Statistical Analysis package in the Vutara SRX software (v7.0.07). Pair correlation analysis is a statistical method used to determine the strength of correlation between two objects by counting the number of points of probe 2 within a certain donut-radius of each point of probe 1. This allows for localization to be determined without overlapping pixels as done in traditional diffraction-limited microscopy. For three-color EGFP-STORM probes 1 and 3 and 2 and 3 were also compared using the pair correlation function. Localization at super resolution is beyond techniques appropriate for diffraction-limited microscopy such as Pearson’s correlation coefficient. Lipid cluster size was determined using the DBSCAN clustering algorithm also included as part of the Vutara SRX software. And the resolution measurements were calculated by in the Vutara SRX software using resolution analysis with a 10 nm radius and smoothing.
Cholesterol Oxidase protein preparation.
The cholesterol oxidase gene from Streptomyces sp. (accession number AAA26719.1) was codon optimized and synthesized with a C-terminal 6x his tag (….KQDVTASHHHHH) and commercially cloned into a pET-28a(+) expression vector (GeneScript, USA). The plasmid was expanded in DH5α (kanamycin resistance) and used to transform BL21 cells by the heat shock method (note: very few colonies were observed). 500 mL starter culture in LB was grown and used to inoculate 3×1L of yeast tryptone media (YT) media pH 7. Protein expression was induced at an optical density (600 nm) of 0.6 with IPTG (Isopropyl β-D-1-thiogalactopyranoside) of 1mM. After 24 hours at room temperature, the cells were centrifuged (45 min 4500g), and resuspended in approximately 25 mL of lysis buffer (20 mM Tris-HCl pH 7.0 500mM NaCl). The cells were lysed by sonication, centrifuged, and the lysate, without protease inhibitors, was bound to a 1 mL cobalt talon metal affinity column by slow gravity flow over night at 4 °C. The next morning the column was washed with 10 mL of 20 mM imidazole in lysate buffer and then eluted with a gradient of 20 to 500 mM imidazole in the same buffer using an Acta Purifier. Approximately 30 mL corresponding to the cholesterol oxidase peak was concentration to 6.0 mg/mL and run on a Superdex 200 size exclusion column in 20 mM tris pH 7.0 to remove the imidazole.
Cholesterol Assay
HEK293T cells were cultured in 48 well plates with 200uL media in each well and then changed to 200uL PBS for the shear treatment. The shear plate was incubated with PBS on an orbital rotator at 3dyn/cm^2 for 10 min in a 37°C incubator. The control plate was incubated with PBS for 10 min in the same incubator with no shear. Then the shear plate was incubated with 200uL 4%PFA+0.1% glutaraldehyde in PBS for 10 min with 3dyn/cm^2 shear and 10 min without shear. The control plate was fixed for 20 min with no shear.
Statistical analysis
All statistical analysis were performed in GraphPad Prism 9.0. For the Student’s t test, significance was calculated using a two-tailed, unpaired parametric test with significance defined as *P < 0.05, **P < 0.01, ***P < 0.001, and ****P < 0.0001.
Supplementary Material
Acknowledgments
We thank Michael Frohman from Stony Brook for the mouse PLD and mutant PLD cDNA and Steven Long from Memorial Sloan Kettering for human TREK-1-GFP. This work was supported by an R01 (R01NS112534) from the National Institutes of Health. We are grateful to the JPB Foundation for the purchase of a super resolution microscope. The authors declare no conflict of interest.
REFERENCES
- 1.Heilemann M., Van De Linde S., Schüttpelz M., Kasper R., Seefeldt B., Mukherjee A., Tinnefeld P., and Sauer M. (2008). Subdiffraction-resolution fluorescence imaging with conventional fluorescent probes. Angew. Chemie - Int. Ed. 47, 6172–6176. 10.1002/anie.200802376. [DOI] [PubMed] [Google Scholar]
- 2.Pavel M.A., Petersen E.N., Wang H., Lerner R.A., and Hansen S.B. (2020). Studies on the mechanism of general anesthesia. Proc. Natl. Acad. Sci. U. S. A. 117, 13757–13766. 10.1073/pnas.2004259117. [DOI] [PMC free article] [PubMed] [Google Scholar]
- 3.Shroff H., Galbraith C.G., Galbraith J.A., and Betzig E. (2008). Live-cell photoactivated localization microscopy of nanoscale adhesion dynamics. Nat. Methods 5, 417–423. 10.1038/nmeth.1202. [DOI] [PMC free article] [PubMed] [Google Scholar]
- 4.Petersen E.N., Chung H.-W., Nayebosadri A., and Hansen S.B. (2016). Kinetic disruption of lipid rafts is a mechanosensor for phospholipase D. Nat. Commun. 7, 13873. 10.1038/ncomms13873. [DOI] [PMC free article] [PubMed] [Google Scholar]
- 5.Yuan Z., and Hansen S.B. (2023). Cholesterol Regulation of Membrane Proteins Revealed by Two-Color Super-Resolution Imaging. Membranes (Basel). 13, 250. 10.3390/membranes13020250. [DOI] [PMC free article] [PubMed] [Google Scholar]
- 6.van den Bogaart G., Meyenberg K., Risselada H.J., Amin H., Willig K.I., Hubrich B.E., Dier M., Hell S.W., Grubmüller H., Diederichsen U., et al. (2011). Membrane protein sequestering by ionic protein-lipid interactions. Nature 479, 552–555. 10.1038/nature10545. [DOI] [PMC free article] [PubMed] [Google Scholar]
- 7.Sezgin E., Levental I., Mayor S., and Eggeling C. (2017). The mystery of membrane organization: composition, regulation and roles of lipid rafts. Nat. Rev. Mol. Cell Biol. 18, 361–374. 10.1038/nrm.2017.16. [DOI] [PMC free article] [PubMed] [Google Scholar]
- 8.Wang H., Yuan Z., Pavel M.A., Jablonski S.M., Jablonski J., Hobson R., Valente S., Reddy C.B., and Hansen S.B. (2023). The role of high cholesterol in SARS-CoV-2 infectivity. J. Biol. Chem. 299, 104763. 10.1016/j.jbc.2023.104763. [DOI] [PMC free article] [PubMed] [Google Scholar]
- 9.Yuan Z., Pavel M.A., Wang H., Kwachukwu J.C., Mediouni S., Jablonski J.A., Nettles K.W., Reddy C.B., Valente S.T., and Hansen S.B. (2022). Hydroxychloroquine blocks SARS-CoV-2 entry into the endocytic pathway in mammalian cell culture. Commun. Biol. 5, 958. 10.1038/s42003-022-03841-8. [DOI] [PMC free article] [PubMed] [Google Scholar]
- 10.Pavel M.A.M.A., Chung H.-W.H.H.-W., Petersen E.N.N., and Hansen S.B.S.B. (2019). Polymodal Mechanism for TWIK-Related K+ Channel Inhibition by Local Anesthetic. Anesth. Analg. 129, 973–982. 10.1213/ANE.0000000000004216. [DOI] [PubMed] [Google Scholar]
- 11.Wang H., Kulas J.A., Higginbotham H., Kovacs M.A., Ferris H.A., Scott B., and Hansen S.B. (2022). Regulation of neuroinflammation by astrocyte-derived cholesterol. bioRxiv 2. 10.1101/2022.12.12.520161. [DOI] [Google Scholar]
- 12.Comoglio Y., Levitz J., Kienzler M. a., Lesage F., Isacoff E.Y., and Sandoz G. (2014). Phospholipase D2 specifically regulates TREK potassium channels via direct interaction and local production of phosphatidic acid. Proc. Natl. Acad. Sci. U. S. A. 111, 13547–13552. 10.1073/pnas.1407160111. [DOI] [PMC free article] [PubMed] [Google Scholar]
- 13.Petersen E.N., Pavel M.A., Hansen S.S., Gudheti M., Wang H., Yuan Z., Murphy K.R., Ja W.W., Ferris H.A., Jorgensen E.M., et al. (2023). Mechanical activation of TWIK-related potassium channel by nanoscopic movement and rapid second messenger signaling. BioRxiv. doi.org/ 10.1101/758896. [DOI] [PMC free article] [PubMed] [Google Scholar]
- 14.Wang H., Kulas J.A., Wang C., Holtzman D.M., Ferris H.A., and Hansen S.B. (2021). Regulation of beta-amyloid production in neurons by astrocyte-derived cholesterol. Proc. Natl. Acad. Sci. U. S. A. 118, e2102191118. 10.1073/pnas.2102191118. [DOI] [PMC free article] [PubMed] [Google Scholar]
- 15.Reilly L., and Eckhardt L.L. (2021). Cardiac potassium inward rectifier Kir2: Review of structure, regulation, pharmacology, and arrhythmogenesis. Hear. Rhythm 18, 1423–1434. 10.1016/j.hrthm.2021.04.008. [DOI] [PMC free article] [PubMed] [Google Scholar]
- 16.Hansen S.B. (2015). Lipid agonism: The PIP2 paradigm of ligand-gated ion channels. Biochim. Biophys. Acta 1851, 620–628. 10.1016/j.bbalip.2015.01.011. [DOI] [PMC free article] [PubMed] [Google Scholar]
- 17.Hansen S.B., Tao X., and MacKinnon R. (2011). Structural basis of PIP2 activation of the classical inward rectifier K+ channel Kir2.2. Nature 477, 495–498. 10.1038/nature10370. [DOI] [PMC free article] [PubMed] [Google Scholar]
- 18.Rosenhouse-Dantsker A., Logothetis D.E., and Levitan I. (2011). Cholesterol sensitivity of Kir2.1 is controlled by a belt of residues around the cytosolic pore. Biophys. J. 100, 381–389. 10.1016/j.bpj.2010.11.086. [DOI] [PMC free article] [PubMed] [Google Scholar]
- 19.Grouleff J., Irudayam S.J., Skeby K.K., and Schiøtt B. (2015). The influence of cholesterol on membrane protein structure, function, and dynamics studied by molecular dynamics simulations. Biochim. Biophys. Acta - Biomembr. 1848, 1783–1795. 10.1016/j.bbamem.2015.03.029. [DOI] [PubMed] [Google Scholar]
- 20.Levitan I. (2009). Cholesterol and Kir channels. IUBMB Life 61, 781–790. 10.1002/iub.192. [DOI] [PMC free article] [PubMed] [Google Scholar]
- 21.Raut P., Waters H., Zimmerberg J., Obeng B., Gosse J., and Hess S.T. (2022). Localization-based super-resolution microscopy reveals relationship between SARS-CoV2 spike and phosphatidylinositol (4,5): biphosphate. 11965, 10. 10.1117/12.2613460. [DOI] [PMC free article] [PubMed] [Google Scholar]
- 22.Robinson C. V., Rohacs T., and Hansen S.B. (2019). Tools for Understanding Nanoscale Lipid Regulation of Ion Channels. Trends Biochem. Sci. 44, 795–806. 10.1016/j.tibs.2019.04.001. [DOI] [PMC free article] [PubMed] [Google Scholar]
- 23.Petersen E.N., Pavel M.A., Wang H., and Hansen S.B. (2020). Disruption of palmitate-mediated localization; a shared pathway of force and anesthetic activation of TREK-1 channels. Biochim. Biophys. Acta - Biomembr. 1862, 183091. 10.1016/j.bbamem.2019.183091. [DOI] [PMC free article] [PubMed] [Google Scholar]
Associated Data
This section collects any data citations, data availability statements, or supplementary materials included in this article.