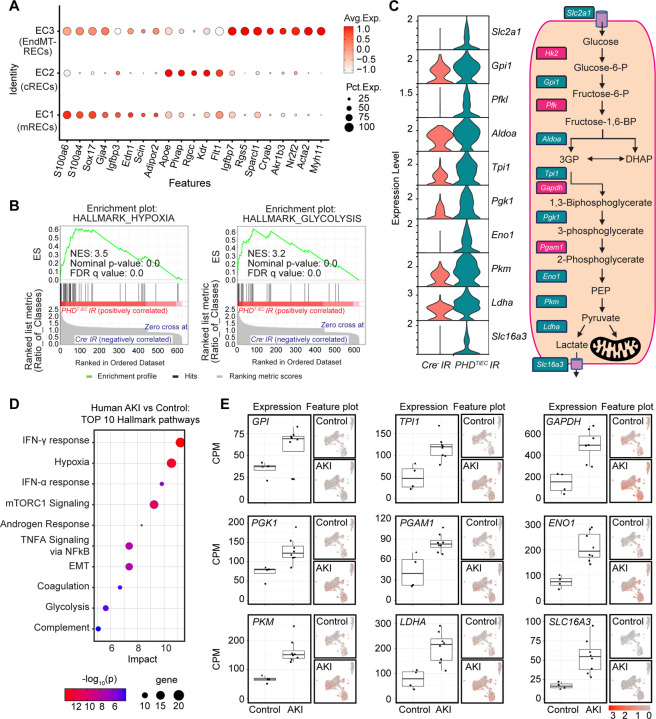
Figure 5. Post-ischemic endothelial PHD inactivation induces a hypoxia and glycolysis gene signature in mRECs.
(A) Dot plot visualization shows the expression of marker genes used to identify cRECs, mRECs and EndMT-RECs clusters. (B) GSEA in mRECs of PHDTiEC kidney compared to control. Among the most highly enriched Hallmark pathways were Hypoxia and Glycolysis. (C) Violin plots show significantly upregulated glycolytic genes in mRECs of PHDTiEC compared to control. Pathway diagram summarizes the functions of up-regulated genes (marked by teal boxes) in glycolysis. (D-E) snRNA-seq analysis of human kidney tissue from patients with severe AKI and controls (n=6–8). Analysis was performed on publicly available snRNA-seq data from Christian Hinze et al (39). (D) Bubble chart for top 10 enriched Hallmark pathways of upregulated DEGs in kidney ECs from patients with severe AKI compared to controls. (E) Box plots show the expression of glycolytic genes in kidney ECs in controls vs AKI patients. The expression levels of glycolytic genes were extracted from the online interface provided by Christian Hinze et al (https://shiny.mdc-berlin.de/humAKI). CPM, normalized counts per million; cRECs, cortical renal ECs; mRECs, medullary renal ECs; EndMT-RECs, renal ECs expressing mesenchymal markers.

