

Abstract
Acquisition of omics data advances at a formidable pace. Yet, our ability to utilize these data to control cell phenotypes and design interventions that reverse pathological states lags behind. Here we posit that cell states are determined by core networks that control cell-wide networks. To steer cell fate decisions, core networks connecting genotype to phenotype must be reconstructed and understood. A recent method, cell State Transition Assessment and Regulation (cSTAR) applies perturbation biology to quantify causal connections and mechanistically models how core networks influence cell phenotypes. cSTAR models are akin to digital cell twins enabling us to purposefully convert pathological states back to physiologically normal states. While this capability has a range of applications, we here discuss reverting oncogenic transformation.
Keywords: Omics data, Control of cell state transitions and fate decisions, cell State Transition Assessment and Regulation method, Digital cell twins
Go beyond genomics and gene expression snapshots
Genetic determination, long at the heart of thinking about cellular and organismal behavior, had its resounding successes in explaining single gene disorders and Mendelian disease correlations. Progress in sequencing technologies and proteomics has allowed us to accurately detect cell mutations, alternatively spliced genes, and gene expression variation. Yet, the phenotypic behavior of a cell remains elusive to predict from the genotype. Given genomic data, it is difficult to predict how mutations or other variations in genetic background affect responses to external cues and the outcomes of drug treatments that affect signaling proteins. The reason is that genomics has a blind spot. It does not see the important intermediaries between the cell’s genotype and phenotype – the activation patterns of signal transduction networks (STNs), which are the dynamic control and communication systems in a cell [1–4]. Here, we suggest a new approach to treat diseases and find new drug targets that from the outset considers network context, i.e. the complex interactions between genes and their products that ultimately specify the biological outcomes. We posit that such an approach could broaden the space of potential drug targets to genes products that are not mutated or otherwise genetically affected but are essential for disease processes by supporting functions that enable cells to tolerate mutated, over- and under-expressed gene products.
Dynamically changing network connections generate cell fate decisions
First insights into a connection between dynamic signaling responses and cell fate decisions came in the nineties and have been related to the activation patterns of single proteins, such as ERK and p53, a view that has persisted for a long time [5–8]. Recent progress in multiplexed imaging techniques has enabled us to link signaling response patterns of multiple proteins to cell fate decisions [9–11]. These signaling patterns are determined by the dynamic, causal connections between cellular network components [12–17]. Depending on the environmental cues, genetic backgrounds, and cell states, both the connections and their strengths can change. Determining the local, causal connections is more difficult than it might seem at first glance, because any change in a single node immediately propagates through the entire network. Therefore, only global, system responses can be experimentally measured following a perturbation that affects one or more network nodes. Although direct protein-protein interactions can be detected by current techniques, the data cannot tell the biological function of these interactions and determine how these interactions shape the network activity patterns. The direction and strength of connections between network nodes is often not quantifiable from experimental data, such as protein interaction data.
Several approaches, collectively known as Modular Response Analysis (MRA, Box I), reveal the quantitative topology of local, causal connections between network nodes. The nodes can be single molecular components, as well as network modules, which are entire pathways or groups of genes that together perform one or several identifiable tasks. A key to the inference of causal connections is measuring the global responses of the network components to systematic perturbations by small molecule inhibitors, environmental cues, or siRNA [18].
Box I. Modular Response Analysis in a nutshell.
MRA is a method for the precise quantification of local, causal connections. A natural way to quantify a direct connection from node B to node A is to consider the fractional change in the output of A (concentration or activity) brought about by a 1% change in the output of B, while keeping the activities of all other nodes frozen to prevent the propagation of the change in B. This definition of the local connection coefficient from B to A in a network of N nodes is intrinsically linked to the Jacobian matrix of N differential equations that govern the time course of the activities of all network nodes [18, 19]. In real life, any change in B propagates not only to node A but also to other nodes, directly or indirectly. The local, direct effects of B on the other nodes is challenging to measure. From the change in node A upon a perturbation to B, it is erroneous to conclude that there is a causal, direct connection between B and A, because this change can be caused by the changes in other nodes, different from B.
For a network of N nodes, MRA demonstrates that the measurements of global, systems level changes following N perturbations allow us to reveal the precise values of all network connections, including feedback loops [20–22]. Mathematically, the vector that contain all connection coefficients to each node (A) is calculated as the vector that is orthogonal to N-1 vectors of global network responses to perturbations, none of which directly affecting node A [19, 23]. Repeating this calculation for each network node completely restores all network connection coefficients. Importantly, MRA allows to integrate multiple data types, as its input are dimensionless fractional changes, allowing to reconstruct causal network connections using different perturbation data, e.g., [24–27].
Classic deterministic MRA is sensitive to biological and measurement noise and requires N perturbations for a network of N nodes, which make the reconstruction of quantitative topologies of genome-wide networks impractical. A Bayesian MRA formulation (BMRA) is robust to noise, does not require to perturb all network nodes and, critically, uses the existing knowledge as a prior distribution of the probabilities of network connections, Figure I Box I [18]. The prior network can be taken from existing databases, such as KEGG [28], String [29], or Reactome [30]. Computational experiments show that even when the prior information is inaccurate for half of the network edges, BMRA infers a nearly perfect network topology [13]. BMRA and other statistical MRA reformulations can handle networks of several hundred nodes [31]. Because network connections are quantified in terms of the elements of the Jacobian matrix of the underlying dynamical system, quantitative BMRA reconstruction of network topology helps us to create a mechanistic dynamical model of the network and determine the confidence intervals for model parameters [13].
Figure I Box I. A diagram of BMRA pipeline.
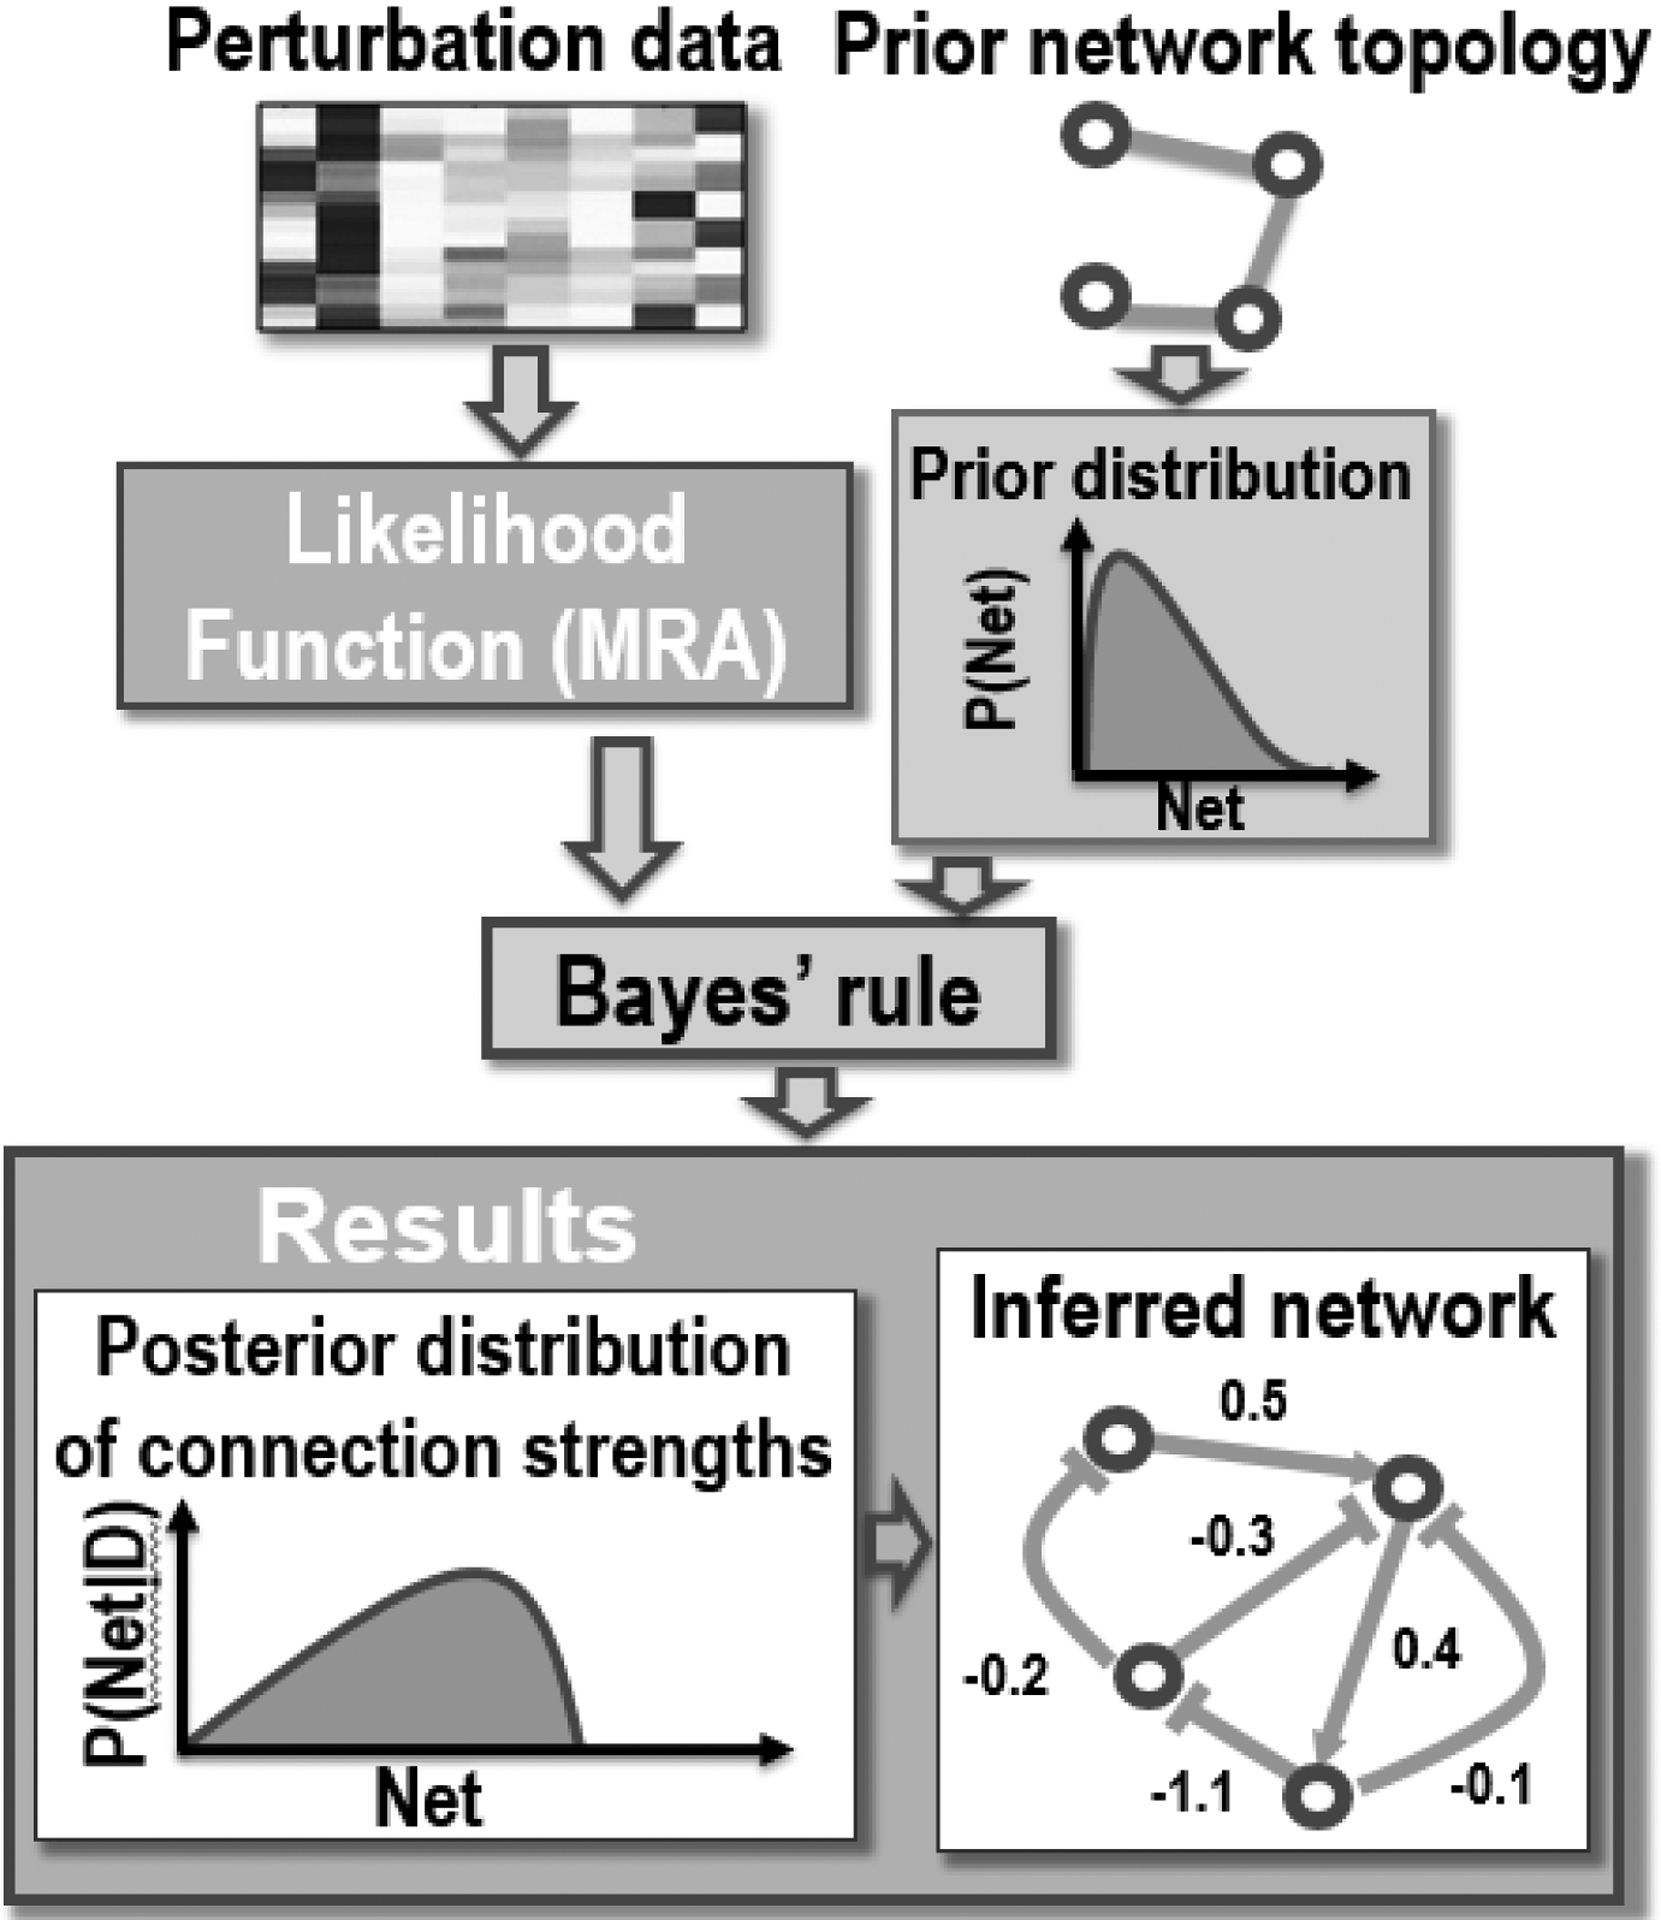
BMRA, Bayesian MRA formulation, uses the two following inputs: (1) measured responses to perturbations and (2) a prior network, derived from the existing knowledge if it is available, or a non-informative prior network (generated by the equal probability distribution for the presence or absence of a connection when the prior knowledge does not exist). In contrast to the deterministic MRA, BMRA allows to reconstruct networks using the datasets in which not all nodes are directly perturbed. MRA equations serve as the likelihood function for BMRA. Prior network connections and experimental data are fed to the Bayes rule to generate a posterior distribution of network connections and their strengths.
Understanding cell state transitions
The advent of single cell (sc)RNAseq has led to approaches to uncover cell trajectories that map successive cell states using a pseudotime technique. Different computational techniques permit the pseudotemporal ordering of cell trajectories, e.g., during epithelial-mesenchymal transition, cell differentiation or tumor progression, using static snapshots of scRNAseq data taken as part of a time series [32–34]. Similar analysis can also be applied to cross-sectional bulk or scRNAseq data obtained for patient populations by mapping these data on to one-dimensional pseudotime [35]. Yet, pseudotime is not real time, it only groups gene expression patterns that are similar to each other in a sequential order and cannot always correctly resolve the directionality and reversibility of timedependent events [36, 37]. Also, pseudotime does not provide insight into mechanisms of cell fate decisions. This creates a challenge for the analysis of time-resolved phenomena, for instance, for a cell progressing through different differentiation states or for disease progression in a patient.
To address these limitations, an elegant approach was developed that determines RNA velocity, i.e. the time derivative of the mRNA abundance, using a mature mRNA and its unspliced precursors [38]. Quantifying gene transcript velocities allows a glimpse into the future, i.e., the predicted future pattern of gene expression for the next cell state. However, the implementation of this new concept assumed the splicing rate constant to be constant and identical for all genes. Yet this central assumption is often violated [39–41]. Importantly, gene interaction dynamics determined by causal network connections could not be reconstructed from scaled RNA velocity estimations.
Subsequently, a computational framework termed Dynamo was developed that infers genome-wide absolute rates of transcription, splicing and degradation [36]. It uses metabolic labeling of newly synthesized RNA to determine the amounts of unlabeled and labeled, unspliced and mature RNA in single cells [42] and estimates kinetic rate constants and RNA velocities using linear differential equation models [41]. Importantly, this method reconstructs the RNA velocity vector field, which is the governing multivariate function that defines the dynamical system describing the temporal evolution of gene expression in single cells. Dynamo assumes that all cell states are reflected in the transcriptome, and these states are attractors, i.e., stable steady-state dynamic regimes, determined by the reconstructed RNA velocity vector fields [36]. In the simplest case, cell states are steady-state points in the transcriptomics space where the amounts of all RNA forms do not change. Accordingly, state transitions are determined by the cell trajectories starting at one steady-state point and ending at the other. Dynamo also attempts to predict the cell trajectories during state transitions, using the socalled least action path. In essence, this is a path that minimizes a necessary deviation from the RNA vector field to enable a cell to traverse from one state to the other [36].
The RNA velocity methods [38–40] and the subsequently developed approaches [36, 43] need conventional or metabolically labeled scRNA data to infer the cell trajectories and map cell states in the transcriptomics space. However, in medicine and pharmacology, most of actionable targets are proteins, such as kinases, and neither of these transcriptomic approaches can predict how signaling networks respond to drugs and overcome network-encoded drug resistance that unfortunately is a major reason of cancer deaths. Although disease biomarkers are often gene mutations, more than 80% of FDA approved drugs target proteins [44]. From transcriptomics responses it is often impossible to understand a drug’s mode of action and predict the optimal drug combinations to overcome resistance even knowing the transcriptomic vector fields. Therefore, a critical gap is the remaining lack of a mechanistic understanding of how protein networks drive cell state transitions that would allow us to purposefully manipulate and control cell states. To bridge this gap, we need to apply systematic perturbations and measure proteomic responses to uncover and reconstruct core networks controlling cell-wide network responses and cell fate decisions.
Systematic perturbations pave the way to understand cell fate decisions
Defining phenotypical cell states by molecular features and processes that cause them is a grand challenge for modern biology. The popular view that cell fate decisions are driven by master regulators is giving way to a more nuanced understanding of cell states resulting from emergent dynamic properties of biological networks rather than single molecules [45, 46]. Technological advances in global and multiplexed analyses now allow us to scrutinize these concepts. The expression of genes, proteins and metabolites can now be measured and quantified on a global scale, including changes in posttranslational protein modifications, such as phosphorylation, acetylation, and ubiquitination. We also making strides in correlating morphological and phenotypical features on large scales, and even can predict gene expression changes based on cell morphology and vice versa [47–49]. Other new additions to our technological arsenal are single cell omics technologies that routinely can assess gene expression in single cells, with methods for single cell proteomics and metabolomics being developed [50, 51]. Combining single cell omics with imaging adds spatial resolution with several platforms for spatial transcriptomics and proteomics available [52, 53]. These technologies open an unprecedented view of the molecular workings of a cell, but we still struggle to causally and mechanistically connect them with phenotypical changes and cell fates.
Distinct activation patterns of the cell-wide network are caused by different connections and their strengths that promote different cell states and phenotypes. To permit insightful analysis and mechanistically tractable interventions, we must find the minimal control circuitry, in other words the core network that causes the characteristic changes that define a cell state. We posit that such core networks exist and are much smaller than the cell state specific networks which they control. A logical strategy is to determine the components and causal connections of core networks that control cell state transitions. Snapshots of the activities/expression levels of genes and proteins for different cell states can help us partially answer this question, finding only the components of core controlling networks (Figure 1). Core network components are the genes, proteins and pathways that make the biggest contributions to the transition between cell states. These components are determined by a State Transition Vector (STV) that is built using a quantitative approach known as cell State Transition Assessment and Regulation (cSTAR, Box II) [27]. The remainder of the global network that characterizes a cell state is included as an additional node into the core network. Conveniently, this node summarizes the molecular characteristics of a cell state and, therefore, serves as a cell phenotype marker termed a Dynamic Phenotype Descriptor (DPD).
Figure 1. cSTAR pipeline help us deliberately convert cell states.
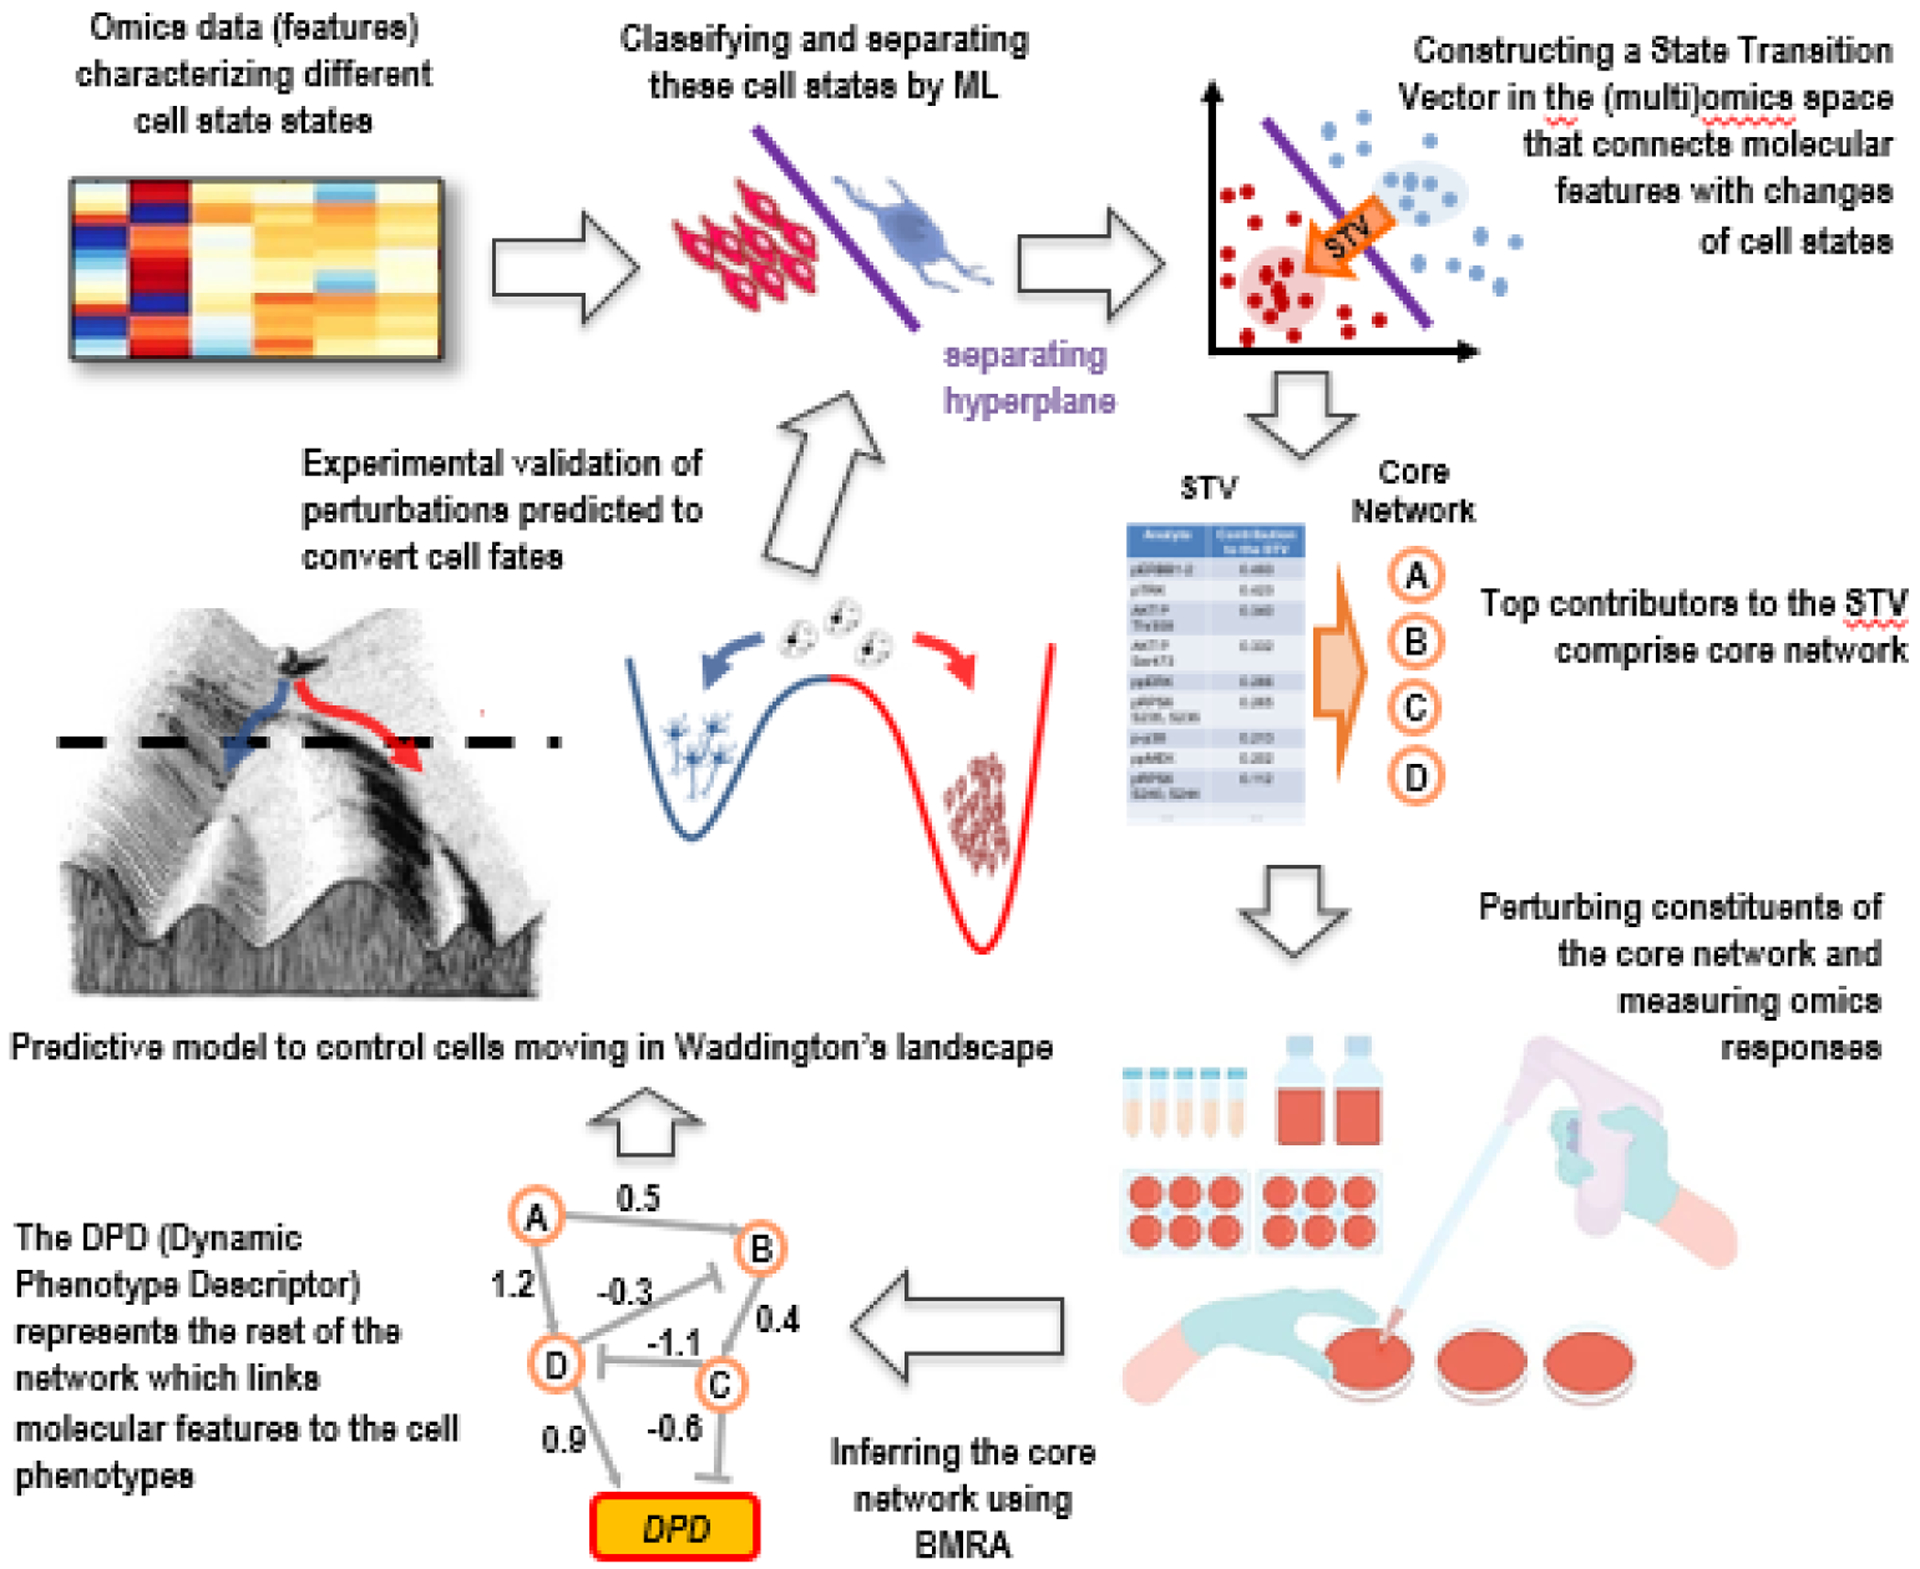
cSTAR uses omics data as the input and ML to classify distinct cell state and phenotypes. It constructs the STV in the molecular feature space that indicates a path between distinct cell states, followed by the selection of high ranked STV contributors, which determine components of a core network controlling state transitions. Systematic perturbations and omics data on perturbation responses are used to infer directions and strengths of causal connections of the core network (including feedback loops) by BMRA. Incorporation of the DPD module summarizes cell-wide network and links molecular features to the cell phenotypes. Network reconstruction is followed by a mechanistic model of the core network and cell state transitions. This model predicts cell responses to small molecule therapeutics and transitions between cell states in Waddington’s landscape, which must be validated experimentally.
Box II. Linking the cell phenotype to molecular features using cSTAR.
All concentrations/activities of cellular molecules, measured by omics technologies and termed molecular features, are perceived as points in a multidimensional space (a snapshot of the cell’s molecular machinery). Machine learning techniques can distinguish between distinct cell states in a highly multidimensional omics space [58]. In quantitative terms, distinct cell states are local minima, which are attractors of a dynamical system that describes cell maneuvering in Waddington’s landscape [59, 60]. The cSTAR approach uses support vector machines (SVMs) to construct separating surfaces between distinct cell states in the omics space [27]. For SVM with linear kernels, these surfaces are hyperplanes that maximize the distance between data points belonging to different cell states. Depending on the number of states there can be one or more separating hyperplanes. A cell that progresses from one state to another can take different routes depending on the external and internal cues, but any possible route must cross the separating hyperplane. cSTAR selects the shortest route and builds a State Transition Vector (STV). In the omics dataspace, the STV indicates a path leading from the centroid of a point cloud of one cell state to the centroid of another cell state or can also be defined as the vector normal to the separating hyperplane. Each STV component determines the contribution of the corresponding omics feature to the difference between cell states. A key advantage is that the absolute values of the STV components directly rank individual genes or proteins according to their importance in switching cell states. Thus, high-ranked STV components determine components of a core subnetwork that controls cell state transitions via the cell-wide network [27].
cSTAR quantifies the cell phenotypic state using the DPD that represents the remainder of the cell-wide network upon which the core network acts to drive cell state transitions. The DPD is determined in the omics space as the Euclidean distance from a current cell state to a state separating surface along the STV. The cSTAR/BMRA framework allows the inclusion of any functional object defined in terms of input-output relations in a network, and we incorporate the DPD in a core network [27]. Most importantly, experimental perturbations to biochemical modules of the core network allow us to determine direct effects of the changes in the pathway activities on cell phenotype defined by the DPD score.
Critically, multiple omics datasets, such as MS (phospho)proteomics, Reverse Protein Arrays, single-cell resolution mass cytometry and single cell and bulk RNAseq are readily integrated into cSTAR by comparing the normalized DPD changes following perturbations. For instance, proteomics and transcriptomics data of a variety of cell lines and individual cells sets were integrated in order to quantitate the extent (full or partial) of epithelial to mesenchymal transition (EMT), and the potency of different drugs to suppress EMT were predicted for different cellular context [27].
For a cell passing through several phenotypic states, as in the development of fully differentiated blood cells from hematopoietic stem cells, there are several STV vectors and DPD scores that quantify directions of transitions between the different states. In such cases, a core network combines the highest rank components of each STV and several DPD nodes that score different cell phenotypes.
Computational models allow us to calculate the changes in the DPD scores upon environmental or experimental perturbations and predict how cells traverse through Waddington’s landscape. These models are based on the acquired omics data and quantified core network topology (Box 1). Following a perturbation, a cell’s movement in Waddington’s landscape is governed by two forces that usually counteract each other. One is a driving signaling force that emerges from the changes in core network activities, and the other is a restoring, gradient force that pushes the cell back to its original (meta)stable state, provided the deviation from this original state has not been too large (Figure 1). The pathways with non-zero connections to the DPD node generate a signaling driving force that affects and changes the DPD score. This force is calculated using the BMRA inferred pathway influence on the DPD node. The gradient force is determined by the derivative of the restoring potential with respect to the DPD. The restoring, gradient force initially increases with the distance from the stable steady state in the DPD space but then decreases to zero at the cell state separation surface.
Causal connections of the core network, including direct control of the DPD node by biochemical modules, are identified using perturbations (Box I). The view that systematic perturbations are necessary to infer biological functions and understand cellular network is not new [19]. Molinelli et al [54] coined the term ‘perturbation biology’ and used systematic drug perturbations together with measurements of molecular and phenotypic responses in order to construct and parametrize a computational model of signaling pathways in a BRAF-mutant melanoma cell line. A novelty of cSTAR is its use of perturbation biology to (i) identify and precisely quantify causal connections that determine core control network, (ii) use them to construct a core network model, and (iii) exactly quantify how this core network influences the cell phenotype by measuring the connection signs and strengths to the DPD module [27] As a result, the cSTAR-reconstructed control networks dramatically differ from gene regulatory networks (GRN) obtained by bioinformatics methods, such as random forests (GENIE3) and mutual information (ARACNE) that build associative, correlative GRNs [55–57]. Computationally, cSTAR exploits a Bayesian MRA formulation (BMRA) that provides the confidence intervals for causal connections and their strengths [13, 18]. The inference of causal connections starting at biochemical core network modules and ending at the cell phenotypic module opens the possibility to predict how the changes in external cues and signaling modules affect the cell phenotype [27]. Importantly, cSTAR is generic and in principle can work with any type of data that is deep enough to distinguish different cell states.
Purposeful manipulation of cell state transitions and fates
Understanding of genetic and epigenetic interactions is a key to describe cell state transitions [36, 61]. However, many of these processes are governed by upstream core controlling networks, which receive a plethora of external cues, including pharmacological interventions. The only means to precisely predict and explain the external cue effects and the outcomes of experimental manipulations is to explicitly model the nonlinear signaling dynamics that change the cell phenotype and determine cell state transitions.
In physics, particle movement is determined by the free energy landscape. In biology, cell state changes during the development or pharmacological perturbations are described using the metaphor of a cell maneuvering in Waddington’s landscape. Catastrophe theory, dynamical systems analysis and other theoretical approaches have been applied to explain cell differentiation through the lens of this metaphor [59, 60], but the corresponding landscape models have been based on modeling the activities of a few gene or proteins rather than cell-wide networks. A molecular state of a cell is given by a point in the multidimensional space of molecular features, such as (phospho)protein concentrations or gene expression levels. In the transcriptomics data space, scRNA-seq based approaches can obtain trajectories of cell movements in Waddington’s landscape using the RNA velocity vector field [36, 37]. However, the complex and dynamic behavior of signaling networks that control cell fate decisions is impossible to reconstruct from these data. Therefore, one cannot precisely determine and purposefully control a cell’s movements in Waddington’s landscape by targeted interference, e.g. via small molecules or biologicals. New approaches are needed that can utilize the plethora of omics data produced nowadays to infer actionable therapeutic interventions by meaningfully reducing the dimensionality of a cell’s possible movements in this landscape. The cSTAR approach uses a handful of the DPD coordinates to precisely map how a cell maneuvers in Waddington’s landscape and how external perturbations can manipulate this landscape and the cell’s journey. Thereby, cSTAR dramatically reduces the dimensionality of transcriptomics and other omics dataspaces using the DPD scores. Figure 2, illustrates how core network components determine the cell fate decisions in Waddington’s landscape (Box 2).
Figure 2. Signaling networks shape the landscape of cell fate decisions.
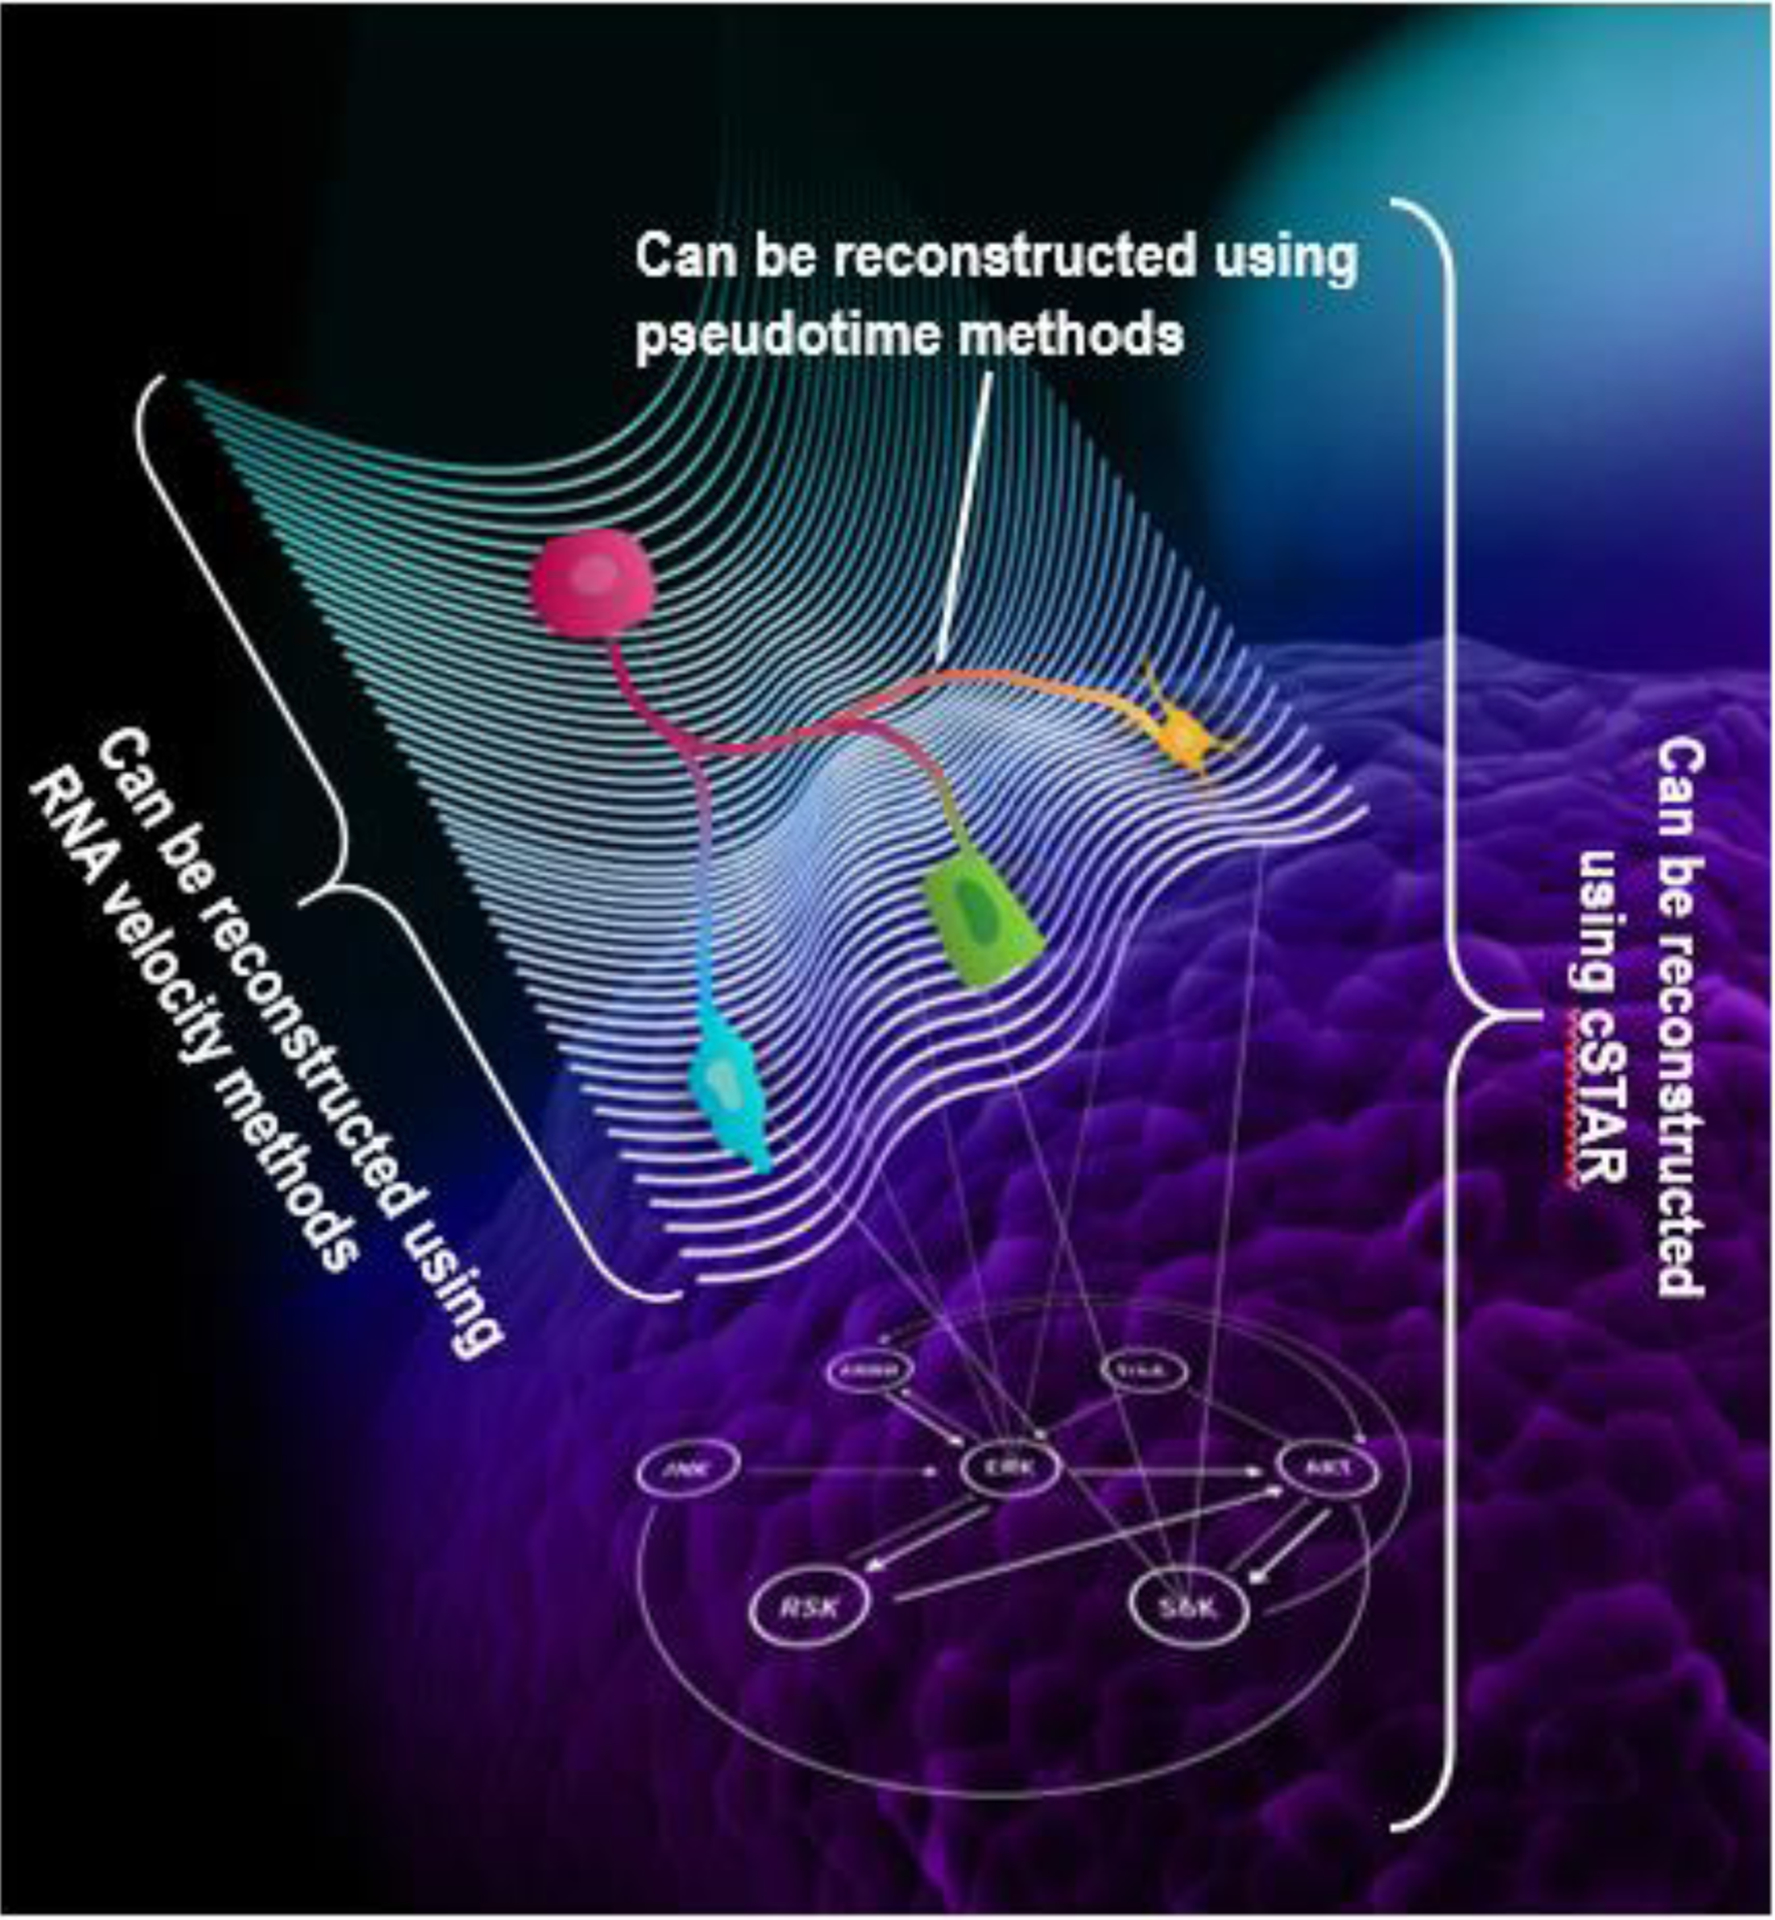
A now famous model of Waddington’s landscape describes cell state changes by cell’s movement in a landscape of mountains and valleys, in which different valley corresponds to different cell fate decisions [76]. Pseudotime methods allow identifying cell’s trajectory at the landscape, and RNA velocity methods allow reconstructing the landscape in the transcriptomics space. The advantage of cSTAR is that it reconstructs both cell’s trajectory and Waddington’s landscape, but also connects it to the dynamics of signaling networks (shown as connected nodes shaping cell fate decisions). Not only cSTAR helps us understand cell state transitions but allows to steer this process in desired direction.
Can cell oncogenic transformation be reversed?
Cancer is perceived as a genetic disease because cancer patients have oncogenic driver mutations, gene fusions, or chromosome aberrations. The dependence of cancer cells on mutated proteins, dubbed oncogene addiction, is the rationale to target mutated or amplified oncoproteins for cancer treatment. Yet, a surprisingly large number of oncogenic mutations are detected in normal tissue cells, and the number of mutations is increasing with age [62–65]. This suggests that merely the presence of oncogenic mutations does not automatically cause cancer. The oncogenic cell state is conditional and depends not only on mutations but also on the intercellular and intracellular molecular profiles and the environment. Multiple observations indicate that in some circumstances, the phenotypes and omics profiles of clinical grade cancer cells can be spontaneously reverted to normal, presenting tumor reversions [66]. We posit that the therapeutic target of killing all tumor cells can be extended by the goal of reverting the tumor phenotype, similarly as it is pursued by differentiation therapy in cancer [67–71].
Only the concerted action of multiple proteins can revert cancer, yet cell- and patient-specific molecular pathways of tumor reversion are not established. This, in particular, limits differentiation therapies of leukemias. Proof of principle differentiation treatment by all-trans retinoid acid (ATRA) and arsenic trioxide (ATO) is successfully applied in the clinic for acute promyeloid leukemia (APML) and neuroblastoma [72, 73]. APML is characterized by translocations of the retinoic acid receptor gene (RARA), generating fusion oncoproteins that exert a dominant negative effect on wildtype RARA function and block myeloid differentiation at the promyelocytic stage. Neuroblastoma has not alterations in RARA, but entails a differentiation block of peripheral sympathetic neurons, which can be counteracted by ATRA treatment. This is successfully used in the maintenance therapy of high risk neuroblastoma [73]. While these treatments provide proof of principle that malignant transformation can be reversed, methods to systematically discover molecular targets that can mediate such reversion are lacking.
An in-depth cSTAR analysis helps the discovery of specific molecular targets to control and revert oncogenic transformation. The STVs based on multiomics data from oncogenic and physiological cell states indicate a path to normalize molecular profiles and determines components of core networks controlling cell transformation (Box 2). The STV contains a ranked list of molecules that need to be perturbed in order to change cell states. Such perturbations can be any interventions that change the concentration or activity of the molecules in question, such as drugs, siRNA, or PROTACs. The effect of the interventions cannot be predicted from the STV alone, but have to be experimentally tested. However, these tests can be used as perturbation data. In our experience a handful of perturbations targeting the highest ranked 5–10 molecules is sufficient to reconstruct the core network or at least calculate the DPD. The core network has signed and weighted edges allowing the researcher to choose the most effective targets via sensitivity analysis of the core network. If the perturbations are insufficient to reconstruct the full core network, the DPD informs us about the qualitative and quantitative effects of a perturbation, i.e. towards which cell state the inhibition or activation of a molecule will push the biological system. This information enables us to select and validate the most promising targets within the same experimental framework and even without detailed prior knowledge about the network topology. Thus, interventions to purposefully manipulate cell states can be systematically designed with modest experimental and computational investments. These properties distinguish cSTAR from other elegant mechanistic methods to infer targets, such as the methods developed by Mochizuki’s group, which require a detailed prior knowledge of the network [74]. In cSTAR the reconstruction of causal connections of core networks and the influence of the changes in molecular pathways on cell phenotype given by connection to the DPD module leads to a mechanistic model that can describe nonlinear network dynamics and cell phenotypes, thereby creating a digital twin of a living cell [27]. This dynamical model - digital cell twin - predicts how cells maneuver in Waddington’s landscape following purposeful manipulations and environmental perturbations. It will help us to deliberately direct cells from oncogenic states to physiologically normal states, reverting oncogenic transformations. The ability of cSTAR to identify molecular targets for the reversion of oncogenic transformation as well as their network context, offers two ways of pharmacological interventions. One is to directly inhibit the molecules that maintain the oncogenic state, or to activate the molecules that promote the differentiated state. As these principles are complementary, they should result in synergistic actions. The second way is to exploit the network context. If a target is not directly druggable, its effects on the network still could be curtailed or controlled by inhibiting another molecule that mediates these effects. This strategy broadens the target space and makes it more likely that appropriate drugs are available. The vast majority of signaling networks derailed in cancer comprise protein kinases, and the number of potent inhibitors is steeply increasing. Imatinib, the first kinase inhibitor in oncology, was approved for clinical use 20 years ago. Now, there are 87 approved kinase inhibitors targeting 45 kinases, and inhibitors against another 110 kinases are under development [75]. Thus, an increasing number of interventions becomes feasible.
Concluding remarks
New approaches to understand core networks that control the cell phenotype and to construct mechanistic models of cell state transitions will create digital twins of living cells. These digital twins will allow designer approaches to manipulate cellular pathways and purposefully direct cell traverse through Waddington’s landscape to desired cell states. Digital cell twins will open new avenues in medicine and pharmacology where precise therapeutic treatments will be underpinned by personalized mechanistic models. Manipulation of tumor reversion pathways based on these mechanistic models will create new cancer treatments (see Outstanding Questions).
Outstanding Questions.
How can we best combine machine learning/artificial intelligence analysis of omics data with mechanistic, structure-based modeling of cell systems?
How can we derive a detailed and mechanistic understanding of interactions of pathologically changed cells with multiple cell types in tissue?
Can we develop drug targets that account for the wider biological network context?
Can we manage cancer like a chronic disease by controlling cell states of cancer cells, immune and other host cells?
Highlights.
The ability to determine cell states is essential for understanding cell fate decisions
Recent methods, such as pseudotime and RNA velocity, allow mapping cell transcriptome states, yet thorough understanding and purposeful manipulation of cell state transitions and fate decisions are lacking
A cSTAR approach determines a core regulatory network that controls cell-wide network and ‘computes’ cell fate decision
Perturbation data are crucial to infer causal connections of core networks
Based on precise reconstruction of core networks, cSTAR can steer cell fate decisions that can help to reverse pathological cell states
Acknowledgements
This work was supported by NIH/NCI grant R01CA244660 and Science Foundation Ireland grants 18/RI/5702 and 18/SPP/3522, the latter together with the Children’s Health Foundation.
Please insert a “Declaration of Interests” section. If no authors have competing interests, please insert, “The authors declare no competing interests.”
Declaration of Interests. Patent application (No. UK2107576.7) related to this work was filed by the authors.
Glossary of terms. (not more than 450 words)
- Bayesian MRA
Bayesian statistical reformulation of exact MRA equations that incorporates noise and does not require a complete set of perturbations. It combines both the existing knowledge as a prior distribution and the likelihood function to calculate the posterior distribution of
- Dynamic Phenotype Descriptor (DPD)
quantifies cell phenotype using a score that is related to the distance from a current cell state to the state separating surface.
- Dynamo
Computational method to determine genome-wide absolute rates of transcription, splicing and degradation based on metabolic labelling of newly synthesized RNA to determine the amounts of unlabeled and labeled, unspliced and mature RNA in single cells.
- Global responses
Changes in mode activities following the network relaxation after perturbations to one or more nodes.
- Jacobian matrix
Matrix of partial derivatives of the vector function of the dynamical system that describes the network behavior.
- Likelihood function used by BMRA
Probability distribution of global responses as a function of the distribution of causal connections taken from MRA equations.
- Local, causal connections
Direct connections between modules that are not mediated by other modules, aka local responses. These are the edges of a directed network graph, and their weights are connection coefficients or strengths that can be negative (inhibition) or positive (activation).
- Modular or nested networks
Each node is a pathway or a subnetwork containing other nodes.
- Modular Response Analysis (MRA)
a method based on exact deterministic equations to quantify unknown, causal connections using perturbation data.
- Network components or nodes
Can represent physical entities and/or quantities, e.g. protein concentrations, concentration of phosphorylated species, protein activities, concentration of transcripts etc.
- PROTAC (Proteolysis-targeting chimeras)
Artificial proteins consisting of a targeting unit that binds to the target and a unit that recruits an E3 ubiquitin ligase which marks the target for degradation by the proteasome. In contrast to conventional inhibitors PROTACs lead to the removal of the target protein by inducing its degradation.
- Pseudotime
Positioning of cells along cell’s trajectories based on the single cell gene expression profiles measured by scRNAseq. It quantifies the progression of the underlying biological processes that change the cell transcriptome.
- Quantified network topology
Matrix of connection coefficients obtained by MRA, which is the Jacobian matrix normalized by the diagonal elements.
- RNA velocity of single cells
Method to determine the time derivative of the mRNA abundance from a snapshot of single-cell RNAseq, using a mature mRNA and its unspliced precursors.
- State Transition Vector (STV)
A vector of unit length, which determines the motion in the molecular dataspace that crosses the state separating surface and converts a given cell state to a distinct state.
- Waddington’s landscape
A qualitative biological model where cells move through a landscape of mountains and valleys as rolling marbles from one (semi)stable state to another during the developmental process
Footnotes
Publisher's Disclaimer: This is a PDF file of an unedited manuscript that has been accepted for publication. As a service to our customers we are providing this early version of the manuscript. The manuscript will undergo copyediting, typesetting, and review of the resulting proof before it is published in its final form. Please note that during the production process errors may be discovered which could affect the content, and all legal disclaimers that apply to the journal pertain.
References
- 1.Li P and Elowitz MB (2019) Communication codes in developmental signaling pathways. Development 146, dev170977. [DOI] [PMC free article] [PubMed] [Google Scholar]
- 2.Aghakhani S, et al. (2022) Metabolic reprogramming in Rheumatoid Arthritis Synovial Fibroblasts: A hybrid modeling approach. PLOS Computational Biology 18, e1010408. [DOI] [PMC free article] [PubMed] [Google Scholar]
- 3.Montagud A, et al. (2022) Patient-specific Boolean models of signalling networks guide personalised treatments. eLife 11, e72626. [DOI] [PMC free article] [PubMed] [Google Scholar]
- 4.Zañudo JGT, et al. (2018) Discrete dynamic network modeling of oncogenic signaling: Mechanistic insights for personalized treatment of cancer. Current Opinion in Systems Biology 9, 1–10 [DOI] [PMC free article] [PubMed] [Google Scholar]
- 5.Traverse S, et al. (1992) Sustained activation of the mitogen-activated protein (MAP) kinase cascade may be required for differentiation of PC12 cells. Comparison of the effects of nerve growth factor and epidermal growth factor. Biochemical Journal 288, 351–355 [DOI] [PMC free article] [PubMed] [Google Scholar]
- 6.Hafner A, et al. (2019) The multiple mechanisms that regulate p53 activity and cell fate. Nature Reviews Molecular Cell Biology 20, 199–210 [DOI] [PubMed] [Google Scholar]
- 7.Patel AL and Shvartsman SY (2018) Outstanding questions in developmental ERK signaling. Development 145, dev143818. [DOI] [PMC free article] [PubMed] [Google Scholar]
- 8.Jeknić S, et al. (2019) Techniques for Studying Decoding of Single Cell Dynamics. Frontiers in Immunology 10 [DOI] [PMC free article] [PubMed] [Google Scholar]
- 9.Kuchenov D, et al. (2016) High-Content Imaging Platform for Profiling Intracellular Signaling Network Activity in Living Cells. Cell Chemical Biology 23, 1550–1559 [DOI] [PMC free article] [PubMed] [Google Scholar]
- 10.Hanson RL and Batchelor E (2022) Coordination of MAPK and p53 dynamics in the cellular responses to DNA damage and oxidative stress. Molecular Systems Biology 18, e11401. [DOI] [PMC free article] [PubMed] [Google Scholar]
- 11.Peterson AF, et al. (2022) Systematic analysis of the MAPK signaling network reveals MAP3K-driven control of cell fate. Cell Systems 13, 885–894.e884 [DOI] [PMC free article] [PubMed] [Google Scholar]
- 12.Nakakuki T, et al. (2010) Ligand-Specific c-Fos Expression Emerges from the Spatiotemporal Control of ErbB Network Dynamics. Cell 141, 884–896 [DOI] [PMC free article] [PubMed] [Google Scholar]
- 13.Halasz M, et al. (2016) Integrating network reconstruction with mechanistic modeling to predict cancer therapies. Sci Signal 9, ra114. [DOI] [PubMed] [Google Scholar]
- 14.Mojtahedi M, et al. (2016) Cell Fate Decision as High-Dimensional Critical State Transition. PLoS Biol 14, e2000640. [DOI] [PMC free article] [PubMed] [Google Scholar]
- 15.Mochizuki A, et al. (2013) Dynamics and control at feedback vertex sets. II: a faithful monitor to determine the diversity of molecular activities in regulatory networks. J Theor Biol 335, 130146. [DOI] [PubMed] [Google Scholar]
- 16.Sahoo S, et al. (2021) Immunosuppressive Traits of the Hybrid Epithelial/Mesenchymal Phenotype. Front Immunol 12, 797261. [DOI] [PMC free article] [PubMed] [Google Scholar]
- 17.Brackston RD, et al. (2018) Transition state characteristics during cell differentiation. PLoS Comput Biol 14, e1006405. [DOI] [PMC free article] [PubMed] [Google Scholar]
- 18.Santra T, et al. (2018) Reconstructing static and dynamic models of signaling pathways using Modular Response Analysis. Current Opinion in Systems Biology 9, 11–21 [Google Scholar]
- 19.Kholodenko BN, et al. (2002) Untangling the wires: A strategy to trace functional interactions in signaling and gene networks. Proceedings of the National Academy of Sciences 99, 12841. [DOI] [PMC free article] [PubMed] [Google Scholar]
- 20.Lill D, et al. (2019) Mapping connections in signaling networks with ambiguous modularity. npj Systems Biology and Applications 5, 19. [DOI] [PMC free article] [PubMed] [Google Scholar]
- 21.Sarmah D, et al. (2022) Network inference from perturbation time course data. npj Systems Biology and Applications 8, 42. [DOI] [PMC free article] [PubMed] [Google Scholar]
- 22.Mekedem M, et al. (2021) Application of Modular Response Analysis to Medium- to Large-Size Biological Systems. bioRxiv, 2021.2007.2027.453942 [DOI] [PMC free article] [PubMed] [Google Scholar]
- 23.Kholodenko BN and Sontag ED (2002) Determination of Functional Network Structure from Local Parameter Dependence Data. arXiv e-prints, physics/0205003 [Google Scholar]
- 24.Kholodenko BN, et al. (1997) Quantification of information transfer via cellular signal transduction pathways. FEBS Lett 414, 430–434 [DOI] [PubMed] [Google Scholar]
- 25.Bastiaens P, et al. (2015) Silence on the relevant literature and errors in implementation. Nat Biotechnol 33, 336–339 [DOI] [PubMed] [Google Scholar]
- 26.Lill D, et al. (2019) Mapping connections in signaling networks with ambiguous modularity. NPJ Syst Biol Appl 5, 19. [DOI] [PMC free article] [PubMed] [Google Scholar]
- 27.Rukhlenko OS, et al. (2022) Control of cell state transitions. Nature 609, 975–985 [DOI] [PMC free article] [PubMed] [Google Scholar]
- 28.Kanehisa M (2019) Toward understanding the origin and evolution of cellular organisms. Protein Science 28, 1947–1951 [DOI] [PMC free article] [PubMed] [Google Scholar]
- 29.Szklarczyk D, et al. (2021) The STRING database in 2021: customizable protein–protein networks, and functional characterization of user-uploaded gene/measurement sets. Nucleic Acids Research 49, D605–D612 [DOI] [PMC free article] [PubMed] [Google Scholar]
- 30.Gillespie M, et al. (2022) The reactome pathway knowledgebase 2022. Nucleic Acids Research 50, D687–D692 [DOI] [PMC free article] [PubMed] [Google Scholar]
- 31.Mekedem M, et al. (2022) Application of modular response analysis to medium- to large-size biological systems. PLoS Comput Biol 18, e1009312. [DOI] [PMC free article] [PubMed] [Google Scholar]
- 32.Trapnell C, et al. (2014) The dynamics and regulators of cell fate decisions are revealed by pseudotemporal ordering of single cells. Nature Biotechnology 32, 381–386 [DOI] [PMC free article] [PubMed] [Google Scholar]
- 33.Cook DP and Vanderhyden BC (2020) Context specificity of the EMT transcriptional response. Nature Communications 11, 2142. [DOI] [PMC free article] [PubMed] [Google Scholar]
- 34.Pandey K and Zafar H (2022) Inference of cell state transitions and cell fate plasticity from single-cell with MARGARET. Nucleic Acids Research 50, e86–e86 [DOI] [PMC free article] [PubMed] [Google Scholar]
- 35.Campbell KR and Yau C (2018) Uncovering pseudotemporal trajectories with covariates from single cell and bulk expression data. Nature Communications 9, 2442. [DOI] [PMC free article] [PubMed] [Google Scholar]
- 36.Qiu X, et al. (2022) Mapping transcriptomic vector fields of single cells. Cell 185, 690–711.e645 [DOI] [PMC free article] [PubMed] [Google Scholar]
- 37.Gorin G, et al. (2022) RNA velocity unraveled. PLOS Computational Biology 18, e1010492. [DOI] [PMC free article] [PubMed] [Google Scholar]
- 38.La Manno G, et al. (2018) RNA velocity of single cells. Nature 560, 494–498 [DOI] [PMC free article] [PubMed] [Google Scholar]
- 39.Bergen V, et al. (2020) Generalizing RNA velocity to transient cell states through dynamical modeling. Nature Biotechnology 38, 1408–1414 [DOI] [PubMed] [Google Scholar]
- 40.Bergen V, et al. (2021) RNA velocity—current challenges and future perspectives. Molecular Systems Biology 17, e10282. [DOI] [PMC free article] [PubMed] [Google Scholar]
- 41.Qiu Q, et al. (2020) Massively parallel and time-resolved RNA sequencing in single cells with scNT-seq. Nature Methods 17, 991–1001 [DOI] [PMC free article] [PubMed] [Google Scholar]
- 42.Battich N, et al. (2020) Sequencing metabolically labeled transcripts in single cells reveals mRNA turnover strategies. 367, 1151–1156 [DOI] [PubMed] [Google Scholar]
- 43.Lange M, et al. (2022) CellRank for directed single-cell fate mapping. Nature Methods 19, 159–170 [DOI] [PMC free article] [PubMed] [Google Scholar]
- 44.Santos R, et al. (2017) A comprehensive map of molecular drug targets. Nature Reviews Drug Discovery 16, 19–34 [DOI] [PMC free article] [PubMed] [Google Scholar]
- 45.Kolch W, et al. (2015) The dynamic control of signal transduction networks in cancer cells. Nature Reviews Cancer 15, 515–527 [DOI] [PubMed] [Google Scholar]
- 46.Davis TL and Rebay I (2017) Master regulators in development: Views from the Drosophila retinal determination and mammalian pluripotency gene networks. Developmental Biology 421, 93–107 [DOI] [PMC free article] [PubMed] [Google Scholar]
- 47.Cutiongco MFA, et al. (2020) Predicting gene expression using morphological cell responses to nanotopography. Nature Communications 11, 1384. [DOI] [PMC free article] [PubMed] [Google Scholar]
- 48.Way GP, et al. (2022) Morphology and gene expression profiling provide complementary information for mapping cell state. Cell Systems 13, 911–923.e919 [DOI] [PMC free article] [PubMed] [Google Scholar]
- 49.Haghighi M, et al. (2022) High-dimensional gene expression and morphology profiles of cells across 28,000 genetic and chemical perturbations. Nature Methods 19, 1550–1557 [DOI] [PMC free article] [PubMed] [Google Scholar]
- 50.Stein CM, et al. (2021) Single-cell omics: Overview, analysis, and application in biomedical science. Journal of Cellular Biochemistry 122, 1571–1578 [DOI] [PubMed] [Google Scholar]
- 51.Nam AS, et al. (2021) Integrating genetic and non-genetic determinants of cancer evolution by single-cell multi-omics. Nature Reviews Genetics 22, 3–18 [DOI] [PMC free article] [PubMed] [Google Scholar]
- 52.Wang N, et al. (2021) Spatial transcriptomics and proteomics technologies for deconvoluting the tumor microenvironment. Biotechnology Journal 16, 2100041. [DOI] [PubMed] [Google Scholar]
- 53.Longo SK, et al. (2021) Integrating single-cell and spatial transcriptomics to elucidate intercellular tissue dynamics. Nature Reviews Genetics 22, 627–644 [DOI] [PMC free article] [PubMed] [Google Scholar]
- 54.Molinelli EJ, et al. (2013) Perturbation Biology: Inferring Signaling Networks in Cellular Systems. PLOS Computational Biology 9, e1003290. [DOI] [PMC free article] [PubMed] [Google Scholar]
- 55.Marbach D, et al. (2012) Wisdom of crowds for robust gene network inference. Nature Methods 9, 796–804 [DOI] [PMC free article] [PubMed] [Google Scholar]
- 56.Moerman T, et al. (2019) GRNBoost2 and Arboreto: efficient and scalable inference of gene regulatory networks. Bioinformatics 35, 2159–2161 [DOI] [PubMed] [Google Scholar]
- 57.Hillerton T, et al. (2022) Fast and accurate gene regulatory network inference by normalized least squares regression. Bioinformatics 38, 2263–2268 [DOI] [PMC free article] [PubMed] [Google Scholar]
- 58.Oller-Moreno S, et al. (2021) Algorithmic advances in machine learning for single-cell expression analysis. Current Opinion in Systems Biology 25, 27–33 [Google Scholar]
- 59.Brackston RD, et al. (2018) Transition state characteristics during cell differentiation. PLOS Computational Biology 14, e1006405. [DOI] [PMC free article] [PubMed] [Google Scholar]
- 60.Sáez M, et al. Dynamical landscapes of cell fate decisions. Interface Focus 12, 20220002. [DOI] [PMC free article] [PubMed] [Google Scholar]
- 61.Balsalobre A and Drouin J (2022) Pioneer factors as master regulators of the epigenome and cell fate. Nature Reviews Molecular Cell Biology 23, 449–464 [DOI] [PubMed] [Google Scholar]
- 62.Moore L, et al. (2020) The mutational landscape of normal human endometrial epithelium. Nature 580, 640–646 [DOI] [PubMed] [Google Scholar]
- 63.Ganz J, et al. (2022) Rates and Patterns of Clonal Oncogenic Mutations in the Normal Human Brain. Cancer Discovery 12, 172–185 [DOI] [PMC free article] [PubMed] [Google Scholar]
- 64.Fiala C and Diamandis EP (2020) Mutations in normal tissues—some diagnostic and clinical implications. BMC Medicine 18, 283. [DOI] [PMC free article] [PubMed] [Google Scholar]
- 65.Yokoyama A, et al. (2019) Age-related remodelling of oesophageal epithelia by mutated cancer drivers. Nature 565, 312–317 [DOI] [PubMed] [Google Scholar]
- 66.Lebedev TD, et al. (2019) Two Receptors, Two Isoforms, Two Cancers: Comprehensive Analysis of KIT and TrkA Expression in Neuroblastoma and Acute Myeloid Leukemia. Frontiers in Oncology 9 [DOI] [PMC free article] [PubMed] [Google Scholar]
- 67.Tripathi A, et al. (2021) Tumor reversion: a dream or a reality. Biomarker Research 9, 31. [DOI] [PMC free article] [PubMed] [Google Scholar]
- 68.Telerman A and Amson R (2009) The molecular programme of tumour reversion: the steps beyond malignant transformation. Nature Reviews Cancer 9, 206–216 [DOI] [PubMed] [Google Scholar]
- 69.Tang Y, et al. (2021) Induced lineage promiscuity undermines the efficiency of all-transretinoid-acid-induced differentiation of acute myeloid leukemia. iScience 24 [DOI] [PMC free article] [PubMed] [Google Scholar]
- 70.Stubbins RJ and Karsan A (2021) Differentiation therapy for myeloid malignancies: beyond cytotoxicity. Blood Cancer Journal 11, 193. [DOI] [PMC free article] [PubMed] [Google Scholar]
- 71.Shin D and Cho K-H (2023) Critical transition and reversion of tumorigenesis. Experimental & Molecular Medicine [DOI] [PMC free article] [PubMed] [Google Scholar]
- 72.Miguel AS and Eva B (2021) History of Acute Promyelocytic Leukemia. Clinical Hematology International 3, 142–152 [DOI] [PMC free article] [PubMed] [Google Scholar]
- 73.Masetti R, et al. (2012) Retinoids in Pediatric Onco-Hematology: the Model of Acute Promyelocytic Leukemia and Neuroblastoma. Advances in Therapy 29, 747–762 [DOI] [PubMed] [Google Scholar]
- 74.Kobayashi K, et al. (2018) Controlling Cell Fate Specification System by Key Genes Determined from Network Structure. iScience 4, 281–293 [DOI] [PMC free article] [PubMed] [Google Scholar]
- 75.Attwood MM, et al. (2021) Trends in kinase drug discovery: targets, indications and inhibitor design. Nat Rev Drug Discov 20, 839–861 [DOI] [PubMed] [Google Scholar]
- 76.Waddington CH (1940) Organisers and Genes by C. H. Waddington. The University Press [Google Scholar]