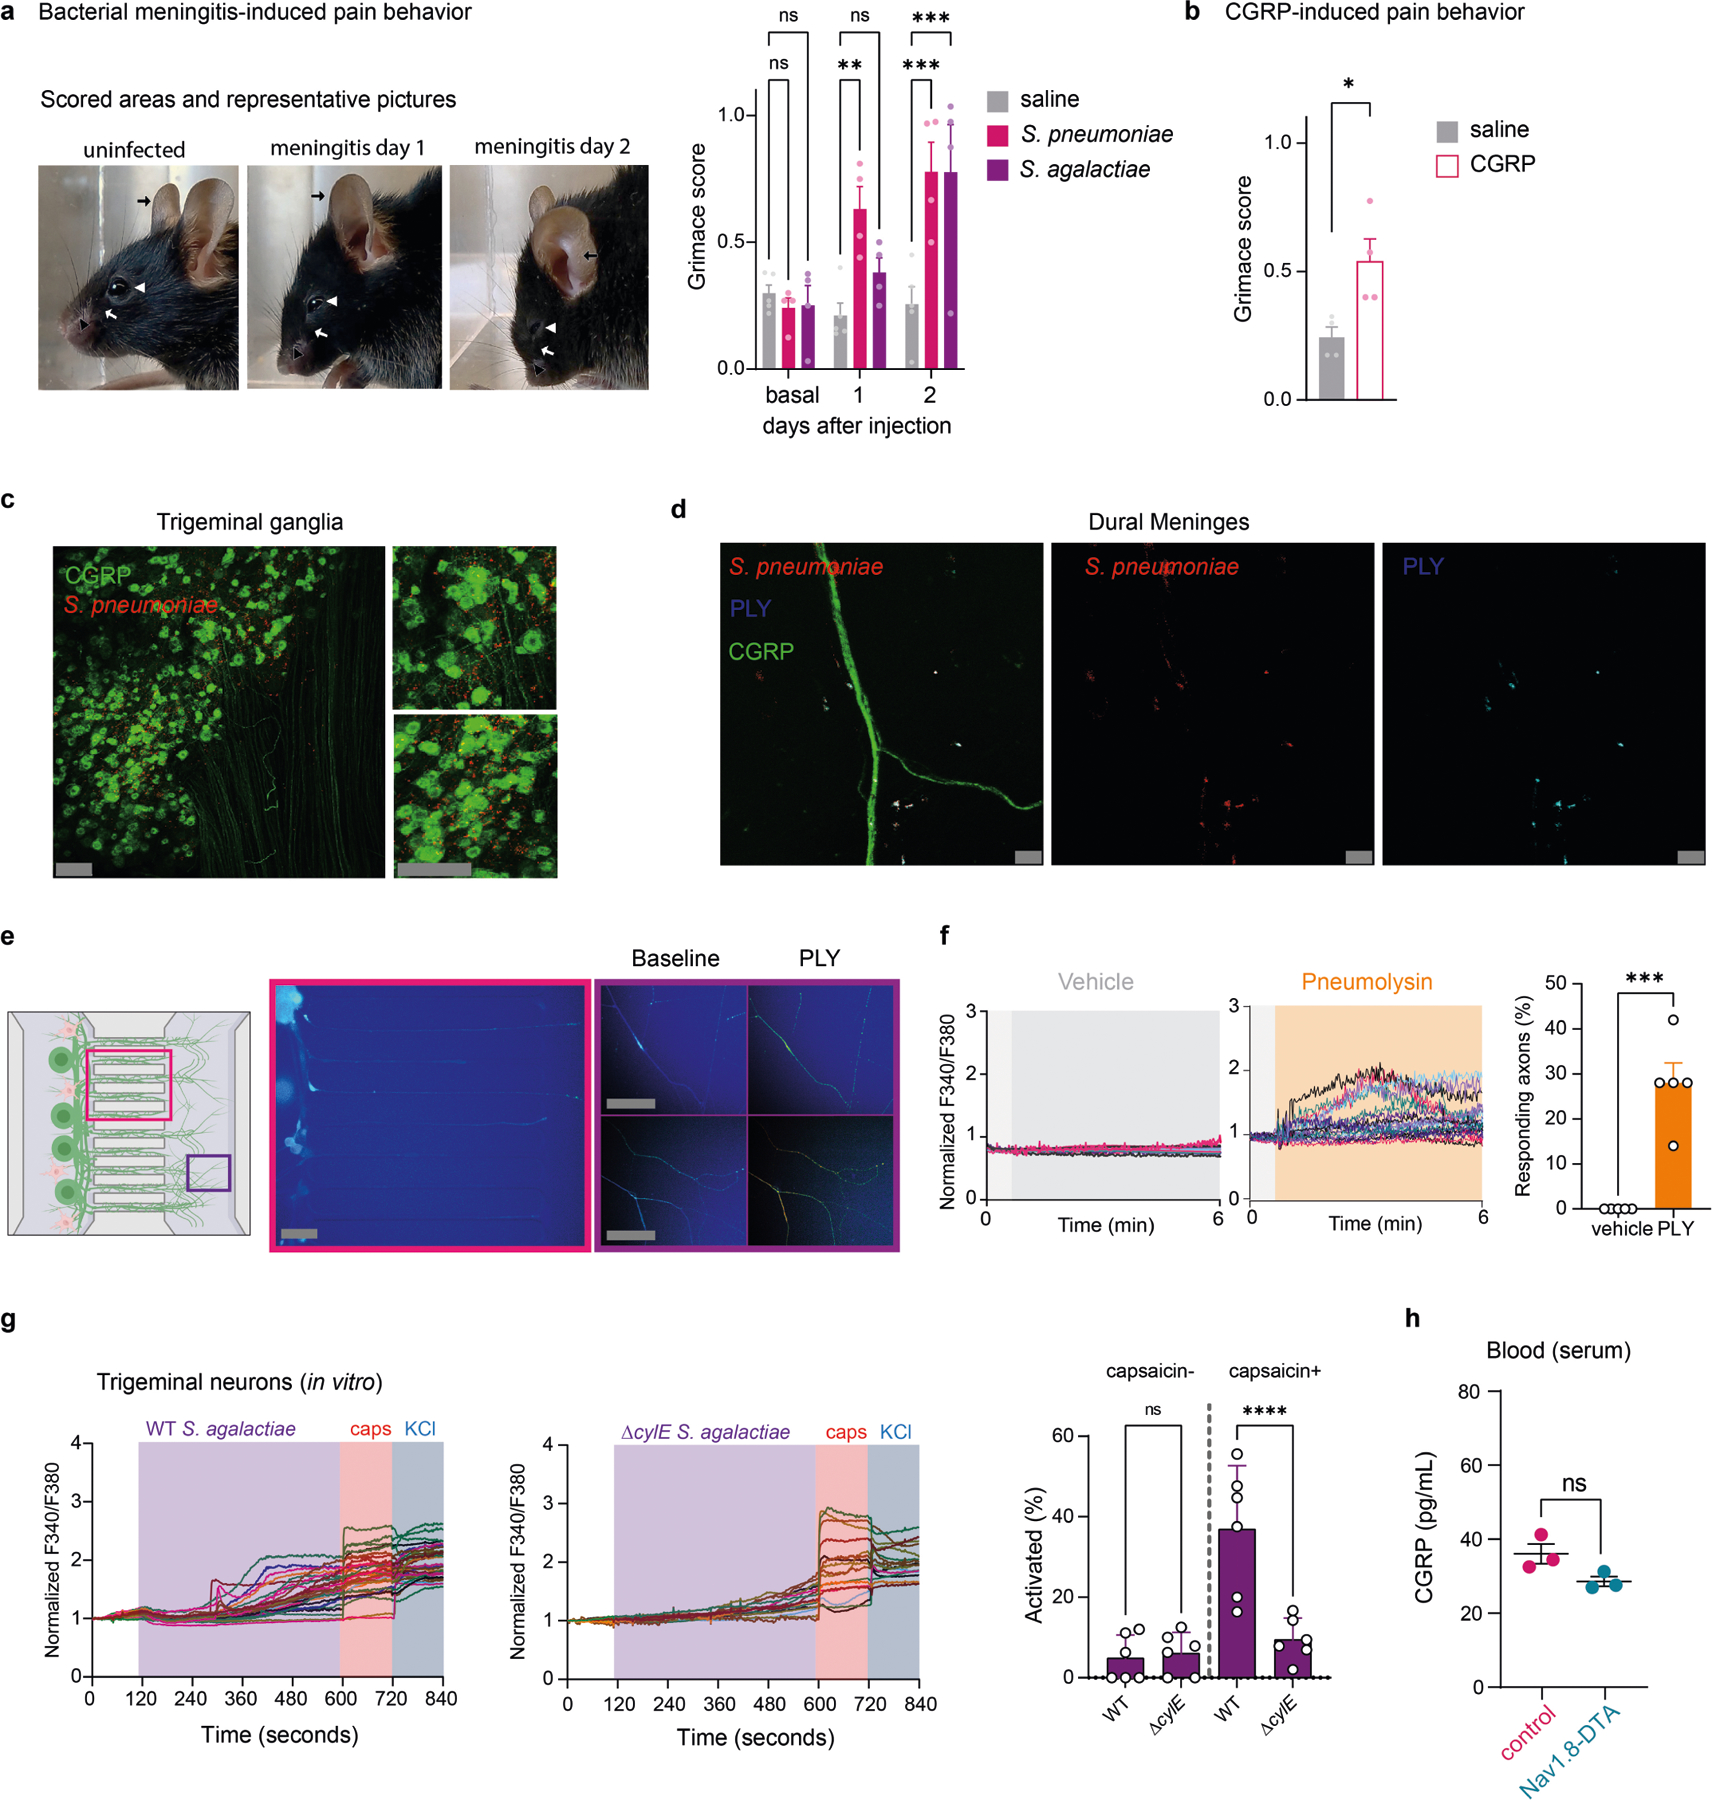
Extended Data Fig. 4 |. S. pneumoniae and S. agalactiae induce pain and act on trigeminal ganglion neurons.

a, Left, Representative pictures of mice at baseline (uninfected), 1 day, or 2 days after S. pneumoniae infection. Right, Grimace scores of mice at baseline (uninfected), 1 day, and 2 days after injection of S. pneumoniae (n = 4), S. agalactiae (n = 4), or saline (n = 5). Orbital tightening (white arrowhead), nose bulge (black arrowhead), cheek bulge (white arrow), and ear position (black arrow) were scored. b, Grimace scores of mice injected with CGRP (2 μg, i.p.) or vehicle (n = 4/group). c, Trigeminal ganglion from Calca-GFP (Green) mice 24 h after injection of dye-labelled S. pneumoniae (red). Scale bar = 100 μm. d, Whole-mount staining of meninges from Calca-GFP mice (CGRP) collected 24 h after injection of dye-labelled S. pneumoniae (red) and co-stained with anti-Pneumolysin antibody (cyan). Scale bar = 10 μm. e, f, Trigeminal ganglion neurons plated in microfluidic chambers with cell bodies on left and axons growingto right chamber. Vehicle or PLY was added to right chamber during Fura-2 calcium imaging. (e) Left, illustration created with BioRender.com (https://biorender.com). Right, representative fields of neurons; (f) Traces and quantification (f) of intracellular calcium levels in individual axons stimulated with vehicle or S. pneumoniae toxin pneumolys in (n = 4/group). Scale bar = 50 μm. g, Left, Representative Fura-2 calcium traces of individual trigeminal ganglion neurons stimulated with wildtype S. agalactiae or the isogenic ΔcylE toxin-deficient mutant bacteria (2×10⁷ c.f.u.), followed by capsaicin (1uM) and KCl (40 mM). Right, proportions of capsaicin non-responsive and capsaicin-responsive neurons that responded to wild-type or ΔcylE S. agalactiae (n = 6/group). h, Blood CGRP levels from Nav1.8-DTA mice and control littermates 24 h after injection of S. pneumoniae (3×10⁷ c.f.u.) (n = 3/group). Statistical analysis: (b, f, g, h) Unpaired two-sided t-tests. (a) One-way ANOVA with Tukey post-tests. *p < 0.05, **p < 0.01, ***p < 0.001. n = individual mice (a, b) and biologically independent samples from mouse primary cells (f-g) and tissues (h). Each experiment was performed at least twice, and results presented are representative of 2 or more replicates. ns = not significant. Mean ±SEM. Exact p-values in Supplementary Table 1.
