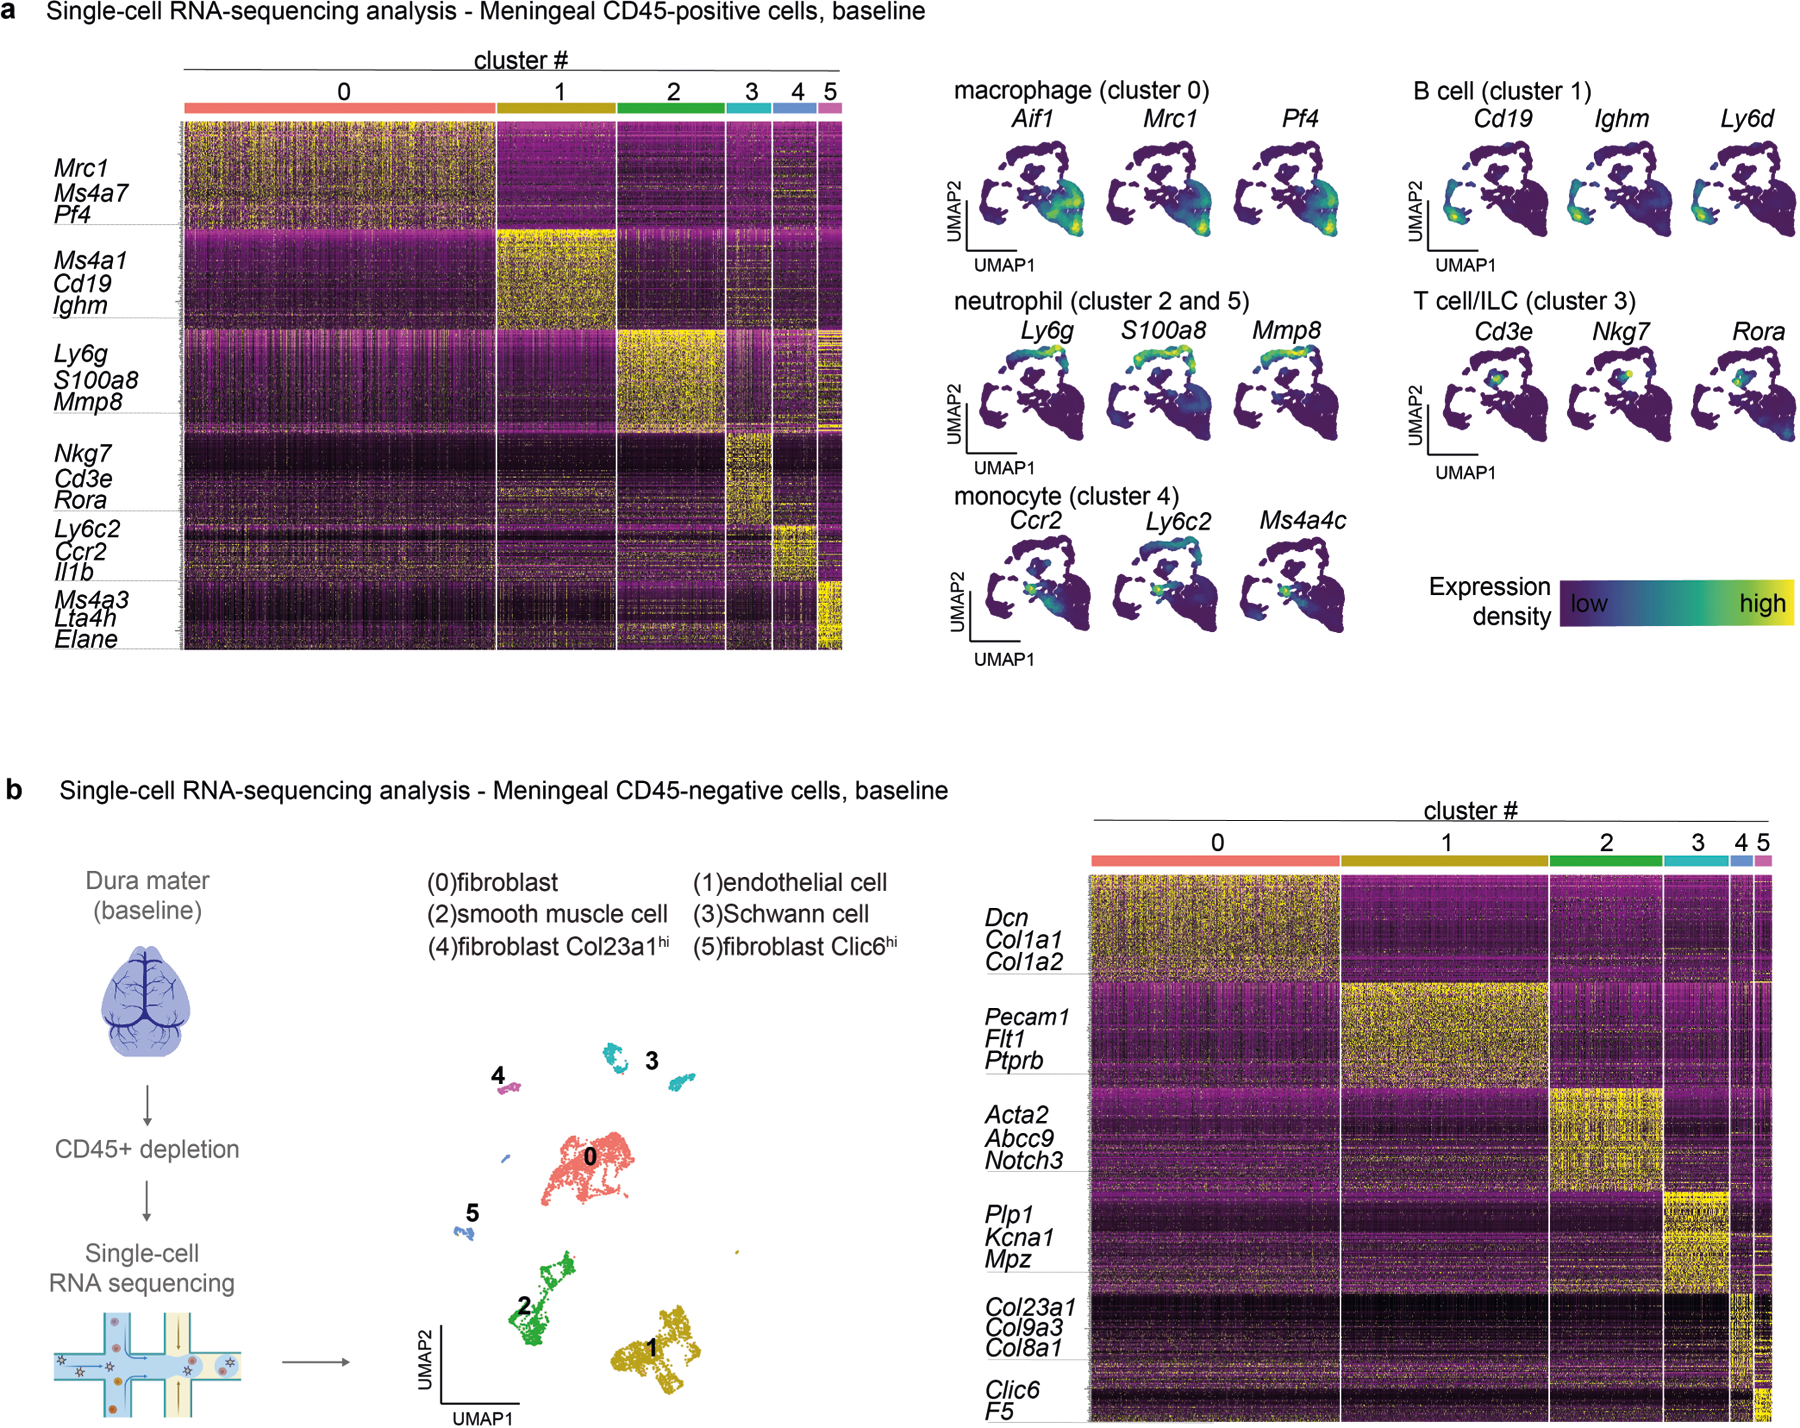
Extended Data Fig. 7 |. Single-cell RNA-sequencing analysis of meningeal cells.

a, Single-cell RNA-sequencing analysis of meningeal immune cells (CD45-positive cells). Left, heatmap showing normalized expression of 100 top cluster marker genes in meningeal immune cells of the meninges, with key marker genes highlighted. Right, UMAP visualization of the expression of key marker genes for each immune cell cluster (n = 10 pooled mouse meninges). b, Left, Illustration created with BioRender.com (https://biorender.com). showing single-cell RNA-sequencing analysis of meningeal nonimmune cells (CD45-negative cells). Center, Uniform Manifold Approximation and Projection (UMAP) visualizations of CD45-negative cell types in the meninges at baseline. Right, heatmap showing normalized expression of 100 top cluster marker genes in nonimmune cells of the meninges, with key marker genes highlighted (n = 10 pooled mouse meninges).
