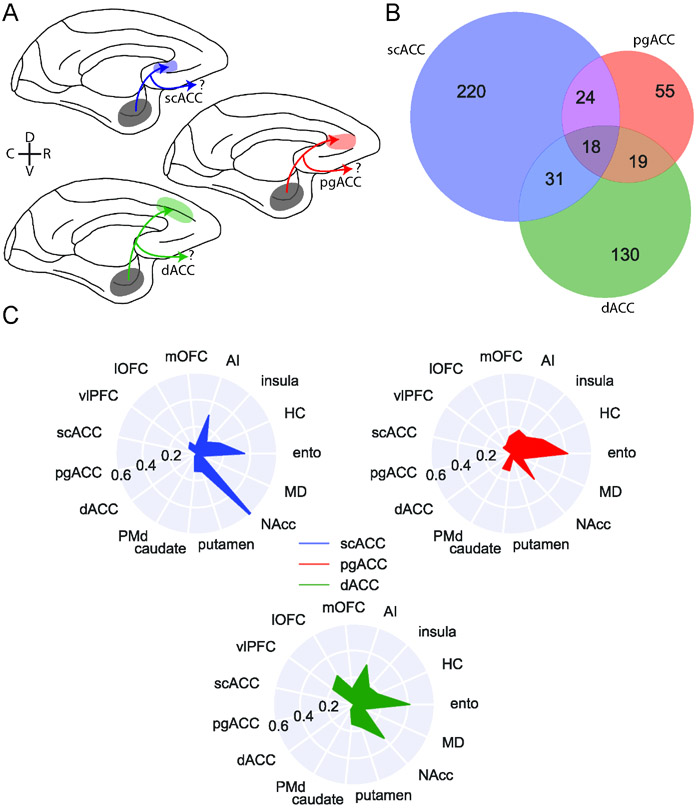
Figure 3: BLA specific projections to medial frontal cortex.
A) Schematic showing the three populations of medial frontal cortex-projecting neurons analyzed here: BLA neurons targeting scACC (blue), pgACC (red), dACC (green). D and V refer to the dorsal and ventral directions, respectively; R and C designate rostral and caudal. B) Venn diagram illustrating projections to each medial frontal cortex area that also branch to the other two; pgACC-projecting neurons are more likely to branch than dACC-projecting neurons (z-test for proportions, z=3.17, p=0.0015), which are more likely to branch than scACC-projecting neurons (z=2.27, p=0.023). C) Likelihood of medial frontal cortex-projecting neurons projecting to non-medial frontal cortex targets. Populations of neurons here are non-overlapping, such that neurons which branch between scACC, pgACC, and dACC are excluded. See also Supplemental Figure 7.

