

Abstract
Purpose:
Cancer is the second leading cause of death in the United States, and the disease burden is elevated in Appalachian Kentucky, due in part to health behaviors and inequities in social determinants of health. This study’s goal was to evaluate Appalachian Kentucky’s cancer burden compared to non-Appalachian Kentucky, and Kentucky compared to the United States (excluding Kentucky).
Methods:
The following data were analyzed: annual all-cause and all-site cancer mortality rates from 1968 to 2018; 5-year all-site and site-specific cancer incidence and mortality rates from 2014 to 2018; aggregated screening and risk factor data from 2016 to 2018 for the United States (excluding Kentucky), Kentucky, non-Appalachian Kentucky, and Appalachian Kentucky; and human papilloma virus vaccination prevalence by sex from 2018 for the United States and Kentucky.
Findings:
Since 1968, the United States has experienced a large decrease in all-cause and cancer mortality, but the reduction in Kentucky has been smaller and slower, driven by even smaller and slower reductions within Appalachian Kentucky. Appalachian Kentucky has higher overall cancer incidence and mortality rates and higher rates for several site-specific cancers compared to non-Appalachian Kentucky. Contributing factors include screening rate disparities and increased rates of obesity and smoking.
Conclusions:
Appalachian Kentucky has experienced persistent cancer disparities, including elevated all-cause and cancer mortality rates for 50+ years, widening the gap between this region and the rest of the country. In addition to addressing social determinants of health, increased efforts aimed at improving health behaviors and increased access to health care resources could help reduce this disparity.
Keywords: Appalachian Kentucky, cancer disparity, cancer incidence, cancer mortality, health behaviors
INTRODUCTION
Despite ongoing health promotion, policy, and research efforts, cancer remains the second leading cause of death in the United States, surpassed only by heart disease.1 In 2022, cancer was estimated to cause 2,670 deaths per day, totaling approximately 609,360 deaths throughout the year.1 Cancer burden varies by state, and the disease is particularly prevalent in Kentucky. Cancer is the second leading cause of death in Kentucky, contributing greatly to all-cause mortality.2 Current national statistics indicate that Kentucky ranks first in the nation for cancer incidence and mortality. The American Cancer Society reports that Kentucky’s cancer burden is elevated for multiple cancer sites compared to the entire United States and individual states.1
The Appalachian region spans 13 states with a proportion of counties (25%) and population (10%) from rural areas.3 While the region has topographical similarities, it is relatively diverse with respect to its cultural and social factors. Compared to the rest of rural America, more Appalachian rural residents live in poverty and have lower education levels.4 Compared to urban areas, rural areas tend to have higher cancer incidence and mortality rates,5 and this proves true in Kentucky. Kentucky has 120 counties, 85 of which are considered rural.6 Appalachian Kentucky comprises 54 counties and is located in the eastern part of the state.3 Of the 54 Appalachian counties in Kentucky, 50 are designated nonmetro (based on Rural-Urban Continuum Codes). Out of the 66 counties located outside of Appalachia, only 35 are designated nonmetro.6 In a study using 2007–2011 data, when compared to residents of urban non-Appalachian Kentucky, residents of the Appalachian Kentucky region were 36% more likely to die from a preventable cancer malignancy.7 Additionally, rural Appalachians have a higher percentage of later-stage diagnoses than their urban counterparts, which contributes to increased mortality rates.7 These disparities are linked to conditions, such as increased tobacco use8 and obesity,9,10 as well as social determinants of health like poverty,10 decreased educational attainment and cancer literacy,11–14 and decreased access to health care resources.15
The objectives of this study were to: (1) examine the trends of all-cause mortality and cancer mortality rates for the United States versus Kentucky and for non-Appalachian Kentucky versus Appalachian Kentucky from 1968 to 2018; and (2) report on current patterns of cancer incidence, mortality, screening rates, and risk factors in these regions for specific cancer sites. The cancer sites addressed in this report include lung and bronchus; colon and rectum; larynx; oral cavity and pharynx (OCP); and cervix uteri. These cancer sites were selected because they have displayed elevated incidence and mortality rates in Kentucky and Appalachian Kentucky in previous time periods and could be responsive to evidence-based prevention and/or screening interventions.16 This study’s contribution to the literature is an updated analysis from a previous study on cancer rates and risk factor disparities in Kentucky.16 The study features recent data and the addition of all-cause and cancer-specific mortality trend comparisons. The insights gained herein can help inform targeted intervention plans to improve cancer health outcomes across the state.
METHODS
Data sources and definitions
The United States, as considered throughout this analysis, is composed of the 50 states plus Washington, D.C. Appalachian designation in all data used was assigned in accordance with 2021 listings from the Appalachian Regional Commission.17 Comparisons in this paper were performed on 2 pairs of nonoverlapping regions: the United States excluding Kentucky (henceforth referred to as the United States) versus Kentucky, and from non-Appalachian Kentucky versus Appalachian Kentucky.
Annual all-cause and all-site cancer mortality rates from 1968 through 2018 were obtained from 3 National Center for Health Statistics files: Compressed Mortality, 1968–1978;18 Compressed Mortality, 1979–1998;19 and Underlying Cause of Death, 1999–2019.20 All data were obtained using Centers for Disease Control and Prevention (CDC) Wonder.
Five-year invasive cancer incidence and cancer mortality rates for 2014–2018 in Kentucky, the most recent data available at the time of analysis, were obtained from the Kentucky Cancer Registry, a population-based central cancer registry for the Commonwealth of Kentucky and member of the National Cancer Institute’s (NCI) Surveillance, Epidemiology, and End Results (SEER) program since 2000. Rates representing a US estimate were obtained from the remaining non-Kentucky SEER 18 registries.21,22 Cases and deaths were aggregated and age-adjusted according to the 2000 US Standard Million Population. Colon and rectum cancer are referred to hereafter as colorectal cancer, cancers of the oral cavity and pharynx as OCP cancer, and lung and bronchus cancer as lung cancer.
Combined behavioral risk factor data were obtained from the CDC’s 2016 and 2018 Behavioral Risk Factor Surveillance System (for US data; BRFSS) surveys and the corresponding 2016 and 2018 Kentucky Behavioral Risk Factor Surveys (for data on and within Kentucky; KyBRFS).23 The BRFSS is an annual representative survey of adults in all states that collects self-reported data about health-related risk behaviors, use of preventive services, and chronic health conditions. The years 2016 and 2018 were used due to colorectal and cervical cancer screening data only being collected on even numbered years in Kentucky and to examine behavioral data concurrent with the cancer incidence and mortality data prior to the COVID-19 pandemic. Lung cancer screening data were not available in these years. Adherence to colorectal cancer screening is calculated based on responses to a number of questions consistent with contemporary US Preventive Services Task Force (USPSTF) recommendations.24 Obesity refers to individuals with a body mass index (BMI) greater than or equal to 30 based on self-reported height and weight. Unhealthy drinking is defined (using survey responses) as an individual who participated in either binge drinking or heavy drinking within the previous 30 days. In addition to BRFSS data, human papilloma virus (HPV) vaccination prevalence estimates for the United States (not excluding Kentucky) and Kentucky in 2018 were obtained from the CDC’s National Immunization Survey–Teen.25 HPV vaccination data are not available by Appalachian residence in Kentucky.
Statistical analysis
Significance of cancer rate comparisons between United States versus Kentucky and non-Appalachian Kentucky versus Appalachian Kentucky were based on a rate ratio test.26 Trends in all-cause and cancer mortality were compared using joinpoint regression analysis in the Joinpoint Regression Program (version 4.9.10) from the NCI.27 Compared to standard linear regression, which fits data with a straight line, joinpoint regression identifies whether multi-segmented lines are a significantly better fit than single or less-segmented lines. Line segments are joined at points called joinpoints. In this study, joinpoint regression calculates the annual percentage change (APC) in all-cause and cancer-specific mortality rates between trend-change points, and it also estimates the average APC (AAPC) in the whole study period.
BRFSS and KyBRFS responses were reweighted according to sample size and analyzed using the survey package (version 4.1–1) in the R software environment (version 4.2.1). Weighted estimates are given along with 95% confidence intervals in the method prescribed by Korn and Graubard.28
RESULTS
Trends in all-cause and cancer mortality
Age-adjusted all-cause mortality rates per 100,000 population for the United States decreased substantially from 1,302.7 in 1968 to 720.9 in 2018. Kentucky also demonstrated decreased mortality rates during this time (1,335.9–920). All-cause mortality rates in non-Appalachian Kentucky exceeded those of Appalachian Kentucky (1,378.3 vs 1,302.6, respectively) in 1968, but this relationship flipped in the mid-1970s, with Appalachian Kentucky experiencing a far smaller decrease to 1,051.8 (vs 870 in non-Appalachian Kentucky) by 2018 (Figure 1). Joinpoint regression on all-cause mortality was restricted to analyzing rates from 1989 to 2018 to assess relative declines over the last 3 decades. Kentucky demonstrated a significantly smaller AAPC than in the United States over this period, and likewise for Appalachian versus non-Appalachian Kentucky. Models with 2 joinpoints were found to be the best fit for both the United States and Kentucky (joinpoints at 2002/2010 and 2002/2007, respectively), with the United States demonstrating a significant decrease in terms of APC across all 3 segments. In contrast, Kentucky only showed a significant decrease during the period from 2002 to 2007. Non-Appalachian Kentucky had joinpoints in 2002 and 2009, with a significant decrease from 1989 to 2009. Appalachian Kentucky had no joinpoints and produced an APC that is not significantly different than zero throughout the period of 1989–2018 (Table 1).
FIGURE 1.
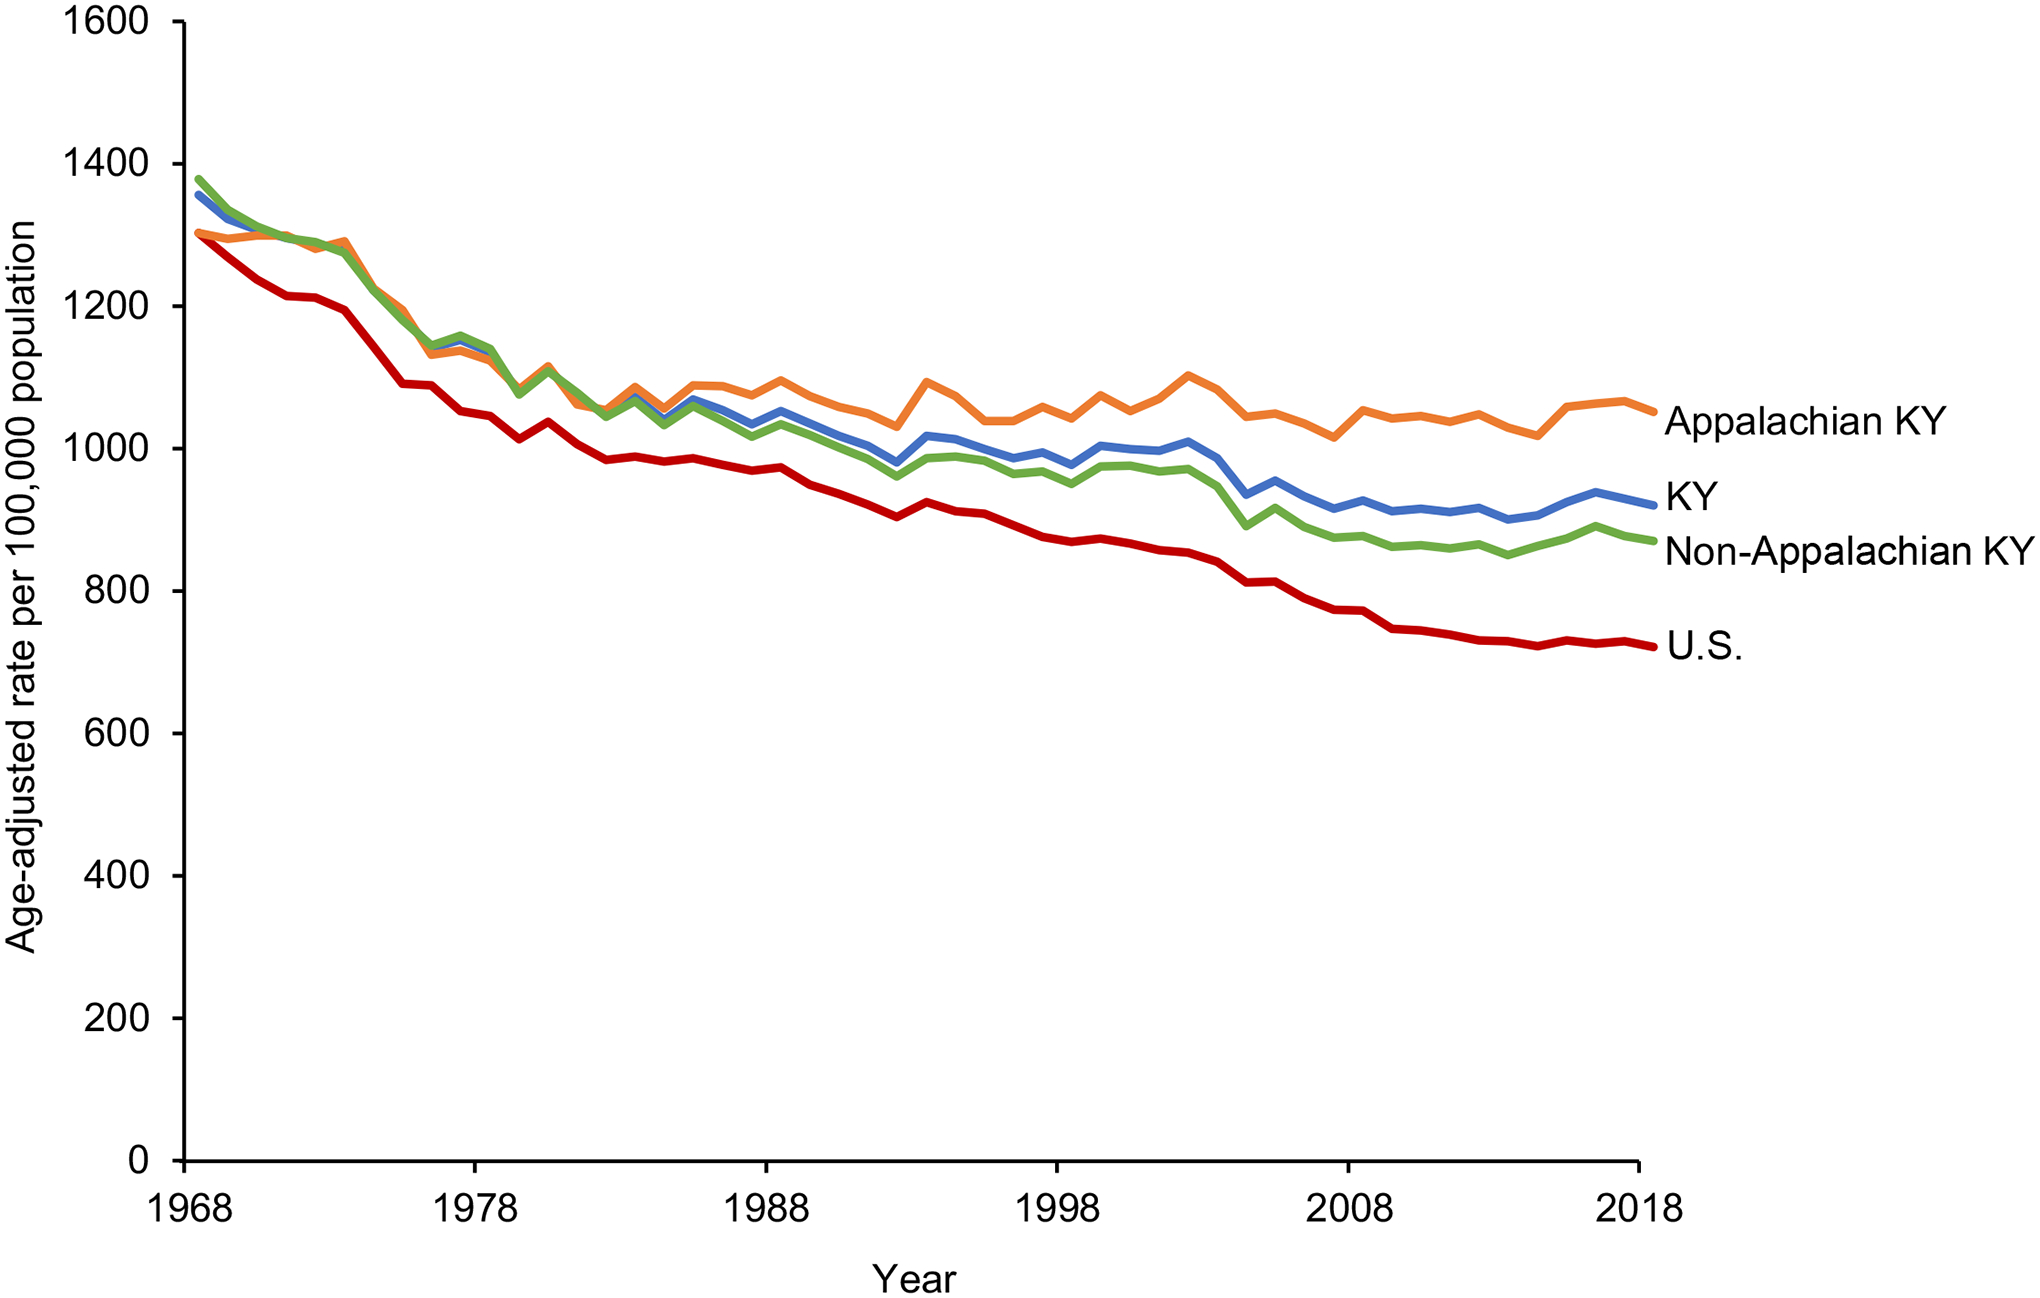
Age-adjusted all-cause mortality rates (deaths per 100,000 people) in the United States (excluding Kentucky), Kentucky, non-Appalachian Kentucky, and Appalachian Kentucky from 1968 to 2018.
TABLE 1.
Joinpoint regression analysis for all-cause mortality rates per 100,000 population in the United States (excluding Kentucky) versus Kentucky and non-Appalachian Kentucky versus Appalachian Kentucky, 1989–2018.
| Average annual percent change (AAPC) | Annual percent change (APC) | AAPC comparison (95% CI) | |||
|---|---|---|---|---|---|
| Period | AAPC (95% CI) | Period | APC (95% CI) | ||
| United States | 1989–2018 | −0.91* (−1.03, −0.79) | 1989–2002 | −0.78* (−0.92, −0.64) | −0.60* (−0.87, −0.32) |
| 2002–2010 | −1.76* (−2.08, −1.44) | ||||
| 2010–2018 | −0.27* (−0.53, −0.02) | ||||
| Kentucky | 1989–2018 | −0.32* (−0.57, −0.07) | 1989–2002 | −0.15 (−0.38, 0.07) | US Reference |
| 2002–2007 | −1.66* (−2.93, −0.38) | ||||
| 2007–2018 | 0.10 (−0.16, 0.37) | ||||
| Non-Appalachian Kentucky | 1989–2018 | −0.44* (−0.65, −0.22) | 1989–2002 | −0.33* (−0.55, −0.10) | −0.38* (−0.61, −0.15) |
| 2002–2009 | −1.59* (−2.28, −0.89) | ||||
| 2009–2018 | 0.30 (−0.06, 0.67) | ||||
| Appalachian Kentucky | 1989–2018 | −0.06 (−0.14, 0.03) | 1989–2018 | −0.06 (−0.14, 0.03) | Non-Appalachian Kentucky Reference |
P < .05.
Age-adjusted cancer-specific mortality per 100,000 increased across all 4 geographic areas of interest from 1968 into the 1990s, followed by a decrease through the end of our analysis in 2018. Cancer mortality rates in Appalachian Kentucky were lower than those in non-Appalachian Kentucky initially (169.3 in 1968), but quickly converged on and surpassed their counterparts by the 1990s (peak of 244.2 in 1994), maintaining higher rates since then (Figure 2). The United States increased from a rate of 199.0 in 1968 to a high of 215.7 in the 1990s before decreasing to 148.7 in 2018. Kentucky demonstrated a slightly larger increase in rates (187.9–238.2) before declining to 181.7 in 2018. Non-Appalachian Kentucky was similar to Kentucky with rates ranging from 195.8 up to 239.6 and then down to 174.1. Joinpoint regression on cancer mortality from 1989 to 2018 showed a significantly smaller decreasing AAPC in Kentucky than in the United States, and in Appalachian than non-Appalachian Kentucky. A closer look at the joinpoint regression results for these 2 regions showed 3 joinpoints in the United States (1993, 2001, and 2015) and 2 in Kentucky (2001 and 2016). The APC showed a significantly decreasing trend in the United States for all periods. Kentucky APCs were significantly decreasing from 1989 to 2016, but smaller than the corresponding figures for the United States. Non-Appalachian Kentucky and Appalachian Kentucky had 1 joinpoint each (in 2002 and 2016, respectively). APC for non-Appalachian Kentucky showed a significant decrease in cancer mortality for all years between 1989 and 2018. The APC in Appalachian Kentucky was significantly less than zero from 1989 to 2016, though the decrease in cancer mortality was smaller than that seen in non-Appalachian Kentucky for the same period. APC in both Kentucky and Appalachian Kentucky showed a considerable decrease in the period from 2016 to 2018, but the confidence intervals on these estimates were too wide to show significance due to the small number of datapoints in these trends (Table 2).
FIGURE 2.
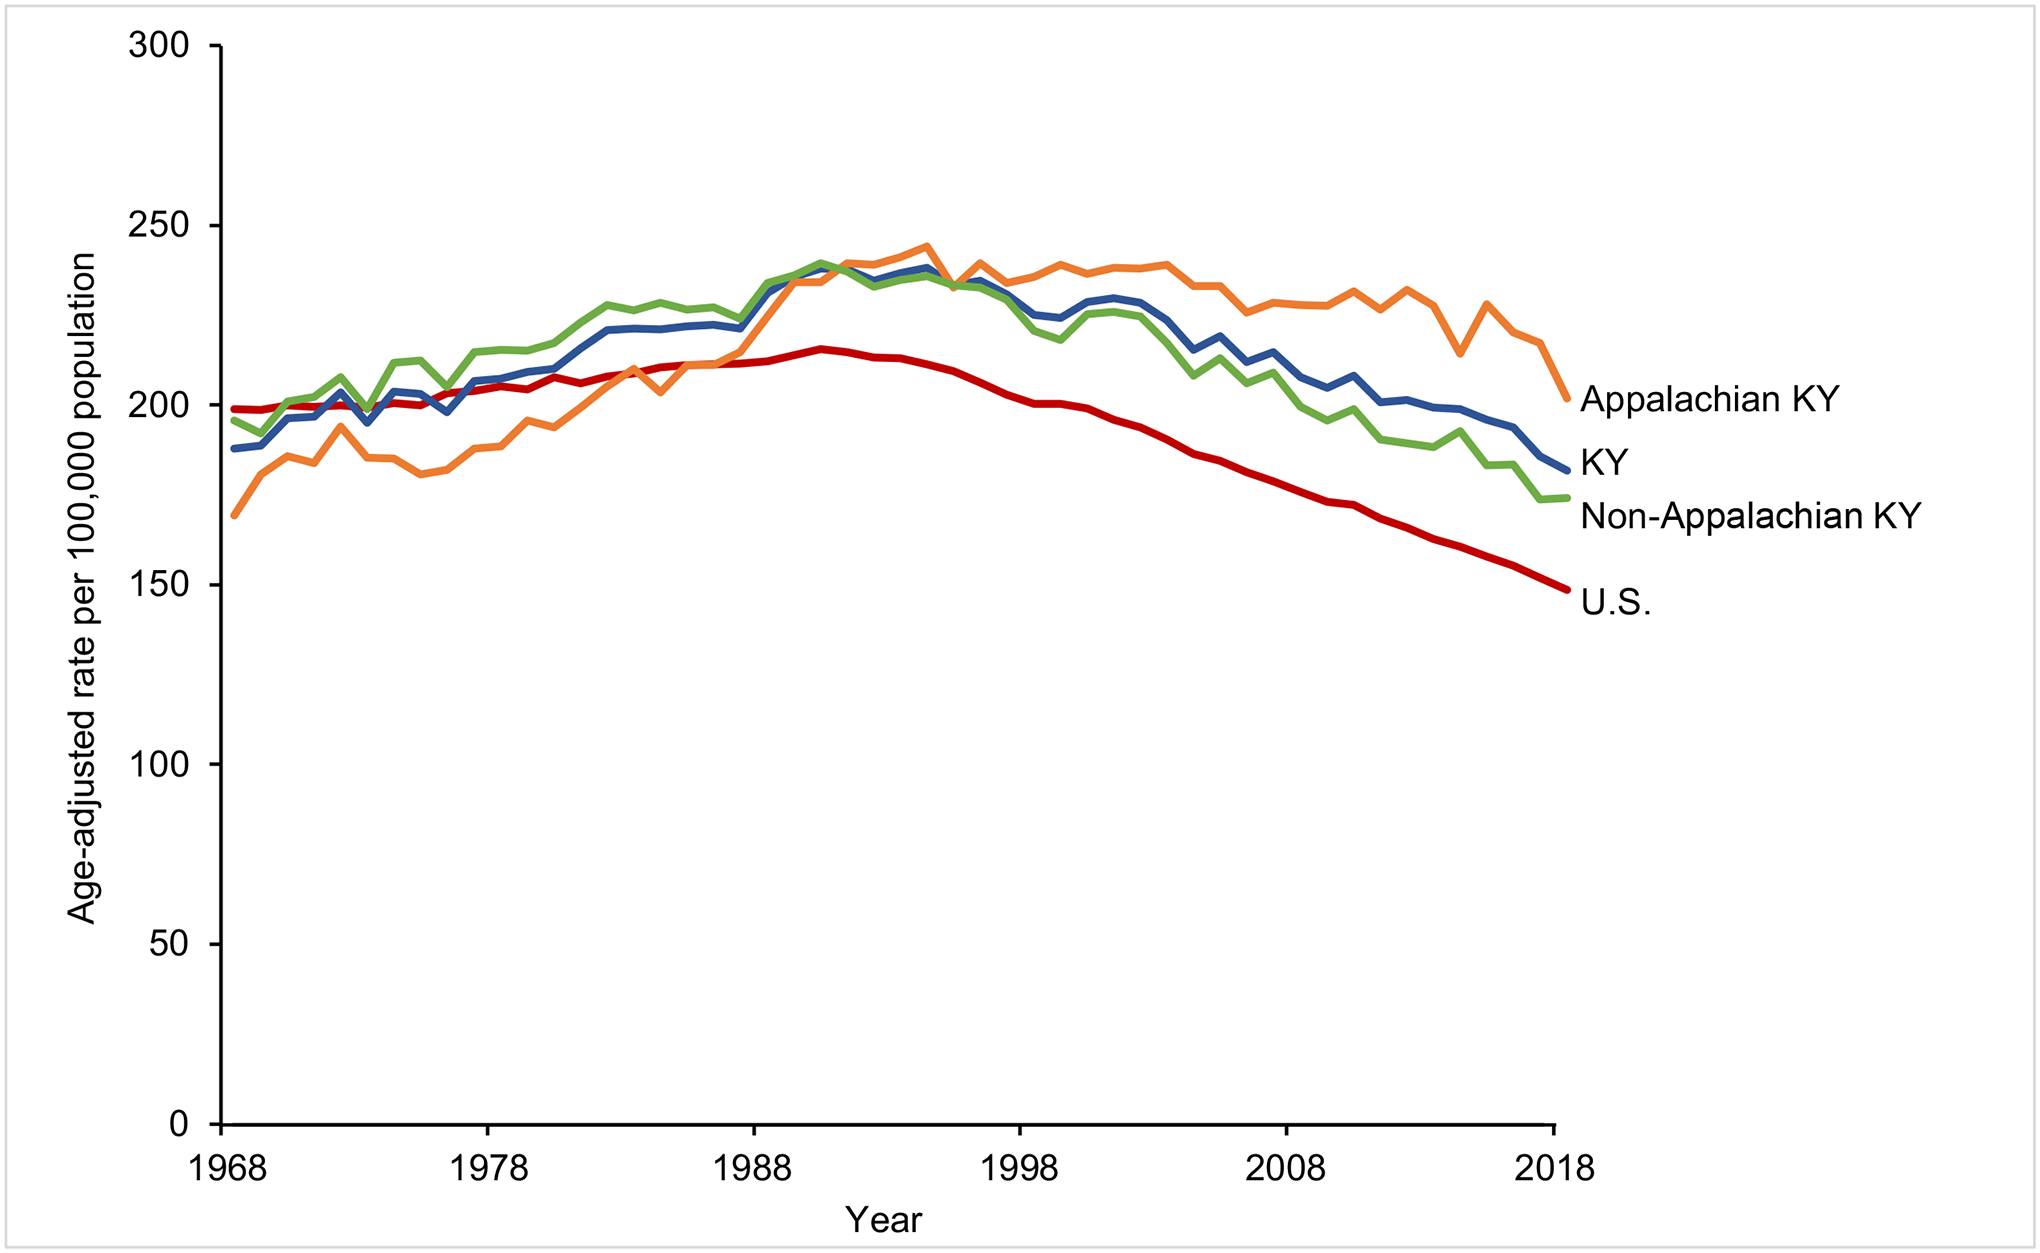
Age-adjusted cancer mortality rates (deaths per 100,000 population) in the United States (excluding Kentucky), Kentucky, non-Appalachian Kentucky, and Appalachian Kentucky from 1968 to 2018.
TABLE 2.
Joinpoint regression analysis for cancer-specific mortality rates per 100,000 population in the United States (excluding Kentucky) versus Kentucky and non-Appalachian Kentucky versus Appalachian Kentucky, 1989–2018.
| Average annual percent change (AAPC) | Annual percent change (APC) | AAPC comparison (95% CI) | |||
|---|---|---|---|---|---|
| Period | AAPC (95% CI) | Period | APC(95%CI) | ||
| United States | 1989–2018 | −1.26* (−1.36, −1.16) | 1989–1993 | −0.22 (−0.65, 0.21) | −0.31* (−0.59, −0.03) |
| 1993–2001 | −1.04* (−1.23, −0.86) | ||||
| 2001–2015 | −1.51* (−1.58, −1.45) | ||||
| 2015–2018 | −2.05* (−2.67, −1.43) | ||||
| Kentucky | 1989–2018 | −0.95* (−1.21, −0.69) | 1989–2001 | −0.43* (−0.66, −0.21) | US Reference |
| 2001–2016 | −1.08* (−1.25, −0.91) | ||||
| 2016–2018 | −3.08 (−6.46, 0.43) | ||||
| Non-Appalachian Kentucky | 1989–2018 | −1.08* (−1.23, −0.93) | 1989–2002 | −0.64* (−0.91, −0.37) | −0.49* (−0.88, −0.10) |
| 2002–2018 | −1.43* (−1.62, −1.24) | ||||
| Appalachian Kentucky | 1989–2018 | −0.59* (−0.95, −0.23) | 1989–2016 | −0.27* (−0.37, −0.17) | Non-Appalachian Kentucky Reference |
| 2016–2018 | −4.83 (−9.82, 0.43) | ||||
P < .05.
Cancer incidence for 2014–2018
Kentucky continued to rank first nationally in cancer incidence from 2014 to 2018, with an elevated all-site incidence of 517.8 cases per 100,000 people, which is 18.1% higher compared to the US average of 438.3 cases. Among the 5 specific sites considered in this study, Kentucky ranked first in the nation for lung, laryngeal and cervical cancers, second for colorectal, and third for OCP. Kentucky also experienced higher cancer incidence than the US average for each cancer site investigated, with differences ranging from 22.8% higher (OCP cancers) to 100.0% higher (laryngeal cancer). Each of these differences was significant (P < .001), except for OCP cancers. Looking closer at Appalachian Kentucky, it had an all-site cancer incidence of 538.6 cases per 100,000, which was 5.6% higher than non-Appalachian Kentucky, and with differences in the site-specific rates investigated between 2.9% higher (OCP cancers) and 43.2% higher (cervical cancer) (Table 3).
TABLE 3.
Age-adjusted invasive cancer incidence rates per 100,000 at-risk population in the United States (excluding Kentucky), Kentucky, Appalachian Kentucky, and non-Appalachian Kentucky, 2014–2018.
| Kentucky rank among states | US rate | Kentucky rate | % Higher (Kentucky vs United States) | Non-Appalachian Kentucky | Appalachian Kentucky | % Higher (Appalachian vs non-Appalachian) | |
|---|---|---|---|---|---|---|---|
| All sites | 1 | 438.3 | 517.8 | 18.1* | 510.0 | 538.6 | 5.6* |
| Lung and bronchus | 1 | 49.3 | 88.8 | 80.1* | 82.4 | 105.3 | 27.8* |
| Colon and rectum | 2 | 37.5 | 48.0 | 28.0* | 45.4 | 54.8 | 20.7* |
| Larynx | 1 | 2.6 | 5.2 | 100.0* | 4.7 | 6.5 | 38.3* |
| Oral cavity and pharynx | 3 | 11.4 | 14.0 | 22.8 | 13.9 | 14.3 | 2.9 |
| Cervix uteri | 1 | 7.4 | 9.8 | 32.4* | 8.8 | 12.6 | 43.2* |
P < .001.
Cancer mortality for 2014–2018
Similar to cancer incidence, Kentucky ranked first in the nation in cancer mortality, with 191.2 cases per 100,000 people, which was 29.6% higher than the US rate. For site-specific rankings, Kentucky was first among US states in lung cancer (83.6% higher than the US average) and among the top 10 of all states on each of the other 4 sites considered. Appalachian Kentucky had a higher all-site cancer mortality of 172.3 cases per 100,000 people (12.0% higher than non-Appalachian Kentucky), with site-specific mortality rate differences among sites considered ranging from 12.0% higher (OCP cancers) to 29.1% higher (lung cancer) (Table 4).
TABLE 4.
Age-adjusted cancer mortality rates per 100,000 at-risk members of the population in the United States (excluding Kentucky), Kentucky, Appalachian Kentucky, and non-Appalachian Kentucky, 2014–2018.
| Kentucky rank | US rate | Kentucky rate | % Higher (Kentucky vs United States) | Non-Appalachian Kentucky | Appalachian Kentucky | % Higher (Appalachian vs Non-Appalachian) | |
|---|---|---|---|---|---|---|---|
| All sites | 1 | 147.5 | 191.2 | 29.6* | 153.8 | 172.3 | 12.0* |
| Lung and bronchus | 1 | 32.9 | 60.4 | 83.6* | 37.5 | 48.4 | 29.1* |
| Colon and rectum | 4 | 13.1 | 16.6 | 26.7* | 13.5 | 15.3 | 13.3* |
| Larynx | 2 | 0.8 | 1.5 | 87.5* | 0.9 | 1.2 | 33.3* |
| Oral cavity and pharynx | 3 | 2.4 | 3.1 | 29.2* | 2.5 | 2.8 | 12.0* |
| Cervix uteri | 10 | 2.1 | 2.6 | 23.8* | 2.2 | 2.5 | 13.6* |
P < .001.
Cancer risk factors and screening rates
As of 2018, Kentucky and Appalachian Kentucky experienced a significantly higher prevalence of obesity than their comparators (United States: 30.1% vs Kentucky: 35.3%; non-Appalachian Kentucky: 33.3% vs Appalachian Kentucky: 40.5%), and a significantly lower percentage of adults who reported unhealthy drinking habits (United States: 18.2% vs Kentucky: 15.8%; non-Appalachian Kentucky: 17.8% vs Appalachian Kentucky: 10.8%). The percentage of adults who currently smoke was significantly higher in Kentucky than the United States, but there was no significant difference based on Appalachian residence (United States: 15.9% vs Kentucky: 24.0%). There was no statistically significant difference between Kentucky and the United States for males and females who are up to date with HPV vaccination (Table 5).
TABLE 5.
Cancer risk factors and screening in the United States (excluding Kentucky), Kentucky, Appalachian Kentucky, and non-Appalachian Kentucky, 2016 and 2018 (aggregated).
| United States | Kentucky | Appalachian Kentucky | Non-Appalachian Kentucky | |||||
|---|---|---|---|---|---|---|---|---|
| % | 95% CI | % | 95% CI | % | 95% CI | % | 95% CI | |
| Risk and protective behaviors | ||||||||
| Adults who are obese (BMI ≥30) | 30.1 | (29.9, 30.4) | 35.3 | (34.2, 36.4) | 40.5 | (38.5, 42.6) | 33.3 | (32.0, 34.5) |
| Adults who currently smoke | 15.9 | (15.7, 16.0) | 24.0 | (22.9, 25.0) | 25.7 | (24.0, 27.5) | 23.3 | (22.0, 24.6) |
| Adults who reported unhealthy drinking habits | 18.2 | (18.1, 18.4) | 15.8 | (14.9, 16.8) | 10.8 | (9.3, 12.4) | 17.8 | (16.7, 18.9) |
| Females aged 13–17 who are UTD on HPV vaccinationa | 53.7 | (51.8, 55.6) | 45.4 | (35.7, 55.4) | n/a | n/a | n/a | n/a |
| Males aged 13–17 who are UTD on HPVvaccinationa | 48.7 | (46.8, 50.6) | 39.9 | (31.1, 49.4) | n/a | n/a | n/a | n/a |
| Cancer screening | ||||||||
| Women aged 21–64 with Pap smear test in last 3 years | 80.0 | (79.6, 80.4) | 80.2 | (78.4, 82.0) | 74.1 | (70.5, 77.5) | 82.5 | (80.3, 84.5) |
| Adults aged 50–75 who met the USPSTF colorectal cancer screening guidelines | 68.5 | (68.2, 68.9) | 69.9 | (68.3, 71.4) | 66.2 | (63.5, 68.8) | 71.4 | (69.5, 73.3) |
Abbreviations: BMI, body mass index; HPV, human papillomavirus; n/a, not available; USPSTF, United States Preventive Services Task Force; UTD, up-to-date.
Kentucky not excluded from US measure.
With regard to cancer screening, significant differences existed between non-Appalachian and Appalachian Kentucky for the percentage of eligible females aged 21–64 who have had a Pap smear in the past 3 years (non-Appalachian Kentucky: 82.5% vs Appalachian Kentucky: 74.1%) and eligible population who met USPSTF colorectal cancer screening recommendations (non-Appalachian Kentucky: 71.4% vs Appalachian Kentucky: 66.2%). No significant difference exists on either screening measure between the United States and Kentucky (Table 5).
DISCUSSION
We examined trends of all-cause mortality and cancer incidence, mortality, and screening rates in Appalachian Kentucky compared to non-Appalachian Kentucky and Kentucky compared to the United States excluding Kentucky. The results demonstrated that while all-cause mortality and cancer mortality have decreased in the United States and Kentucky over the last several decades, Kentucky’s decline has been more modest, driven by slow to stagnant rates in the Appalachian Kentucky region. Compared to other states, Kentucky ranked in the top 3 for cancer incidence and the top 10 for cancer mortality for the 5 cancer types analyzed. Additionally, Appalachian Kentucky experienced higher cancer incidence and mortality than the rest of Kentucky for all cancer types examined. Of particular interest is that compared to the United States, Kentucky, and specifically Appalachian Kentucky, experienced higher rates of cancer risk factors, such as higher obesity and higher smoking rates, as well as lower colorectal and cervical cancer screening rates.
Existing research
The trends demonstrated in this work corroborate previous studies in Appalachia and other rural regions. A 2002 study using CDC health statistics reported that Appalachian Kentucky had the highest overall cancer mortality, lung cancer mortality, and cervical cancer mortality from 1994 to 1998.29 A subsequent 2018 study evaluating the burden of cancer in Appalachian Kentucky from 2010 to 2014 reported that Kentucky ranked first in both cancer incidence and mortality, with Appalachian Kentucky experiencing higher rates for lung, colorectal, laryngeal, oral, and cervical cancers.16 These patterns continued in the more recent data presented here, demonstrating that despite efforts to raise awareness and promote cancer-related interventions, the cancer disparities previously observed in Appalachian Kentucky persist.
As reported, Appalachian Kentucky has a variety of health behavior-related factors that contribute to its slower decline in cancer incidence and mortality, including increased smoking rates. Research shows that Appalachia has experienced a slower decline in smoking rates compared to the rest of the United States,30 and the Appalachian Regional Commission states that motivation to reduce smoking may be hindered by perceived economic detriment to tobacco-producing communities.8 However, promising studies suggest that empowering Appalachian Kentucky youth with knowledge and skills regarding smoking cessation may have an impact on tobacco use in the region.31 Other studies have shown that social and cultural factors may also play a role in increasing cancer rates. Native Appalachian Kentucky high school students identified the following as factors likely to increase cancer incidence and mortality in the region: a culture of tobacco use, low levels of health care access and engagement, gaps in reaching youth with cancer prevention and control information, and mistrust of the health care system in general and non-Appalachian health care providers in particular.32 Studies have shown Appalachian Kentucky citizens to have a higher percentage of negative beliefs regarding cancer, such as an automatic association of cancer diagnosis with death, than other states that contain Appalachian counties.33 This idea (known as cancer fatalism) is hypothesized to have developed as a coping mechanism to limited access to basic needs and health care.34 As a culturally acceptable belief in Appalachia,34 cancer fatalism may contribute to the slow decline observed in Appalachian Kentucky’s cancer incidence and mortality rates. It is important to note that researchers have not quantified exactly how each of these behavioral and social risk factors contributes to Appalachian Kentucky’s cancer burden, but global studies have reported that smoking, alcohol use, and high BMI are 3 factors that cause the greatest number of risk factor-attributable cancer deaths.35
The finding of no statistical difference between Kentucky and the United States in HPV vaccination coverage for 13- to 17-year olds has remained consistent through 2021 according to the CDC, but both continue to lag far behind the Healthy People 2030 goal of 80% coverage among 13- to 15-year olds.36,37 While current HPV vaccination rates are not collected separately for Appalachian Kentucky, others have reported that HPV vaccination rates decrease with rural-ity compared to urban areas.38 It has also been reported that central Appalachia, which contains Appalachian Kentucky, has lower HPV vaccination initiation, completion, and follow-through than the remaining Appalachian regions and non-Appalachian regions.39 The CDC now offers questions about HPV vaccination on the BRFSS as an optional module states may adopt. Using this in the future could help to gauge HPV vaccination coverage in adults in Appalachian Kentucky and other substate regions.
Barriers to cancer care and related interventions
One barrier to lowering cancer incidence and mortality across the country is lack of access to health care facilities. Medicaid expansion under the Affordable Care Act increased health care coverage for all Kentucky residents beginning in January 2014. This expansion has been credited with improved colorectal cancer screening rates in Appalachian Kentucky40 but other deficits in health care access still exist. In Appalachian Kentucky, 51 of the 54 counties are designated as health professional shortage areas.41 Further, a 2015 literature review summarized the findings of 27 relevant studies and reported that increased length of travel to receive treatment was associated with later disease stage at diagnosis, worsened prognosis, and reduced quality of life. Specifically, rural patients experienced decreased overall survival rates compared to those living in urban regions.42 A similar review summarizing 11 studies reported 3 factors—ease of access to transportation, environmental factors (ie, bumpy roads vs smooth highways), and patients’ psychological state—as a complex system of interactions often associated with patient-perceived barriers to treatment.40 Increasing access to well-equipped and well-staffed health care facilities for rural patients, both in Appalachian Kentucky and elsewhere, has the potential to ease treatment regimens and reduce cancer mortality.
An additional barrier to lowering cancer incidence and mortality is a lack of knowledge of cancer risk reduction, which can be improved through educational interventions. Researchers in Kentucky have implemented prior interventions in Appalachia with great success. A community-based approach called Faith Moves Mountains, which was conducted in 4 Appalachian Kentucky counties, utilized faith-based lay health advisors to increase the uptake of cervical cancer screening. Results demonstrate that treatment group participants had twice the odds of reporting a recent Pap test than those in the control group.43 Another mixed-methods study developed a lung cancer screening campaign with community-based focus groups and implemented it in 3 Appalachian Kentucky cities. Participants who received the campaign showed a significant increase in low-dose computed tomography lung cancer screening compliance.44 These studies demonstrate that educational interventions, such as those suggested here for Appalachian Kentucky citizens, could increase cancer risk factor knowledge and positively influence patients’ beliefs regarding preventive cancer screenings.
Limitations
The findings of this analysis should be interpreted in the context of its limitations. First, the study evaluated a subset of cancer outcomes, risk factors, and health behaviors using a descriptive approach. Additional analysis is required to understand the causal relationship between the cancer outcomes and the evaluated risk factors and health behaviors. Second, screening and risk factor data from the CDC’s BRFSS and KyBRFS are self-reported values, which are subject to potential sampling and recall biases. Despite these limitations, this study provides insight into the persistent cancer disparities that exist in Appalachian Kentucky and potential areas of intervention for improving cancer outcomes in the region.
CONCLUSIONS
This study demonstrates that Kentucky, and particularly the Appalachian region of Kentucky, remains the area of the United States with the highest cancer incidence and mortality. While the entire country has experienced a tremendous decline in all-cause mortality and cancer incidence since 1968, Appalachian Kentucky’s burden has barely decreased since 1980. Several risk factors, including increased smoking and obesity, as well as decreased preventive cancer behaviors (eg, screenings and HPV vaccination) contribute to the burden of cancer. These findings suggest that cancer prevention and control efforts in Appalachian Kentucky must not only be continued but should be increased. Since 2015, there has been a greater percentage drop in cancer mortality in Appalachian Kentucky than in previous years, possibly due to ongoing targeted cancer prevention and control strategies. Factors that have the potential to continue reducing cancer incidence and mortality include longitudinal, preventive educational efforts and increased access to well-equipped, properly staffed health care facilities. By continuing and improving cancer prevention and control programs that reach a wider audience, including youth, Appalachian Kentucky’s cancer burden could eventually be reduced to the level of or even below that seen elsewhere in the United States.
ACKNOWLEDGMENTS
The authors thank the Markey Cancer Center’s Biostatistics and Bioinformatics Shared Resource Facility for statistical support and the Markey Cancer Center’s Research Communications Office for editorial assistance in the preparation of this manuscript. This study was supported by the University of Kentucky’s Appalachian Career Training in Oncology (ACTION) Program [NCI R25CA221765] and the Markey Cancer Center’s Cancer Center Support Grant [NCI P30CA17755].
Funding information
University of Kentucky’s Appalachian Career Training in Oncology (ACTION) Program, Grant/Award Number: NCI R25CA221765; Markey Cancer Center’s Cancer Center Support Grant, Grant/Award Number: NCI P30CA17755
Footnotes
CONFLICT OF INTEREST STATEMENT
The authors declare no conflict of interest.
DISCLOSURES
The authors have no financial disclosures to report.
REFERENCES
- 1.American Cancer Society. Cancer Facts & Figures, 2022. Atlanta, GA: American Cancer Society; 2022. [Google Scholar]
- 2.Centers for Disease Control and Prevention. Stats of the State of Kentucky. Accessed January 11, 2023. Available at: https://www.cdc.gov/nchs/pressroom/states/kentucky/kentucky.htm. 2023.
- 3.Appalachian Regional Commission. About the Appalachian Region. Appalachian Regional Commission. Accessed January 11, 2023. Available at: https://www.arc.gov/about-the-appalachian-region/ [Google Scholar]
- 4.Appalachian Regional Commission. Rural Appalachia Compared to the Rest of Rural America. Accessed January 11, 2023. Available at: https://www.arc.gov/rural-appalachia/. 2023.
- 5.National Cancer Institute: GIS Portal for Cancer Research. Rural-Urban Disparities in Cancer. 2022.
- 6.US Department of Agriculture. Rural-Urban Continuum Codes. Available at: Accessed April 30, 2022. https://www.ers.usda.gov/data-products/rural-urban-continuum-codes/
- 7.Yao N, Alcalá HE, Anderson R, Balkrishnan R. Cancer disparities in rural Appalachia: incidence, early detection, and survivorship. J Rural Health. 2017;33(4):375–381. [DOI] [PubMed] [Google Scholar]
- 8.Beatty K, Hale N, Meit M, et al. Health Disparities Related to Smoking in Appalachia: Practical Strategies and Recommendations for Communities. East Tennessee State University and NORC at the University of Chicago Appalachian Regional Commission; 2019. [Google Scholar]
- 9.Charlton M, Schlichting J, Chioreso C, Ward M, Vikas P. Challenges of rural cancer care in the United States. Oncology (Williston Park). 2015;29(9):633–640. [PubMed] [Google Scholar]
- 10.Marshall JL, Thomas L, Lane NM, et al. Health Disparities in Appalachia. Appalachian Regional Commission; 2017. [Google Scholar]
- 11.Hahn RA, Truman BI. Education improves public health and promotes health equity. Int J Health Serv. 2015;45(4):657–678. [DOI] [PMC free article] [PubMed] [Google Scholar]
- 12.Holden CE, Wheelwright S, Harle A, Wagland R. The role of health literacy in cancer care: a mixed studies systematic review. PLoS One. 2021;16(11):e0259815. [DOI] [PMC free article] [PubMed] [Google Scholar]
- 13.Markey Cancer Center. Kentucky Cancer Needs Assessment. Lexington, KY: University of Kentucky; 2021. [Google Scholar]
- 14.Robertson NM, Burus T, Hudson L, et al. The association between colorectal and lung cancer and educational attainment and literacy in Appalachian Kentucky. Cancer Causes Control. 2022. IN REVIEW. [Google Scholar]
- 15.Crosby RA, Wendel M, Vanderpool RC, Casey BR. Rural Populations and Health. Jossey-Bass; 2012. [Google Scholar]
- 16.Rodriguez SD, Vanderford NL, Huang B, Vanderpool RC. A social-ecological review of cancer disparities in Kentucky. South Med J. 2018;111:213–219. [DOI] [PMC free article] [PubMed] [Google Scholar]
- 17.Appalachian Regional Commission. Appalachian Counties Served by ARC. Accessed January 11, 2023. Available at: https://www.arc.gov/appalachian-counties-served-by-arc/
- 18.Centers for Disease Control and Prevention. Mortality: Compressed Mortality File, 1968–1978. National Center for Health Statistics, National Vital Statistics System. 2A. Accessed January 5, 2023. Available at: https://wonder.cdc.gov/mortSQL.html [Google Scholar]
- 19.Centers for Disease Control and Prevention. Mortality: Compressed Mortality File, 1979–1998. National Center for Health Statistics, National Vital Statistics System. 2E. Accessed January 5, 2023. Available at: https://wonder.cdc.gov/mortSQL.html [Google Scholar]
- 20.Centers for Disease Control and Prevention. Mortality, 1999–2019. National Center for Health Statistics. National Vital Statistics System. Accessed January 5, 2023. Available at: https://wonder.cdc.gov [PubMed] [Google Scholar]
- 21.Surveillance Epidemiology and End Results (SEER) Program (www.seer.cancer.gov) SEER*Stat Database: Incidence – SEER Research Plus Data, 18 Registries, Nov 2020 Sub (2000–2018) – Linked to County Attributes – Total U.S., 1969–2019 Counties. National Cancer Institute, DCCPS, Surveillance Research Program, released April 2021, based on the November 2020 submission. [Google Scholar]
- 22.Surveillance, Epidemiology, and End Results (SEER) Program (www.seer.cancer.gov) SEER*Stat Database: Mortality – All COD, Aggregated With County, Total U.S. (1990–2018) <Katrina/Rita Population Adjustment> – Linked To County Attributes – Total U.S., 1969–2018 Counties. National Cancer Institute, DCCPS, Surveillance Research Program, released May 2020. Underlying mortality data provided by NCHS (www.cdc.gov/nchs) [Google Scholar]
- 23.Centers for Disease Control and Prevention. Behavioral Risk Factor Surveillance System Survey Data. Accessed September 28, 2021. Available at: https://www.cdc.gov/brfss/index.html
- 24.US Preventative Services Task Force. Colorectal Cancer: Screening. Available at: Accessed December 29, 2022. https://www.uspreventiveservicestaskforce.org/uspstf/recommendation/colorectal-cancer-screening-june-2016
- 25.National Center for Immunization and Respiratory Diseases. The 2018 National Immunization Survey - Teen. Centers for Disease Control and Prevention; 2019. [Google Scholar]
- 26.Fay MP, Tiwari RC, Feuer EJ, Zou Z. Estimating average annual percent change for disease rates without assuming constant change. Biometrics. 2006;62(3):847–854. [DOI] [PubMed] [Google Scholar]
- 27.National Cancer Institute. Joinpoint Regression Program. Statistical Methodology and Applications Branch, Surveillance Research Program. National Cancer Institute; 2022. [Google Scholar]
- 28.Korn EL, Graubard BI. Confidence intervals for proportions with small expected number of positive counts estimated from survey data. Surv Methodol. 1998;24(2):193–201. [Google Scholar]
- 29.Huang B, Wyatt SW, Tucker TC, Bottorff D. Cancer death rates—Appalachia, 1994–1998. Morb Mortal Wkly Rep. 2002;51(24):527–529. [PubMed] [Google Scholar]
- 30.Cardarelli K, Westneat S, Dunfee M, et al. Persistent disparities in smoking among rural Appalachians: evidence from the Mountain Air Project. BMC Public Health. 2021;21:270. [DOI] [PMC free article] [PubMed] [Google Scholar]
- 31.Ickes MJ, Sampson S, Parsons J, et al. Tobacco-free ambassador partnership: empowering youth advocates in Appalachian communities. Health Promot Pract. 2020;21:98–109. [DOI] [PubMed] [Google Scholar]
- 32.Collett LK, Hudson L, Prichard C, Vanderford NL. Using culturally focused storytelling to empower Appalachian Kentucky youth to understand and address cancer disparities in their communities. J Cancer Educ. 2023;38(2):513–521. [DOI] [PMC free article] [PubMed] [Google Scholar]
- 33.Vanderpool RC, Huang B, Deng Y, et al. Cancer-related beliefs and perceptions in Appalachia: findings from 3 states. J Rural Health. 2019;35:176–188. [DOI] [PMC free article] [PubMed] [Google Scholar]
- 34.Drew EM, Schoenberg NE. Deconstructing fatalism: ethnographic perspectives on women’s decision making about cancer prevention and treatment. Med Anthropol Q. 2011;25(2):164–182. [DOI] [PMC free article] [PubMed] [Google Scholar]
- 35.GBD 2019 Cancer Risk Factors Collaborators. The global burden of cancer attributable to risk factors, 2010–19: a systematic analysis for the Global Burden of Disease Study 2019. Lancet. 2022;400(10352):563–591. [DOI] [PMC free article] [PubMed] [Google Scholar]
- 36.US Department of Health and Human Services Office of Disease Prevention and Health Promotion (OASH). Increase the Proportion of Adolescents Who Get Recommended Doses of the HPV Vaccine—IID-08. Healthy People 2030. Available at: Accessed December 29, 2022.https://health.gov/healthypeople/objectives-and-data/browse-objectives/vaccination/increase-proportion-adolescents-who-get-recommended-doses-hpv-vaccine-iid-08 [Google Scholar]
- 37.Centers for Disease Control and Prevention. Vaccination Coverage among Adolescents (13–17 Years). TeamVaxView. Accessed January 4, 2023. Available at: https://www.cdc.gov/vaccines/imz-managers/coverage/teenvaxview/data-reports/index.html
- 38.Swiecki-Sikora AL, Henry KA, Kepka D. HPV vaccination coverage among US teens across the rural-urban continuum. J Rural Health. 2019;35(4):506–517. [DOI] [PMC free article] [PubMed] [Google Scholar]
- 39.Reiter PL, Katz ML, Paskett ED. HPV vaccination among adolescent females from Appalachia: implications for cervical cancer disparities. Cancer Epidemiol Biomarkers Prev. 2012;21:2220–2230. [DOI] [PMC free article] [PubMed] [Google Scholar]
- 40.Payne S, Jarrett N, Jeffs D. The impact of travel on cancer patients’ experiences of treatment: a literature review. Eur J Cancer Care. 2000;9(4):197–203. [DOI] [PubMed] [Google Scholar]
- 41.Health Resources & Service Administration. HPSA Find. Accessed March 1, 2023. Available at: https://data.hrsa.gov/tools/shortage-area
- 42.Ambroggi M, Biasini C, Del Giovane C, Fornari F, Cavanna L. Distance as a barrier to cancer diagnosis and treatment: review of the literature. Oncologist. 2015;20(12):1378–1385. [DOI] [PMC free article] [PubMed] [Google Scholar]
- 43.Studts CR, Tarasenko YN, Schoenberg NE, et al. A community-based randomized trial of a faith-placed intervention to reduce cervical cancer burden in Appalachia. Prev Med. 2012;54(6):408–414. [DOI] [PMC free article] [PubMed] [Google Scholar]
- 44.Cardarelli R, Reese D, Roper KL, et al. Terminate lung cancer (TLC) study—a mixed-methods population approach to increase lung cancer screening awareness and low-dose computed tomography in Eastern Kentucky. Cancer Epidemiol. 2017;46:1–8. [DOI] [PMC free article] [PubMed] [Google Scholar]